
Spatial Variation in Particulate Emission Resulting from Animal Farming in Poland


1
Institute of Economics and Finance, Warsaw University of Life Sciences, 166 Nowoursynowska St., 02-787 Warsaw, Poland
2
Institute of Wood Sciences and Furniture, Warsaw University of Life Sciences, 166 Nowoursynowska St., 02-787 Warsaw, Poland
*
Author to whom correspondence should be addressed.
Agriculture 2021, 11(2), 168; https://0-doi-org.brum.beds.ac.uk/10.3390/agriculture11020168
Submission received: 27 December 2020
/
Revised: 8 February 2021
/
Accepted: 12 February 2021
/
Published: 19 February 2021
(This article belongs to the Section Agricultural Systems and Management)
Abstract
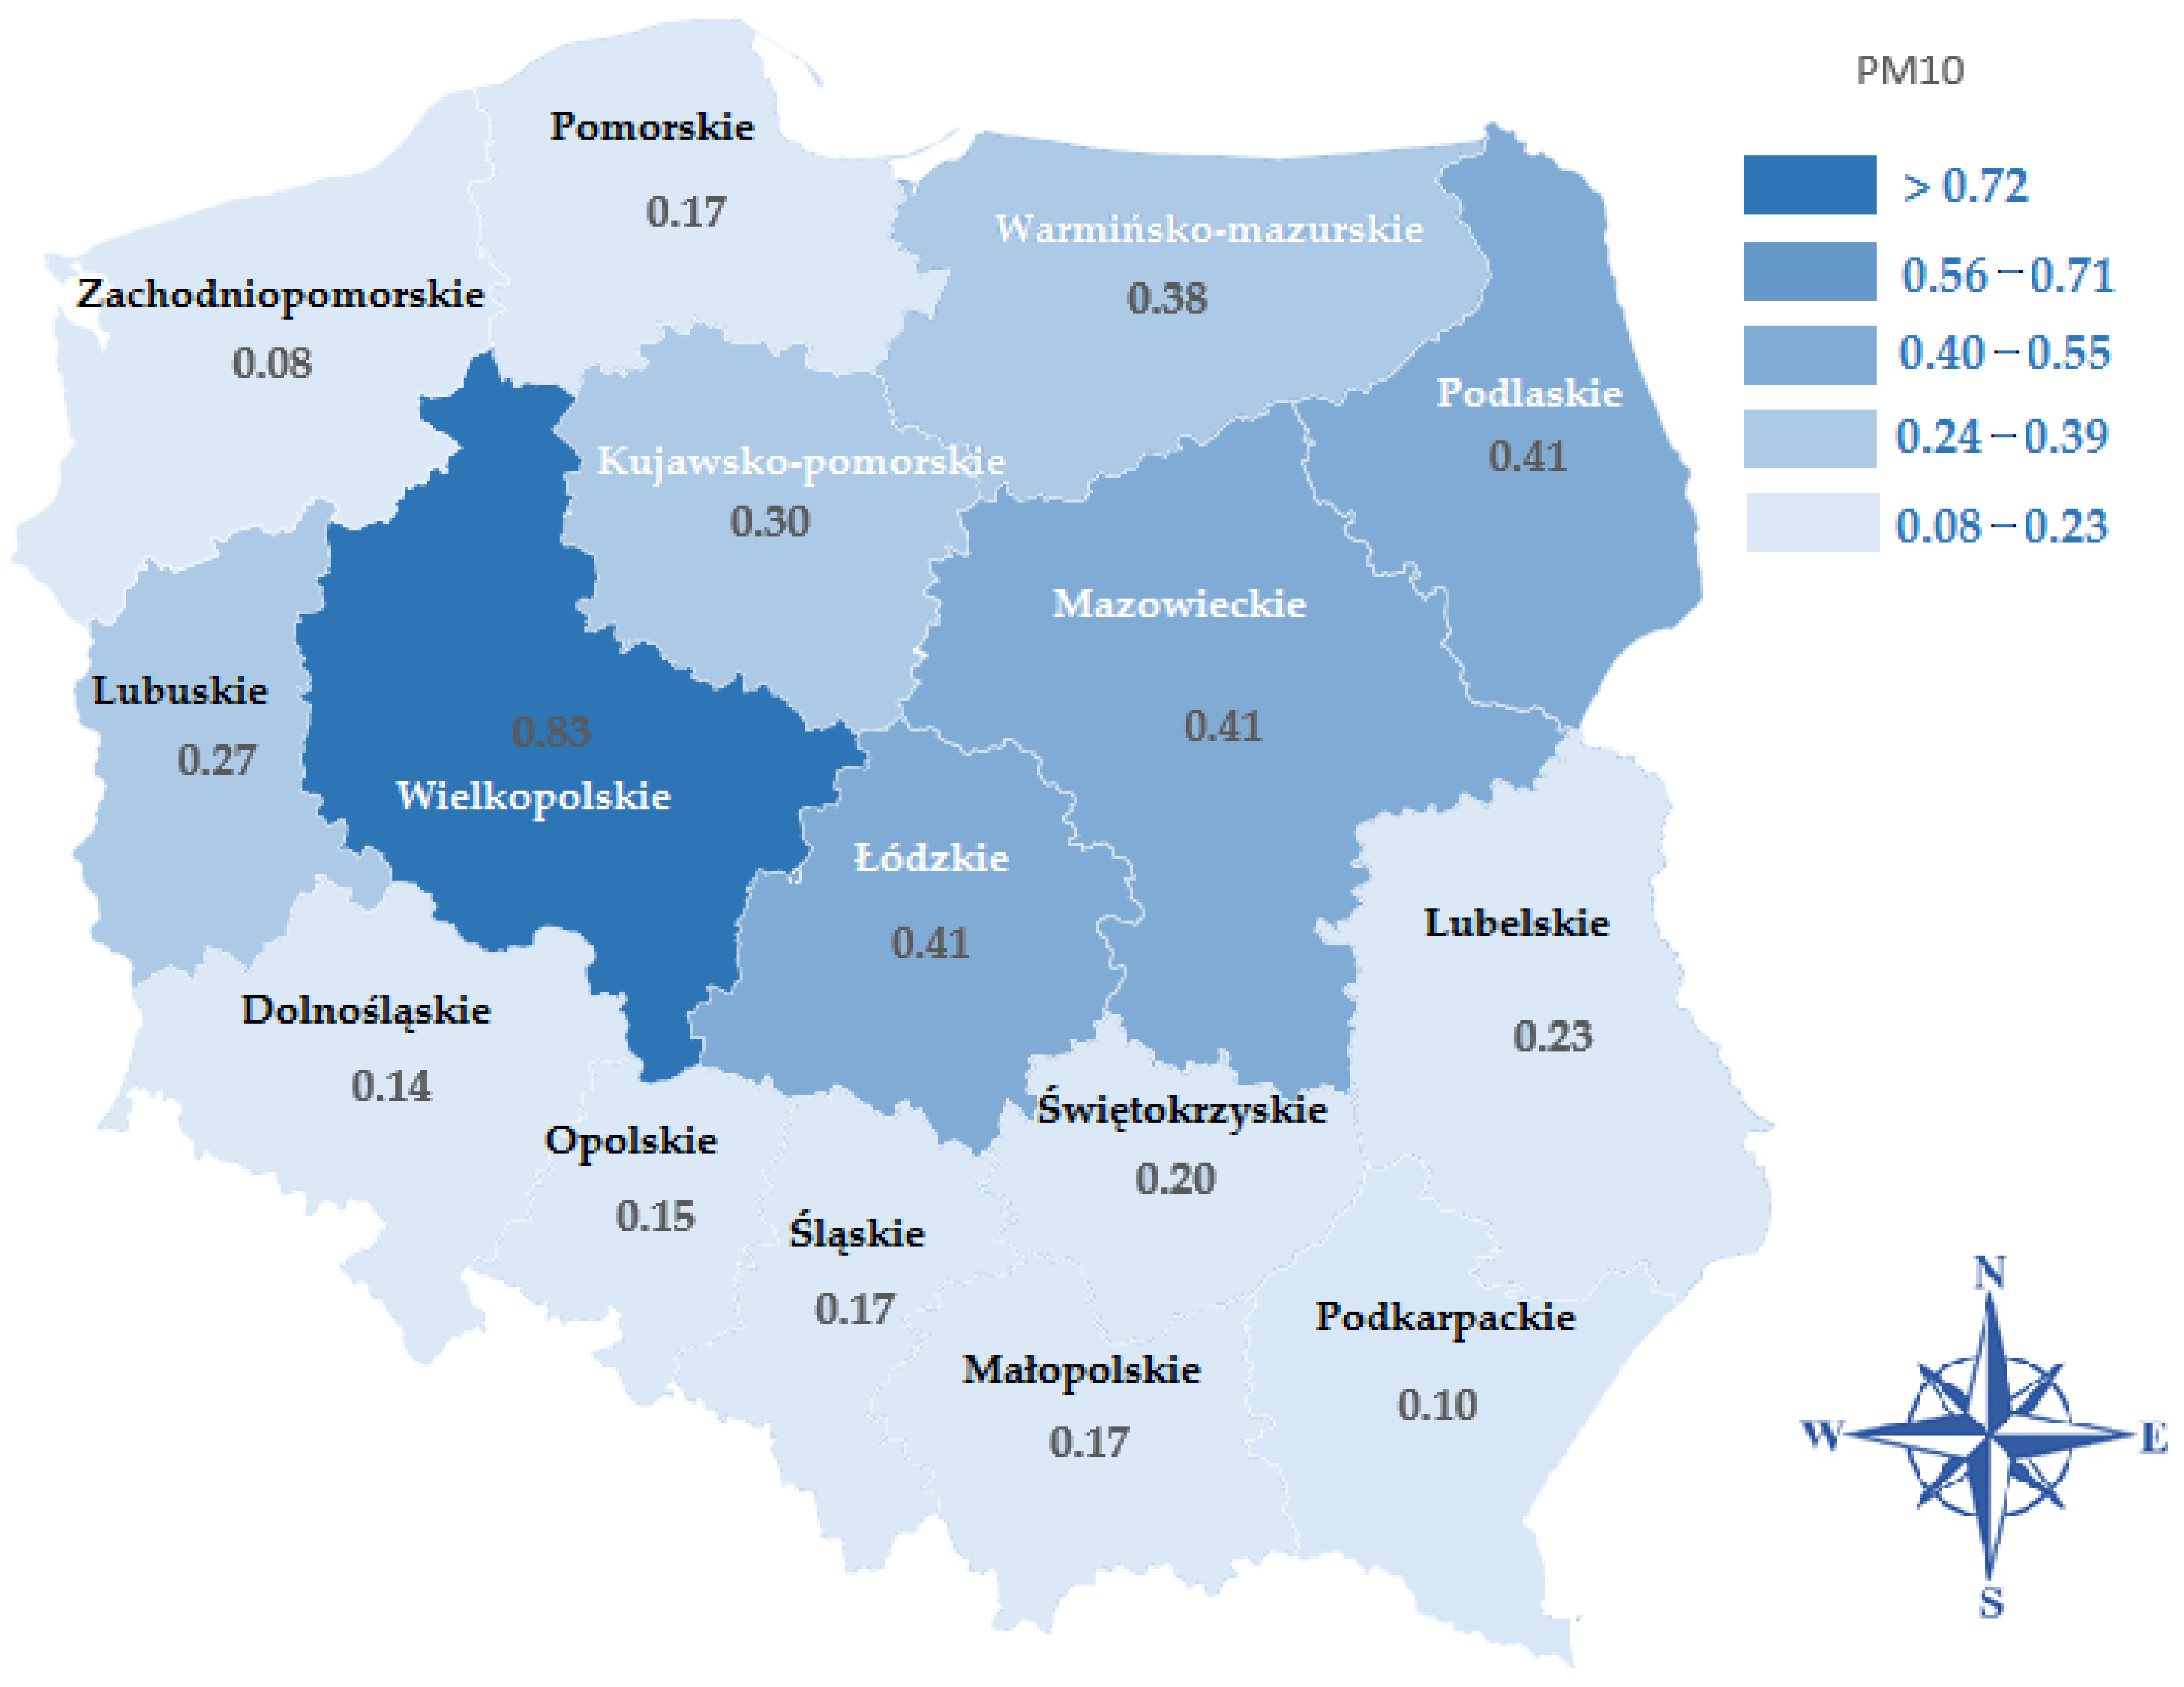
:The article presents a spatial variation in particulate emission from animal farming in Poland. In addition, this paper estimates the PM2.5 and PM10 particulate emissions. The data on respective emissions sources have been acquired from the Central Statistics Authority (GUS) of 2019 (Local Data Bank). The emissions of PM2.5 and PM10 particulates were estimated from the structure of the emissions sources covered in the “EEA/EMEP Emission Inventory Guidebook” following the Tier 1 method. The research shows that, in Poland, the biggest share in particulate emission is found for poultry and cattle farming, which are the emissions of 5.5 and 3 m kg of particulates annually all across Poland, respectively. The highest pollution with PM2.5 resulting from animal farming was recorded for the Podlaskie (0.19 kg/ha), Wielkopolskie (0.16 kg/ha), and Mazowieckie (0.14 kg/ha) provinces, whereas the highest pollution with PM10 was recorded for the Wielkopolskie province (0.83 kg/ha). The key sources of particulate emission indicated in the study facilitate adapting the adequate method to reduce the particulate emissions in respective provinces. It is essential, especially due to the negative effect of particulates on human health.
1. Introduction
Particulates are little particles of matter suspended in the air [1], produced, e.g., in the industry and agriculture, during agricultural operations and processes. A high content of fine particulates in the air affects the health of living organisms, including people [2]. They contribute to various kinds of threats to the respiratory and cardiovascular system [3]. In the applicable literature, particle pollution is referred to as “unwanted physical, chemical or biological change in the properties of the air, soil, and water” or as “the presence of solids, liquids or gases in the air in the proportions harmful to the people, animals, plants and the property, as well as when disturbing one enjoying life and private property in an onerous manner” [2].
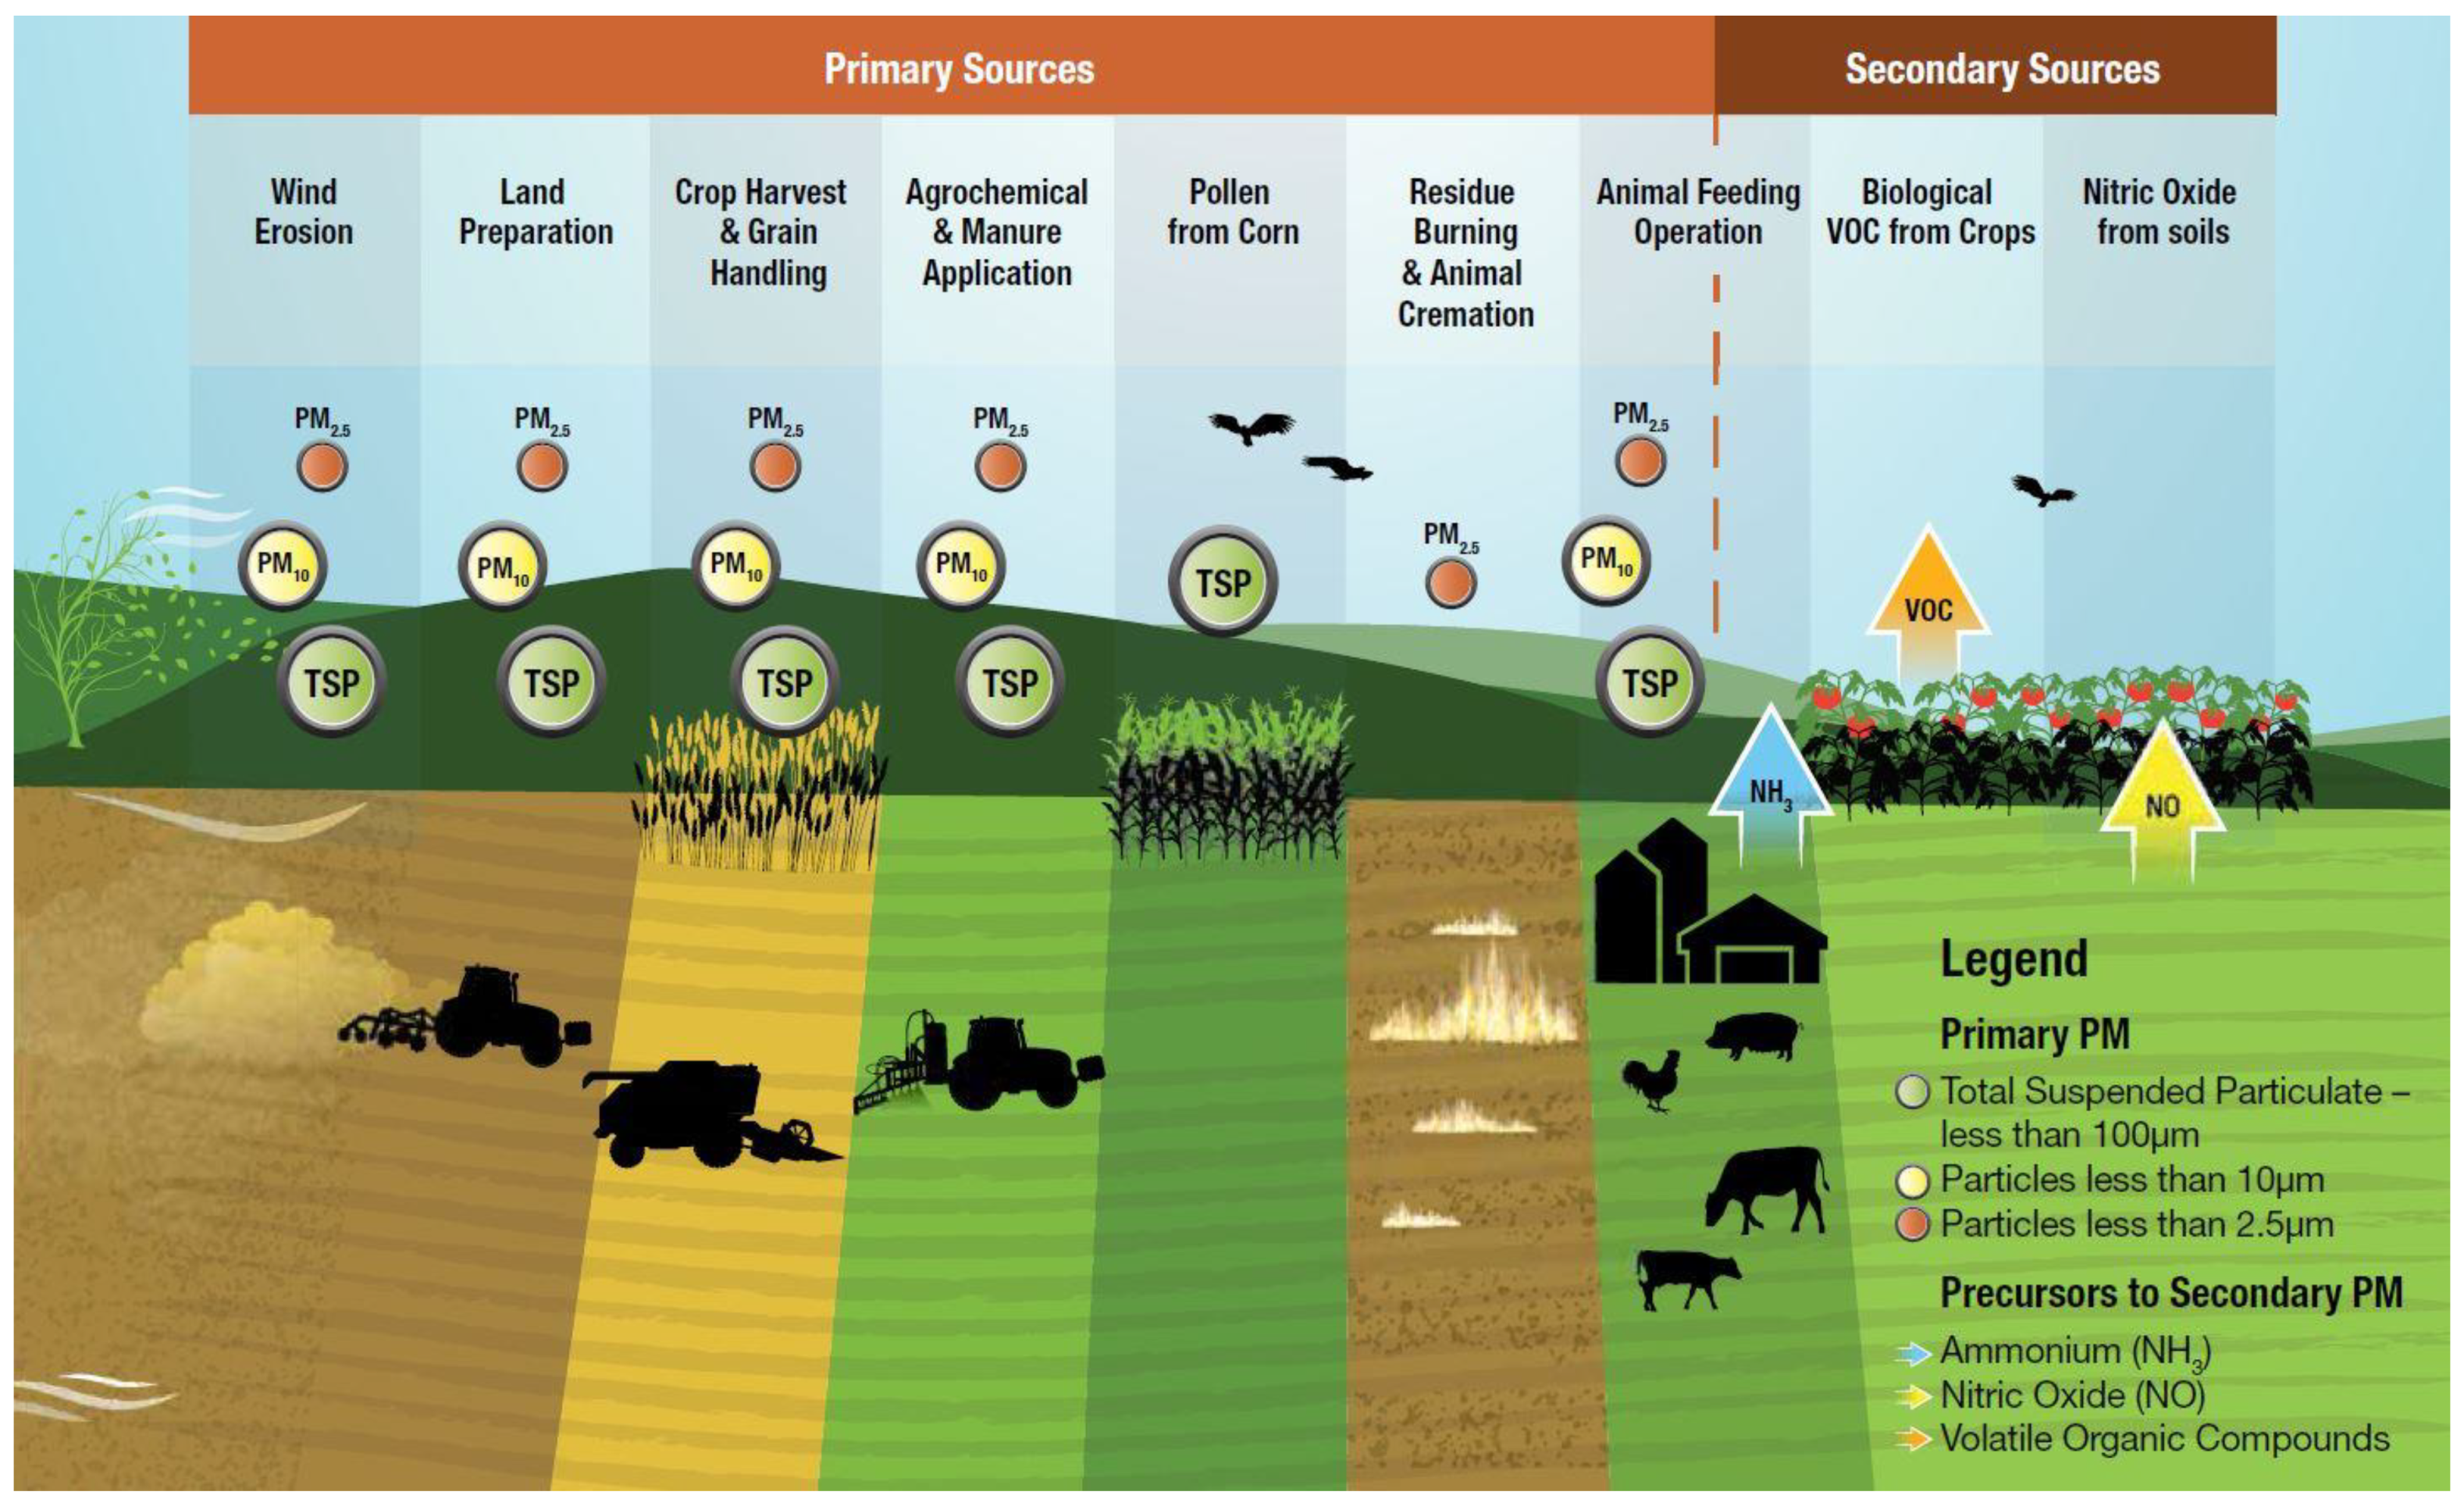
Particulate matter (PM) can be of primary or secondary origin and the process of its formation comes from natural causes (plants shedding pollen, aerosol, and soil erosion) or the impact of human activity (smut, fly ash, and cement dust) [4]. Particulate emission from agricultural production and agricultural soils occurs mostly as a result of field works (tillage or harvest of agricultural crops), fertilization, pollen shedding by the crops grown, and crop transport [5]. As for animal production, particulate emission is mostly produced when cleaning and ventilating the farm spaces, as well as removing manure and other post-production waste. The key source of air pollution in farm buildings or in the open space is animal production and the work performed in the field [6]. The size of pollution depends on the climate, season, geographic location [7], as well as on moisture, etc., especially the level of the region’s industrialization. Due to the aerodynamic diameter (the size of the particulate), particulates can be divided into (total suspended particles (TSP), all the particulates with an aerodynamic diameter even higher than 10 μm), PM10 (particulates with the aerodynamic diameter of grains smaller than 10 μm), and PM2.5 (particulates with the aerodynamic diameter of grains smaller than 2.5 μm). The actions and factors generating all the three sizes of particulates in agriculture are presented in Figure 1.
According to some researchers, emissions of suspended particulate matter in the agricultural sector come from two main sources [9]. One of the examples can be the actions related to animal nutrition and keeping (e.g., hay crushing, supplying animal feed, or cleaning), considering the use of agricultural vehicles and equipment. In that case, the particulate emissions increase depending on the size and distribution of big agricultural farms (CAFO), as well as their location (dry or semidry climate). The second source of particulate emission is burning the agricultural waste or burning the fields off [10].
In this paper, the primary objective has been to present a spatial variation in the emission of particulates from animal farming, and therefore, the analysis of PM2.5 and PM10 emissions from livestock production by types of farm animals in Poland. With the data acquired, the emissions were calculated for respective categories of farm animals and provinces. Performing the research will facilitate determining the key sources of emissions of PM2.5 and PM10 of animal origin. The results can be useful for the selection of methods for reducing the emissions of particulates in respective regions and for spatial animal production planning, especially to alleviate the negative impact of particulate emission on humans. Further, the paper presents a literature review, the research material, and methods. The next chapter provides the calculations of PM2.5 and PM10 particulate emissions in Poland and a discussion is performed on limiting the PM emission in agriculture. The article ends with conclusions and a presentation of further research prospects.
1.1. Particle Pollution
Particle pollution is one of the most unfavorable forms of air pollution [11]. The term particulates should be understood as a collection of solid particles that have been thrown into the atmosphere and remain in it for a certain period of time [12]. The source of particulate formation is common and comes from both the industry and agriculture [13]. The air quality control applies the following classification of suspended particulate matter with a diameter of ≤2.5 µm (PM2.5) and ≤10 µm (PM10) [14]. Small-sized particles float in the air. PM is generated, in fact, during the performance of each of the activities, which include fieldwork, soil cultivation, mineral fertilization, hay harvesting, as well as handling animals (feeding fodder, drying, reloading, mixing loose products, grinding cereals, grinding, and littering the stands or rooms of the feed house) [15,16].
Particulates occurring in agriculture have a small-fraction structure of organic (animals, plants, microorganisms) or inorganic origin (chemical or mineral) [17]. The composition of agricultural PM may include bacteria (e.g., mites), small mites (arachnids), mold fungi, pollen, and other particles of hair, feather, fur, or epidermis [18]. Although the structure of PM and its fractionation have a great influence on its displacement, spatial and climatic conditions play an important role. The PM content varies depending on the location. The highest concentration of PM is recorded in closed, poorly ventilated places (such as feed houses), as well as in the areas with an increased work load, e.g., reloading and unloading or harvesting (mowing) [19]. One of the main climatic factors influencing the movement of fine particles in the air is strong wind and low air humidity [20].
1.2. Estimatimating the PM10 and PM2.5 Pollution
Estimates of PM intensity show that particulates are carried out based on the indicator of pollution in the air. The emission factor (EFpollutant) for PM10 and PM2.5 can be determined in several ways [21]:
- Direct measurements using preliminary separators. Sampling breaks the air stream from the source of pollution into different components based on the aerodynamic properties of the particulate material. Measurements show immediate results with the possibility of measuring and comparing.
- The estimate of the PM10 and PM2.5 share of total PM emissions.
- In the literature, you can find several methods for determining the PM emission index for agricultural crops. Among them, the following can be distinguished [21]:
- Direct estimate of PM emissions using measuring equipment.
- Indirect estimation of the significance of the EFpollutant emission factor using concentration measurements carried out with the measuring equipment located in the driver’s cab.
- The estimate of PM concentration at the field boundary.
In practice, the estimate is made using special equipment, depending on the size of the particles. Systematic measurements of air pollution in Poland are carried out based on Directive 2008/50/EC [22] and Regulation of Minister of the Environment [23]. The estimates of suspended PM (PM10 and PM2.5) are made by the Environmental Protection Inspectorate using the gravimetric (reference) method, which are recognized and used as the most precise automatic method [24].
In addition, the estimate of particles in the atmosphere uses active optical sensors, analyzers attenuation of β-particles, and the filter. To determine the PM intensity using the optical detectors, Datar, DustTrack, E-sampler Grimm, and Environmental Dust Monitor are used. During the optical measurement of the PM concentration, the proportionality of the scattering or absorption of the light passing through the stream of air is determined. The sensors can be adapted to measure PM in real time. The β-type PM detectors measure the β-radiation intensity in the prepared filter. The use of tapered element oscillating microbalance (TEOM) is a standard tool for determining the content of PM2.5 and PM10 particles in real time [25].
The TEOM principle of operation is based on the suction of air, which then passes through a specialized filter. The equipment measures the frequency vibrations of the filter membrane by determining the concentration of both PM2.5 and PM10. TEOM and type β-particulate detectors are devices commonly used to measure the content of PM10 particles in China, Great Britain, the United States, etc. TEOM detectors are the most common tool for the agencies measuring the control PM10 concentration levels around the world. Passive sensors such as Wilson and Cooke (MWAC), Big Spring Number Eight (BSNE), and Wedge Dust Flux Gauge (WDFG) require the manual collection of air sediment when the wind occurs. Another principle of passive sensors is the SUSTRA type, which weighs the collected sediment in real time [26,27].
Passive sensors differ in the accuracy of estimation due to the varying nature of their structures. The accuracy of the estimation of MWAC, BSNE, WSFG, and SUSTRA sensors may vary from 90%, 40%, 22% to 15%, while capturing particles ≤ 63 µm, at a wind speed of 5 m/s [28]. Particle sizes as well as wind speed may affect the accuracy of the estimation [29]. The estimation of PM10 particles using the BSNE sensor is more efficient (about 15% and 30%) at wind speeds of 8 and 3 m/s [30].
1.3. Additional and Linear PM10 and PM2.5 Pollution
The human agricultural activity, which interferes with the natural environment, is not indifferent to the environment. Starting from the intensification of aeolian erosion and intoxication of pollen from fields, the composting and emission of decomposition products of organic matter, animal husbandry, and agriculture is a serious source of air pollution. Modern mechanized agriculture additionally emits pollutants generated when using agricultural vehicles and machines, as well as when heating buildings. The main source of PM emissions are from agriculture crops, which are responsible for 89.1% of PM10 emissions and 97.8% of PM2.5 [30,31].
Particle pollution is also created by transport. Motor vehicles generate PM as a result of burning fuel in engines, as well as increase the PM content by re-entraining PM from the road surface. Additionally, particle matter is generated as a result of the abrasion of tires and brake pads [32]. Dust emissions arise during field works and the movement of vehicles on unpaved roads. The resulting emissions are short-lived. The pollutants originating from the sources of linear emission are gaseous, mainly: Carbon monoxide, nitrogen oxides, carbon dioxide, and hydrocarbons, including benzene and dust pollutants containing lead, cadmium, and nickel compounds [33]. Pollution is caused mainly by the combustion of fuels in motor vehicle engines (cars, agricultural machinery, railway), as well as a result of mechanical actions taken during transport, the source of which is the abrasion of tires, road surfaces, brakes, and clutch linings [34].
In the case of pollutants emitted from transport, their sources are low to the ground, and as a result, they have the greatest impact on the emission factor of the areas near roads. The characteristic features of transport pollution are the relatively high level of concentration of fuel combustion by-products (carbon monoxide, nitrogen oxides, volatile hydrocarbons, particulate matter), the pollution concentration along transport routes, diversification of the intensity of their occurrence related to changes in traffic intensity depending on the daily periods, as well as differentiation of the intensity of their occurrence related to changes in traffic intensity and depending on the seasonal periods [35].
2. Materials and Methods
The emission of PM2.5 and PM10 particulates was estimated based on the structure of the sources of emission included in the “EMEP/EEA Emission Inventory Guidebook” with the Tier 1 method [36]. To calculate the emissions for a selected category of farm animals, the mean annual animal population and the coefficient of pollution were considered. The calculations were made according to the following formula:
where Eanimal pollutant is the emission of pollutants in the category of livestock, kg/year; AAPanimal is the annual mean of the animal population, units/year; and EFanimal pollutant is the pollution factor.
Depending on the data available, the mean annual animal population is estimated with various methods. The mean annual animal population (AAPanimal), due to the lifespan, is broken down into categories. Values of AAPanimal must be averaged and they refer to the scale of the year. The mean annual farm animal population can be estimated with the formula [37]:
where Da represents the days of animal life, and NAPA is the number of animals produced annually.
Values of AAPanimal must be averaged and referred to as the scale of the year. For example, in natural conditions, the pigs live from 7 to 10 years. Intensive animal farming focuses mostly on production. The animals are kept in closed rooms and fed in the reproduction sector. The first farming stage takes place in the nursery, and the animals gain the slaughter weight in the fattening house. If not allocated to the reproduction, at the age of 5 to 6 months the animals are sent to slaughter [38]. Poultry is usually farmed about 60 days before slaughter. Therefore, during the calculations, the estimated mean annual poultry population must be considered. The number of dairy cows is estimated separately from the other cattle type. Dairy cows for the analysis are considered mature production cows. However, the dairy cow category does not cover the cows kept mostly for the production of veal calves.
The data on the animal population across the provinces (an administrative unit) in Poland have been acquired from the Central Statistics Authority (GUS), the 2019 Local Data Bank [39]. While performing the research, it was the latest data available. A selection of the right method for estimating the emission of particulates from animal production, similarly as for the plant production and agricultural soils, must be made drawing on the EMEP/EEA annual guidelines [36]. Thus, the values of the EF coefficient for respective animal categories are given in Table 1.
The EF default values according to the animal classifications have been estimated from industry sources, research studies, etc. The uncertainty associated with the estimated data can differ across the sources, timepoints of the study, etc. However, according to the literature source, it should be known within ±20% [36]. Often, statistics already provide the associated uncertainty estimates, in which case these should be used. It should also be considered that PM varies from the timepoint (e.g., in winter). For an accurate local study of PM emissions, one must consider whether the PM is under or over the farm structure roof.
3. Results and Discussion
3.1. Particulate Emission
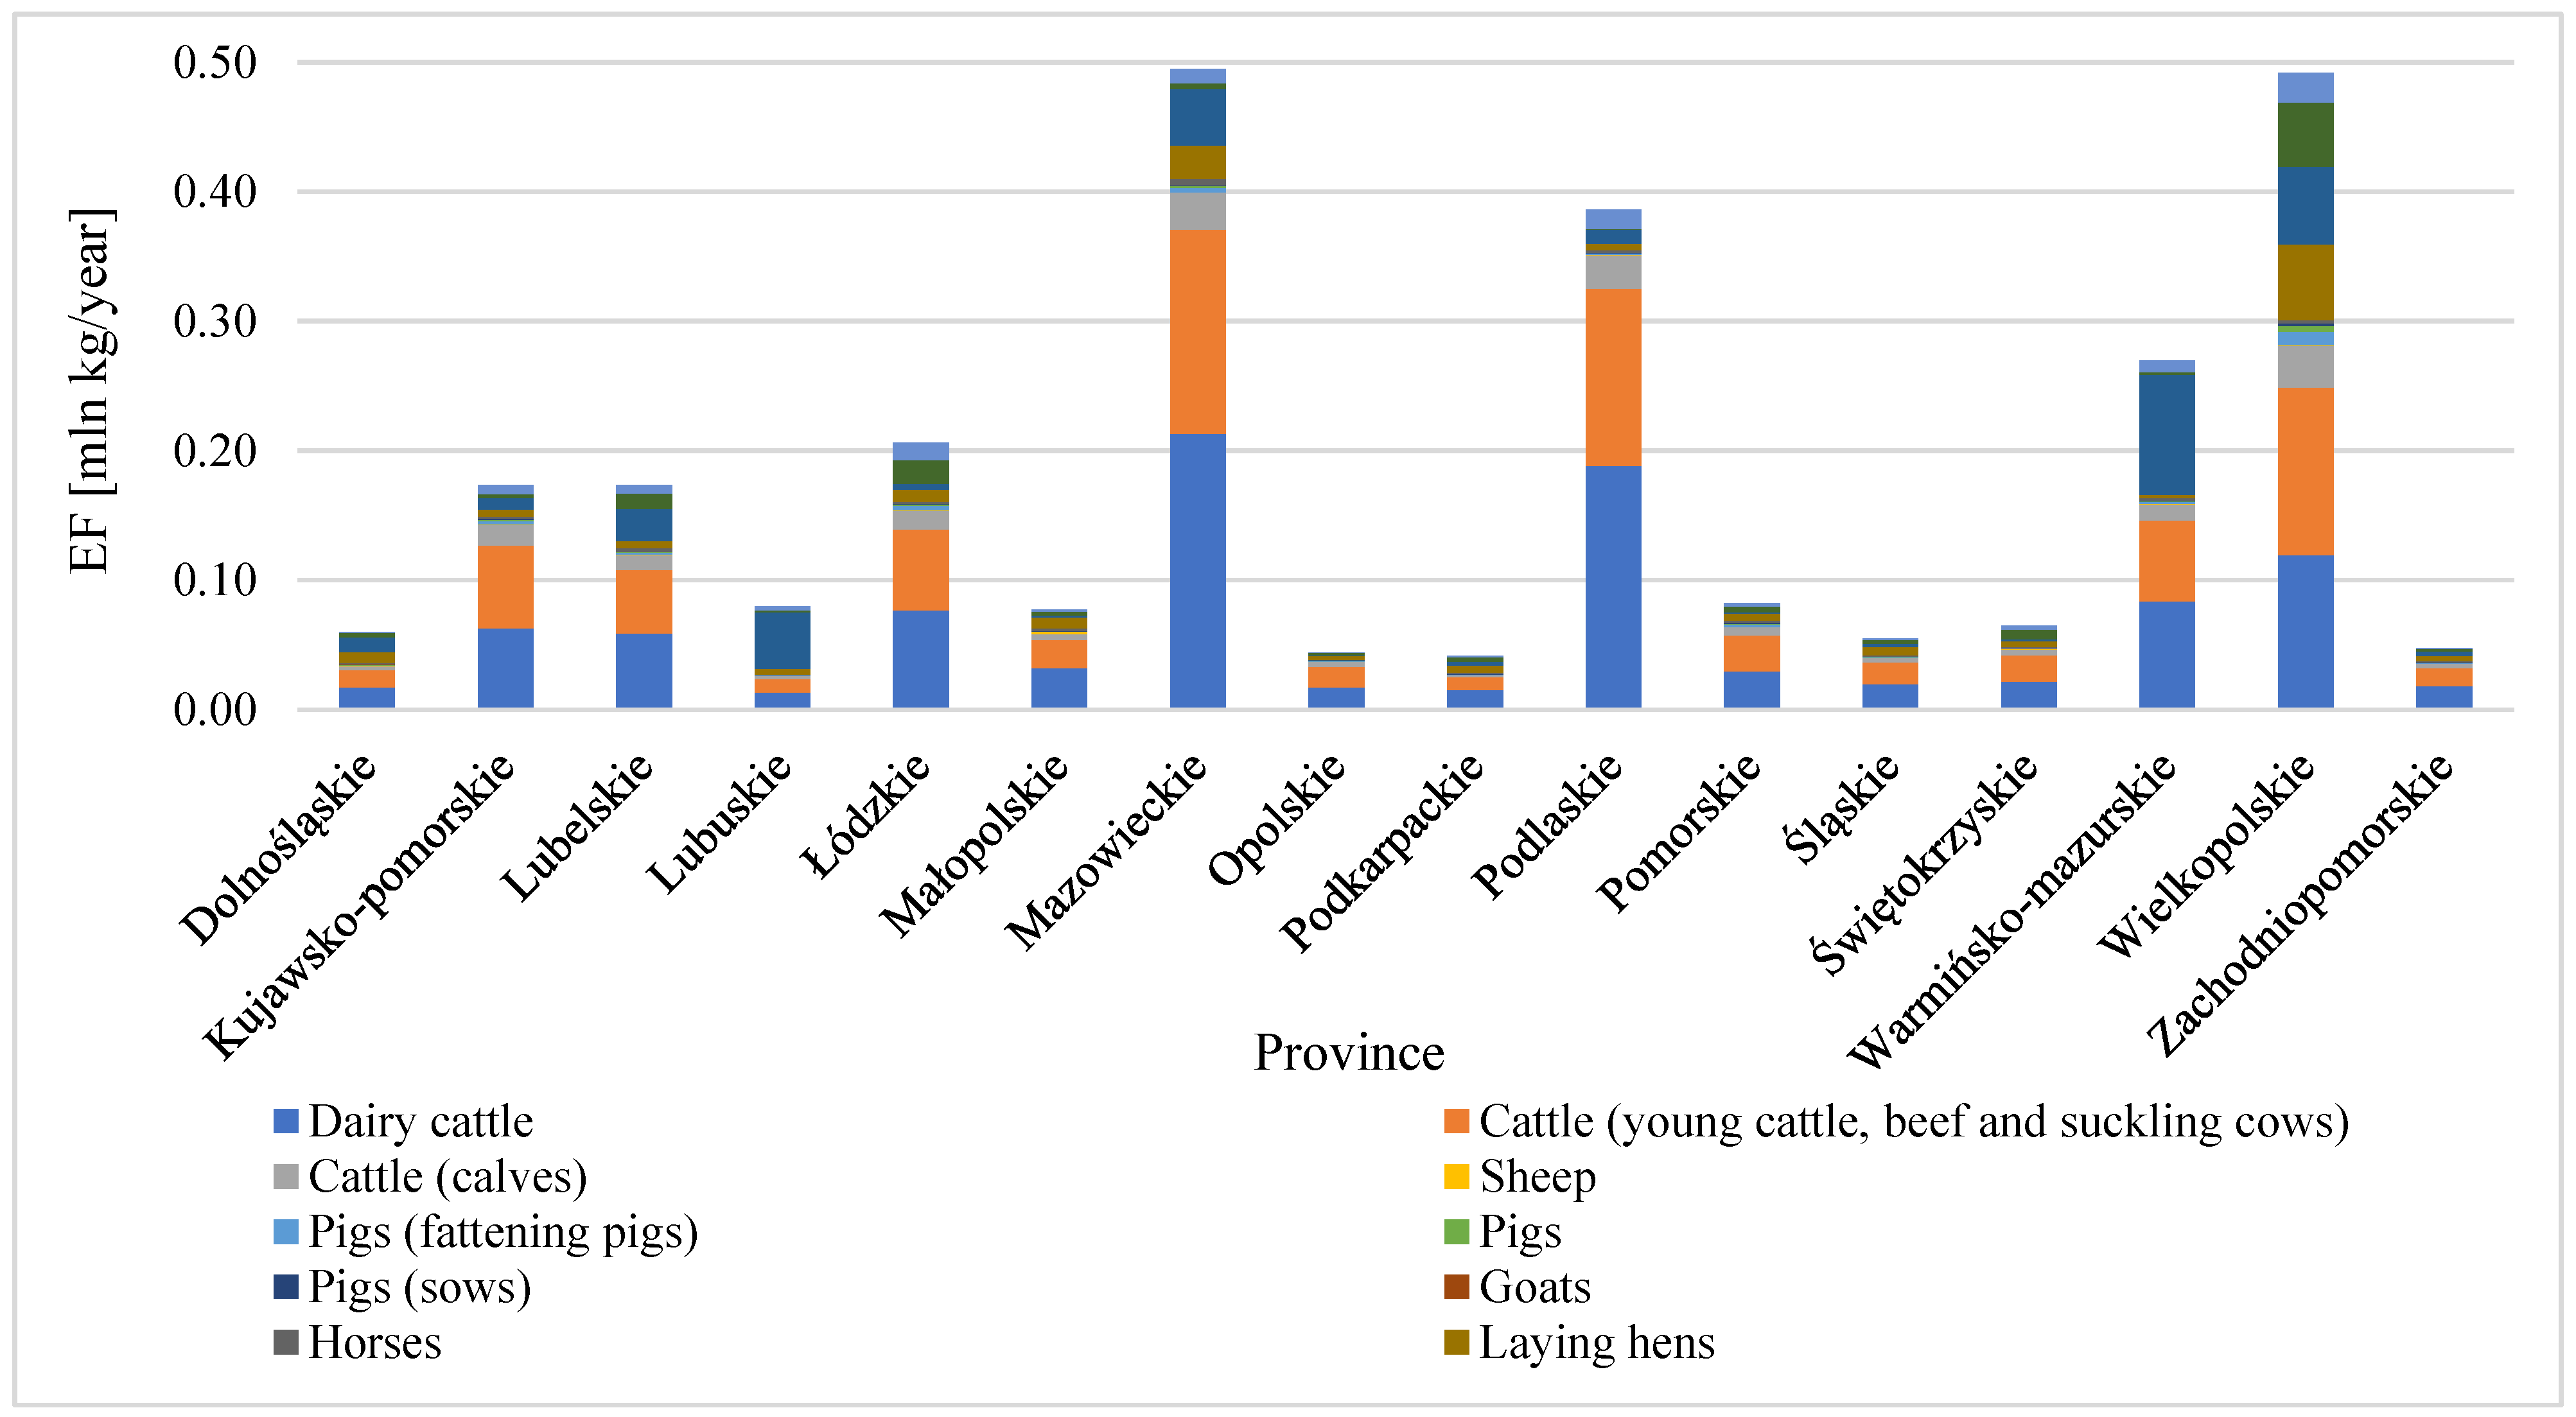
The calculations involved the analysis of the level of PM2.5 and PM10 pollution. To calculate the annual PM2.5 emission, Equation (1) was used. The annual accumulated level of pollution resulting from animal farming across the provinces is presented in Figure 2 (PM2.5) and Figure 3 (PM10).
Concerning that approach, most PM2.5 was recorded for the Mazowieckie, Wielkopolskie, and Podlaskie provinces. The result was mostly due to the particulates from cattle farming. As for the PM10 particulate, the greatest size was reported in the Wielkopolskie and Mazowieckie provinces. The result was mostly due to the particulates from laying hen and turkey farming.
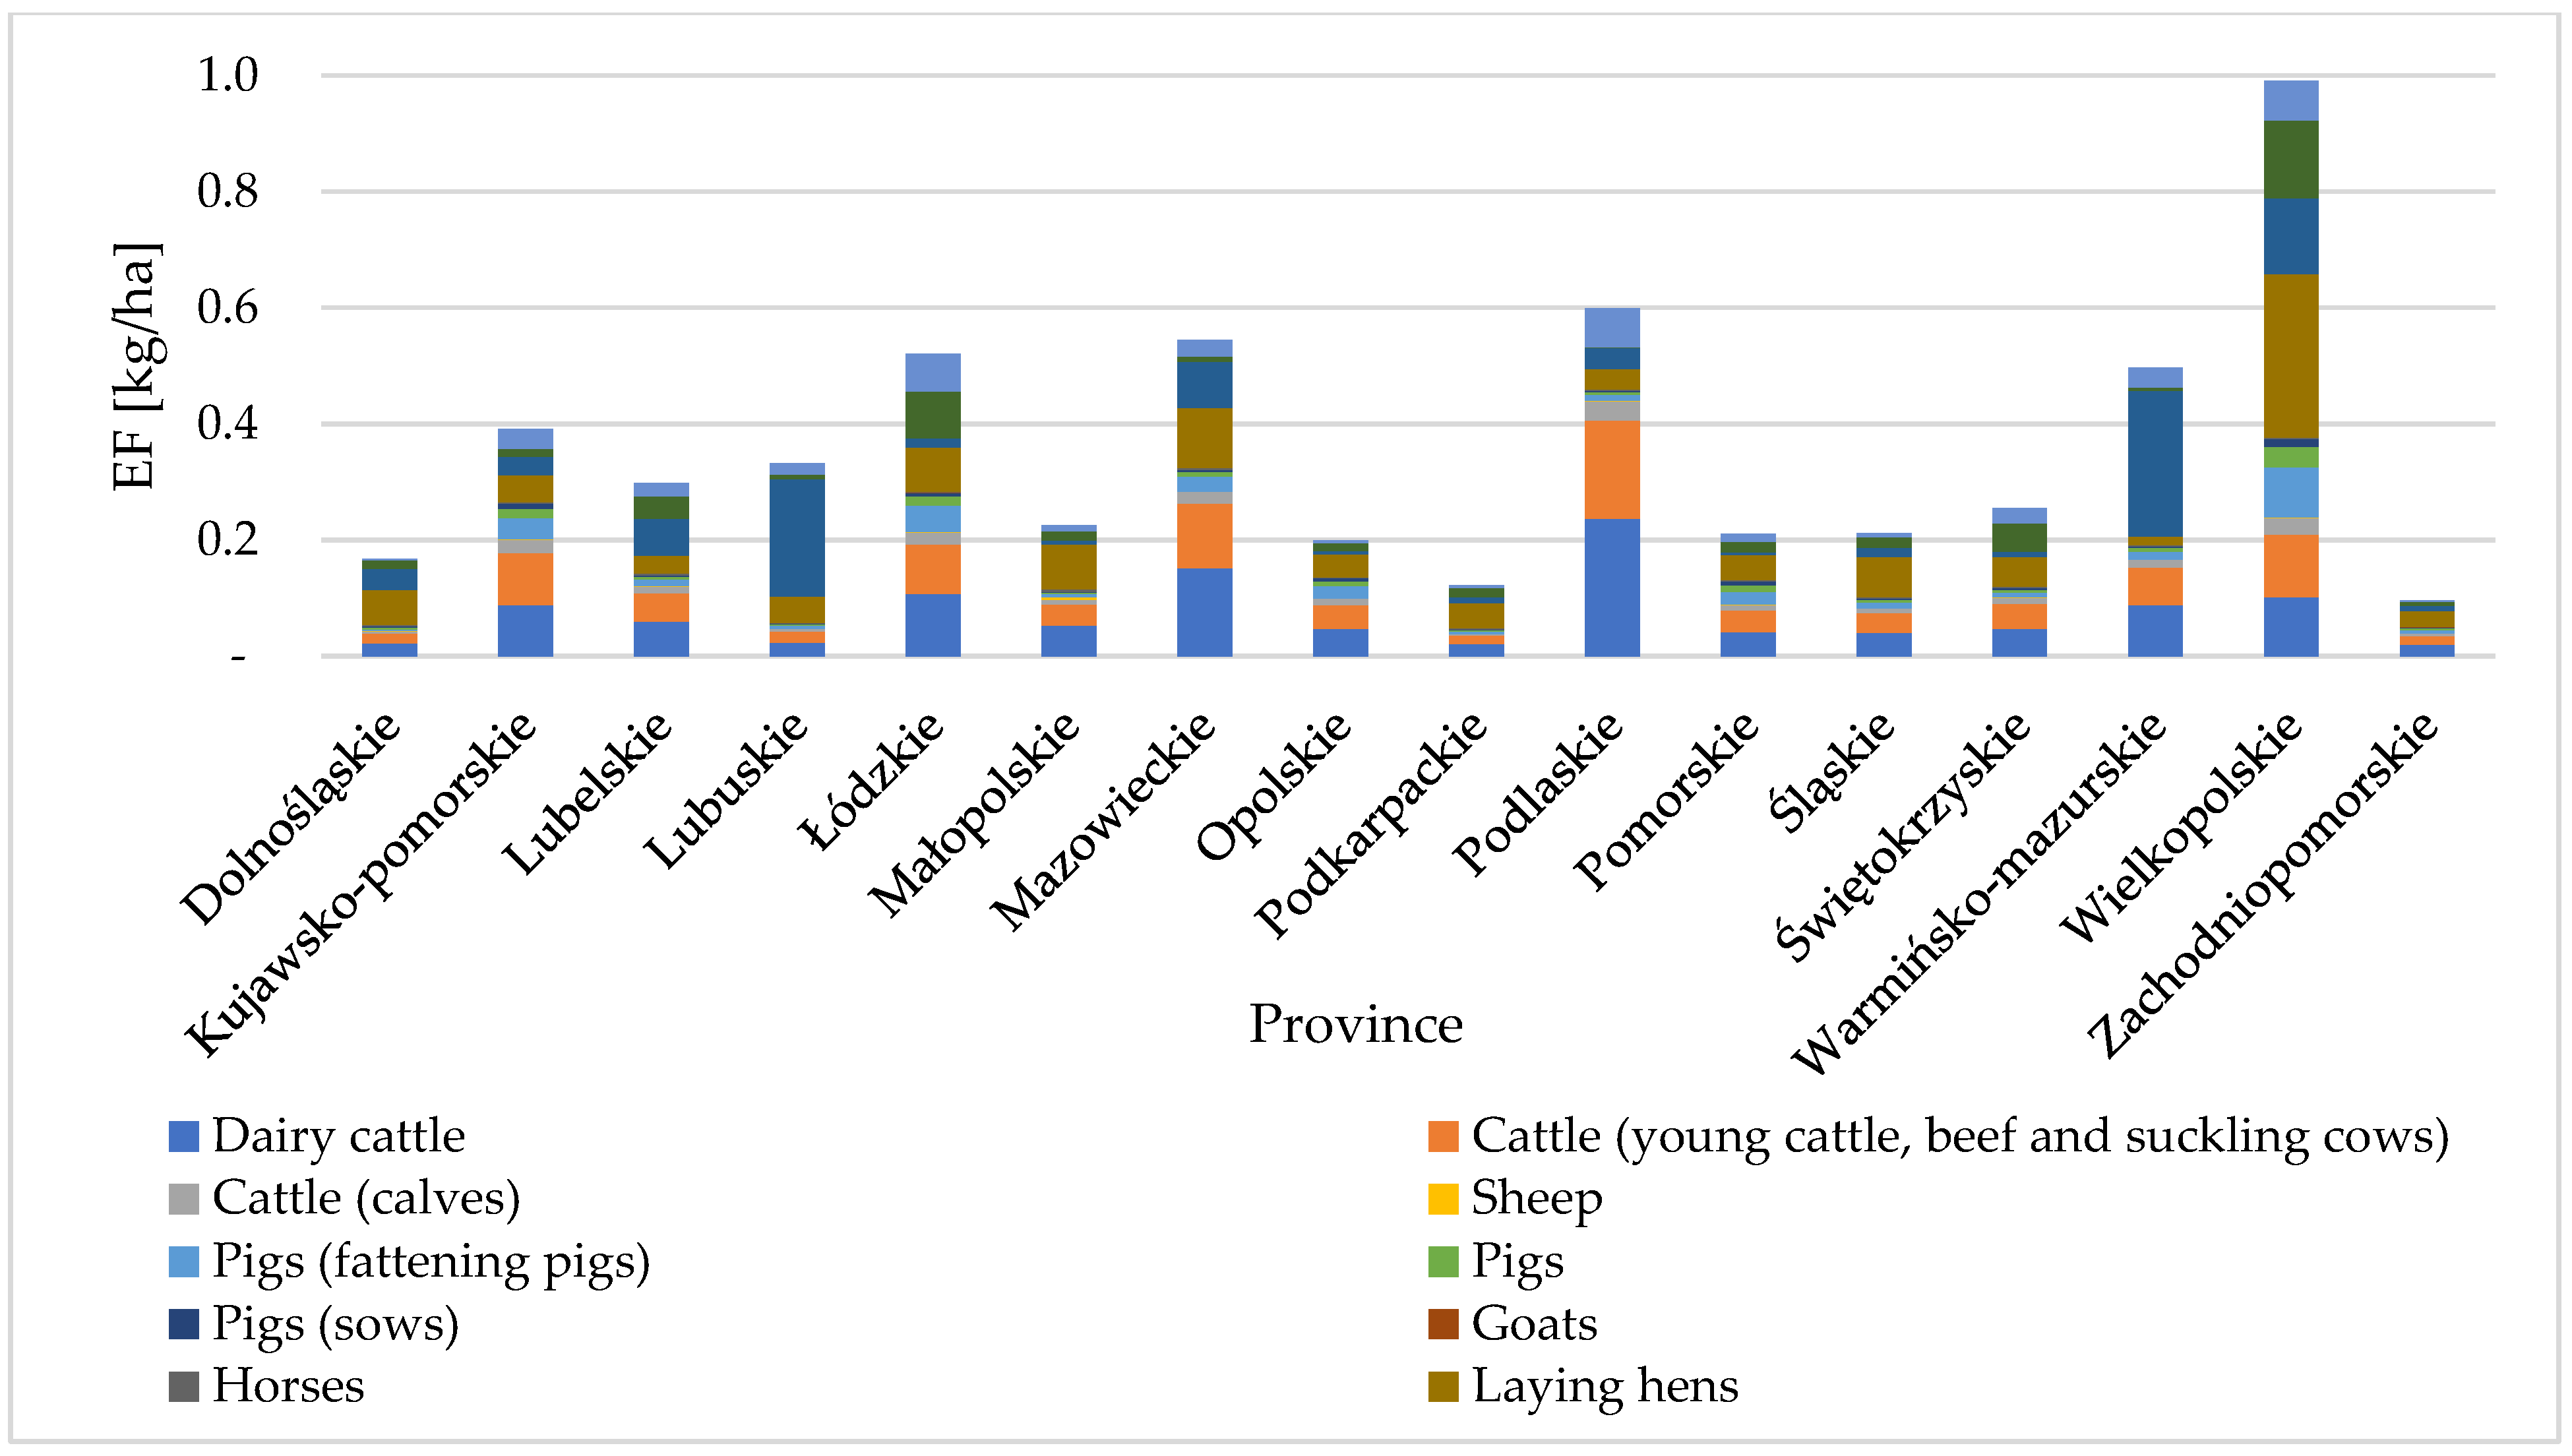
To compare, the particulate emission was referred to as the total pollution from respective kinds of animal farming in the province per area unit. The estimated unitary values of PM2.5 pollution across the provinces are provided in Figure 4, whereas the value of pollution with PM10 is provided in Figure 5. Figure 6 presents the accumulated values of PM2.5 and PM10 emissions broken down into the respective animal species.
The greatest unitary pollution with the PM2.5 particulate is reported in the Podlaskie, Wielkopolskie, and Mazowieckie provinces, mostly due to cattle farming, where for the Podlaskie and Mazowieckie provinces, it involved mostly dairy cows. The level of pollution with PM2.5 in those provinces exceeded the unitary value of 0.14 kg/ha. The highest unitary pollution with PM10 was reported in the Wielkopolskie province, with an increased intensity of poultry farming, especially laying hens (0.26 kg/ha). The total level of PM10 in that province was 0.83 kg/ha. A high unitary pollution with PM10 was recorded for the following provinces: Łódzkie, Mazowieckie, and Podlaskie, where the value was 0.41 kg/ha. In the Mazowieckie province, the greatest impact was found for cattle (0.16 kg/ha), laying hens, and ducks (0.07 kg/ha each), respectively, whereas, as for the Podlaskie province, the greatest impact was recorded for cattle farming (0.25 kg/ha), which corresponds to the fact that the region specializes in milk production. In the Łódzkie province, the greatest share was found for laying hens and ducks (0.07 kg/ha each), geese, and dairy cows (0.06 kg/ha each).
The unitary values were exposed to the statistical analysis provided in Table 2 for the PM2.5 particulate and in Table 3 for the PM10 particulate. Interestingly, significant differences are found in the mean values of PM2.5 and PM10 emissions from the farming of various animals in the provinces analyzed.
The greatest spatial variation in PM2.5 particulate emissions was recorded for dairy cows, cattle, and turkey farming, whereas the lowest spatial variation resulted from goose, swine (sow), and sheep farming. In addition, the greatest spatial variation in the PM10 emission was recorded from turkey, laying hens, and dairy cow farming and the lowest spatial differences were found for the goose, horse, and sheep farming.
Interestingly, in Poland, PM2.5 and PM10 emissions from animal farming are slightly lower than the plant production. A spatial variation in the particulate emissions from plant farming in 2018 ranged from 0.06 to 0.28 kg/ha for PM2.5 and from 0.63 to 1.36 for PM10 in the respective provinces [5]. Once all the solid particles from the animal and plant production were emitted, the size of the pollution will range from 1.02 to 2.37 kg/ha, which accounts for very high regional differences. Due to an unfavorable effect of particulate emissions on humans, it is justifiable to apply various reduction methods, as presented further in the text.
3.2. Methods of Reducing the Particulate Matter Emission
The key cause for particulates due to animal farming is the free movement of farm animals or the impact of weather in agricultural areas. The elevated particulate concentrations are most often recorded in the period of increased activity of animals or more intensified wind. The situation often concerns the blowing-away of the manure mixed with soil with a relatively low moisture [51]. An additional source of particulates can also be “secondary particle pollution” which, due to the redox reaction in the humid air, occurs with bases (ammonia at the gas phase), acids (dissolved sulfate, nitrate, or chloride ions), or solar radiation [52].
Many authors investigating similar research topics report on the highest particulate concentration right after the sunset [53]. According to Auvermann, the size of particulate pollution is affected by four major factors: Surface moisture, humidity, the angle of the sunlight, and the weather. The overlap of the four factors results in a 10–15-fold higher concentration of particulates during the day. It was not confirmed for dairy cattle free-range farming where the ratio of the particulate pollution was much lower. The laboratory analyses performed by the research team of Razote et al. [54] confirmed the conclusions by Auvermanna et al. [55], showing an increase in the particulate emissions against the manure remaining on the surface of the agricultural farm and manure storage in an unconcentrated form. To limit the particulate emissions, removing the crushed manure from the farm surfaces regularly, leaving a 2–3-cm layer of well-concentrated manure mixed with soil is recommended. The collection frequency should be quite regular and established from the cattle weight, the average animal feed consumption, and farm animal distribution. The collection from the farm surfaces can involve the use of machinery, especially a front-end loader [56] or disk scrapers [57]. The material can be stored in containers or specially made heaps at the recommended moisture from 25% to 45% [58].
The research has demonstrated that maintaining humidity, e.g., with a sprinkler system can additionally reduce the size of pollution by 55%–80% [59]. The most frequently applied method of water spraying is moisturizing with a sprayer (e.g., suspended), a hand sprayer, or water curtains [60]. Applying the water curtains decreases the concentration of PM10 from 20% to 40% (for the consumption of 4 L/min). One must remember that the disposed manure can be used as a fertilizer or biofuel, with about 15% nonvolatile solids or ash in the dry weight. The other methods of limiting the particulates, partially depended on the experiment phase, including:
- Windscreens in a form of a row of densely planted trees. The advantage of that solution is a simultaneous catching of the airborne particulates and a positive effect on soil erosion, additionally ensuring a natural and aesthetic look.
- Increasing the density, in some cases, it can reduce particulate emission. To much extent, the method depends on the moisture of the waste stored and it can have a negative effect on cattle performance [55].
- A change in the time of day when the cattle is fed and in the content of fat in feeds. The procedure decreases the activity of animals, whereas a higher amount of fat in the feed increases the fertilizer compactness.
- Limiting the speed on dirt roads and watering them before heavy farming works. According to the literature review [35], applying resins or petroleum derivatives used on the roads, despite high costs, effectively limits the particulates for road traffic.
Details on the emissions, reduction of emissions, and the corresponding costs have been described by Klimont et al. [61]. The selected results of the effectiveness of particulate reduction in agriculture are provided in Table 4.
According to the estimates, in the future, an increase in the particulate emission is expected in agriculture, which is due to the lack of law mechanisms supervising agricultural emissions [14,62]. With that in mind, one of the best solutions to reduce particulate emissions could be the common planting of new trees on agricultural farms. The method is effective, the costs are considerable and, at the same time, the effects are long-lasting. Other authors reported that spruce or larch especially, is the best for limiting the particulate emission [63]. The trees are often densely covered with needles 1 to 2.5 cm long, creating a natural filter [64,65]. Although those tree species are not that much common in Poland as pine, they are popular trees and can be perfectly applied as a particulate barrier. The method is natural and allows for a limited control of particulate mobility. With the above in mind, it could be important to launch a social campaign to inform the farmers and encourage such practices.
In addition, since Poland’s animal production is dominated by cattle and poultry, it is recommended to apply animal feed modifications. Additionally, as for cattle, it will be useful to apply silage with hay and, as for poultry, free range farming is recommended. It will allow a considerable reduction of PM2.5 and PM10 emissions into the air.
4. Conclusions
The agricultural activity, especially if interfering with the natural environment, is not neutral to the surroundings [66]. Starting from the intensity of wind erosion and the intoxication with particulates from the fields, the composting and emission of the products decomposition of organic matter, animal farming, and agriculture are a serious source of air pollution [67]. Modern mechanized agriculture additionally produces pollution from the use of agricultural vehicles and machinery as well as heating in buildings [68]. The key source of particulate emission from agriculture are crops, e.g., for the animal feed [30]. In agriculture, particulates are produced while performing each action, field works, tillage, mineral fertilization, hay collection, as well as other animal farming works (animal cleaning, drying, reloading, bulky product mixing, cereal kibbling, crushing, and providing bedding in the feed house stands or rooms) [69].
In Poland, the animal farming analysis is dominated by the emission of particulates from cattle and poultry. For that reason, the particulate emission reduction methods must be adapted to those two types of animal farming. It must be remembered that an effective method of PM10 particulate removal is sedimentation and waste eliminating of such particulates from the air within a few hours [58]. However, PM2.5 fine particles in the air can persist for a few days or even weeks [70]. An essential limitation in particulate reduction is also due to the fact that PM10 is transported up to 1000 km away, whereas PM2.5 is transported even up to 2500 km away [30]. Nevertheless, considering the negative effect of particulates on human health, countries should aim at limiting their emissions by applying adequate practices, as well as introducing the applicable agricultural particulate reduction regulations.
In the future, it would be interesting to perform a dynamic analysis of PM2.5 and PM10 particulate emissions. Additionally, it would be essential to make a comprehensive analysis of the particulate emissions produced by agriculture, both from animal and plant farming. Moreover, it would be important to research the applicable methods of reducing the particulate emissions on agricultural farms.
Author Contributions
Conceptualization, M.R. (Monika Roman), K.R., and M.R. (Michał Roman); methodology, M.R. (Monika Roman), K.R., and M.R. (Michał Roman), software, M.R. (Monika Roman), K.R., and M.R. (Michał Roman); validation, M.R. (Monika Roman), K.R., and M.R. (Michał Roman); formal analysis, M.R. (Monika Roman), K.R., and M.R. (Michał Roman); resources, M.R. (Monika Roman), K.R., and M.R. (Michał Roman); data curation, M.R. (Monika Roman), K.R., and M.R. (Michał Roman); writing—original draft preparation, M.R. (Monika Roman), K.R., and M.R. (Michał Roman); writing—review and editing, M.R. (Monika Roman), K.R., and M.R. (Michał Roman); visualization, M.R. (Monika Roman), K.R., and M.R. (Michał Roman); supervision, M.R. (Monika Roman), K.R., and M.R. (Michał Roman); project administration, M.R. (Monika Roman), K.R., and M.R. (Michał Roman); funding acquisition, M.R. (Monika Roman), K.R., and M.R. (Michał Roman). All authors have read and agreed to the published version of the manuscript.
Funding
This research received no external funding.
Institutional Review Board Statement
Not applicable.
Informed Consent Statement
Not applicable.
Data Availability Statement
Not applicable.
Conflicts of Interest
The authors declare no conflict of interest.
References
- Förstner, U. Integrated Pollution Control; Weissbach, A., Boeddicker, H., Eds.; Springer: Berlin, Germany; New York, NY, USA, 1998. [Google Scholar]
- Salvato, J.A.; Nemerow, N.L.; Agardy, F.J. Environmental Engineering, 5th ed.; John Wiley & Sons, Inc.: Hoboken, NJ, USA, 2003. [Google Scholar]
- Harrison, R.M.; Jones, A.M.; Lawrence, R.G. Major component composition of PM10 and PM.5 from roadside and urban background sites. Atmos. Environ. 2004, 38, 4531–4538. [Google Scholar] [CrossRef]
- Querol, X.; Alastuey, A.; Ruiz, C.R.; Artinano, B.; Hansson, H.C.; Harrison, R.M.; Buringh, E.; Brink, H.M.; Lutz, M.; Bruckmann, P.; et al. Speciation and origin of PM10 and PM2.5 in selected European cities. Atmos. Environ. 2004, 38, 6547–6555. [Google Scholar] [CrossRef]
- Roman, M.; Roman, M.; Roman, K.K. Spatial differentiation of particulates emission resulting from agricultural production in Poland. Agric. Econ. Czech. 2019, 65, 375–384. [Google Scholar] [CrossRef]
- Webb, J.; Misselbrook, T.H. A mass-flow model of ammonia emissions from UK livestock production. Atmos. Environ. 2004, 38, 2163–2176. [Google Scholar] [CrossRef]
- D’Amato, G.; Cecchi, L. Effects of climate change on environmental factors in respiratory allergic diseases. Clin. Exp. Allergy 2008, 38, 1264–1274. [Google Scholar] [CrossRef]
- Agriculture and Agri-Food Canada. Available online: http://www.agr.gc.ca/eng/science-and-innovation/agricultural-practices/agriculture-and-climate/particulate-matter-indicator/?id=1462392213883#calc (accessed on 29 October 2020).
- Oenema, O.; Velthof, G.; Klimont, Z.; Winiwarter, W. Emissions from Agriculture and Their Control Potentials; TSAP Report #3, Version 2.1, Service Contract on Monitoring and Assessment of Sectorial Implementation Actions, (ENV.C.3/SER/2011/0009): 27; International Institute for Applied Systems Analysis: Laxenburg, Austria, 2012. [Google Scholar]
- Sankey, J.B.; Eitel, J.U.H.; Glenn, N.F.; Germino, M.J.; Vierling, L.A. Quantifying relationships of burning, roughness, and potential dust emission with laser altimetry of soil surfaces at submeter scales. Geomorphology 2011, 135, 181–190. [Google Scholar] [CrossRef]
- Bernstein, J.A.; Alexis, N.; Barnes, C.; Bernstein, I.L.; Nel, A.; Peden, D.; Diaz-Sanchez, D.; Tarlo, S.M.; Williams, P.B. Health effects of air pollution. J. Allergy Clin. Immunol. 2004, 114, 1116–1123. [Google Scholar] [CrossRef]
- Shapiro, M.; Galperin, V. Air classification of solid particles: A review. Chem. Eng. Process. Process. Intensif. 2005, 44, 279–285. [Google Scholar] [CrossRef]
- Wunschel, J.; Poole, J.A. Occupational agriculture organic dust exposure and its relationship to asthma and airway inflammation in adults. J. Asthma 2016, 53, 471–477. [Google Scholar] [CrossRef] [Green Version]
- Sharratt, B.S.; Auvermann, B. Dust pollution from agriculture. In Encyclopedia of Agriculture and Food Systems; Van Alfen, N.K., Ed.; Elsevier Academic Press: Cambridge, MA, USA, 2014; Volume 2, pp. 487–504. [Google Scholar]
- Greskevitch, M.; Kullman, G.; Moon Bang, K.; Mazurek, J.M. Respiratory Disease in Agricultural Workers: Mortality and Morbidity Statistics. J. Agromed. 2008, 12, 5–10. [Google Scholar] [CrossRef] [PubMed]
- Schenker, M.B.; Farrar, J.A.; Mitchell, D.C.; Green, R.S.; Samuels, S.J.; Lawson, R.J.; McCurdy, S.A. Agricultural dust exposure and respiratory symptoms among California farm operators. J. Occup. Environ. Med. 2005, 47, 1157–1166. [Google Scholar] [CrossRef]
- Schenker, M. Exposures and health effects from inorganic agricultural dusts. Environ. Health Perspect. 2000, 108, 661–664. Available online: http://0-www-ncbi-nlm-nih-gov.brum.beds.ac.uk/pmc/articles/PMC1637665/ (accessed on 8 December 2020).
- Dutkiewicz, J. Exposure to Dust-Borne Bacteria in Agriculture. I. Environmental Studies. Arch. Environ. Health Int. J. 1978, 33, 250–259. [Google Scholar] [CrossRef] [PubMed]
- Harnly, M.; Bradman, A.; Nishioka, M.; McKone, T.; Smith, D.; McLaughlin, R.; Baird-Kavannah, G.; Castorina, R.; Eskenazi, B. Pesticides in Dust from Homes in an Agricultural Area. Environ. Sci. Technol. 2009, 43, 8767–8774. [Google Scholar] [CrossRef] [PubMed]
- Winiwarter, W.; Kuhlbusch, T.A.J.; Viana, M.; Hitzenberger, R. Quality considerations of European PM emission inventories. Atmos. Environ. 2009, 43, 3819–3828. [Google Scholar] [CrossRef]
- Chen, W.; Tong, D.Q.; Zhang, S.; Zhang, X.; Zhao, H. Local PM10 and PM2.5 emission inventories from agricultural tillage and harvest in northeastern China. J. Environ. Sci. 2017, 57, 15–23. [Google Scholar] [CrossRef]
- European Parliament. Directive 2008/50/EC of the European Parliament and of the Council of 21 May 2008 on Ambient Air Quality and Cleaner Air for Europe, OJ L 152, 11.06.2008; European Parliament: Brussels, Belgium, 2008; p. 1. [Google Scholar]
- Regulation of Minister of the Environment of 13 September 2012 on Assessing the Contents of Substances in the Air. J. Laws 2012, item 1032. Available online: http://isap.sejm.gov.pl/isap.nsf/DocDetails.xsp?id=WDU20120001032 (accessed on 8 December 2020).
- How Airborne Dust Is Measured. Available online: http://www.gios.gov.pl/pl/aktualnosci/315-jak-sie-mierzy-pyl-zawieszony-w-powietrzu (accessed on 29 November 2020).
- Fang, G.C.; Chang, C.N.; Chu, C.C.; Wu, Y.S.; Fu, P.P.C.; Yang, I.L.; Chen, M.H. Characterization of particulate, metallic elements of TSP, PM2.5 and PM2.5-10 aerosols at a farm sampling site in Taiwan, Taichung. Sci. The Total Environ. 2003, 308, 157–166. [Google Scholar] [CrossRef]
- Zobeck, T.M.; Stout, J.E.; Van Pelt, R.S.; Funk, R.; Rajot, J.L.; Sterk, G. Measurement and data analysis methods for field-scale wind erosion studies. Earth Surf. Process. Landf. 2003, 28, 1163–1188. [Google Scholar] [CrossRef]
- Fryrear, D.W. A Field Dust Sampler. J. Soil Water Conserv. 1986, 41, 117–120. Available online: http://www.jswconline.org/content/41/2/117 (accessed on 8 December 2020).
- Goossens, D.; Offer, Z.Y. Wind tunnel and field calibration of six aeolian dust samples. Atmos. Environ. 2000, 34, 1043–1057. [Google Scholar] [CrossRef]
- Sharratt, B.; Feng, G. Windblown dust influenced by conventional and undercutter tillage within the Columbia Plateau, USA. Earth Surf. Process. Landf. 2009, 34, 1323–1332. [Google Scholar] [CrossRef]
- WIOS. 2018. Available online: http://www.wios.lodz.pl/files/docs/r15xiiixpowietrze.pdf (accessed on 29 October 2020).
- Glotter, M.; Elliott, J. Simulating US agriculture in a modern Dust Bowl drought. Nat. Plants 2016, 3, 16193. [Google Scholar] [CrossRef] [PubMed]
- Veranth, J.M.; Pardyjak, E.R.; Seshardi, G. Vehicle-generated fugitive dust transport: Analytic models and field study. Atmos. Environ. 2003, 37, 2295–2303. [Google Scholar] [CrossRef]
- Chow, J.C.; Watson, J.G.; Green, M.C.; Douglas, H.L.; DuBois, D.W.; Khol, S.D.; Egami, R.T.; Gillies, J.; Rogers, C.F.; Fraizer, C.A.; et al. Middle- and neighborhood-scale variations of PM10 source contributions in Las Vegas, Nevada. J. Air Waste Manag. Assoc. 1999, 49, 641–654. [Google Scholar] [CrossRef] [Green Version]
- Goossens, D. The granulometrical characteristics of a slowly moving dust cloud. Earth Surf. Process. Landf. 1985, 10, 353–362. [Google Scholar] [CrossRef]
- Gillies, J.A.; Watson, J.G.; Rogers, C.F.; DuBois, D.; Chow, L.C.; Langston, R.; Sweet, J. Long-term efficiencies of dust suppressants to reduce PM10 emissions from unpaved roads. J. Air Waste Manag. Assoc. 1999, 49, 3–16. Available online: http://www.diva-portal.org/smash/get/diva2:309927/FULLTEXT01.pdf (accessed on 8 December 2020). [CrossRef]
- Amon, B.; Hutchings, N.; Dämmgen, U.; Sommer, S.; Webb, J. EEA Guidebook 2019: 3B Manure Management; European Environment Agency: København, Denmark, 2019; pp. 1–70. Available online: http://www.eea.europa.eu/ds_resolveuid/ENDMC6O5FR (accessed on 8 December 2020).
- Intergovernmental Panel on Climate Change. IPCC Guidelines for National Greenhouse Gas Inventories; Agriculture, Forestry and Other Land Use; Intergovernmental Panel on Climate Change: Geneva, Switzerland, 2006; Volume 4, Chapter 10.8.
- De Smet, S.M.; Pauwels, H.; De Bie, S.; Demeyer, D.I.; Callewier, J.; Eeckhout, W. Effect of halothane genotype, breed, feed withdrawal, and lairage on pork quality of Belgian slaughter pigs. J. Anim. Sci. 1996, 74, 1854–1863. [Google Scholar] [CrossRef] [PubMed] [Green Version]
- Local Data Bank. Available online: http://bdl.stat.gov.pl/BDLS/dane/podgrup/temat (accessed on 30 September 2020).
- Takai, H.; Pedersen, S.; Johnsen, J.O.; Metz, J.H.M.; Groot Koerkamp, P.W.G.; Uenk, G.H.; Phillips, V.R.; Holden, M.R.; Sneath, R.W.; Short, J.L.; et al. Concentrations and Emissions of Airborne Dust in Livestock Buildings in Northern Europe. J. Agric. Eng. Res. 1998, 70, 59–77. [Google Scholar] [CrossRef] [Green Version]
- Mosquera, J.; Ogink, N.W.M. Reducing the sampling periods required in protocols for establishing ammonia emissions from pig fattening buildings using measurements and modeling. Biosyst. Eng. 2011, 110, 90–96. [Google Scholar] [CrossRef]
- Winkel, L.C.; Hoogendoorn, A.; Xing, R.; Wentzel, J.J.; der Heiden, K.V. Animal models of surgically manipulated flow velocities to study shear stress-induced atherosclerosis. Atherosclerosis 2015, 241, 100–110. [Google Scholar] [CrossRef] [PubMed]
- Chardon, W.J.; van der Hoek, K.W. Berekeninggsmethode Voor de Emissie Van Fijn Stof Vanuit de Landbouw; Altera Research Instituut voor de Groene Ruimte: Wageningen, The Netherlands, 2002. [Google Scholar]
- Costa, R.G.; de Medeiros, A.N.; Alves, A.R.; de Medeiros, G.R. Prospects for use of rooster tree (Calotropis procera) in animal production. Rev. Caatinga 2009, 22, 1–9. Available online: http://www.feedipedia.org/node/7935 (accessed on 8 December 2020).
- Van Ransbeeck, N.; Langenhove, H.V.; Demeyer, P. Indoor concentrations and emissions factors of particulate matter, ammonia and greenhouse gases for pig fattening facilities. Biosyst. Eng. 2013, 116, 518–528. [Google Scholar] [CrossRef]
- Seedorf, J.; Hartung, J. A proposal for calculating the dustlike particle emissions from livestock buildings. Dtsch. Tierarztl. Wochenschr. 2001, 108, 307–310. Available online: http://europepmc.org/article/med/11505849 (accessed on 8 December 2020).
- Lim, T.T.; Heber, A.J.; Ni, J.-Q.; Gallien, J.Z.; Xin, H. Air quality measurements at a laying hen house: Particulate matter concentrations and emissions. In Air Pollution from Agricultural Operations III; Keener, H., Ed.; ASAE: St. Joseph, MI, USA, 2003; pp. 249–256. [Google Scholar]
- Redwine, J.S.; Lacey, R.E.; Mukhtar, S.; Carey, J.B. Concentration and emissions of ammonia and particulate matter in tunnel-ventilated broiler houses under summer conditions in Texas. Trans. ASAE 2002, 45, 1101–1109. [Google Scholar] [CrossRef] [Green Version]
- Roumeliotis, T.S.; Van Heyst, B.J. Size fractionated particulate matter emissions from a broiler house in Southern Ontario, Canada. Sci. Total Environ. 2007, 383, 174–182. [Google Scholar] [CrossRef] [PubMed]
- Modini, R.L.; Agranovski, V.; Meyer, N.K.; Gallagher, E.; Dunlop, M.; Ristovski, Z.D. Dust emissions from a tunnel-ventilated broiler poultry shed with fresh and partially reused litter. Anim. Prod. Sci. 2010, 50, 552–556. [Google Scholar] [CrossRef] [Green Version]
- Mielke, L.N.; Swanson, N.P.; McCalla, T.M. Soil profile conditions of cattle feedlots. J. Environ. Qual. 1974, 3, 14–17. [Google Scholar] [CrossRef]
- Sakirkin, S.L.P.; Maghirang, R.; Amosson, S.; Auvermann, B.W. AIR QUALITY, Dust Emissions from Cattle Feeding Operations—Part 1 of 2: Sources, Factors, and Characteristics; Issues: Dust Emissions, Education in Animal Agriculture, January 2012; Iowa State University Extension and Outreach: Ames, IA, USA, 2012; pp. 1–12. [Google Scholar]
- Auvermann, B.A. Texas/New Mexico open-lot research. In Proceedings of the Western Dairy Air Quality Symposium, Sacramento, CA, USA, 20 April 2011. [Google Scholar]
- Razote, E.B.; Maghirang, R.G.; Predicala, B.Z.; Murphy, J.P.; Auvermann, B.W.; Harner, J.P., III; Hargrove, W.L. Laboratory evaluation of the dust-emission potential of cattle feedlot surfaces. Trans. ASABE 2006, 49, 1117–1124. [Google Scholar] [CrossRef]
- Auvermann, B.A.; Romanillos, A. Effect of increased stocking density on fugitive dust emissions of PM10 from cattle feedyards. In Proceedings of the International Meeting of the Air and Waste Management Association, Salt Lake City, UT, USA, 18–22 June 2000. [Google Scholar]
- Bretz, F.E.; Amosson, S.H.; Warminski, P.L.; Marek, T.H. Economic Analysis of Manure Harvesting Equipment in Feedyards for Dust Control. In Proceedings of the Southern Agricultural Economics Association Annual Meeting, Orlando, FL, USA, 6–9 February 2010. [Google Scholar]
- Auvermann, B.A. Lesson 42: Controlling dust and odor from open lot livestock facilities. In Livestock and Poultry Environmental Stewardship Curriculum (LPES); Mid-West Plan Service (MWPS): Ames, IA, USA, 2009. [Google Scholar]
- Sweeten, J.M.; Lott, S. Dust management. In Designing Better Feedlots; Conference and Workshop Series QC94002; Watts, P., Tucker, R., Eds.; Queensland Department of Primary Industries: Toowoomba/Brisbane, QSL, Australia, 1994. [Google Scholar]
- Bonifacio, H.F.; Maghirang, R.G.; Razote, E.B.; Auvermann, B.W.; Harner, J.P.; Murphy, J.P.; Guo, L.; Sweeten, J.M.; Hargrove, W.L. Particulate control efficiency of a water sprinkler system at a beef cattle feedlot in Kansas. Trans. ASABE 2011, 54, 295–304. [Google Scholar] [CrossRef]
- Livestock and Poultry Environmental Learning Center Webcast Series Sponsored by the: Air Quality Education in Animal Agriculture Project 27 March 2009. Available online: https://lpelc.org/wp-content/uploads/2019/03/09marPPcasey.pdf (accessed on 8 December 2020).
- Klimont, Z.; Cofala, J.; Bertok, I.; Amann, M.; Heyes, C.; Gyarfas, F. Modelling Particulate Emissions in Europe a Framework to Estimate Reduction Potential and Control Costs; International Institute for Applied Systems Analysis: Laxenburg, Austria, 2002; pp. 20–79. [Google Scholar]
- Tegen, I.; Werner, M.; Harrison, S.P.; Kohfeld, K.E. Relative importance of climate and land use in determining present and future global soil dust emission. Geophys. Res. Lett. 2004, 31, L05105. [Google Scholar] [CrossRef] [Green Version]
- Yu, J.; Wu, J. The Sustainability of Agricultural Development in China: The Agriculture–Environment Nexus. Sustainability 2018, 10, 1776. [Google Scholar] [CrossRef] [Green Version]
- Hofman, J.; Wuyts, K.; Van Wittenberghe, S.; Brackx, M.; Samson, M. On the link between biomagnetic monitoring and leaf-deposited dust load of urban trees: Relationships and spatial variability of different particle size fractions. Environ. Pollut. 2014, 189, 63–72. [Google Scholar] [CrossRef]
- Chakrabortty, S.; Paratkar, G. Biomonitoring of trace element air pollution using mosses. Aerosol Air Qual. Res. 2006, 6, 247–258. [Google Scholar] [CrossRef] [Green Version]
- Lee, S.A.; Adhikari, A.; Grinshpun, S.A.; McKay, R.; Shukla, R.; Reponen, T. Personal Exposure to Airborne Dust and Microorganisms in Agricultural Environments. J. Occupat. Environ. Hyg. 2007, 3, 118–130. [Google Scholar] [CrossRef] [PubMed]
- Bauer, S.E.; Im, U.; Mezuman, K.; Gao, C.Y. Desert dust, industrialization, and agricultural fires: Health impacts of outdoor air pollution in Africa. J. Geophys. Res. Atmos. 2019, 124, 4104–4120. [Google Scholar] [CrossRef]
- Li, J.; Rodriguez, D.; Tang, X. Effects of land lease policy on changes in land use, mechanization and agricultural pollution. Land Use Policy 2017, 64, 405–413. [Google Scholar] [CrossRef]
- Dutkiewicz, J. Pył Występujący w Rolnictwie Jest Niebezpieczny; Kasa Rolniczego Ubezpieczenia Społecznego KRUS: Warsaw, Poland, 2006; pp. 1–16. [Google Scholar]
- Guo, H.; Kota, S.H.; Sahu, S.K.; Hu, J.; Ying, J.; Gao, A.; Zhang, H. Source apportionment of PM2.5 in North India using source-oriented air quality models. Environ. Pollut. 2017, 231, 426–436. [Google Scholar] [CrossRef] [PubMed]
Figure 1.
Major actions and factors affecting the emission of particulate matter (PM) from primary and secondary sources in agriculture. Source: [8].
Figure 1.
Major actions and factors affecting the emission of particulate matter (PM) from primary and secondary sources in agriculture. Source: [8].

Figure 2.
PM2.5 emission from livestock production by types of animals in Poland. Source: Authors’ calculations based on [39].
Figure 2.
PM2.5 emission from livestock production by types of animals in Poland. Source: Authors’ calculations based on [39].

Figure 3.
PM10 emission from livestock production by types of animals in Poland. Source: Authors’ calculations based on [39].
Figure 3.
PM10 emission from livestock production by types of animals in Poland. Source: Authors’ calculations based on [39].

Figure 4.
Level of PM2.5 pollution unit in the respective provinces (kg/ha). Source: Authors’ calculations based on [39].
Figure 4.
Level of PM2.5 pollution unit in the respective provinces (kg/ha). Source: Authors’ calculations based on [39].

Figure 5.
Level of PM10 pollution unit in the respective provinces (kg/ha). Source: Authors’ calculations based on [39].
Figure 5.
Level of PM10 pollution unit in the respective provinces (kg/ha). Source: Authors’ calculations based on [39].

Figure 6.
PM2.5 and PM10 emissions from livestock production by types of animals in Poland. Source: Authors’ calculations based on [39].
Figure 6.
PM2.5 and PM10 emissions from livestock production by types of animals in Poland. Source: Authors’ calculations based on [39].


Table 1.
Emission factor (EF) default values according to the animal classifications.
| NFR | Livestock Classification | EF dla TSP (kg AAP−1 Year−1) | EF dla PM10 (kg AAP−1 Year−1) | EF dla PM2,5 (kg AAP−1 Year−1) |
|---|---|---|---|---|
| 3Ba | Dairy cattle | 1.38 [40] | 0.63 [40] | 0.41 [40] |
| 3B1b | Cattle (young cattle, beef, and suckling cows) | 0.59 [40] | 0.27 [40] | 0.18 [40] |
| 3B1b | Cattle (calves) | 0.34 [40] | 0.16 [40] | 0.10 [40] |
| 3B2 | Sheep | 0.14 [41] | 0.06 [41] | 0.02 [41] |
| 3B3 | Pigs (fattening pigs) | 1.05 [42] | 0.14 [43,44] | 0.006 [42,45] |
| 3B3 | Pigs | 0.27 [42] | 0.05 [42,44] | 0.002 [42] |
| 3B3 | Pigs (sow) | 0.62 [42] | 0.17 [42,44] | 0.01 [40] |
| 3B4a | Buffaloes | 1.45 [40] | 0.67 [40] | 0.44 [40] |
| 3B4d | Goats | 0.14 [41] | 0.06 [41] | 0.02 [41] |
| 3B4e | Horses | 0.48 [46] | 0.22 [46] | 0.14 [46] |
| 3B4f | Mules and donkeys | 0.34 [40] | 0.16 [40] | 0.10 [40] |
| 3B4gi | Chickens (laying hens) | 0.19 [42] | 0.04 [42,44,47] | 0.003 [42] |
| 3B4gii | Broilers | 0.04 [42] | 0.02 [48] | 0.002 [49,50] |
| 3B4giii | Turkeys | 0.11 [41] | 0.11 [42] | 0.02 [42] |
| 3B4giv | Poultry (ducks) | 0.14 [40] | 0.14 [40] | 0.02 [40] |
| 3B4giv | Poultry (geese) | 0.24 [40] | 0.24 [40] | 0.03 [40] |
| 3B4h | Other animals (fur animals) | 0.018 [41] | 0.008 [41] | 0.004 [41] |
Table 2.
Results of the descriptive statistical analysis of PM2.5 (kg/ha).
| Animal | Average | Median | Standard Variation | Variance | Min. | Max. | T-Test | p-Value |
|---|---|---|---|---|---|---|---|---|
| Dairy cattle | 0.028313 | 0.019887 | 0.022702 | 0.000515 | 0.007889 | 0.093190 | 4.989 | 0.000 |
| Cattle (young cattle, beef, and suckling cows) | 0.023366 | 0.016929 | 0.017504 | 0.000306 | 0.005481 | 0.067926 | 5.340 | 0.000 |
| Cattle (calves) | 0.005088 | 0.004011 | 0.003564 | 0.000013 | 0.000877 | 0.012673 | 5.710 | 0.000 |
| Sheep | 0.000187 | 0.000134 | 0.000235 | 0.000000 | 0.000044 | 0.001041 | 3.181 | 0.006 |
| Pigs (fattening pigs) | 0.000808 | 0.000439 | 0.000887 | 0.000001 | 0.000120 | 0.003546 | 3.644 | 0.002 |
| Pigs | 0.000320 | 0.000186 | 0.000325 | 0.000000 | 0.000075 | 0.001356 | 3.938 | 0.001 |
| Pigs (sows) | 0.000228 | 0.000143 | 0.000195 | 0.000000 | 0.000065 | 0.000789 | 4.678 | 0.000 |
| Goats | 0.000029 | 0.000023 | 0.000019 | 0.000000 | 0.000010 | 0.000078 | 6.232 | 0.000 |
| Horses | 0.000785 | 0.000731 | 0.000328 | 0.000000 | 0.000311 | 0.001472 | 9.560 | 0.000 |
| Laying hens | 0.004560 | 0.003196 | 0.004308 | 0.000019 | 0.001052 | 0.019642 | 4.234 | 0.000 |
| Turkeys | 0.008748 | 0.003754 | 0.011507 | 0.000132 | 0.000607 | 0.038496 | 3.041 | 0.008 |
| Ducks | 0.003458 | 0.001819 | 0.004306 | 0.000019 | 0.000143 | 0.016628 | 3.212 | 0.006 |
| Geese | 0.002831 | 0.002274 | 0.002570 | 0.000007 | 0.000284 | 0.007593 | 4.408 | 0.001 |
Source: Authors’ research.
Table 3.
Results of the descriptive statistical analysis of PM10 (kg/ha).
| Animal | Average | Median | Standard Variation | Variance | Min. | Max. | T-Test | p-Value |
|---|---|---|---|---|---|---|---|---|
| Dairy cattle | 0.043505 | 0.030558 | 0.034883 | 0.001217 | 0.012123 | 0.143194 | 4.989 | 0.000 |
| Cattle (young cattle, beef, and suckling cows) | 0.035049 | 0.025394 | 0.026256 | 0.000689 | 0.008222 | 0.101889 | 5.340 | 0.000 |
| Cattle (calves) | 0.008140 | 0.006418 | 0.005702 | 0.000033 | 0.001404 | 0.020276 | 5.710 | 0.000 |
| Sheep | 0.000561 | 0.000402 | 0.000705 | 0.000000 | 0.000133 | 0.003122 | 3.181 | 0.006 |
| Pigs (fattening pigs) | 0.018860 | 0.010237 | 0.020705 | 0.000429 | 0.002797 | 0.082739 | 3.644 | 0.002 |
| Pigs | 0.008012 | 0.004652 | 0.008137 | 0.000066 | 0.001875 | 0.033908 | 3.938 | 0.001 |
| Pigs (sows) | 0.003870 | 0.002438 | 0.003309 | 0.000011 | 0.001106 | 0.013417 | 4.678 | 0.000 |
| Goats | 0.000088 | 0.000070 | 0.000056 | 0.000000 | 0.000031 | 0.000234 | 6.232 | 0.000 |
| Horses | 0.001233 | 0.001149 | 0.000516 | 0.000000 | 0.000489 | 0.002314 | 9.556 | 0.000 |
| Laying hens | 0.060803 | 0.042615 | 0.057444 | 0.003300 | 0.014029 | 0.261897 | 4.234 | 0.000 |
| Turkeys | 0.048113 | 0.020646 | 0.063288 | 0.004005 | 0.003337 | 0.211729 | 3.041 | 0.008 |
| Ducks | 0.024205 | 0.012733 | 0.030141 | 0.000908 | 0.000999 | 0.116395 | 3.212 | 0.006 |
| Geese | 0.022652 | 0.018193 | 0.020557 | 0.000423 | 0.002268 | 0.060748 | 4.408 | 0.001 |
Source: Authors’ research.
Table 4.
Agricultural particulate emission reduction effectiveness results.
| Particulates | Average Value PM10 [%] * | Average Value PM2.5 [%] * |
|---|---|---|
| Agriculture: Plowing, cultivation, harvesting-low crop, alternative grain harvest | 12.78 | 5 |
| Cattle: Feed modification | 29.44 | 10 |
| Cattle: Silage with hay | 33.33 | 10 |
| Dairy cows: Feed modification | 29.44 | 10 |
| Dairy cows: Silage with hay | 33.33 | 10 |
| Other animals: Good practices | 12.78 | 5 |
| Pigs: Feed modification | 30.56 | 10 |
| Poultry: Feed modification | 29.44 | 10 |
| Free-range poultry | 12.78 | 5 |
* The average values were estimated based on the data from Interim Report IR-02-076 in which the RAINS model was used. Source: [61].
Publisher’s Note: MDPI stays neutral with regard to jurisdictional claims in published maps and institutional affiliations. |
© 2021 by the authors. Licensee MDPI, Basel, Switzerland. This article is an open access article distributed under the terms and conditions of the Creative Commons Attribution (CC BY) license (http://creativecommons.org/licenses/by/4.0/).
Share and Cite
MDPI and ACS Style
Roman, M.; Roman, K.; Roman, M. Spatial Variation in Particulate Emission Resulting from Animal Farming in Poland. Agriculture 2021, 11, 168. https://0-doi-org.brum.beds.ac.uk/10.3390/agriculture11020168
AMA Style
Roman M, Roman K, Roman M. Spatial Variation in Particulate Emission Resulting from Animal Farming in Poland. Agriculture. 2021; 11(2):168. https://0-doi-org.brum.beds.ac.uk/10.3390/agriculture11020168
Chicago/Turabian StyleRoman, Monika, Kamil Roman, and Michał Roman. 2021. "Spatial Variation in Particulate Emission Resulting from Animal Farming in Poland" Agriculture 11, no. 2: 168. https://0-doi-org.brum.beds.ac.uk/10.3390/agriculture11020168
Note that from the first issue of 2016, this journal uses article numbers instead of page numbers. See further details here.