Article

Evaluation of the Effects of Spray Technology and Volume Rate on the Control of Grape Berry Moth in Mountain Viticulture

by
Costas Michael
1,*,
Emilio Gil
2,
Montserrat Gallart
2 and
Menelaos C. Stavrinides
1,*
1
Department of Agricultural Sciences, Biotechnology and Food Science, Cyprus University of Technology, Arch. Kyprianos 30, 3036 Limassol, Cyprus
2
Department of Agri-Food Engineering and Biotechnology, Universitat Politècnica de Catalunya, Esteve Terradas 8, Campus del Baix Llobregat 08860 Castelldefels, 08034 Barcelona, Spain
*
Authors to whom correspondence should be addressed.
Submission received: 28 November 2020 / Revised: 11 February 2021 / Accepted: 17 February 2021 / Published: 22 February 2021
(This article belongs to the Section Crop Protection, Diseases, Pests and Weeds)

Abstract

:
The current work evaluated spray coverage and pest control effectiveness against the grape berry moth (Lobesia botrana) by two different spray technologies and volume rates: A spray gun (high-volume sprayer—HVS) calibrated at 1000 L ha−1 and a conventional orchard sprayer calibrated at 500 L ha−1 (OS500) or 250 L ha−1 (OS250). Experiments were carried out in three different grape varieties over two years in mountain vineyards on the Mediterranean island of Cyprus. The median coverage for HVS remained above 80% for all three varieties, while that for OS500 ranged from 26% to 56%, and that for OS250 from 18% to 37%. Infestation by the grape berry moth varied from about 2.5% for Palomino, to 8% for Carignan and 3.2% for Xynisteri. Infestation in sprayed plots remained below 1.8% for all treatments, varieties and study years. Although infestation levels in OS250 were not different than the control in two varieties, the infestation levels among sprayer treatments did not differ by more than one percentage point. The current work suggests that lowering application volume and pesticide amount to 50% or more, in some cases, provides adequate control and represents an effective option for reducing pesticide use in vineyards.

1. Introduction

Public concerns about the negative effects of pesticide applications on human health and the environment catalyze the development of policies and methods aiming at reducing the environmental impact of spray applications. The recently published Farm to Fork Strategy of the European Union (EU) [1] calls for a decrease in “the overall use and risk of chemical pesticides by 50%, and the use of more hazardous pesticides by 50% by 2030”. A major policy instrument for reducing the reliance on synthetic pesticides is the European Directive 2009/128/EC [2] on the Sustainable Use of Pesticides. The Directive addresses explicitly pesticide application equipment, requesting from member states to set up inspection procedures for the correct calibration and functioning of sprayers [3]. A parallel initiative demonstrating the commitment of the European Commission on the topic is the “Better Training for Safer Food” program [4], which includes training on pesticide application equipment.
In response to the zeitgeist, researchers around the globe investigate methods [5], tools [6,7,8] and machinery [9,10,11,12] to improve spray coverage of crops [13,14]. Furthermore, several studies aim at reducing drift [15,16,17] and/or losses to the ground [18,19] or more generally to reduce pesticide use through correct calibration of agricultural machinery [20]. The most recent research applies new technologies that rely on lower spray volumes to achieve adequate coverage of crops [21,22].
Viticulture represents one of the most intensive cultivations worldwide [8] where substantial amounts of plant protection products are used to protect grapes from pests and diseases. The global area covered by vineyards is estimated at 7.5 m ha, with 37% of the acreage in Europe, 34% in Asia and 19% in America [23]. Ongoing efforts involve the development of tools, such as DOSAVIÑA® [24], to determine and reduce, where possible, the volume rate and amount of pesticides used in vineyards.
A straightforward option for reducing the amount of pesticide used is to reduce the spray volume while maintaining the same concentration of active ingredient in the spray tank [11]. Volume reduction is also important for practical reasons in mountain viticulture, a special type of vine growing occurring at altitudes higher than 500 m, slopes greater than 30%, terraces or on small islands (www.cervim.org). Refilling of sprayers with water becomes particularly challenging in mountainous vineyards because of the generally low availability of irrigation facilities, and the difficulties associated with transporting large amounts of water on steep slopes. The practicing of mountainous viticulture is typical on the Mediterranean island of Cyprus, where small-sized vineyards are nested on terraces on the island’s mountains. The most important insect pest attacking grapes in Cyprus and other parts of the world is the grape berry moth [Lobesia botrana (Denis and Schiffermüller) (Lepidoptera: Tortricidae)], a global pest of grapes. The larvae of the pest attack initially the flowers and at later generations the unripe and ripening berries [13]. The moth damages the berries directly through larval feeding, and usually results in secondary infections by botrytis bunch rot, caused by Botrytis cinerea [25].
The current standard for vine spraying in many mountainous vineyards consists in the use of high-volume sprayers connected to spray guns that typically use more than 1000 L ha−1 [13,26,27]. The increasing availability and adoption of modern pesticide technologies, such as orchard sprayers (OS), presents an opportunity to lower volume rates and gain the associated environmental, human health and financial benefits. While a range of coverage values considered adequate for pest control have been reported in the literature [28,29], no relationship with insect control effectiveness has been demonstrated yet.
The current work aimed at evaluating the control effectiveness against the grape berry moth by two different spray technologies and volume rates, resulting in 50% and 75% reduction compared to the current practice. Experiments were carried out in three different grape varieties and at two representative crop stages, BBCH 65 and BBCH 85 [30], over two consecutive years in mountain vineyards in the Mediterranean island of Cyprus.

2. Materials and Methods

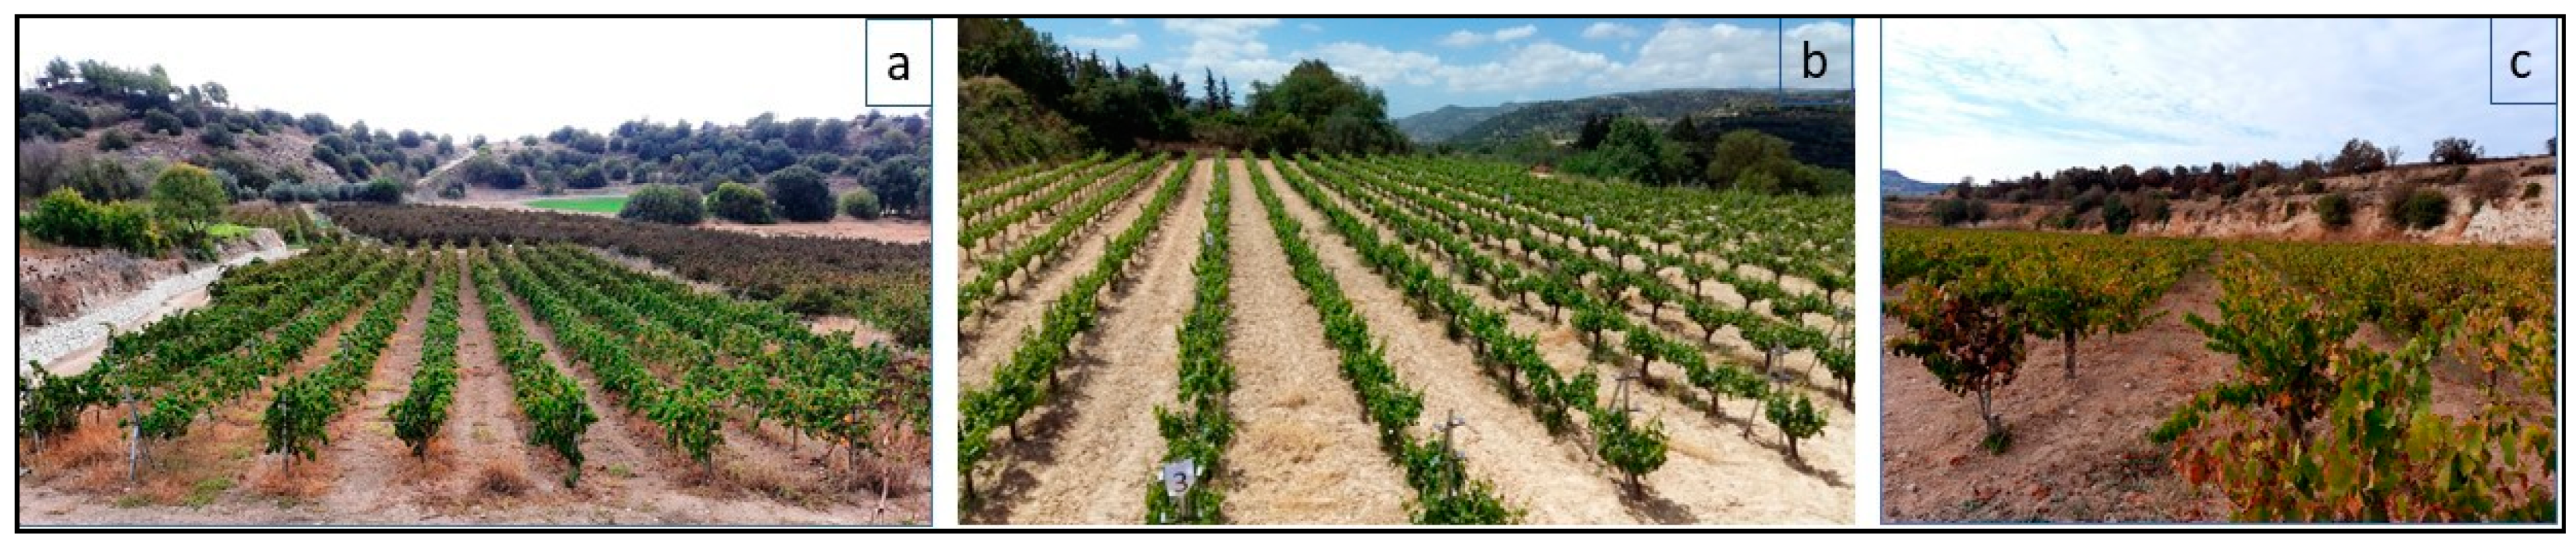
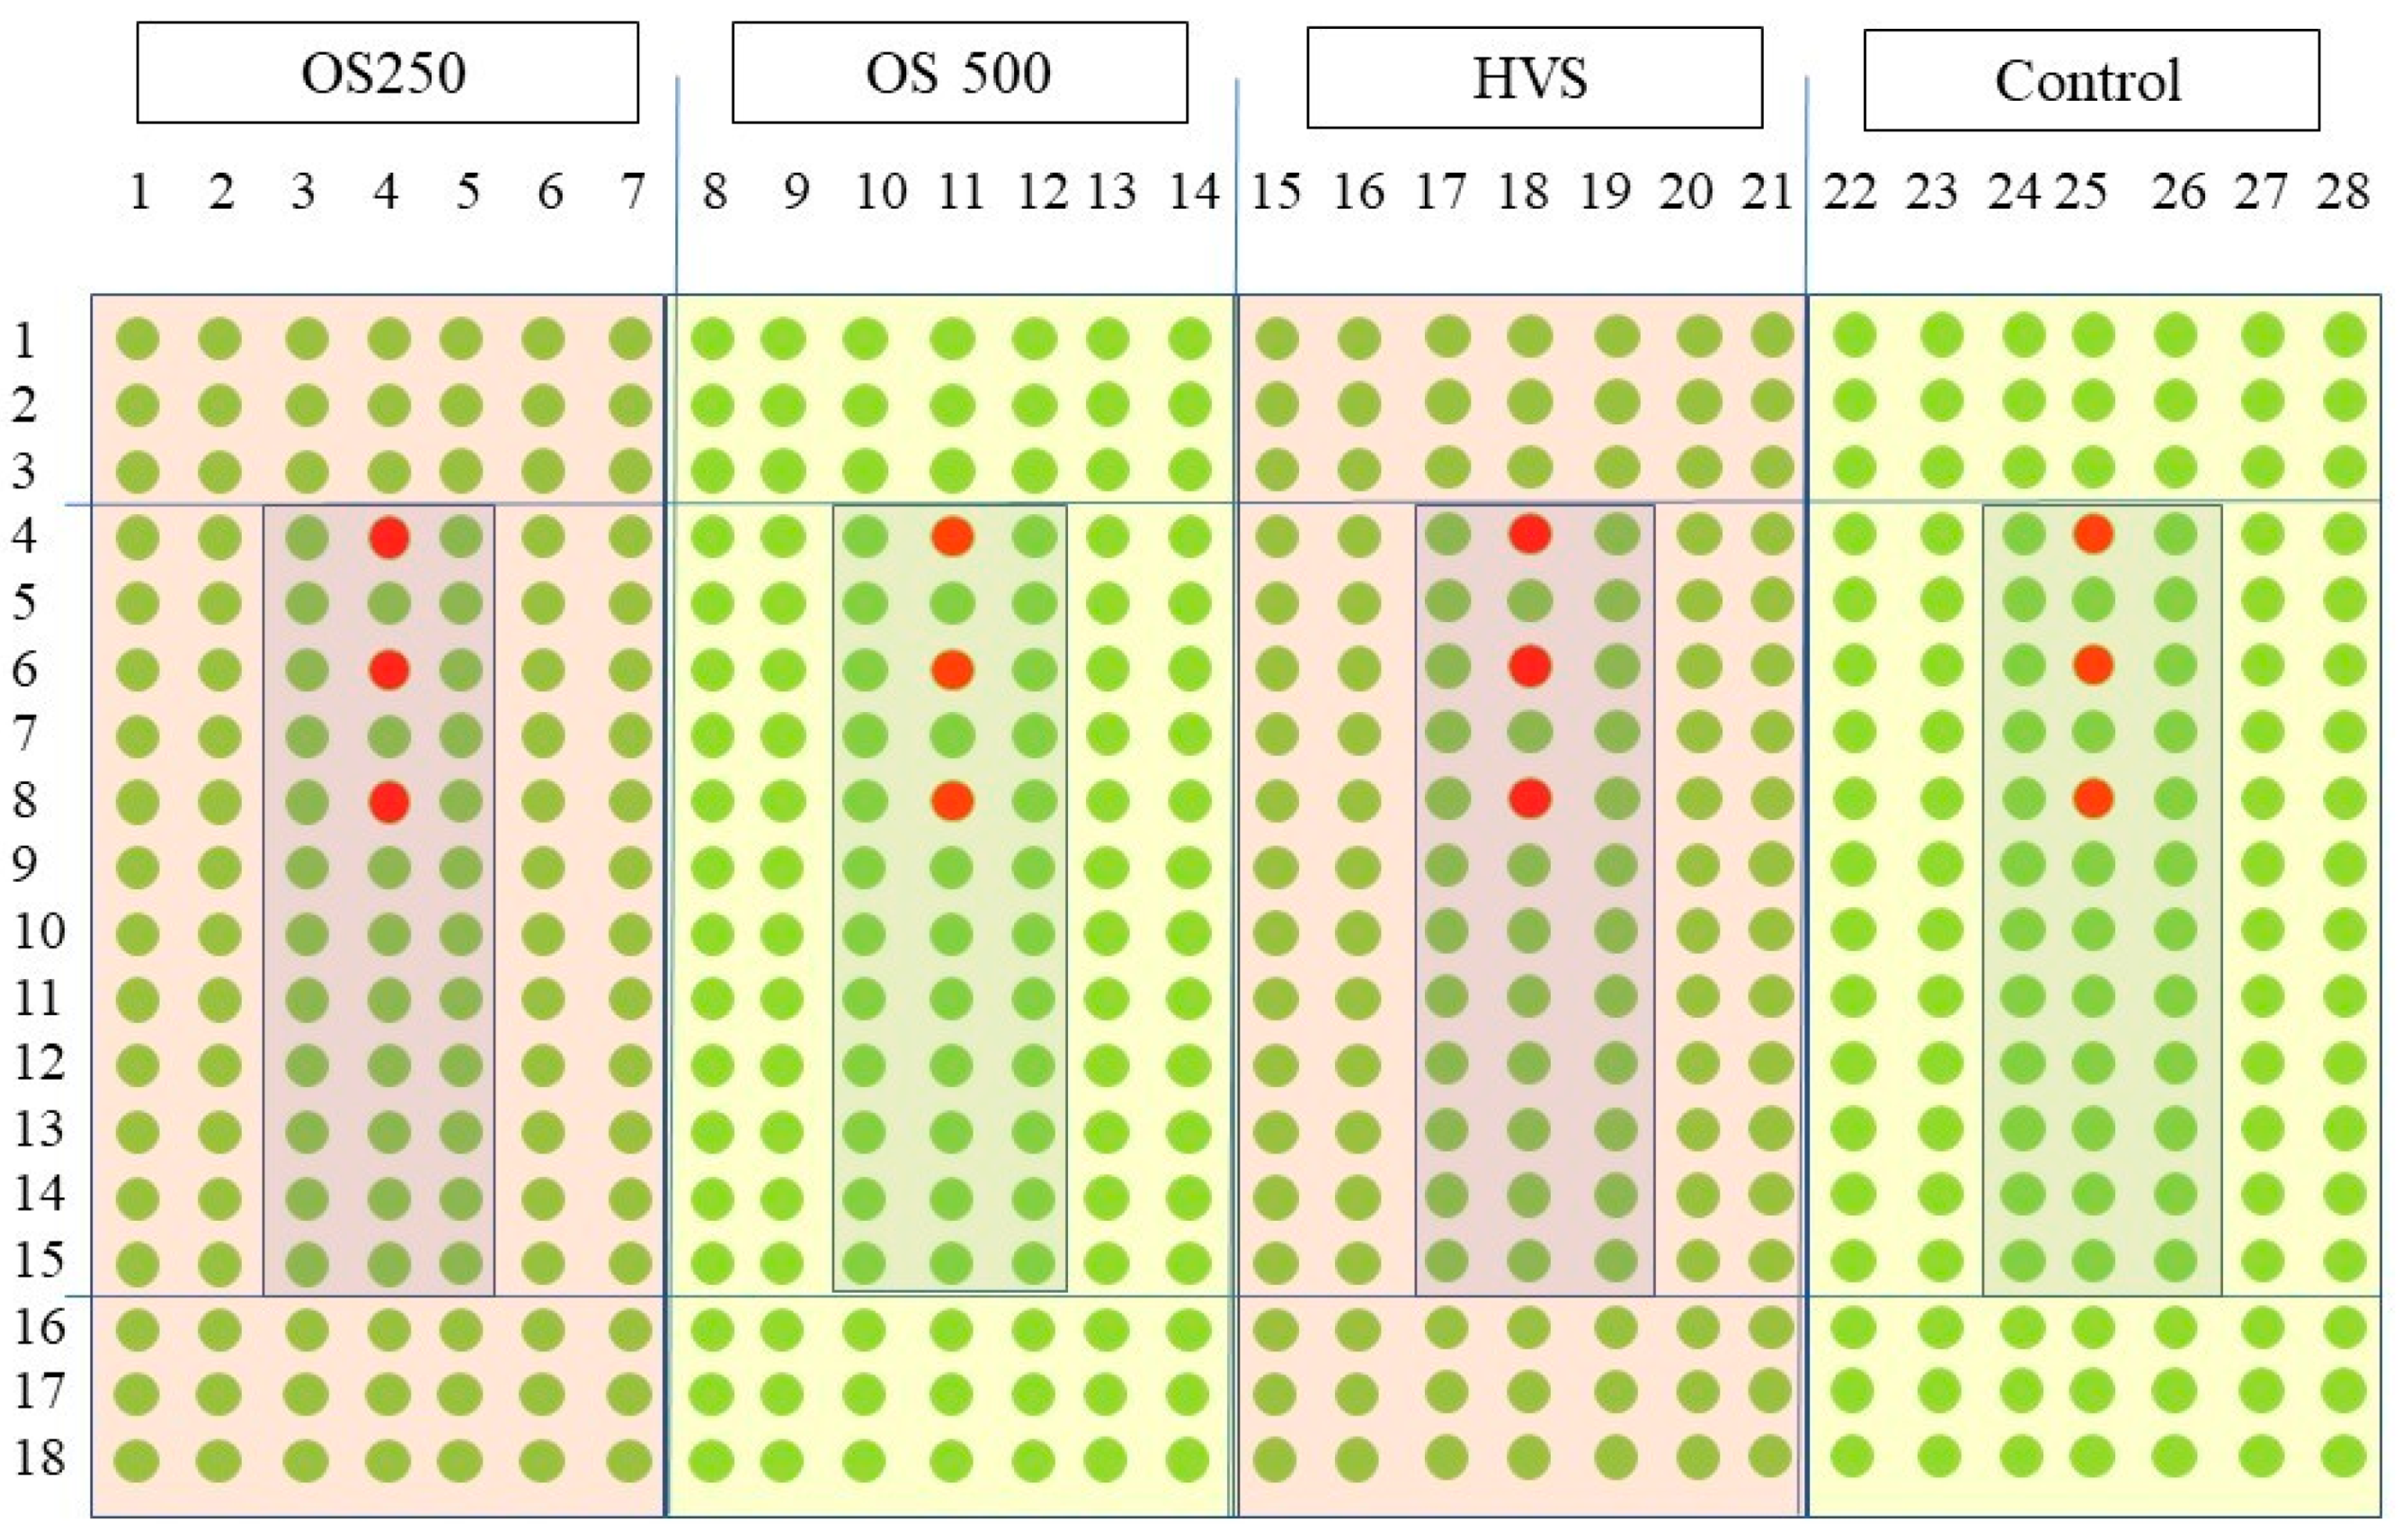
2.1. Study Vineyard and Experimental Design
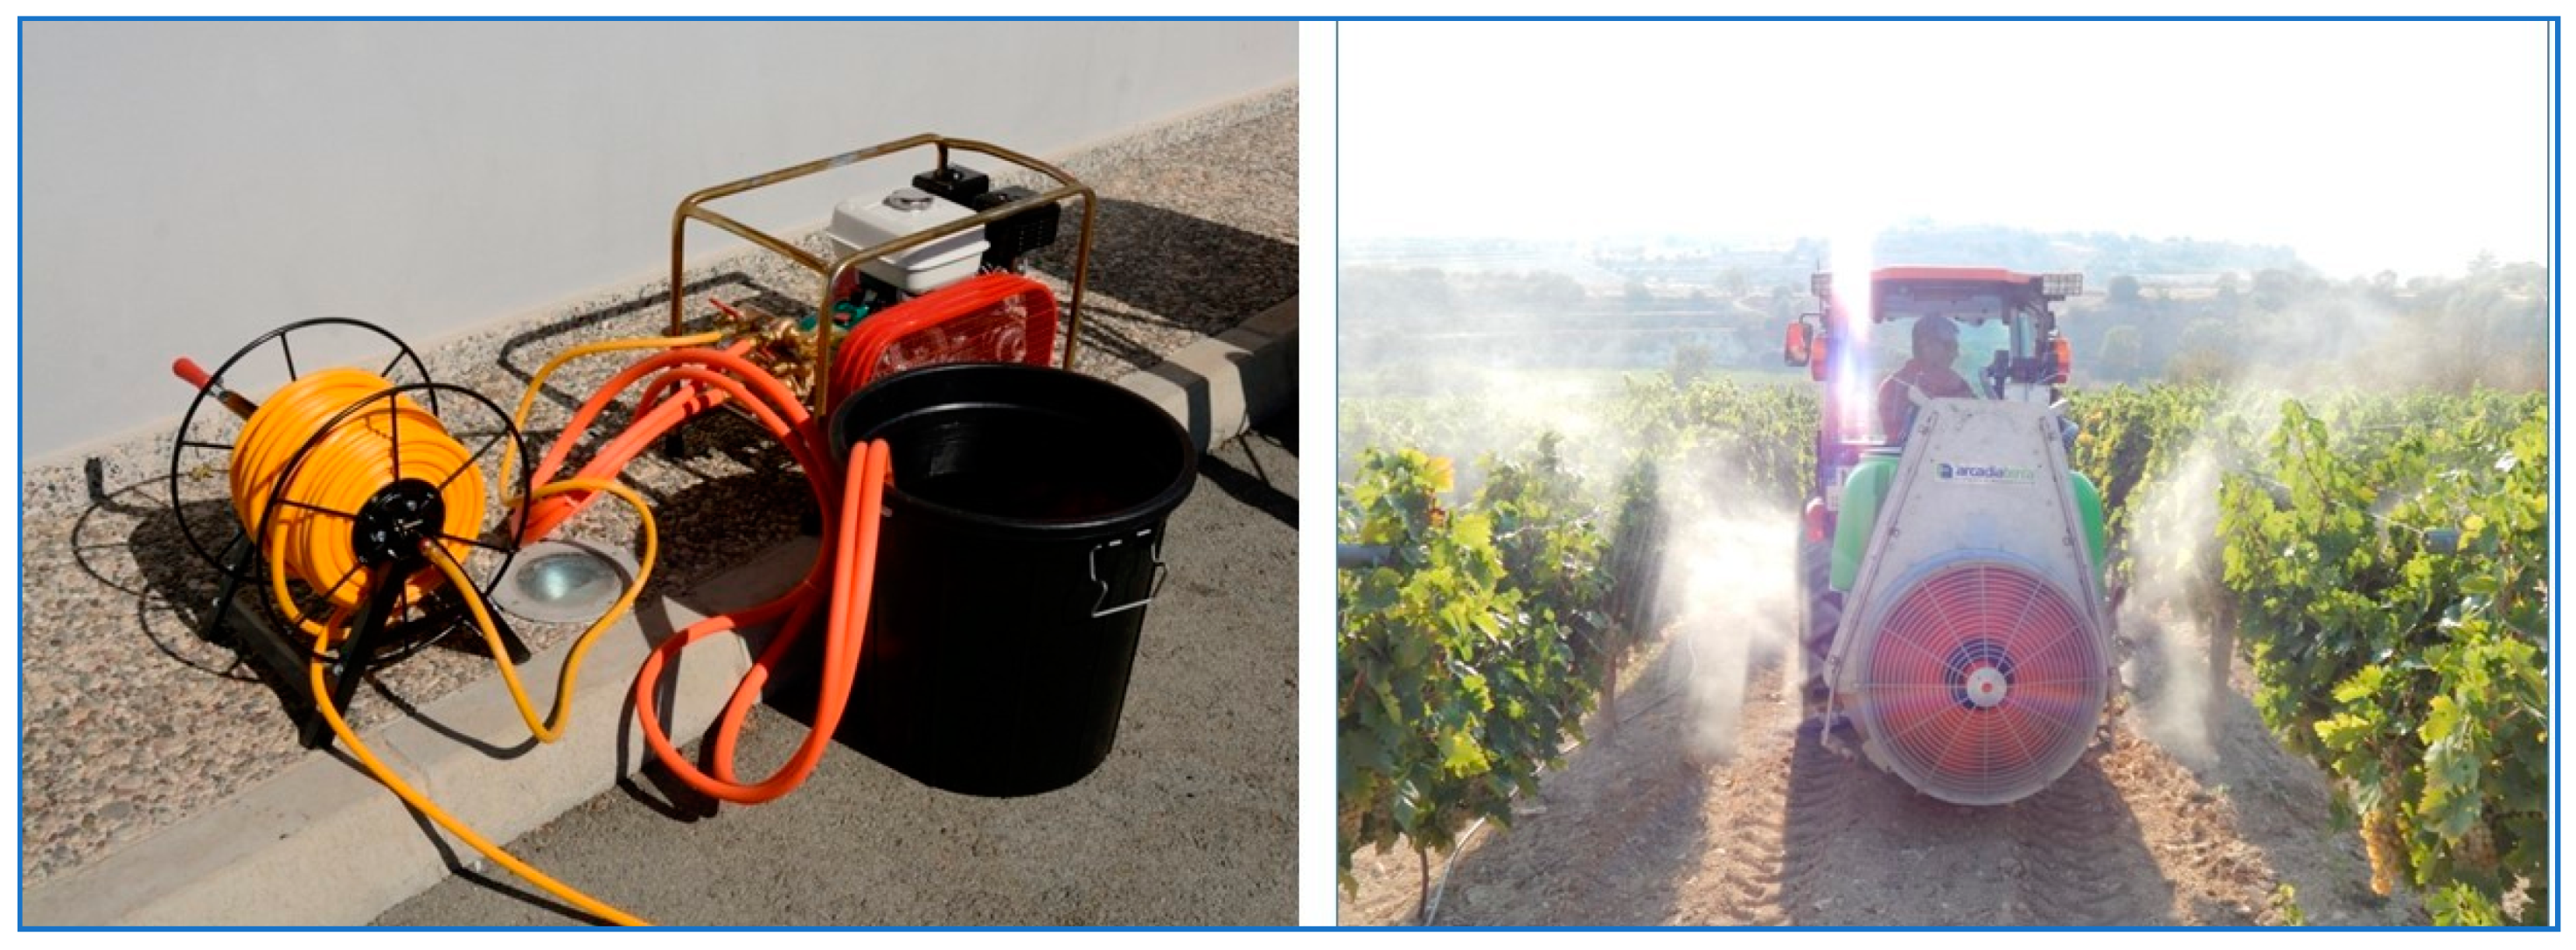
The study was conducted in 2017 and 2018 in three different vineyards (Figure 1).
The characteristics of each vineyard are shown in Table 1. The three vineyards were located in Lemona village, Paphos, Cyprus (latitude 34.5101°: longitude 32.3300°, altitude: 260 m). Each vineyard was planted with a different wine grape variety: Palomino, Carignan and Xynisteri (Table 1). “Palomino” is a white variety grown mostly in Spain, France and South Africa, but is also found elsewhere, such as Australia and California (USA) [31]. “Xynisteri” is a popular indigenous white variety, known for its resistance to drought [32] which takes up 33% of the vineyard area of the island [33]. “Carignan” is a red variety of Spanish origin that is planted around the globe due to its high yield [31].
Each vineyard was divided in four equal parcels, and each parcel was assigned to each of the three sprayer treatments and a non-sprayed control. Seven rows × 18 plants per treatment were selected for the Palomino and Xynisteri varieties while for the Carignan variety each parcel comprised seven rows × 50 plants (Figure 2). The number of plants per row was dictated by the shape and size of each vineyard, and was not expected to influence either pest damage or the results of the work.

2.2. Sprayers Used

The following combinations of sprayers and volume rates were evaluated (Figure 3):
  • A high-volume sprayer (HVS) with spray gun (Honda GX 120, Hamamatsu, Japan) equipped with a 4.0 HP engine, with a hose length of 100 m, calibrated at a nominal volume of 1000 L ha−1. The HVS sprayer represents the current standard practice of grape farmers in Cyprus and in several other parts of the world.
  • A conventional orchard sprayer (OS) equipped with a vertical tower (Arcadia Terra, Model Cronos, Greece) calibrated at a nominal volume of 500 L ha−1 (OS500), or 50% reduction compared to the HVS treatment.
  • The same conventional orchard sprayer calibrated at a nominal volume of 250 L ha−1 (OS250), or 75% reduction compare to the HVS treatment.
  • An untreated control.
For OS500, the sprayer was calibrated using six nozzles, three per side, type TXR 80028VK (TeeJet Technologies, Springfield, IL, USA) set at a pressure of 5.0 bar and a tractor speed of 4 km h−1, resulting in a flow rate of 1.38 L min−1 and a total spray volume of 518 L ha−1. For OS250, the orchard sprayer was calibrated using six nozzles, three per side, type TXR 80015VK (TeeJet Technologies, Springfield, IL, USA) at the same pressure and tractor speed as OS500 and a flow rate of 0.75 L min−1, which resulted in a spray volume of 281 L ha−1.
For the HVS treatment the pressure was set at 20 bar. The walking speed of the operator handling the spray gun was 3.5 km h−1, which resulted in a spray volume of 1086 L ha−1.
For all treatments spray applications were made to both sides of each treated row, by the same person–sprayer, at the same speed and using the same technique. During spraying, the environmental conditions (air temperature and relative humidity (RH), wind speed and direction) were measured by a WatchDog 2000 Series Weather Station (Spectrum Technologies, Aurora, IL, USA) to comply with best management practices recommended for safe spray application [34]. The station was placed at a height of 2.0 m from the ground, at a position free from obstacles.

2.3. Determination of Spray Coverage on Leaves

Spray coverage was evaluated on 24 May 2017 at the BBCH 65 stage (full flowering: 50% of flowerhoods fallen) and on 14 August 2017 at the BBCH 85 stage (softening of berries). Prior to spray application, rectangular water-sensitive paper (WSP) strips (26 × 76 mm) (Syngenta, Basel, Switzerland) were placed (stapled) on the upper side of the leaves of three vine-replicates per treatment located in the middle (fourth) row, on vines 4, 6 and 8. Nine water-sensitive papers were positioned and collected from each vine (Figure 4), representing nine different zones: three heights (top, middle and bottom of the canopy) × three depths (outer left, center and outer right side) following ISO 22522 [35].
Subsequently, there were three positions on the left side of the vine, three in the middle and three on the right side, that resulted in a total of nine zones, covering the whole canopy. Once the spray residues dried out, the WSPs were collected from the vines and transferred to the laboratory to quantify spray coverage. The spray coverage of water-sensitive papers was analyzed using the software ImageJ [36]. The images were taken at a resolution of 24 pixels·mm−1 and the WSP coverage (percentage of surface covered by droplets) was calculated. While the pest attacks grape flowers and berries, we opted to evaluate spray coverage on leaves only, adopting a generally accepted methodology (e.g., 6, 10, 35), as previous work has shown that coverage of leaves and bunches is similar [13].

2.4. Pesticide Applications against the Grape Berry Moth

The timing of spraying against the grape berry moth was determined following recommendations by the Department of Agriculture of Cyprus, based on captures of male moths in pheromone traps placed in selected vineyards of the region from early March through late September. The traps were checked weekly and agricultural announcements were issued accordingly.
The dates of insecticide applications for grape berry moth management and the active ingredient dose as indicated on the pesticide label are shown in Table 2. In total, four insecticide applications were applied for grape berry moth management each year. For most sprayings, fungicides were also added in the spray tank to protect against powdery mildew (Uncinula necator) following common practice and the recommendations by the Department of Agriculture of Cyprus.

2.5. Assessment of Infestations by the Grape Berry Moth

For the evaluation of grape berry moth infestations, 20 bunches per treatment were collected at harvest and the number of infested and uninfested berries per cluster were recorded. Each grape bunch was collected from a separate vine from the middle rows (three to five) of each parcel, leaving at least three vines on the row and two guard rows between parcels. The same vines were sampled on years 1 and 2 of the study.

2.6. Statistical Analyses

All statistical analyses were carried out in the open-source R language and environment for statistical computing [37]. Data were curated in dplyr [38] and plotted in ggplot2 [39].
Statistical analyses were carried out separately for each variety. The data on spray coverage of WSPs and berry infestation by L. botrana were analysed in a generalized linear mixed effects model framework using the packages glmmTMB (function glmmTMB) [40] for coverage and lme4 (function glmer) [41] for berry infestation.
Both packages allow for the analysis of proportion data using a logit link, and a betabinomial (glmmTMB) or binomial (glmer) distribution. Preliminary data analyses showed that the coverage data were over-dispersed, with substantially greater variation than that predicted by the binomial model, and the extra-binomial variation was modelled using the betabinomial distribution. For the glmer models, we used the bobyqa optimization with the maximum number of function evaluations set to 109 to achieve model convergence. Dispersion for the glmer models was estimated using the function dispersion_glmer of the blmeco package [42]. Model diagnostics were performed in the DHARMa package [43] using the function simulateResiduals. The function runs tests for correct distribution (KS test), dispersion and residuals.
A likelihood ratio test was used to test for the effects of treatments by comparing the full model to a simpler model with the effect removed using the function drop1 of the stats package of R. For the coverage data, the full model included as main effects sprayer (HVS, OS500, OS250) and vine growth stage (BBCH 65 or BBCH 85), as well as the interaction between sprayer and vine growth stage. For the L. botrana infestation data the full model included as main effects sprayer (Control, HVS, OS500, OS250) and year (year 1, year 2) as well as the interaction between sprayer and year. For both coverage and infestation data, vine was included as a random factor in the models, to account for the potential correlation of measurements from the same vine. Comparisons among treatment means were carried out using the emmeans package [44] with the function emmeans.

3. Results

3.1. Environmental Conditions during the Spraying Trials

Temperature ranged from 23.3 to 26.8 °C and wind speed was zero with the exception of Carignan at BBCH 85 (0.1 ms−1). Relative humidity ranged between 44% to 50% for the BBCH 65 sprayings and from 15% to 18% for BBCH 85.

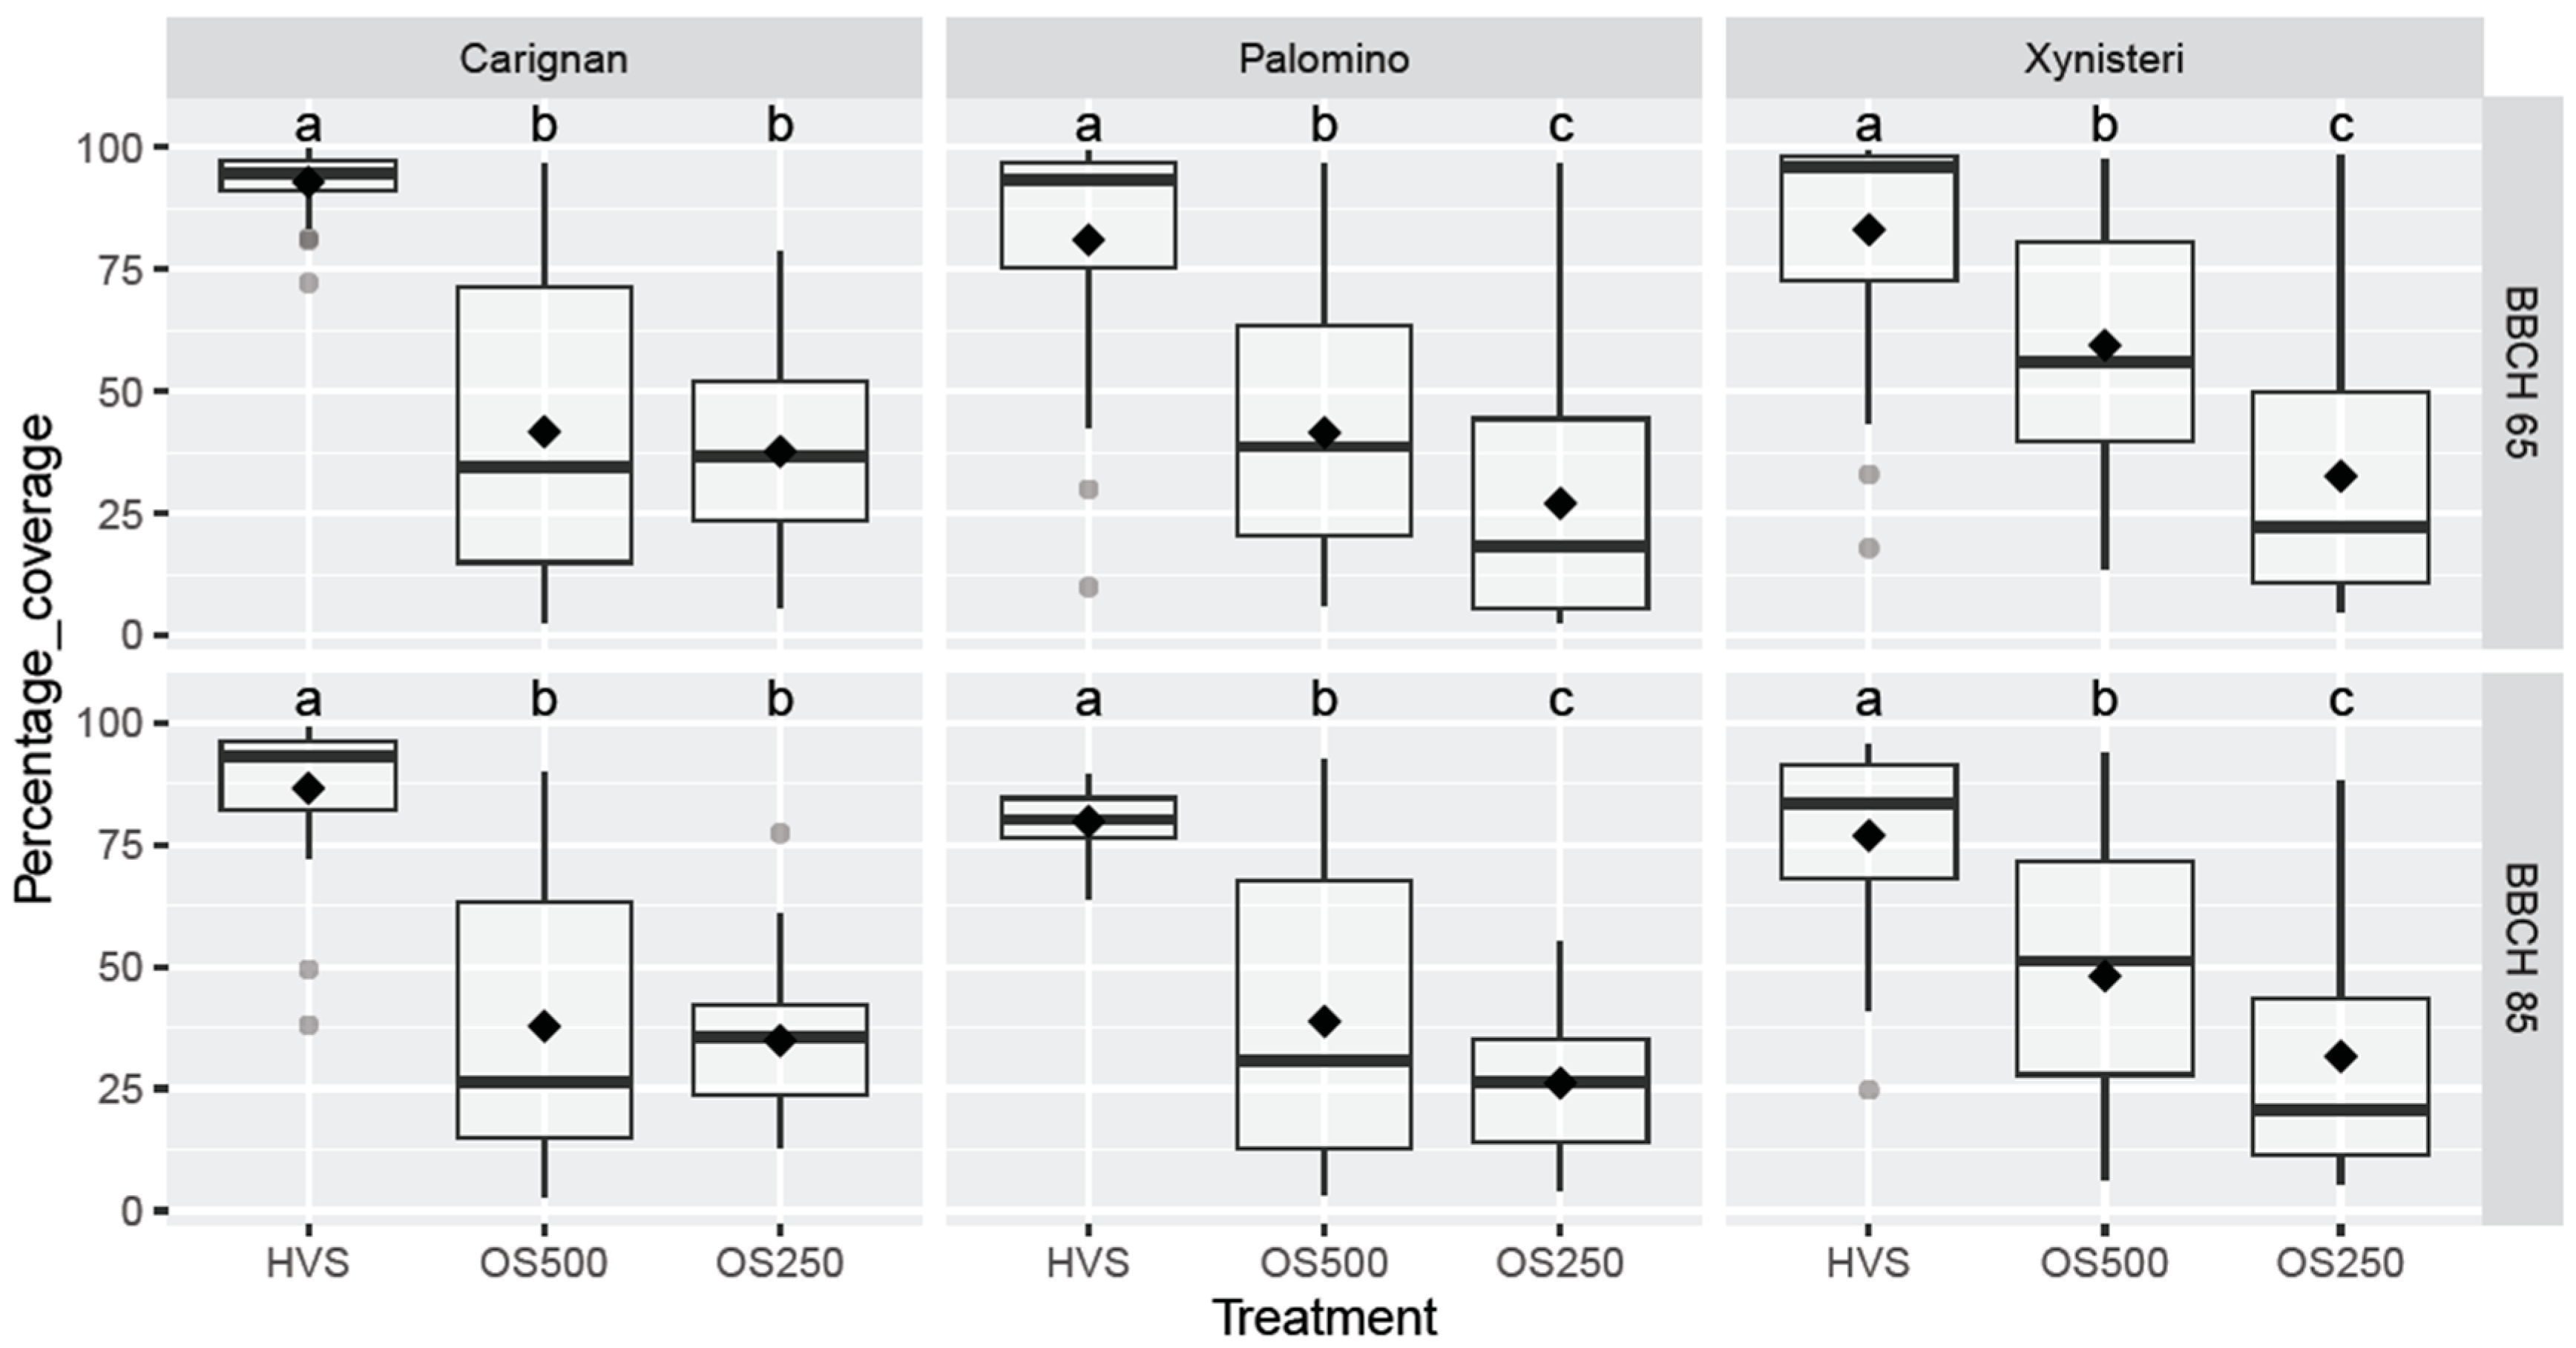
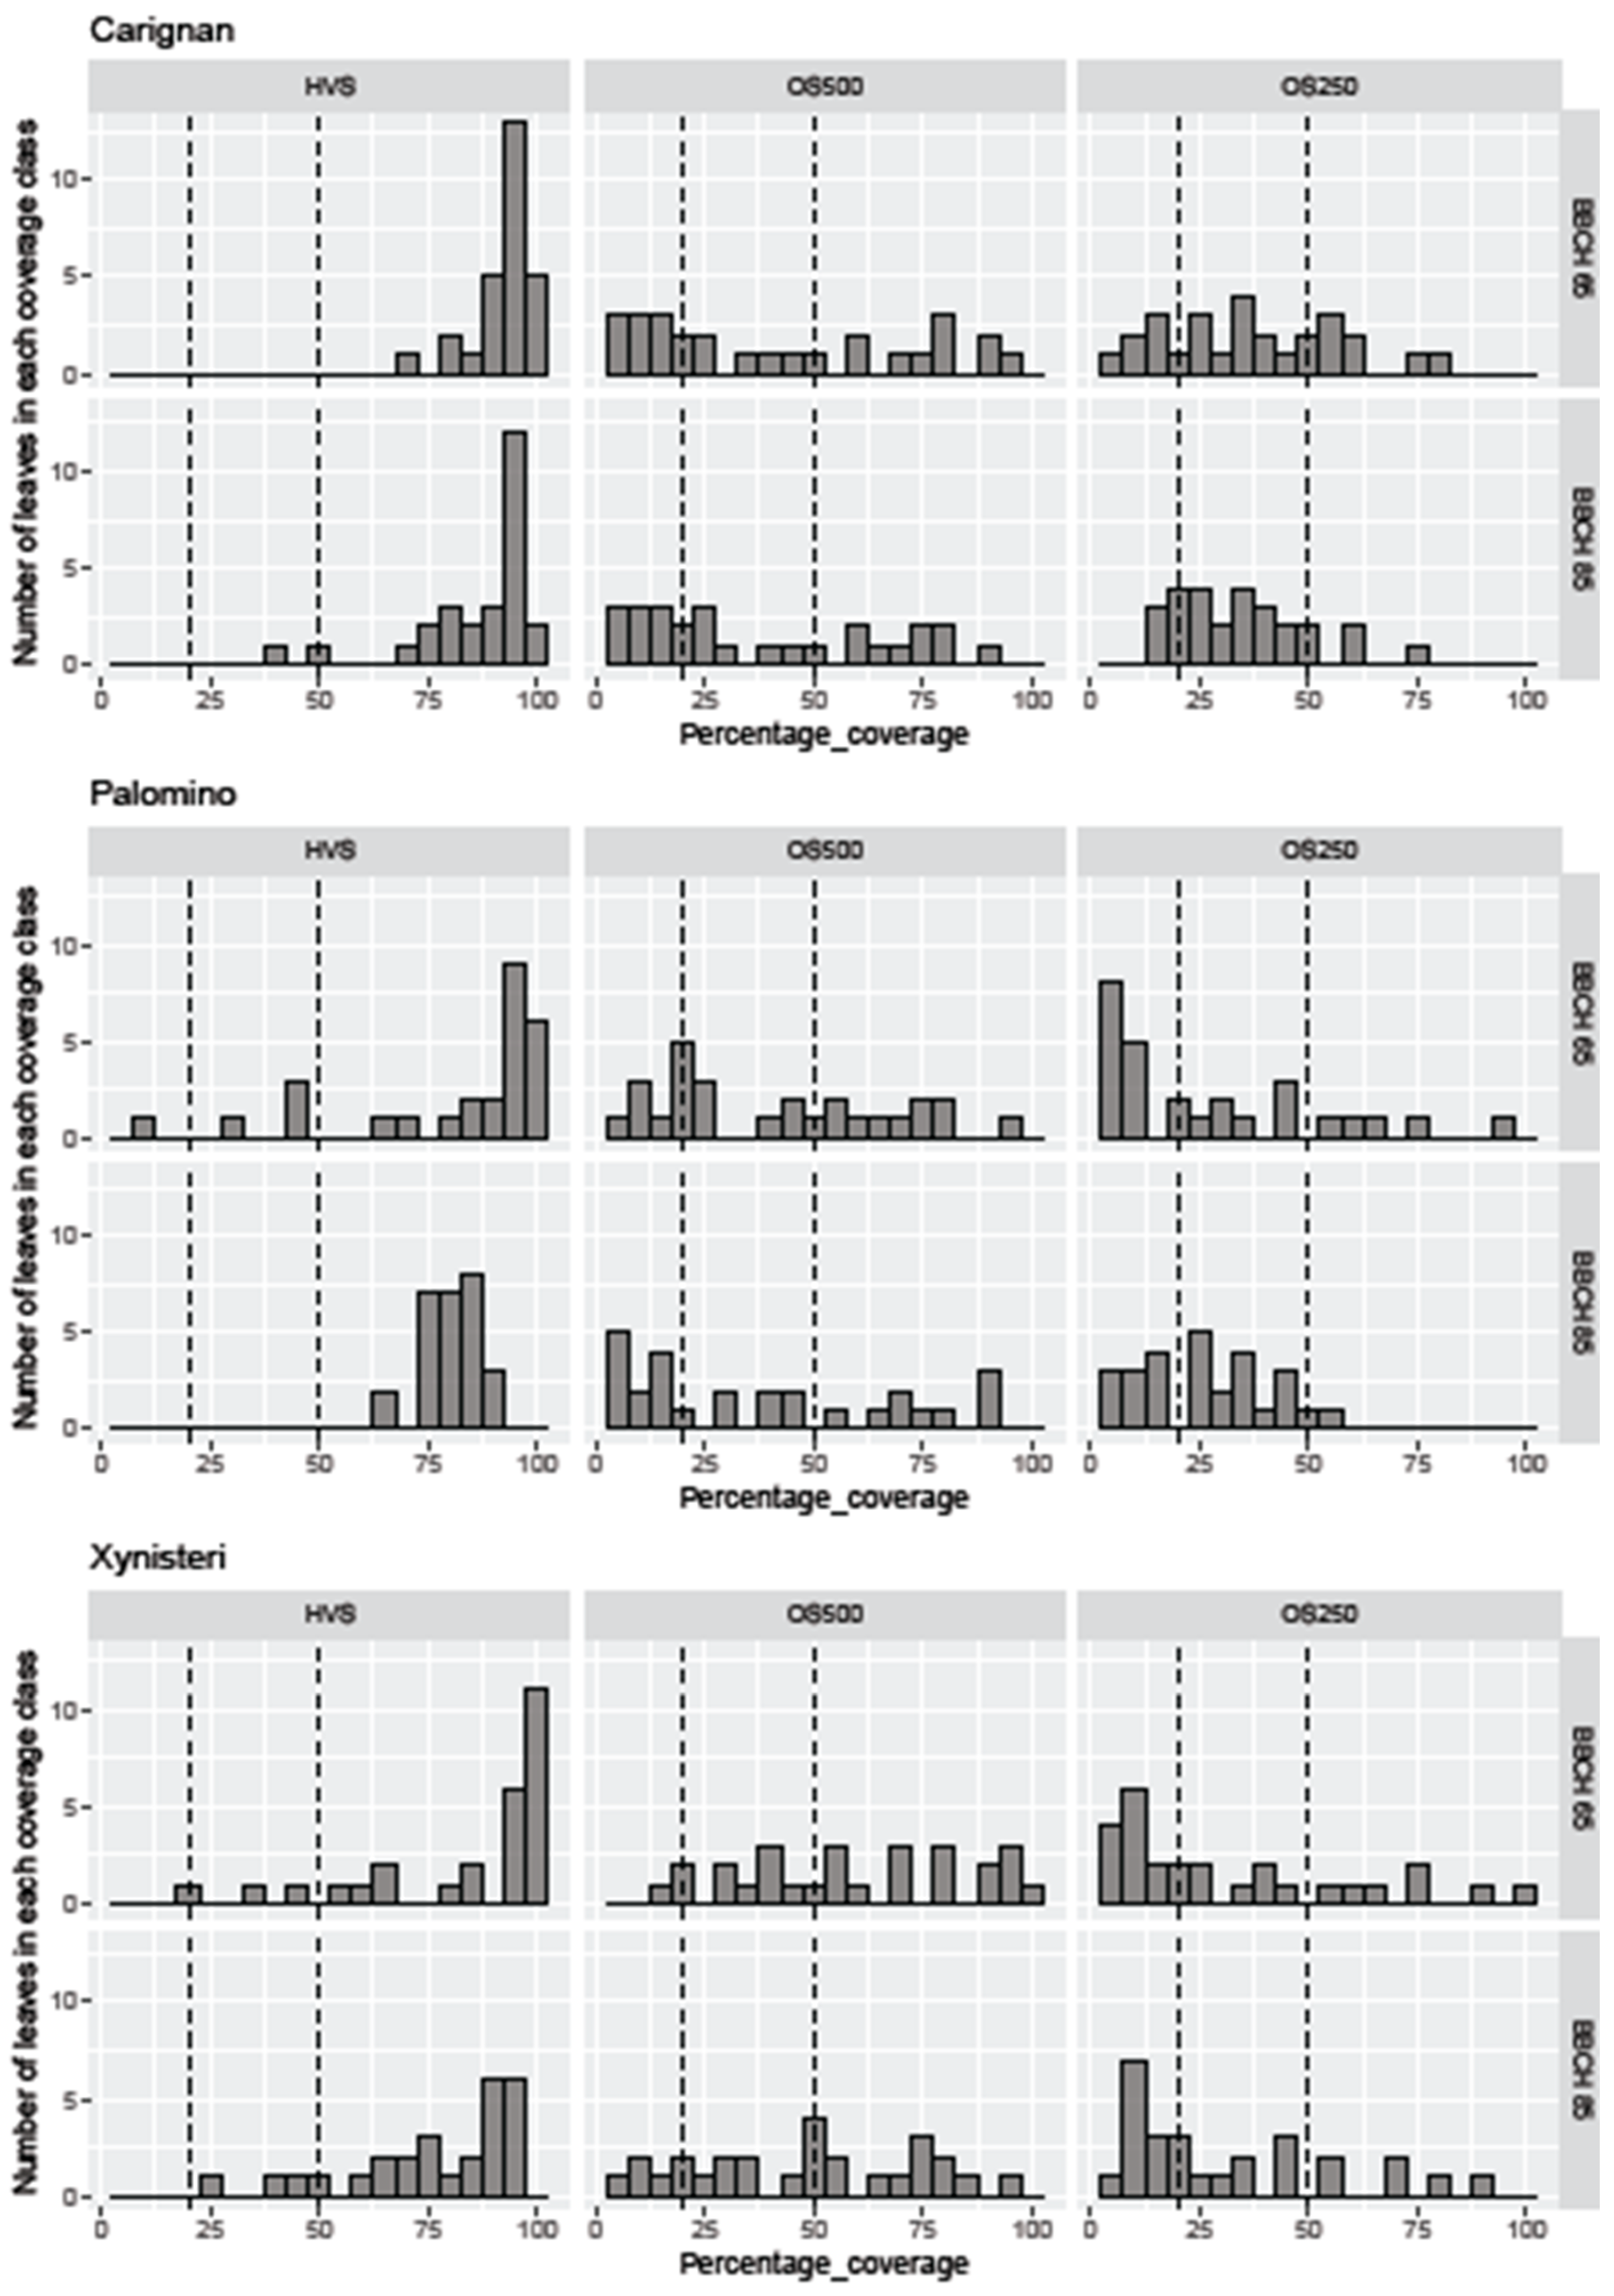
3.2. Coverage of Water-Sensitive Papers

The assessment of spray coverage of WSPs placed on leaves was carried out twice in the first year (2017), at the BBCH 65 stage (full flowering) and at the BBCH 85 stage (berries start to soften).
The model diagnostics showed that the models for coverage for Carignan and Xynisteri fitted the data well. In the model for Palomino, the p-value for the dispersion test was 0.03, indicating a potentially higher dispersion than what modelled through the use of the betabinomial distribution. Visual examination of the quantile-quantile plot of observed vs. expected values did not reveal a major overdispersion pattern.
The main effect for sprayer treatment was significant for all three varieties, while the interaction between sprayer treatment and vine stage was not significant for any of the varieties (Table 3). The main effect for vine stage was significant only for Xynisteri with a p-value at 0.02. The overdispersion parameter for the betabinomial distribution ranged from 3.09 for Xynisteri to 4.79 for Palomino. The standard deviation for the random effect for vine was 0.28 for Carignan, and practically zero for the other two varieties.
The highest coverage was observed for HVS for all three varieties, with median coverage ranging from 80% to 96% (Figure 5). Coverage for OS500 varied from 26% to 56%, while that for OS250 from 18% to 37%. Spraying with the HVS resulted in significantly higher coverage than the other two sprayers for all varieties and vine growth stages (Figure 5). OS500 coverage was in general higher than that for OS250, with differences being significant for Palomino and Xynisteri only. Mean coverage was in general higher at BBCH 65 than at BBCH 85, but the difference was significant only for Xynisteri (Table 3).
HVS spraying resulted in spray coverage higher than 50% for virtually all leaves of the three varieties. Spraying with OS500 and OS250 resulted in more leaves falling in the 20–50% coverage class, which is considered adequate [28]. In general, however, coverage for most leaves (with the exception of OS250 in Carignan) fell outside the 20–50% class (Figure 6).

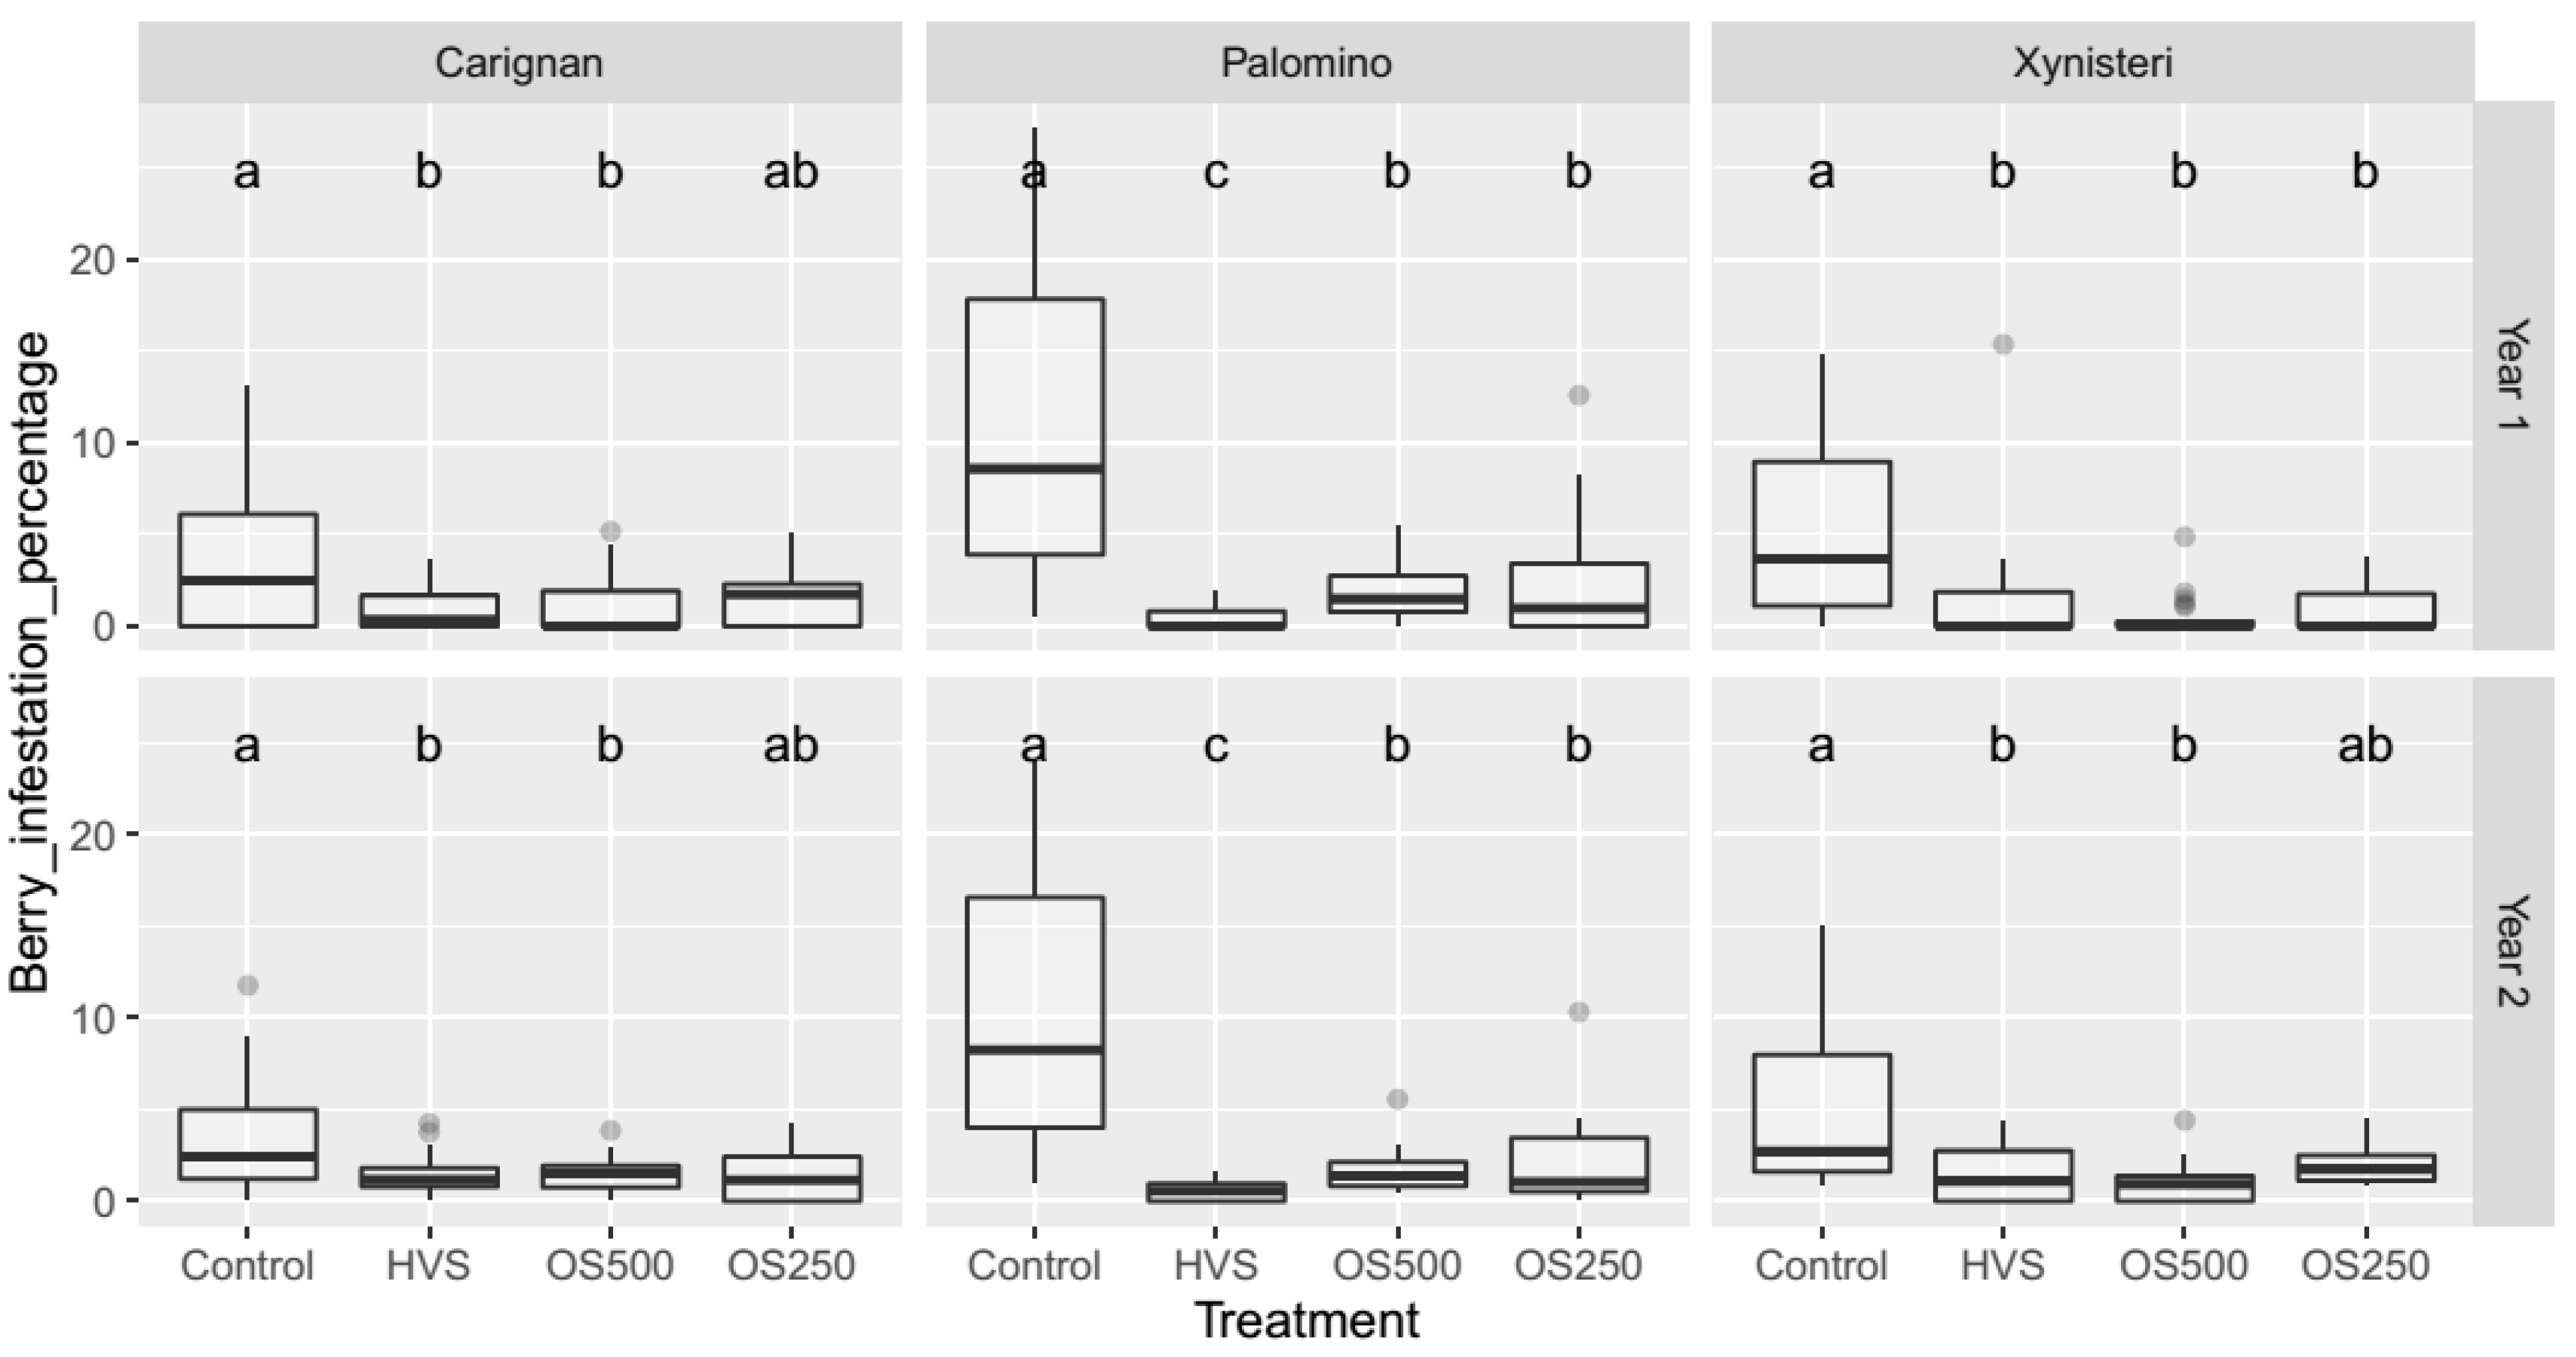
3.3. Infestation by the Grape Berry Moth

Model diagnostics showed that the models for the three varieties fitted the data well (data not shown). The interaction between sprayer and year was significant for Xynisteri but not for Carignan or Palomino (Table 4). For all three varieties there was a significant effect for sprayer, and a non-significant effect for year. The dispersion parameter for the models was about 0.85, and the random effect for vine ranged from 0.71 to 0.86 (Table 4).
In Carignan, the median infestation percentage for the Control remained around 2.5% for both study years (Figure 7). The infestation percentage for bunches from sprayed vines remained below 1.2%, 1.5% and 1.8% for HVS, OS500 and OS250, respectively. Differences were statistically significant between Control and HVS, or OS500. The OS250 treatment did not differ significantly from either control, or the other two treatments.
For Palomino, the median infestation percentage for the Control was slightly higher than 8% for both study years, which was significantly higher than that in all other treatments (Figure 7). On both years of the study, the infestation percentage remained below 0.6%, 1.5% and 1.1% for HVS, OS500 and OS250, respectively. The infestation percentage in the HVS treatment was significantly lower than that for the two OS treatments (Table 4). The infestation level was similar between OS500 and OS250.
Infestation levels of grapes in the Control for Xynisteri were estimated at 3.7% for year 1 and 2.7% for year 2 (Figure 7). The infestation percentage remained below 1.1%, 1.0% and 1.8% for HVS, OS500 and OS250, respectively, for both study years. In year 1, the infestation percentage was significantly higher in the control compared to the three sprayer treatments, with no significant differences between the three sprayers (Figure 7). In year 2, the infestation percentage was significantly higher in the control than HVS and OS500, while that for OS250 was intermediate and not significantly different to that of either the control or the other two treatments.
The percentage of reduction in the mean infestation by the grape berry moth is shown in Table 5. The percentage reduction in damage ranged from about 55% to 95% percent (Table 5).

4. Discussion

The current work investigated the effect of sprayer/volume rate on the infestation of grapes by the grape berry moth, Lobesia botrana.
The median coverage percentage for HVS remained above 80% for all three varieties (Figure 5). The median coverage percentage for OS500 ranged from 26 to 56%, while that for OS250 from 18 to 37%. The general trend of higher coverage for HVS than OS500 or OS250 was expected because of the higher volume of spray liquid applied with each sprayer (Table 3). Manktelow et al. [45] showed that as the application volume increases, so does the absolute leaf deposit.
In the Michael et al. study [46] the HVS resulted in the highest leaf deposit, followed by OS500 and OS250 in both a goblet and a trellis system. The deposition for the goblet training system was about 50% lower than that for the trellis system for all sprayers. Interestingly, the leaf deposit on leaves of vines trained as goblets was similar between OS500 and OS250, a finding corroborated by the coverage results for the goblet-trained Carignan in the current work.
Spray coverage between 20–50% is considered as adequate [28], while coverage percentages beyond 50% can be defined as overspray. HVS led to coverage higher than 50% for virtually all leaves (Figure 6) of the three varieties. In contrast, the coverage pattern for OS500 and OS250 differed between the three varieties. The two sprayers resulted in similar median coverage in Carignan, which was close to 30% (Figure 5). In Palomino and Xynisteri, the median coverage for OS250 was consistently below 30%, and was significantly lower than that for OS500 (Figure 5 and Figure 6). Yet, in general, coverage for most leaves (with the exception of OS250 in Carignan) fell outside the 20–50% class. A positive feature of the very high coverage by the HVS is the low variability in coverage among leaves (Figure 6). Aiming for lower volumes, decreases mean coverage, which inevitably leads to higher variability. Further work needs to assess in more detail the potential effects of coverage variability on the grape bunches in pest control.
Differences in coverage between the two vine growth stages were small for all three varieties, even though there was a significant effect for stage for Xynisteri with a p-value at 0.02 (Figure 5). Xynisteri has a more vigorous plant growth and dense foliage than Palomino, the other trellised variety in the study.
Infestation by the grape berry moth varied between the three varieties, from about 2.5% for Palomino, to 8% for Carignan and around 3.2% for Xynisteri for both study years (Figure 7). Spraying with HVS or OS500 decreased significantly the infestation damage by the grape berry moth for all three varieties (Figure 7). In contrast, OS250 spraying gave mixed results, as it was not different to either the Control or OS500 in both years in Carignan, and in year 2 in Xynisteri. On all other occasions, infestation of berries sprayed with OS250 was significantly lower than berries in the Control.
The mixed results for OS250 suggest that under some circumstances, 250 L ha−1 might not provide adequate levels of control. However, because of the relatively low levels of infestation by the grape berry moth in control plots (around 2.5% for Carignan and 3.2% for Xynisteri), further work is needed to establish the effectiveness of the different treatments under higher infestation pressure, especially for Carignan and Xynisteri. In addition, even though there was a different pattern of statistical differences depending on the variety, the infestation percentage between different sprayer treatments did not differ by more than one percentage point (Figure 7).
Not many authors have investigated the influence of sprayer type and water volume on control of insect pests in vineyards. Wise et al. [11] tested coverage of three different volumes with an airblast sprayer at 187, 468 and 935 L ha−1. Coverage at 468 L ha−1 was higher compared to 187 L ha−1, with intermediate coverage at 935 L ha−1. The two lower volumes were evaluated for their effectiveness against the grape berry moth. Control of the moth was better at 468 L ha−1 compared to 187 L ha−1.
Viret et al. [27] tested six different spraying technologies regarding deposition and management of powdery mildew over two years in a flat area as well as in a steep vineyard on large experimental plots compared to unsprayed controls. The best disease control was achieved with the axial fan sprayer working every second row before bloom and each row after bloom and with the knapsack sprayer, both calibrated at 400 L ha−1. Also, it was shown that control of powdery mildew was better when the deposit was more even on both leaf sides.
Gil et al. [6] evaluated deposition, uniformity and control of different diseases at different crop stages by comparing the volume rate applied according to DOSAVIÑA® with the conventional rate most generally used by farmers. The volume rate was reduced by an average 39.9% for DOSAVIÑA®, with similar or even higher values of deposition and uniformity. The resulting reduction in pesticide use (average 53%) did not present any difference in disease control for the selected varieties.
The reduction in spray volume achieved through the use of modern spray technologies, such as air-assisted orchard sprayers, results in a proportional reduction of pesticide amount, given that coverage is adequate [28]. Spray volume reduction provides a relatively straightforward way to achieve a 50% reduction in pesticide use by 2030, the arguably ambitious target of the Farm to Fork Strategy [1]. However, as doses of most pesticides in the EU are based on kg of active ingredient per ha, lowering the spray volume without reducing the quantity of pesticide applied per ha does not decrease pesticide use. A further reduction in pesticide use can be achieved via improving spray recommendations based on moth captures in traps to provide region/variety specific guidelines, as current recommendations in Cyprus are made at district level, which leads in some cases to potentially excessive spraying (Table 2).
As the registered and recommended product dosages against grapevine pests and diseases vary from country to country [47], the need for a harmonized approach from the crop protection industry is more than evident [48]. As indicated by Siegfried et al. [20], spray deposit is a key element for successful control of pest and diseases. Water is only the carrier of the pesticides to the leaf surface. A precise calculation of the active ingredient depending on the leaf surface should be carried out. Recently, an expert working group following one of the recommendations of the EPPO (European and Mediterranean Plant Protection Organization) [49] workshop on harmonized dose expression for the zonal evaluation of plant protection products in high-growing crops, established a glossary of terms and a guide for measurement of crop parameters. The two documents have been approved by the EPPO Working Party on Plant Protection Products in 2018 and will be used during the revision of the standard for dose expression [50].
Both the amount of pesticide and the applied volume during the spray application process should be calculated based on the canopy structure [14,19,26,51,52]. Decision support systems like DOSAVIÑA® [24,53] give the farmer the opportunity through a user-friendly web-based environment to calculate the optimal volume rate and pesticide dose taking into account various parameters, such as the working pressure, forward speed, number and types of nozzle. Further work needs to assess the pest control effectiveness of spray applications with volume rates based on the canopy volume of vines.

5. Conclusions

The current study showed the potential of achieving adequate control of the grape berry moth L. botrana with a volume of 500 L ha-1 or lower (Figure 7). Nonetheless, at high infestation levels there was a trend of slightly higher damage at lower application volumes (Palomino variety, Figure 7), suggesting that further work is needed to evaluated control effectiveness when pest pressure is high. The use of 1000 L ha−1 in high volume applications resulted in over-coverage of leaf surfaces, without a biologically meaningful improvement in pest control. Subsequently, the current work demonstrates that it is possible to lower pesticide use in vineyards by 50%, without compromising the effectiveness of grape berry moth control, in line with similar findings for vine disease control [6]. Lowering application volume to 250 L ha−1 resulted in non-significant differences in infestation levels from the control in two varieties, suggesting that further work is needed to establish the lowest volume and pesticide amount for sufficient control.
The present study used the same volume rate irrespective of the growth stage and canopy volume of the vines. Further reduction in pesticide use can be achieved via calibrating volume rate to canopy volume, using tools such as DOSAVIÑA® [24]. Future work needs to evaluate the effects of volume rate adjustment to pest control. Furthermore, more work needs to be directed towards assessing the impact of the distribution of coverage of plant surfaces on pest control, as lowering the spray volume leads to a higher variability in spray coverage, which could impact pest control effectiveness. Studies linking the pesticide dose needed to achieve adequate pest control in the laboratory, to pesticide coverage, deposition and control in the field, will further improve our understanding of the effects of volume rate reduction on pest control (e.g., [54]).

Author Contributions

Conceptualization, C.M., E.G. and M.C.S.; Data curation, C.M.; Formal analysis, M.C.S.; Funding acquisition, M.C.S.; Investigation, C.M.; Methodology, C.M. and E.G.; Project administration, M.C.S.; Resources, M.C.S.; Supervision, E.G. and M.C.S.; Validation, C.M. and M.C.S.; Visualization, C.M. and M.C.S.; Writing—original draft, C.M.; Writing—review and editing, E.G., M.G. and M.C.S. All authors have read and agreed to the published version of the manuscript.

Funding

This research received no external funding.

Institutional Review Board Statement

Not applicable.

Informed Consent Statement

Not applicable.

Data Availability Statement

Data available in a publicly accessible repository.

Acknowledgments

We acknowledge the support of the vinegrower Christos Christou, who willingly accepted the implementation of the trials in his vineyards. Special thanks to the Cyprus Crop Protection Association (CCPA) and its Director Andreas Krambias for its valuable assistance and guidance during the study.

Conflicts of Interest

The authors declare no conflict of interest.

References

  1. Farm to Fork Strategy. A Farm to Fork Strategy for a Fair, Healthy and Environmentally-Friendly Food System. Communication from the Commission to the European Parliament, the Council, the European Economic and Social Committee and the Committee of the Regions; COM/2020/381 Final. Available online: https://ec.europa.eu/food/sites/food/files/safety/docs/f2f_action-plan_2020_strategy-info_en.pdf (accessed on 15 October 2020).
  2. Directive 2009/128/EC of the European Parliament and of the Council of 21 October 2009 Establishing a Framework for Community Action to Achieve the Sustainable Use of Pesticides. OJ L 309/24/11/2009; pp. 71–86. Available online: https://eur-lex.europa.eu/legal-content/EN/ALL/?uri=celex%3A32009L0128 (accessed on 31 August 2020).
  3. Barzman, M.; Dachbrodt–Saaydeh, S. Comparative analysis of pesticide action plans in five European countries. Pest. Manag. Sci. 2011, 67, 1481–1485. [Google Scholar] [CrossRef] [PubMed]
  4. BTSF. Available online: https://ec.europa.eu/chafea/food/index_en.htm (accessed on 30 July 2019).
  5. Grella, M.; Gil, E.; Balsari, P.; Marucco, P.; Gallart, M. Advances in developing a new test method to assess spray drift potential from air blast sprayers. Sp. J. Agric. Res. 2017, 15, e0207. [Google Scholar] [CrossRef] [Green Version]
  6. Gil, E.; Llorens, J.; Landers, A.; Llop, J.; Giralt, L. Field validation of DOSAVIÑA, a decision support system to determine the optimal volume rate for pesticide application in vineyards. Eur. J. Agron. 2011, 35, 33–46. [Google Scholar] [CrossRef]
  7. Balsari, P.; Gil, E.; Marucco, P.; van de Zande, J.C.; Nuyttens, D.; Herbst, A.; Gallart, M. Field-crop-sprayer potential drift measured using test bench: Effects of boom height and nozzle type. Biosyst. Eng. 2017, 154, 3–13. [Google Scholar] [CrossRef] [Green Version]
  8. Pertot, I.; Caffi, T.; Rossi, V.; Mugnai, L.; Hoffmann, C.; Grando, M.S.; Gary, C.; Lafond, D.; Duso, C.; Thiery, D.; et al. A critical review of plant protection tools for reducing pesticide use on grapevine and new perspectives for the implementation of IPM in viticulture. Crop Prot. 2017, 97, 70–84. [Google Scholar] [CrossRef]
  9. Gil, E.; Escola, A.; Rosell, J.R.; Planas, S.; Val, L. Variable rate application of plant protection products in vineyard using ultrasonic sensors. Crop Prot. 2007, 26, 1287–1297. [Google Scholar] [CrossRef] [Green Version]
  10. Llorens, J.; Gil, E.; Llop, J.; Escola, A. Variable rate dosing in precision viticulture: Use of electronic devices to improve application efficiency. Crop Prot. 2010, 29, 239–248. [Google Scholar] [CrossRef] [Green Version]
  11. Wise, J.C.; Jenkins, P.E.; Schilder, A.M.C.; Vandervoort, C.; Isaacs, R. Sprayer type and water volume influence pesticide deposition and control of insect pests and diseases in juice grapes. Crop Prot. 2010, 29, 378–385. [Google Scholar] [CrossRef]
  12. Pascuzzi, S.; Cerruto, E.; Manetto, G. Foliar spray deposition in a “tendone” vineyard as affected by airflow rate, volume rate, and vegetative development. Crop Prot. 2017, 34–48. [Google Scholar] [CrossRef]
  13. Michael, C.; Gil, E.; Gallart, M.; Kanetis, L.; Stavirinides, M.C. Evaluating the effectiveness of low volume spray application using air-assisted knapsack sprayers in wine vineyards. Int. J. Pest. Manag. 2020. [Google Scholar] [CrossRef]
  14. Miranda-Fuentes, A.; Llorens, J.; Rodríguez-Lizana, A.; Cuenca, A.; Gil, E.; Blanco-Roldán, G.L.; Gil-Ribes, J.A. Assessing the optimal liquid volume to be sprayed on isolated olive trees according to their canopy volumes. Sci. Total Environ. 2016, 568, 296–305. [Google Scholar] [CrossRef]
  15. Landers, A. Improving spray deposition and reducing drift–Air flow adjustment is the answer. N. Y. Fruit Q. 2011, 19, 1–6. [Google Scholar]
  16. Celen, I.H.; Arin, S.; Durgut, M.R. The effect of the air blast sprayer speed on the chemical distribution in vineyard. Pak. J. Biol. Sc. 2008, 11, 1472–1476. [Google Scholar] [CrossRef] [PubMed]
  17. Ambrogetti, A.O.; Uliarte, E.M.; Montoya, M.A.; Haist, W.; Monte, R.F. del. Evaluation of a drift recovery panel for phytosanitary treatments in vineyards. Rev. Fac. Cienc. Agric. 2016, 48, 83–94. [Google Scholar]
  18. Pergher, G.; Gubiani, R.; Tonetto, G. Foliar deposition and pesticide losses from three air-assisted sprayers in a hedgerow vineyard. Crop Prot. 1997, 16, 25–33. [Google Scholar] [CrossRef]
  19. Cross, J.V.; Walklate, P.J.; Murray, R.A.; Richardson, G.M. Spray deposits and losses in different sized apple trees from an axial fan orchard sprayer: 1. Effects of spray liquid flow rate. Crop Prot. 2001, 20, 13–30. [Google Scholar] [CrossRef]
  20. Siegfried, W.; Viret, O.; Huber, B.; Wohlhauser, R. Dosage of plant protection products adapted to leaf area index in viticulture. Crop Prot. 2007, 26, 73–82. [Google Scholar] [CrossRef]
  21. Salcedo, R.; Llop, J.; Campos, J.; Michael, C.; Gallart, M.; Ortega, P.; Gil, E. Evaluation of leaf deposit quality between electrostatic and conventional multi-row sprayers in a trellised vineyard. Crop Prot. 2020, 127, 104964. [Google Scholar] [CrossRef]
  22. Jeongeun, K.; Seungwon, K.; Chanyoung, J.; Hyoung, I.S. Unmanned aerial vehicles in agriculture: A review of perspective of platform, control, and applications. IEEE Access. 2019, 1. [Google Scholar] [CrossRef]
  23. OIV-International Organization of Vine and Wine 2018. OIV Statistical Report on World Vitiviniculture; OIV: Paris, France, 2018. [Google Scholar]
  24. Gil, E.; Campos, J.; Ortega, P.; Llop, J.; Gras, A.; Armengol, E.; Salcedo, R.; & Gallart, M. DOSAVIÑA: Tool to calculate the optimal volume rate and pesticide amount in vineyard spray applications based on a modified leaf wall area method. Comp. Electron. Agric. 2019, 160, 117–130. [Google Scholar] [CrossRef]
  25. Fermaud, M.; Le Menn, R. Transmission of Botrytis cinerea to grapes by grape berry moth larvae. Phytopathology 1992, 82, 1393–1398. [Google Scholar] [CrossRef]
  26. Koch, H. How to achieve conformity with the dose expression and sprayer function in high crops. Bayer Cropsci. J. 2007, 60, 71–84. [Google Scholar]
  27. Viret, O.; Siegfried, W.; Holliger, E.; Raisigl, U. Comparison of spray deposits and efficacy against powdery mildew of aerial and ground-based spraying equipment in viticulture. Crop Prot. 2003, 22, 1023–1032. [Google Scholar] [CrossRef]
  28. Mangado, J.; Arazuri, S.; Arnal, P.; Jarén, C.; López, A. Measuring the accuracy of a pesticide treatment by an image analyzer. Proc. Technol. 2013, 8, 498–502. [Google Scholar] [CrossRef]
  29. Chen, Y.; Ozkan, H.E.; Zhu, H.; Derksen, R.C.; Krause, C.R. Spray deposition inside tree canopies from a newly developed variable-rate air-assisted sprayer. Trans. ASABE 2013, 56, 1263–1272. [Google Scholar] [CrossRef]
  30. Meier, U. BBCH-Monograph. Growth Stages of Plants—Entwicklungsstadien von Pflanzen—Estadios de las Plantas—Developpement des Plantes. Blackwell Wissenschaftsverlag, Berlin und Wien. 1997. 622p. Available online: https://0-link-springer-com.brum.beds.ac.uk/chapter/10.1007/978-94-007-0632-3_17 (accessed on 10 February 2021).
  31. Anderson, K.; Aryal, N. Database of Regional, National and Global Winegrape Bearing Areas by Variety, 2000 and 2010. Wine Econ. Res. Centre, University of Adelaide. 2013. Available online: https://www.adelaide.edu.au/wine-econ/databases/winegrapes/ (accessed on 30 July 2020).
  32. Chrysargiris, A.; Xylia, P.; Litskas, V.; Stavrinides, M.; Heyman, L.; Demeestere, K.; Höfte, M.; Tzortzakis, N. Assessing the impact of drought stress and soil cultivation in Chardonnay and Xynisteri grape cultivars. Agronomy 2020, 10, 670. [Google Scholar] [CrossRef]
  33. Cyprus Statistical Service. Survey Results: Farm Structure Survey; Cyprus Statistical Service: Nicosia, Cyprus, 2016. [Google Scholar]
  34. TOPPS. Available online: http://www.topps-life.org/topps-prowadis-project.html (accessed on 29 October 2019).
  35. ISO. International Standard: Crop Protection Equipment-Field Measurement of Spray Distribution in Tree and Bush Crops; ISO 22522; ISO: London, UK, 2007. [Google Scholar]
  36. Rasband, W.S. (1997–2008). ImageJ, U.S. National Institutes of Health, Bethesda, MA, USA. Available online: https://imagej.nih.gov/ij/ (accessed on 12 July 2020).
  37. R Core Team. R: A Language and Environment for Statistical Computing; R Foundation for Statistical Computing: Vienna, Austria, 2019; Available online: https://www.R-project.org/ (accessed on 17 July 2020).
  38. Wickham, H.; Francois, R.; Henry, L.; Muller, K. dplyr: A Grammar of Data Manipulation. R Package, 2020 Version 0.8.5. Available online: https://CRAN.R-project.org/package=dplyr (accessed on 22 July 2020).
  39. Wickham, H. ggplot2: Elegant Graphics for Data Analysis; Springer: New York, NY, USA, 2016; ISBN 978-3-319-24277-4. Available online: https://ggplot2.tidyverse.org (accessed on 13 July 2020).
  40. Brooks, E.M.; Kristensen, K.; van Benthem, J.K.; Magnusson, A.; Berg, W.C.; Nielsen, A.; Skaug, J.H.; Maechler, M.; Bolker, M.B. glmmTMB balances speed and flexibility among packages for zero-inflated generalized linear mixed modeling. R J. 2017, 9, 378–400. [Google Scholar] [CrossRef] [Green Version]
  41. Bates, D.; Maechler, M.; Bolker, B.; Walker, S. Fitting linear mixed-effects models using lme4. J. Stat. Softw. 2015, 67, 1–48. [Google Scholar] [CrossRef]
  42. Korner-Nievergelt, F.; Roth, T.; von Felten, S.; Guelat, J.; Almasi, B.; Korner-Nievergelt, P. Bayesian Data Analysis in Ecology Using Linear Models with R, BUGS and Stan; Elsevier: Amsterdam, The Netherlands, 2015. [Google Scholar]
  43. Hartig, F. DHARMa: Residual Diagnostics for Hierarchical (Multi-Level/Mixed) Regression Models. R Package, 2020, Version 0.3.3.0. Available online: https://CRAN.R-project.org/package=DHARMa (accessed on 22 July 2020).
  44. Lenth, R. emmeans: Estimated Marginal Means, aka Least-Squares Means. R Package, 2020, Version 1.5.1. Available online: https://CRAN.R-project.org/package=emmeans (accessed on 3 September 2020).
  45. Manktelow, D.W.; Gurnsey, S.J.; MacGregor, A.M. Deposit variability and prediction in fruit crops: What use are label rates anyway? Asp. Appl. Biol. 2004, 71, 269–278. [Google Scholar]
  46. Michael, C.; Gil, E.; Gallart, M.; Stavirinides, M.C. Influence of spray technology and application rate on leaf deposit and ground losses in mountain viticulture. Agriculture 2020, 10, 615. [Google Scholar] [CrossRef]
  47. Rüegg, J.; Siegfried, W.; Raisigl, U.; Viret, O.; Steffek, R.; Reisenzein, H.; Persen, U. Registration of plant protection products in EPPO countries: Current status and possible approaches to harmonization. EPPO Bull. 2001, 31, 143–152. [Google Scholar] [CrossRef]
  48. Wohlhauser, R. Dose Rate Expression in Tree Fruits–the Need for Harmonization Approach from a Chemical Producer Industry Perspective. In Proceedings of the Tree Fruits Dose Adjustment Discussion Group Meeting—Wageningen, Amsterdam, The Netherlands, 29 September 2009. [Google Scholar]
  49. Toews R, B.; Huby J, P.; Pollmann, B.; Teichmann, M.; Schlotter, P.; Meier-Runge, F. Dose Rate Expression in Vertical Growing Crops—Need for Harmonization from the Perspective of the Plant Protection Product Industry. Workshop on Harmonized Dose Expression for the Zonal Evaluation of Plant Protection Products in High Growing Crops, Vienna, Austria. 2016. Available online: https://www.eppo.int/media/uploaded_images/MEETINGS/Conferences_2016/dose_expression/05_Meier-Runge_Teichmann.pdf (accessed on 10 February 2021).
  50. EPPO Activities. Available online: https://www.eppo.int/ACTIVITIES/plant_protection_products/harmonized_dose_expression (accessed on 10 November 2020).
  51. Barani, A.; Franchi, A.; Bugiani, R.; Montermini, A. Efficacy of unit canopy row spraying system for control of European vine moth (Lobesia botrana) in vineyards. Agric. Eng. Int. CIGR J. 2008, 10. [Google Scholar]
  52. Gil, E.; Bernat, C.; Queralto, M.; Lopez, A.; Planas, S.; Rosell, J.R.; Val, L. Pesticide Dose Adjustment in Vineyard: Relationship between Crop Characteristics and Quality of the Application. In Proceedings of the VIII Workshop on Spray Application Techniques in Fruit Growing, Barcelona, Spain, 29 July–1 August 2005; Gil, E., Solanelles, F., Planas, S., Rosell, J.R., Val, L., Eds.; Universitat Politecnica de Catalunya:Catalunya, Spain. Generalitat de Catalunya i Universitat de Lleida: Lleida, Spain, 2005; pp. 19–20. [Google Scholar]
  53. Gil, E.; Salcedo, R.; Soler, A.; Ortega, P.; Llop, J.; Campos, J.; Oliva, J. Relative efficiencies of experimental and conventional foliar sprayers and assessment of optimal LWA spray volumes in trellised wine grapes. Pest Manag. Sci. 2021. [Google Scholar] [CrossRef] [PubMed]
  54. Cabús, A.; Pellini, M.; Zanzotti, R.; Devigili, L.; Maines, R.; Giovannini, O.; Mattedi, L.; Mescalchin, E. Efficacy of reduced copper dosages against Plasmopara viticola in organic agriculture. Crop Prot. 2017, 96, 103–108. [Google Scholar] [CrossRef]
Figure 1. The three vineyards (a) Palomino var., (b) Xynisteri var., (c) Carignan var.
Agriculture 11 00178 g001
Figure 2. Experimental design. Red dots show the sampling vines for coverage. From the vines within the blue area bunches were collected randomly for grape berry moth assessment. The experimental design for Carignan included 50 vines per row instead of the 18 for Palomino or Xynisteri.
Agriculture 11 00178 g002
Figure 3. Sprayers tested. On the left the high-volume sprayer (HVS) with the spray gun and on the right the orchard sprayer (OS) used for the OS500 and OS250 treatments.
Agriculture 11 00178 g003
Figure 4. Positions of water sensitive paper for (a) trellis-trained vines (b) goblet-trained vines.
Agriculture 11 00178 g004
Figure 5. Coverage of water-sensitive paper (WSP) at the BBCH 65 and BBCH 85 stages. Boxplots show the median for each treatment, box boundaries show the 25th and 50th percentile, while whiskers extend to 1.5 times the interquartile range (IQR). Points beyond 1.5 times the IQR are plotted individually. Diamonds show the mean. See Results for details of the statistical analysis. Different letters within each variety and year represent p < 0.05.
Agriculture 11 00178 g005
Figure 6. Histograms of the distribution of the number of leaves in different coverage classes for the different treatments and vine stages for the three varieties. The dashed vertical lines correspond to coverage from 20% to 50% (see text for additional information).
Agriculture 11 00178 g006
Figure 7. Infestation by the grape berry moth on bunches in Control, HVS, OS500 and OS250 treatments for the two study years. Boxplots show the median for each treatment, box boundaries show the 25th and 50th percentile, while whiskers extend to 1.5 times the interquartile range (IQR). Points beyond 1.5 times the IQR are plotted individually. Different letters within each variety and year represent p < 0.05. See Results for details of the statistical analysis.
Agriculture 11 00178 g007
Table 1. Characteristics of the three study vineyards.
NoVarietyTraining SystemVine Spacing (m)Average Canopy Height × Width (m)Size (ha−1)Age (Years)
BBCH 65BBCH 85
1PalominoTrellis2.4 × 2.40.72 × 0.661.05 × 1.010.36
2XynisteriTrellis2.4 × 2.40.76 × 0.811.12 × 1.080.316
3CarignanGoblet2.4 × 2.40.68 × 0.861.18 × 1.281.621
Table 2. Dates, active ingredients/commercial products and the dose (ml or gr/100 L) of the products as indicated on the pesticide labels.
DateActive IngredientCommercial NameRecommended Dose (mL or gr/100 L)L ha−1Actual Dose Used/100 LInsect/Disease
24 May 2017 Indoxacarb 30%Steward 30WG15500–150015Grape berry moth
Proquinazid 20%Talendo EC20–25300–100020Powdery mildew
14 June 2017Spinosad 48%Tracer 48 SC10–15400–120015Grape berry moth
Difenoconazole 6% Cyflufenamid 3%Dynali 60/30 DC50–65100060Powdery mildew
13 July 2017Esfenvalerate 2.5%Plinto 2,5 EC40–120500–100040Grape berry moth
Boscalid 20%
Kresoxim-methyl 10%
ENTOL 20/10SC40100040Powdery mildew
14 August 2017Alpha cypermethrin 10%Fastac 10 SC10–15500–150015Grape berry moth
18 May 2018Indoxacarb 30%Steward 30WG15500–150015Grape berry moth
Proquinazid 20%Talendo EC20–25300–100020Powdery mildew
15 June 2018Spinosad 48%Tracer 48 SC10–15400–120015Grape berry moth
Difenoconazole 6% Cyflufenamid 3%Dynali 60/30 DC50–65100060Powdery mildew
13 July 2018Esfenvalerate 2.5%Plinto 2,5 EC40–120500–100040Grape berry moth
Boscalid 20%
Kresoxim-methyl 10%
ENTOL 20/10SC40100040Powdery mildew
17 August 2018Alpha cypermethrin 10%Fastac 10 SC10–15500–150015Grape berry moth
Table 3. Results of the statistical analyses for the effect of sprayer/volume rate on coverage for three varieties: Carignan, Palomino, Xynisteri.
Fixed Effects *dfLRTp-ValueLRTp-ValueLRTp-Value
CarignanPalominoXynisteri
Sprayer221.53<0.00128.44<0.00125.00<0.001
Stage11.590.211.140.295.290.02
Sprayer: Stage20.560.752.310.322.320.31
Random effect for vine
(st. deviation)
0.284.84 × 10−56.24 × 10⁻⁵
Overdispersion parameter for betabinomial family4.793.413.09
Residual degrees of freedom154154154
* The standard deviation for the random effect (vine) and the residual degrees of freedom are provided for the full model. LRT: Likelihood Ratio Test. See Materials and Methods and Results for more information on statistical analyses.
Table 4. Results of the statistical analyses for the effect of sprayer and year on infestation of grape berries by Lobesia botrana for three varieties: Carignan, Palomino, and Xynisteri.
Fixed Effects *dfLRTp-ValueLRTp-ValueLRTp-Value
CarignanPalominoXynisteri
Sprayer313.260.00464.65<0.00131.28<0.001
Year10.090.761.650.202.300.13
Sprayer: Year31.870.600.710.879.450.02
Random effect for vine
(st. deviation)
0.710.860.84
Dispersion parameter0.870.830.88
Residual degrees of freedom151151151
* The standard deviation for the random effect (vine) and the residual degrees of freedom are provided for the full model that included as main effects sprayer, year and their interaction. See Materials and Methods and Results for details on statistical analyses.
Table 5. Percentage reduction, compared to the control, in the mean infestation by the grape berry moth for the different sprayers for each of the three varieties.
VarietyTreatmentYear 1Year 2
CarignanHVS74%62%
OS25058%56%
OS50071%57%
PalominoHVS96%94%
OS25078%77%
OS50082%83%
XynisteriHVS71%73%
OS25083%60%
OS50091%79%
Publisher’s Note: MDPI stays neutral with regard to jurisdictional claims in published maps and institutional affiliations.

