1. Introduction
Lameness is one of the most severe health problems in dairy cows and is described as a disease that presents itself with a walking dysfunction, which is becoming a frequent and serious problem of animal welfare, herd productivity, and herd management [
1]. The clinically severe lameness ranges from 26 to 54% [
2], but foot lesions, that cause lameness in cattle, are multifactorial and trauma, infection, and metabolic disorders are contributing factors [
3]. In order to identify healthy and lame cows, the information of the herd health reports can be used [
4]. Higher surveillance rates may increase the possibility of an earlier detection of lameness, since most of the time farmers tend to underestimate the actual lameness prevalence in their herd [
5].
Although, measurement of pain in animals is challenging, there are established methods of estimating stress, caused by pain or discomfort. Thus, the assessment of stress in farm animals can be used to evaluate animal welfare [
6]. Lameness can be defined as an abnormal behavior (presenting itself with reduced velocity and altered stride, lowered head, and curved back). It negatively affects animal production and welfare, such as a reduced ability of the cow to engage in social interactions and with its environment [
7]. Cortisol concentration of the animal can be a valuable biomarker of chronic stress. Significant differences were found when comparing cortisol concentrations in hair of healthy and diseased cows (i.e., retained placenta, displaced abomasum, clinical hypocalcemia, metritis, clinical mastitis, and surgical procedures) [
8]. Pain experienced from lameness could act as a stressor in dairy cattle [
9]. Adverse situations trigger responses of the adrenal glands, which in turn increases glucocorticoid concentrations [
10]. Cortisol has been suggested as a stress biomarker in lame cattle [
11]. Our past results indicate that lameness influenced the frequency of visits to the automatic milking system (AMS), the productivity of the cows, and the interval between milking. The sum of all the negative consequences has a major impact on herd profitability, as well as on the health and welfare status of the cows. It is highly recommended to perform a comprehensive analysis of AMS variables in order to guarantee an effective management of performance and hoof health of dairy cows [
12]. Miguel-Pacheco et al. [
13] stated that further studies are required to investigate the potential use of capabilities and maximal benefits of the technologies available in AMS as a tool to measure and monitor the health status of cows. According Van Hertem et al. [
14] in future research image-processing techniques should be tested for improving the lameness detection accuracy. To increase the prediction accuracy in automatic lameness detection, associations between the independent variables should be included [
5].
The aim of the current study was therefore to evaluate the relation between lameness and milk flow traits in dairy cows.
2. Materials and Methods
2.1. Animal Selection
The research was carried out in accordance with the standards set by the Animal Welfare and Protection of the Republic of Lithuania (No. 108-2728; 2012, No. 122-6126). The study approval number is PK016965.
Lithuanian black and white dairy cows without any reproductive or other disorders were monitored carefully for claw health status on a commercial dairy farm. On the farm 128 cows (on average 2.8 ± 0.2 lactations and 60.1 ± 3.1 days postpartum) were selected for the experiment: 73 healthy (HL group) and 55 cows with lameness (LA group). Lameness was diagnosed by a local veterinarian who specializes in hoof care, according to the standard procedure described by Sprecher et al. [
15]: 1 = normal, 2 = presence of a slightly asymmetric gait, 3 = the cow clearly favored one or more limbs (moderately lame), 4 = severely lame, and 5 = extremely lame (non-weight-bearing lame). Visual locomotion scoring was conducted once weekly for four consecutive weeks by the same observer.
The blood samples were collected during the exact general clinical examination by using a tube without anticoagulant (BD Vacutainer, Crawley, UK) and were centrifuged at 3.500 RPM, 20 °C for 10–15 min. Samples were delivered to the Large Animal Clinic’s Laboratory of Clinical Tests at the Lithuanian University of Health Sciences Veterinary Academy.
All cows with lameness were treated with Naxcel (100 mg ceftiofur/mL; Zoetis Canada, Kirkland, QC, USA) administered subcutaneously at the dosage of 2.2 mg/kg of body weight. Treatment was repeated at 24-h intervals. At the same time, Rimadyl Cattle®® solution (50 mg carprofen/mL; Zoetis, Belgium) was delivered by subcutaneous injection at a dose of 1.4 mg per 1 kg body weight only once.
We hypothesized that lameness has an impact on milk flow traits in dairy cows such as: total milk yield, milk yield during the first minute, milk output during the first two minutes, milk output during the first three minutes, time to milk flow of 0.5 kg/min, time of main milking phase, time of incline in milk flow from 0.5 kg/min till the reach of the plateau phase, time at plateau phase, time at decline phase, time at stripping, milking speed traits (kg/min), highest milk flow, average milk flow on main milking phase, maximum milk yield per minute, and electrical conductivity (mS/cm). The latter includes electrical conductivity at highest milk flow, mS/cm, electrical conductivity during the initial time, mS/cm of milking (beginning peak level of the electrical conductivity), and maximum electrical conductivity after reaching the highest milking speed, mS/cm (
Table 1).
Cows on the farm are milked twice a day with 24 places of parallel milking parlors (DeLaval VMS; DeLaval International AB Tumba, Botkyrka, Sweden). The milking properties of cows were evaluated twice in a row—during evening and morning milking. The selected cows in the current lactation did not receive veterinary treatment, and correct hoof trimming was not performed at least four weeks before the experiment.
The cows were studied during the winter period of the year 2019. Diets were formulated according to requirements of the seventh revised edition of the Nutrient Requirements of Dairy Cattle by National Research Council (NRC 2001) that meet or exceed the energy needs for 550 kg lactating Holstein dairy cows producing 35 kg/day. TMR for cows composed of 35% corn silage, 10% grass silage, 5% grass hay, and 50% grain concentrate mash (50% barely and 50% wheat). Composition of ration—DM (%)—48.8; 83 NDF (% of DM)—28.2; ADF (% of DM)—19.8; NFC (% of DM)—38.7; CP (% of DM)—15.8; NEL 84 (Mcal/kg)—1.6. TMR was fed to the cows twice per day at 10:00 a.m. and 08:00 p.m.
2.2. Measurements
Lameness in cows was assessed on the visual locomotion scale (VLS) from 1 to 5. Based on these results, the cows were divided into two groups: HL group—healthy cows (VLS score = 1–2 for all hooves) and LA group—lame cows (VLS ≥ 3 for at least one hoof) [
15].
The milk flow of cows was recorded twice in a row during the morning and the evening milking. The measurements were taken by two electronic mobile milk flow meters (Lactocorder
®®, WMB AG, Balgache, Switzerland). Milk flow data were processed using LactoPro 5.2.0 software (Biomelktechnik Swiss).
Table 1 provides a detailed description of the milk flow traits of the cows studied in this experiment.
The milk flow curves were grouped according to their shape: the normal curve (absence of bimodality, BIMO = 0) and the bimodal curve (BIMO = 1; a flow pattern with two rises separated by a clear drop in milk flow below 0.2 kg/min shortly after the start of milking.).
Cortisol concentration was measured using the automated analyzer TOSOH®® AIA-360 (South San Francisco, CA, USA), which uses a competitive fluorescent enzyme immunoassay, which runs in small, single-use test cups that contain all necessary reagents. Daily checks, calibration curves, and maintenance procedures were performed as described in the system operator’s manual.
2.3. Statistical Analysis
Data were analyzed using the IBM SPSS Statistics software (version 25.0, IBM, Munich, Germany). Prior to analyses, the normality of all the data recorded in the study was assessed by the Shapiro–Wilk normality test. The descriptive statistics of data are presented as mean ± standard error of the mean of a sample (M ± SEM). Differences between the groups of cows were inspected with the independent T test (p < 0.05). Pearson’s chi-square test (χ2) for independence was used to determine if there was a statistically significant relationship between cow health and the bimodality of their milk flow curve.
Using a binary multivariable logistic regression, we investigated the relationship of lameness with blood cortisol concentration, the bimodality of the milk flow curve, and those milk flow variables that showed statistically significant differences between the groups of cows. Lameness for logistic regression analysis was defined as the dependent variable (where 1 means lameness and 0 means no lameness), all explanatory variables were divided into two classes based on their arithmetic mean (class 0 < M, class 1 ≥ M). In the backward stepwise model, all insignificant variables were excluded in accordance with the significance of the Wald test and the Hosmer and Lemeshow method. Wald’s test was used to determine whether the effect on the dependent variable was statistically significant, and the Hosmer–Lemeshow test—to confirm that the logistic regression model fits the data and Nagelkerke coefficient R2—was used to assess the suitability of the model. Three statistically significant indicators were used in the final multivariable binary regression model. The continuous explanatory variables of the model (based on their arithmetic mean) were divided into two categorical classes: MGG < 16.5 kg or ≥16.5 kg; blood cortisol concentration < 1.00 µg/dL or ≥1.00 µg/dL. The results of the logistic regression are presented in terms of the odds ratio (OR) and 95% confidence interval (PI).
3. Results
3.1. Relationship of Lameness with Milk Yield and Electrical Conductivity Traits of Dairy Cows
The data presented in
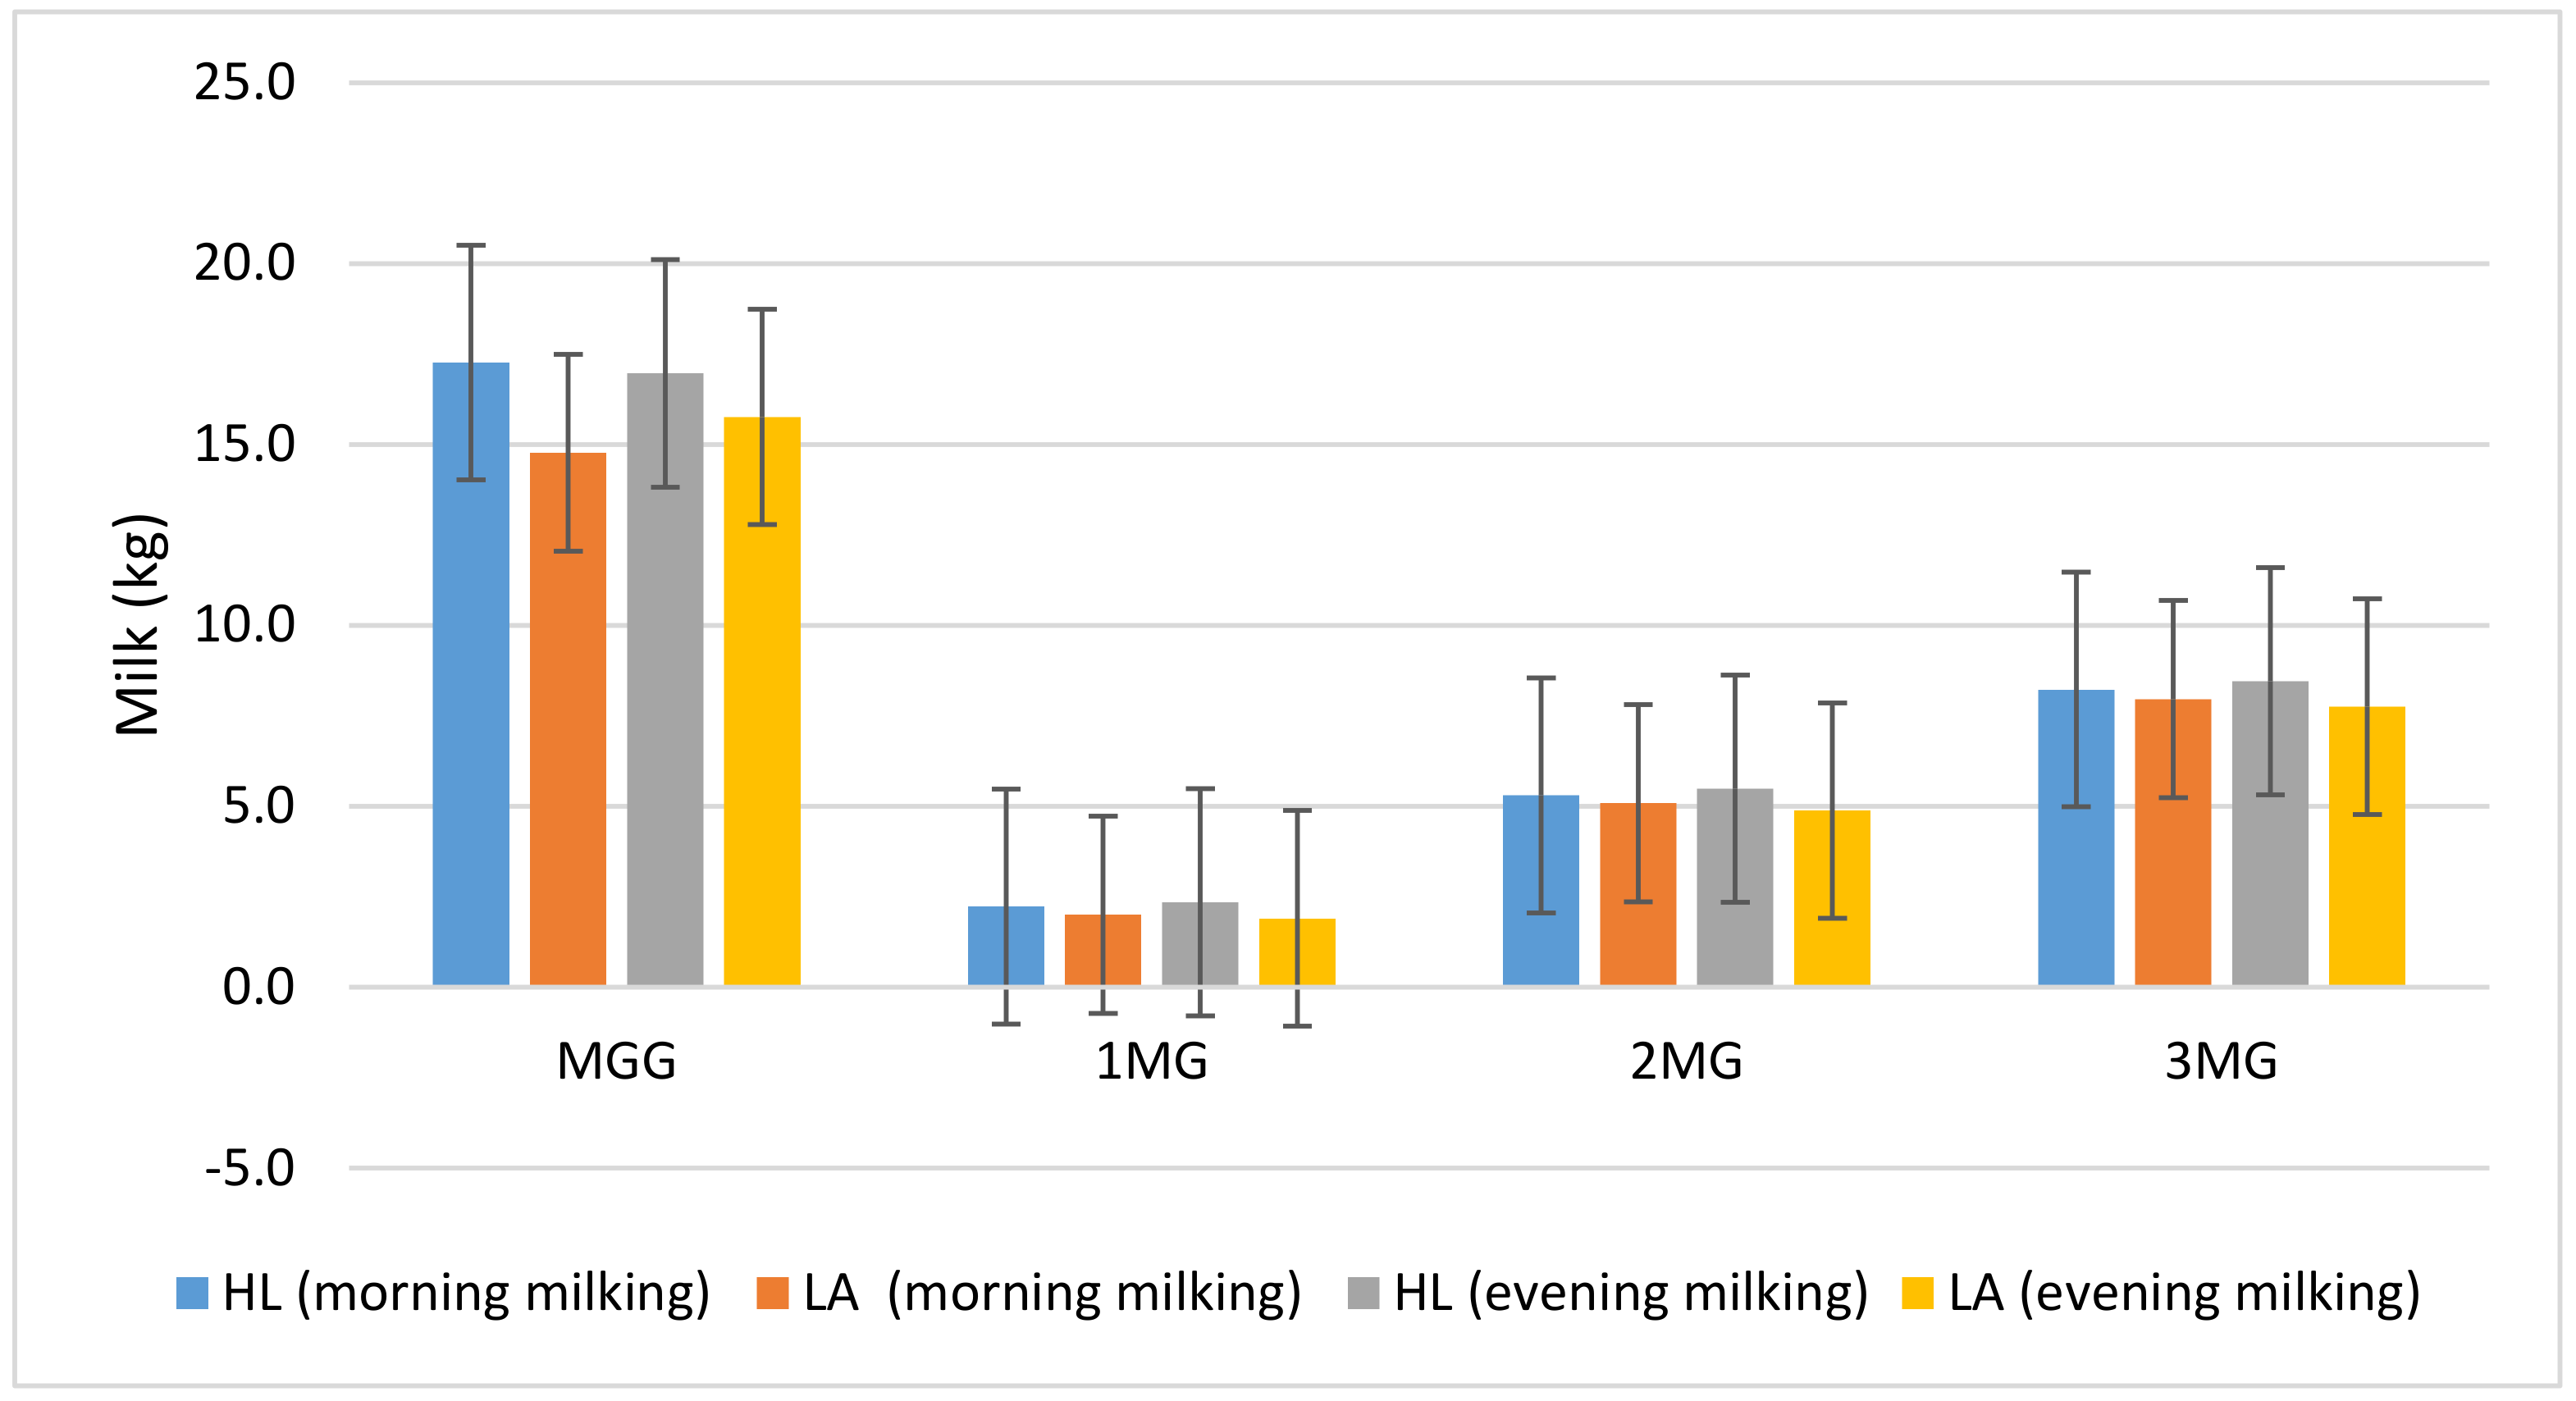
Table 2 demonstrate that the milk yield of healthy dairy cows was 1.77 kg higher than that of lame cows, as well as the milk yield in the first minute (0.34 kg more;
p < 0.01). Higher milk yields in healthy cows were also observed during the second and third minutes of milking, but these differences between the groups were not statistically significant.
MGG—total milk yield (kg/milking); MG1—milk yield during first min (kg); MG2—milk yield during first 2 min (kg); MG3—milk yield during first 3 min (kg); HL—healthy group; LA—lameness group.
MGG was higher in the group of healthy cows (0.3 kg) in the morning and in the group of LA cows. In contrast, it was higher in the evening (1.0 kg). The data are presented in
Figure 1.
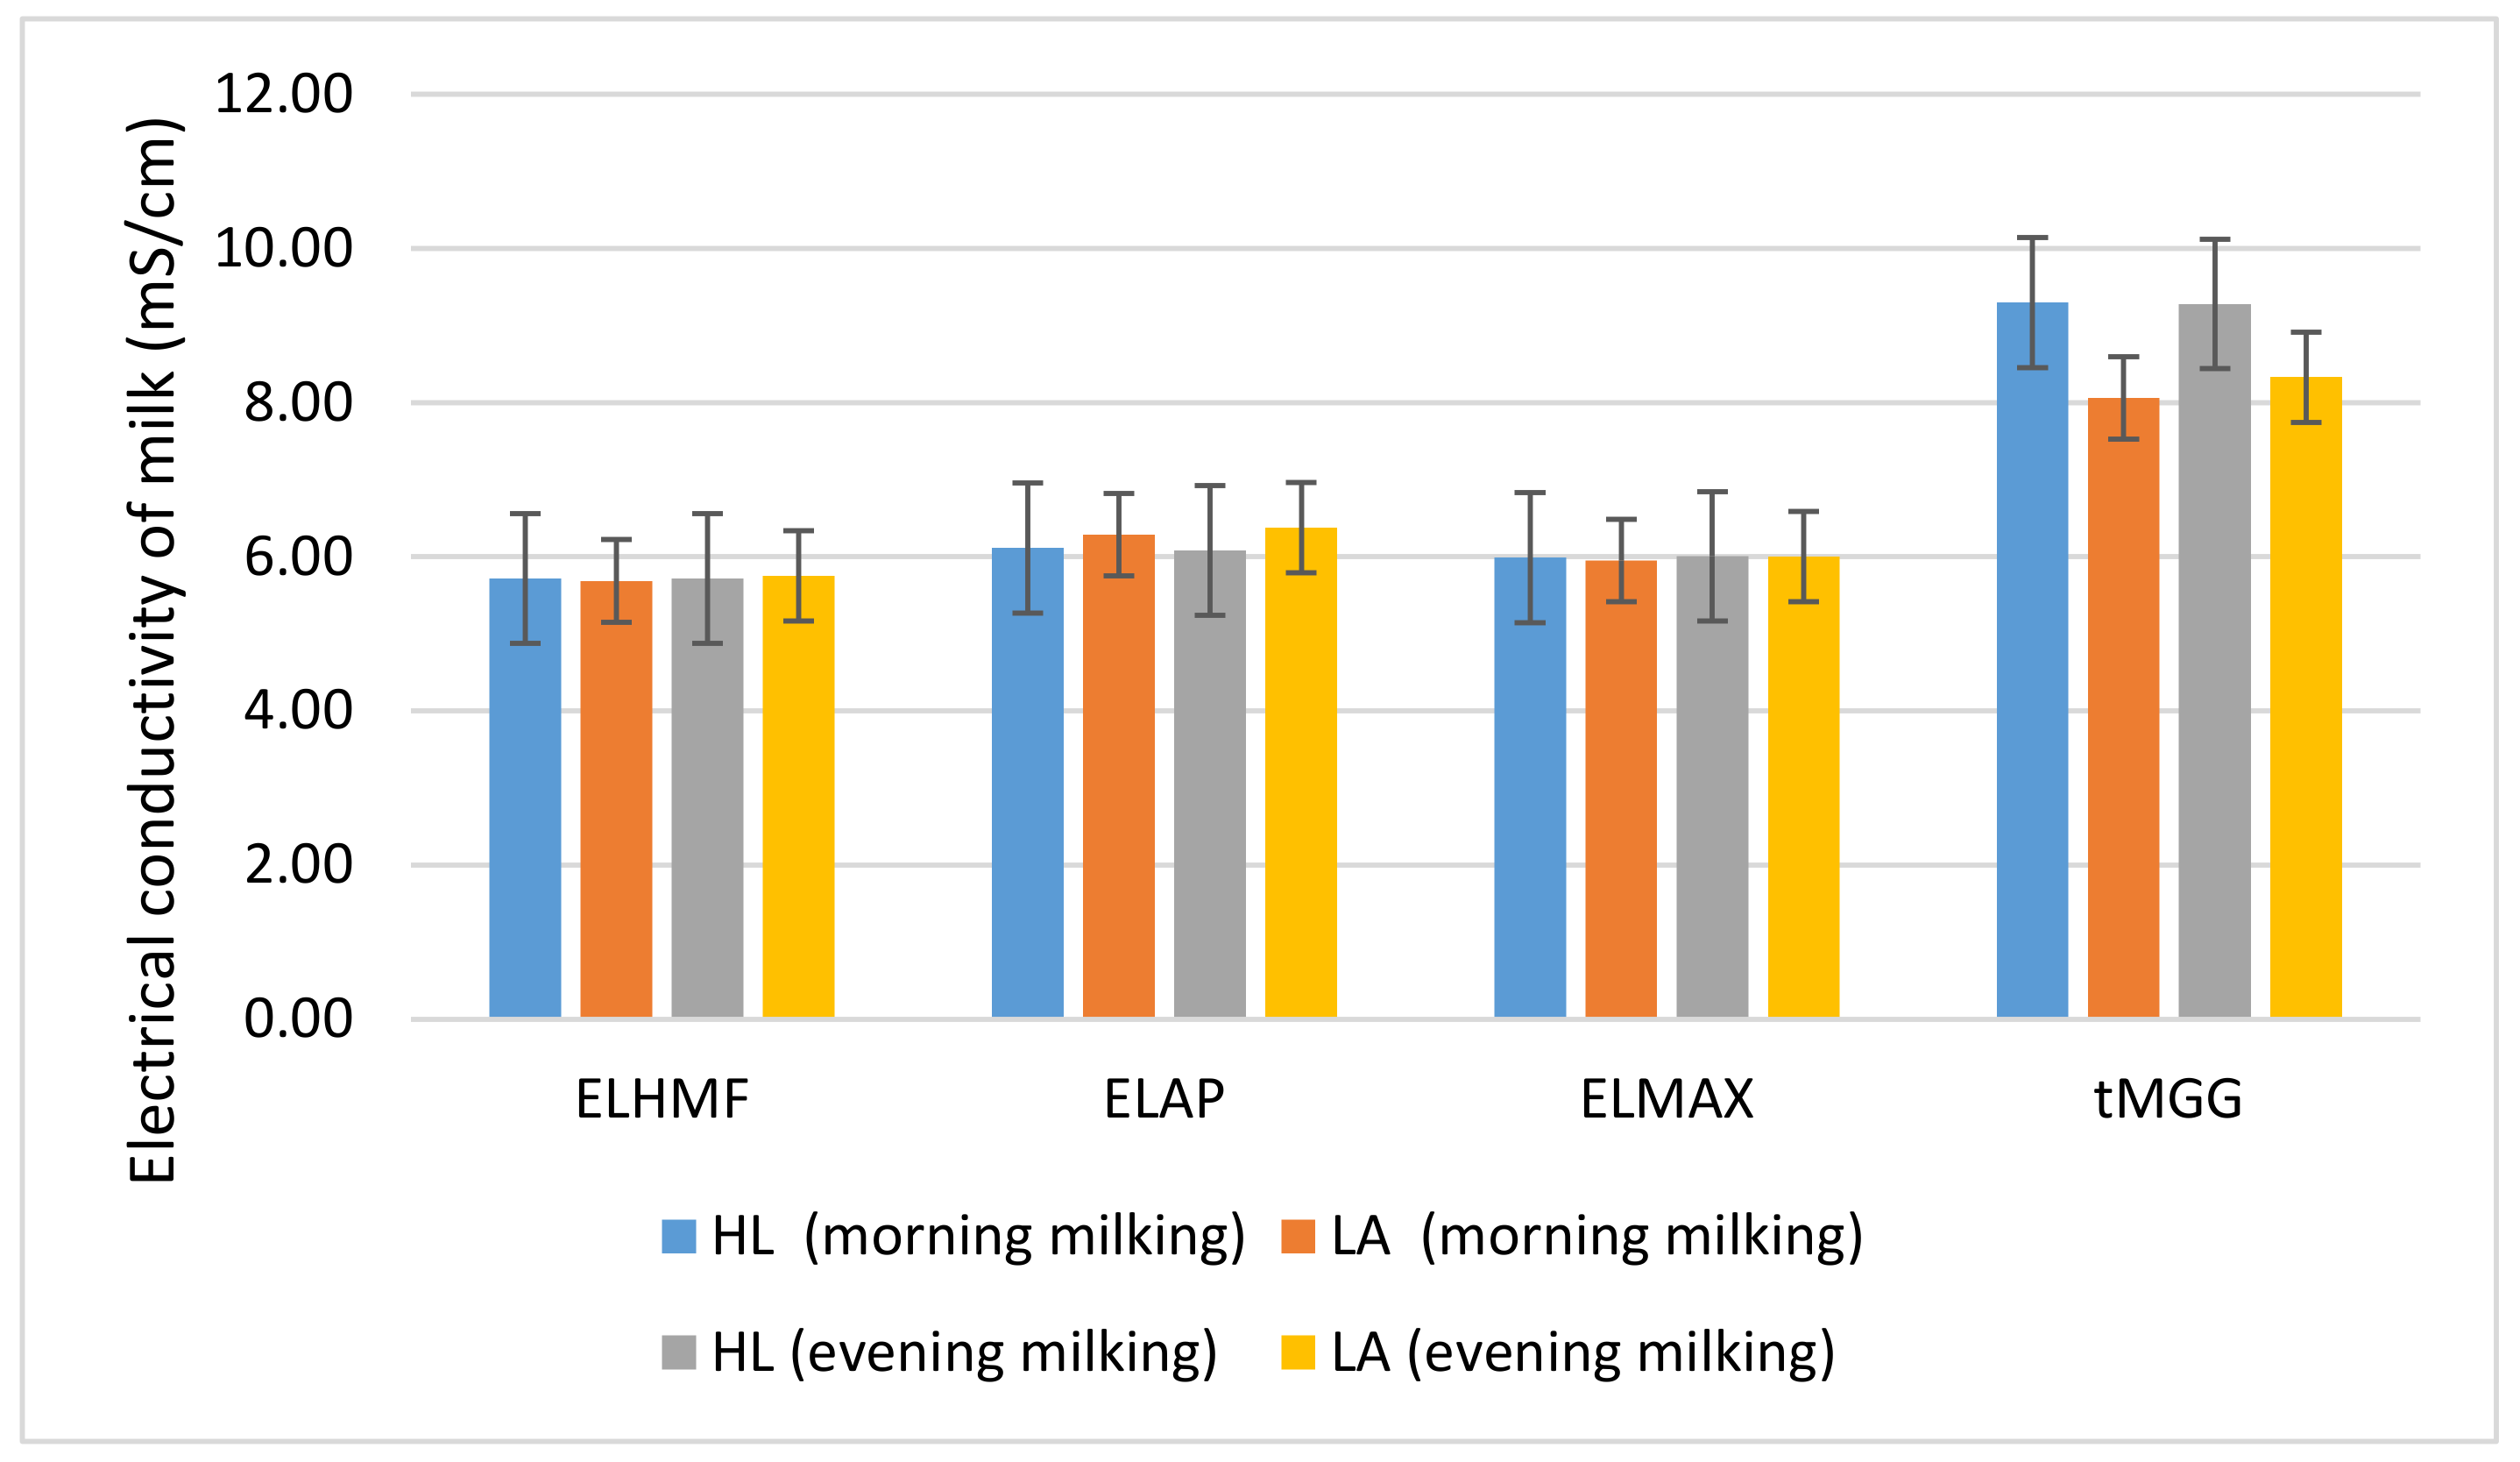
The ELAP of healthy cows was statistically significantly lower (−0.24 mS/cm,
p < 0.01) than that of the LA group. It should also be noted that all the studied indicators of milk electrical conductivity were higher in cows with signs of lameness compared with healthy cows (
Table 3).
We did not find statistically significant differences between the electrical conductivity of evening and morning milking (
Figure 2).
ELHMF—electrical conductivity at highest milk flow; ELAP—electrical conductivity during the initial time of milking; ELMAX—maximum electrical conductivity after reaching the highest milking speed; HL—healthy group; LA—lameness group.
3.2. Relationship of Lameness with Milking Time and Speed Traits
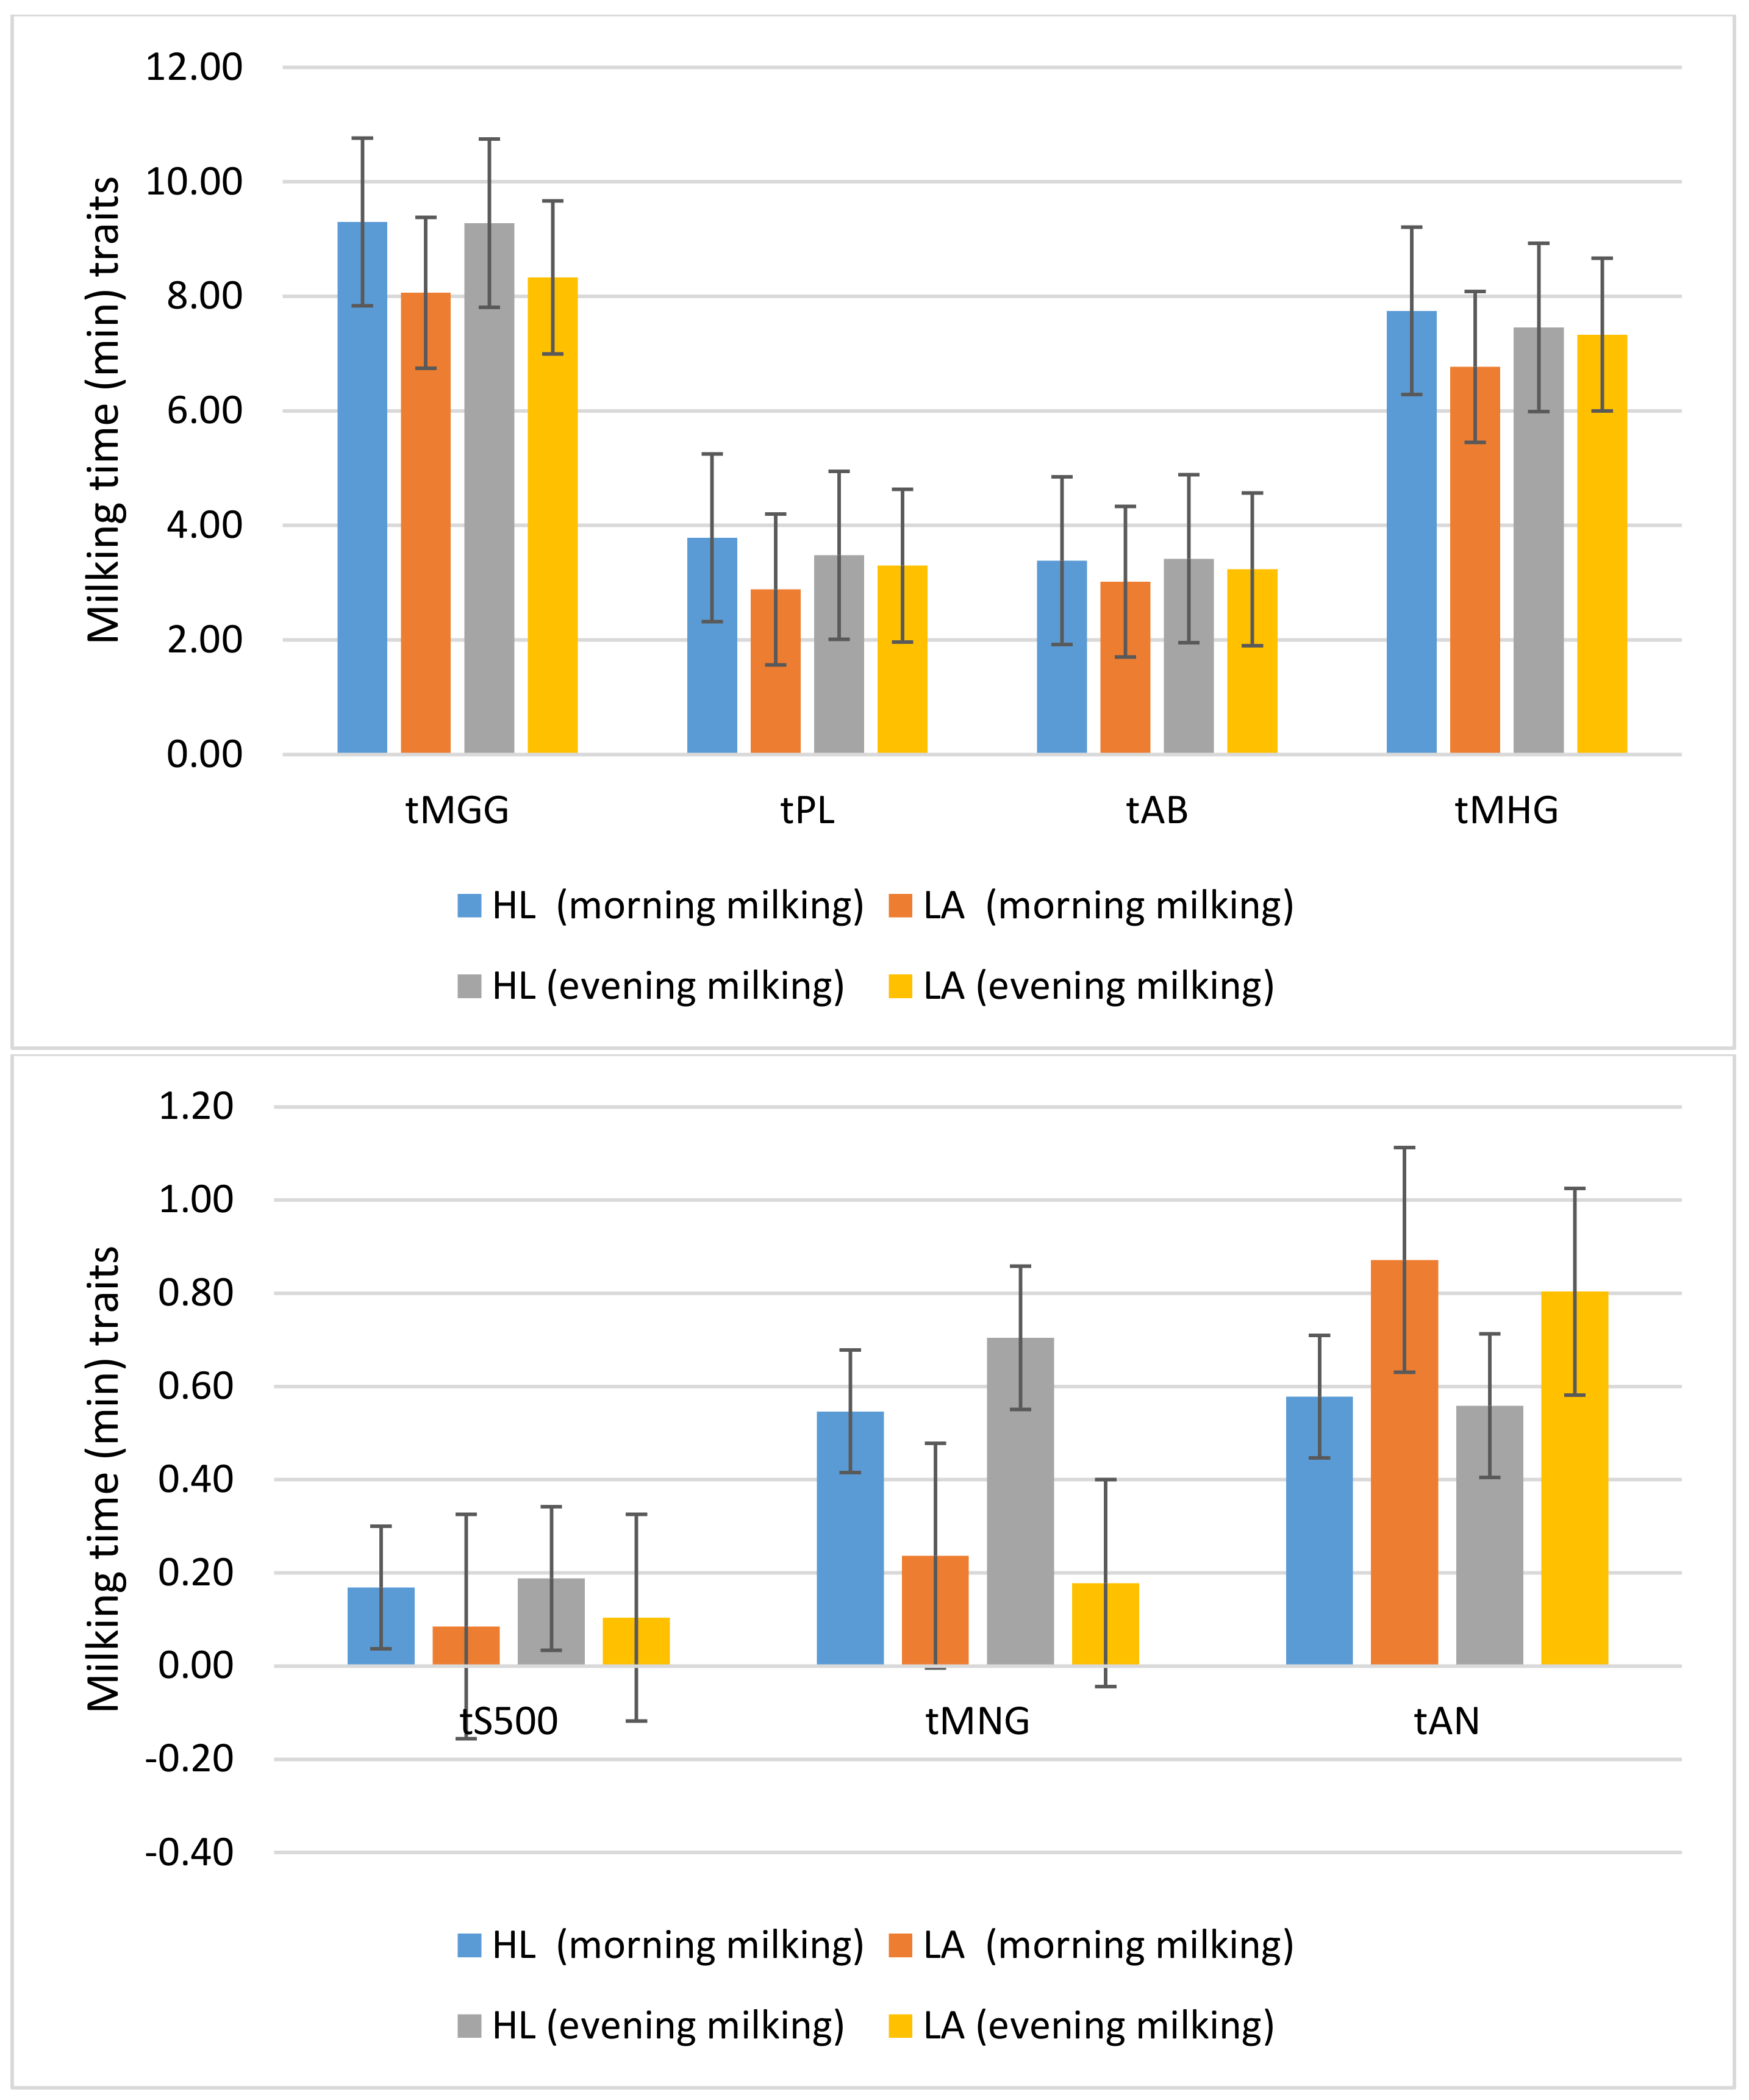
The milking duration (tMGG) of LA cows was shorter (−1.07 min,
p < 0.05), as was the value of the tMNG (−0.41 min,
p < 0.01), but the tAN duration was longer (0.26 min,
p < 0.001) compared to lame cows (
Table 4). Similar trends were observed between the groups of cows when comparing morning milking and evening milking data (
Figure 3).
All means of the milking duration indices in healthy cows were higher during morning and evening milking, except for tAN, which was higher in the LA cow group during both milking periods (0.24–0.29 min, p < 0.05).
tMGG—time at total milk yield; tS500—time to milk flow of 0.5 kg/min; tMHG—time of main milking phase (min); tAN—time of incline in milk flow from 0.5 kg/min till the reach of the plateau phase (min); tPL—time at plateau phase (min); tAB—time at decline phase (min); tMNG—time at stripping (min); HL—healthy group; LA—lameness group.
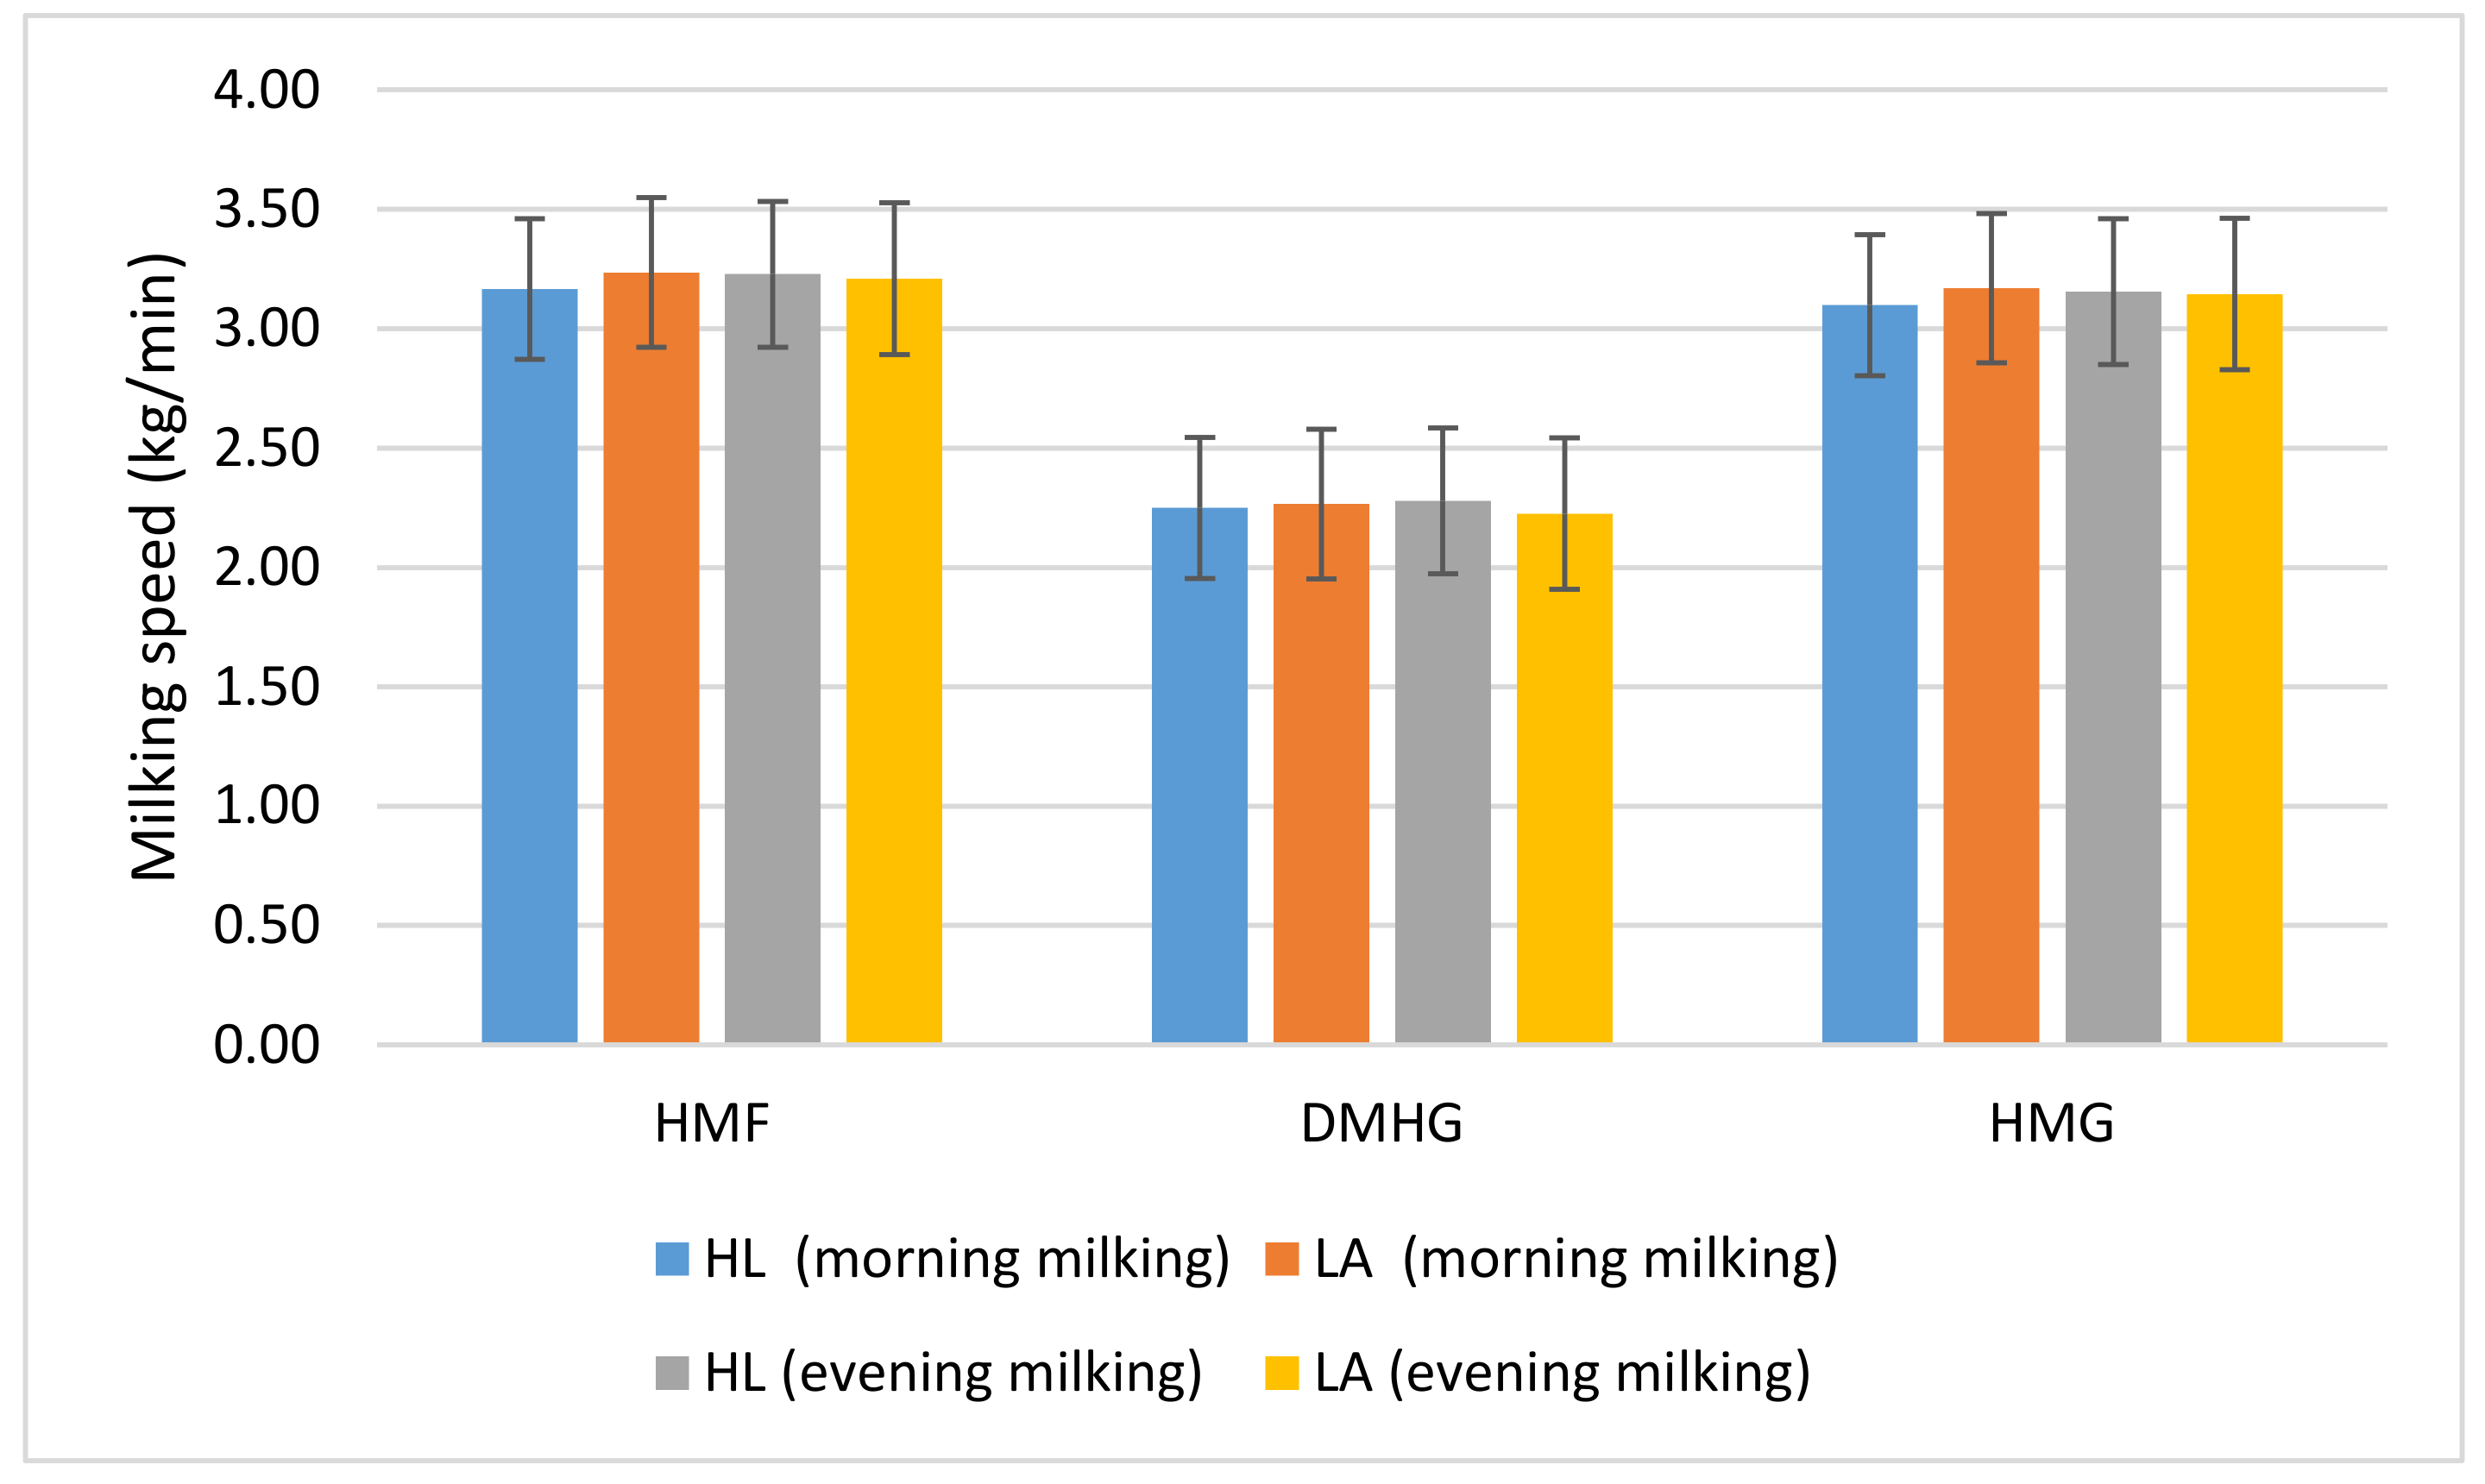
Lame cows had higher HMF and HMG values, but the differences with the healthy group were not significant. The data are presented in
Table 5.
HMF—highest milk flow (kg/min); DMHG—average milk flow during main milking phase (kg/min); HMG—maximum milk yield (kg) per minute; HL—healthy group; LA—lameness group.
The average values of all milking speed traits were slightly (0.02–0.07 kg/min) higher during the morning milking of healthy cows and, conversely, during the evening milking (0.01–0.05 kg/min) higher in the group of lame cows (
Figure 4).
3.3. Relationship of Lameness with Bimodality in Milk Flow of Cows
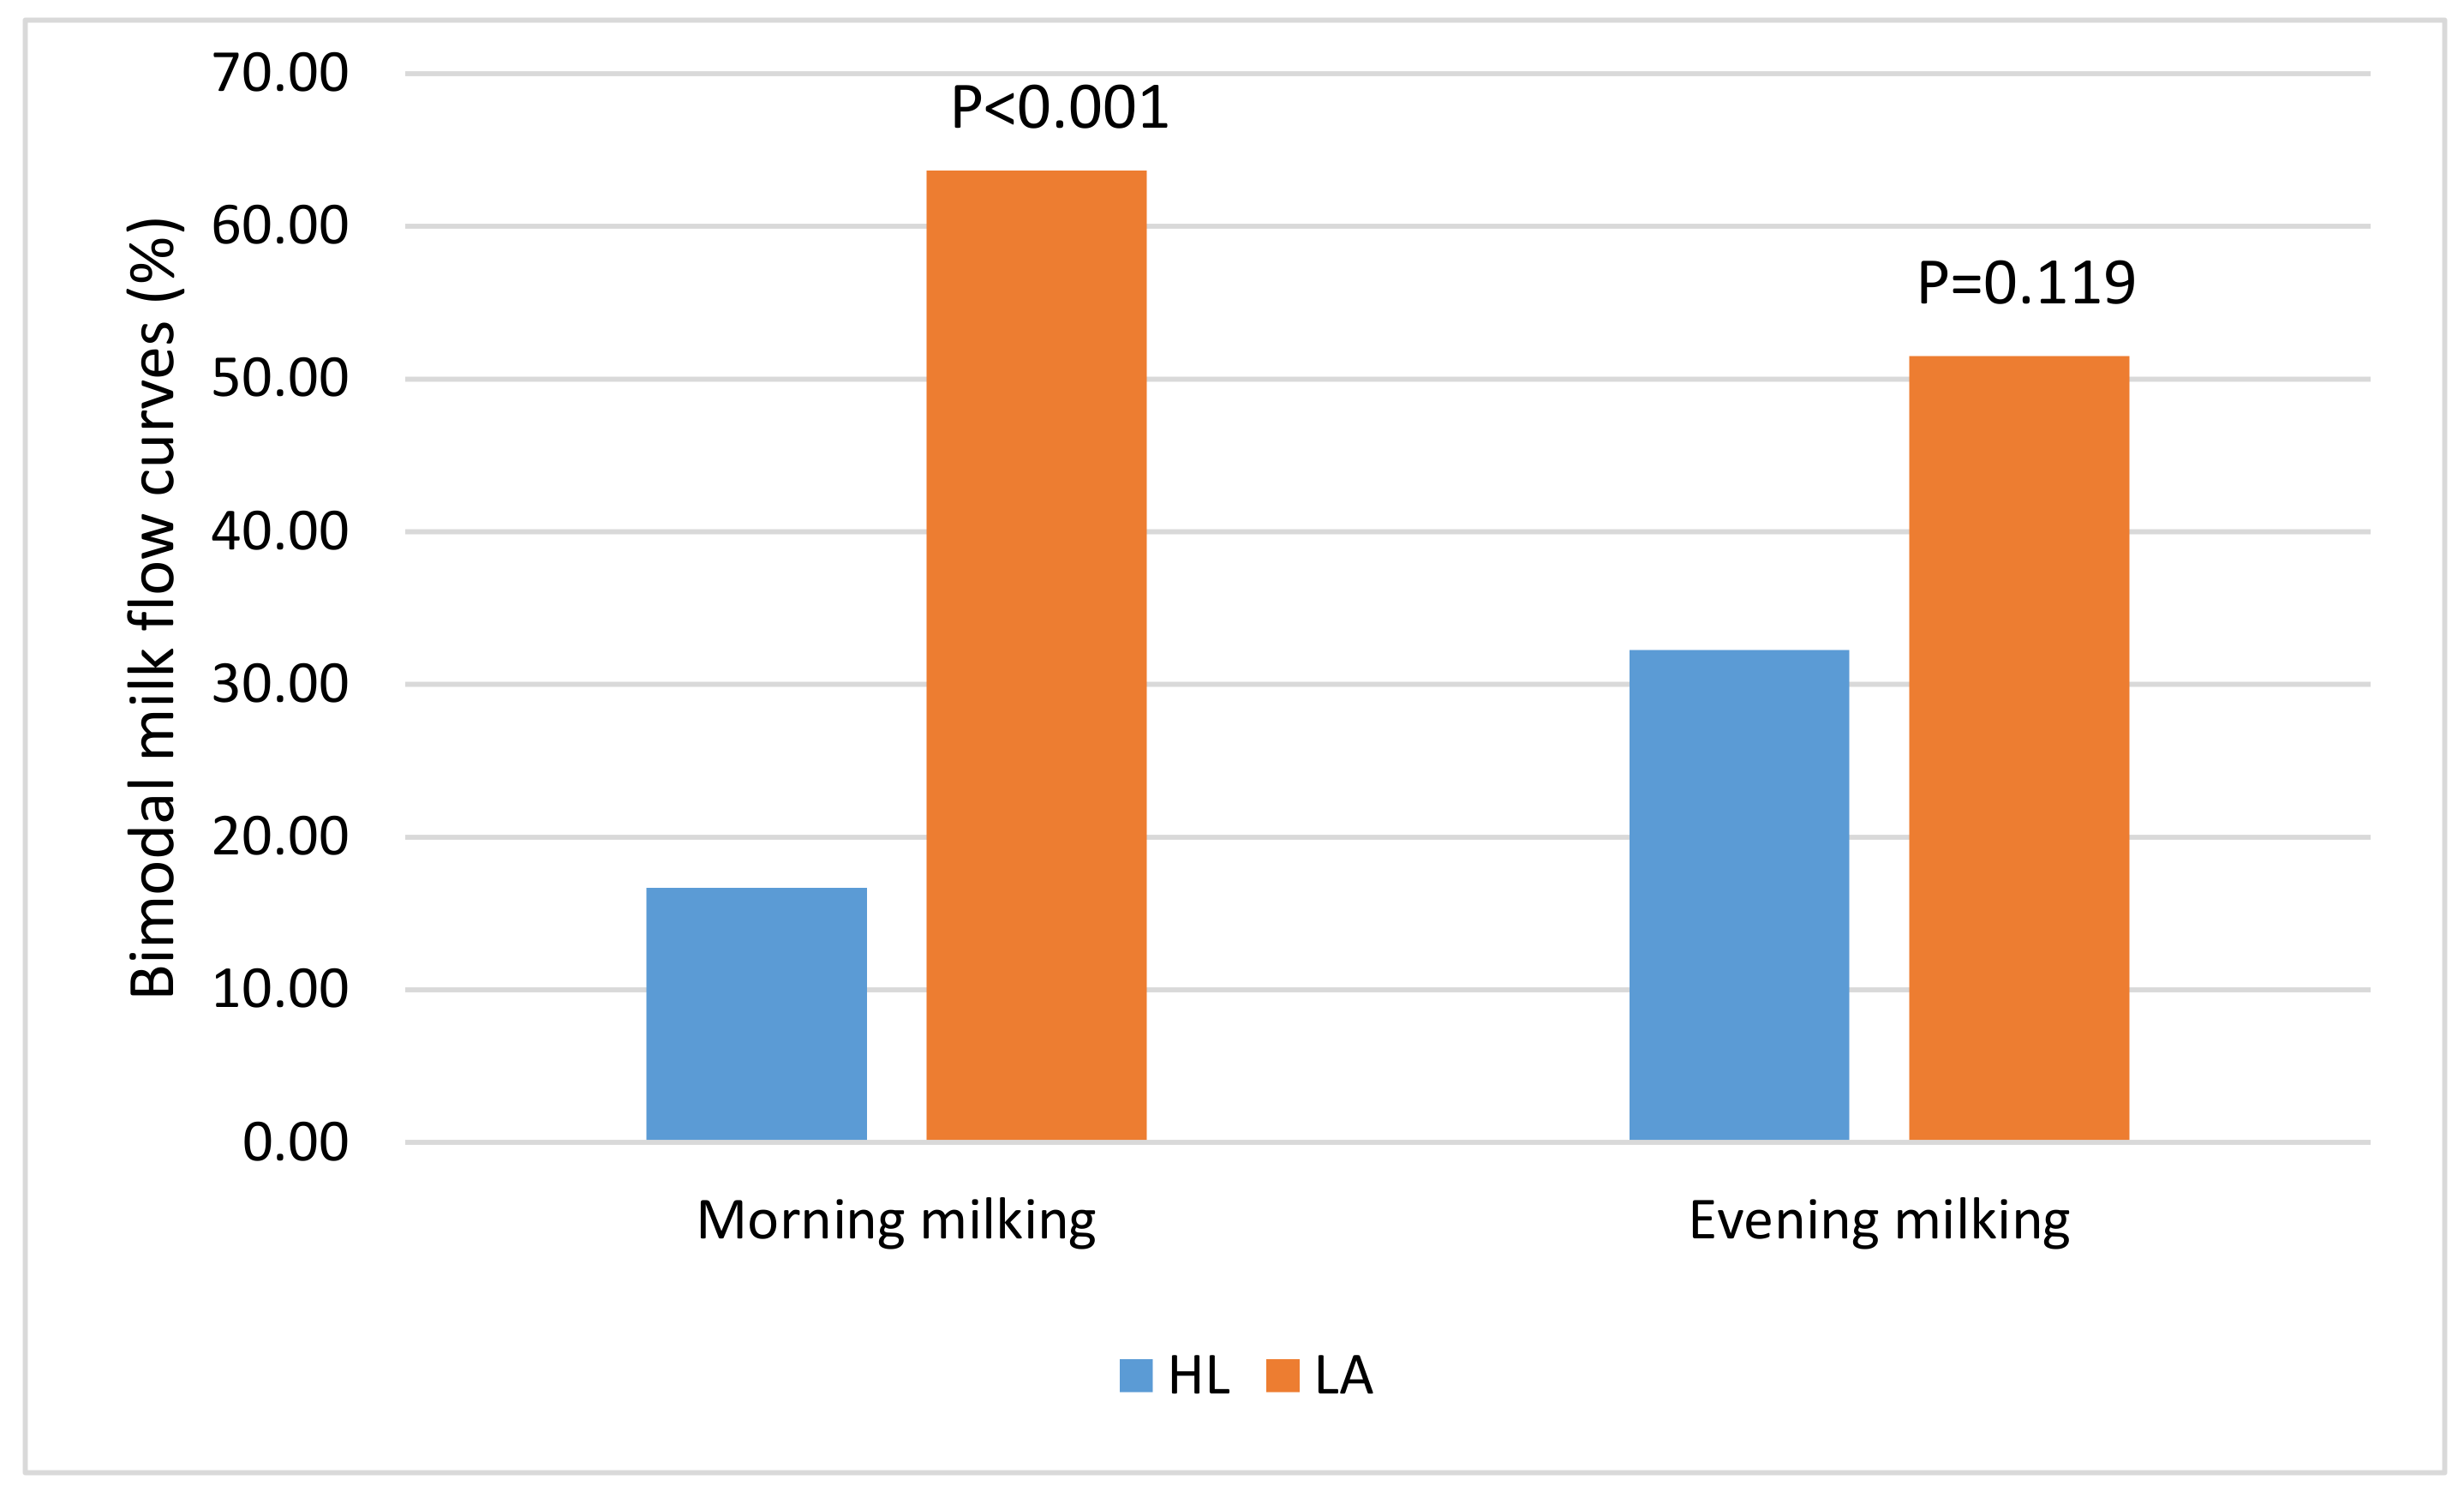
After evaluating the milk flow curves of cows, we determined 37.5% of the total bimodal curves. The analysis showed that the bimodality of the milk flow curve was statistically significantly associated with the health status of cows (p < 0.001). As a result, 23.3% of HL cows were found to have bimodal curves, whereas for 56.4% of LA cows bimodal curves were obtained.
In healthy cows (
Figure 5) more bimodal milk flow curves were found during evening milking (1.94 times), while in sick cows, on the contrary, during morning milking (1.24 times).
3.4. Relationship of Lameness with Blood Cortisol Concentration and Milk Flow Traits in Cows
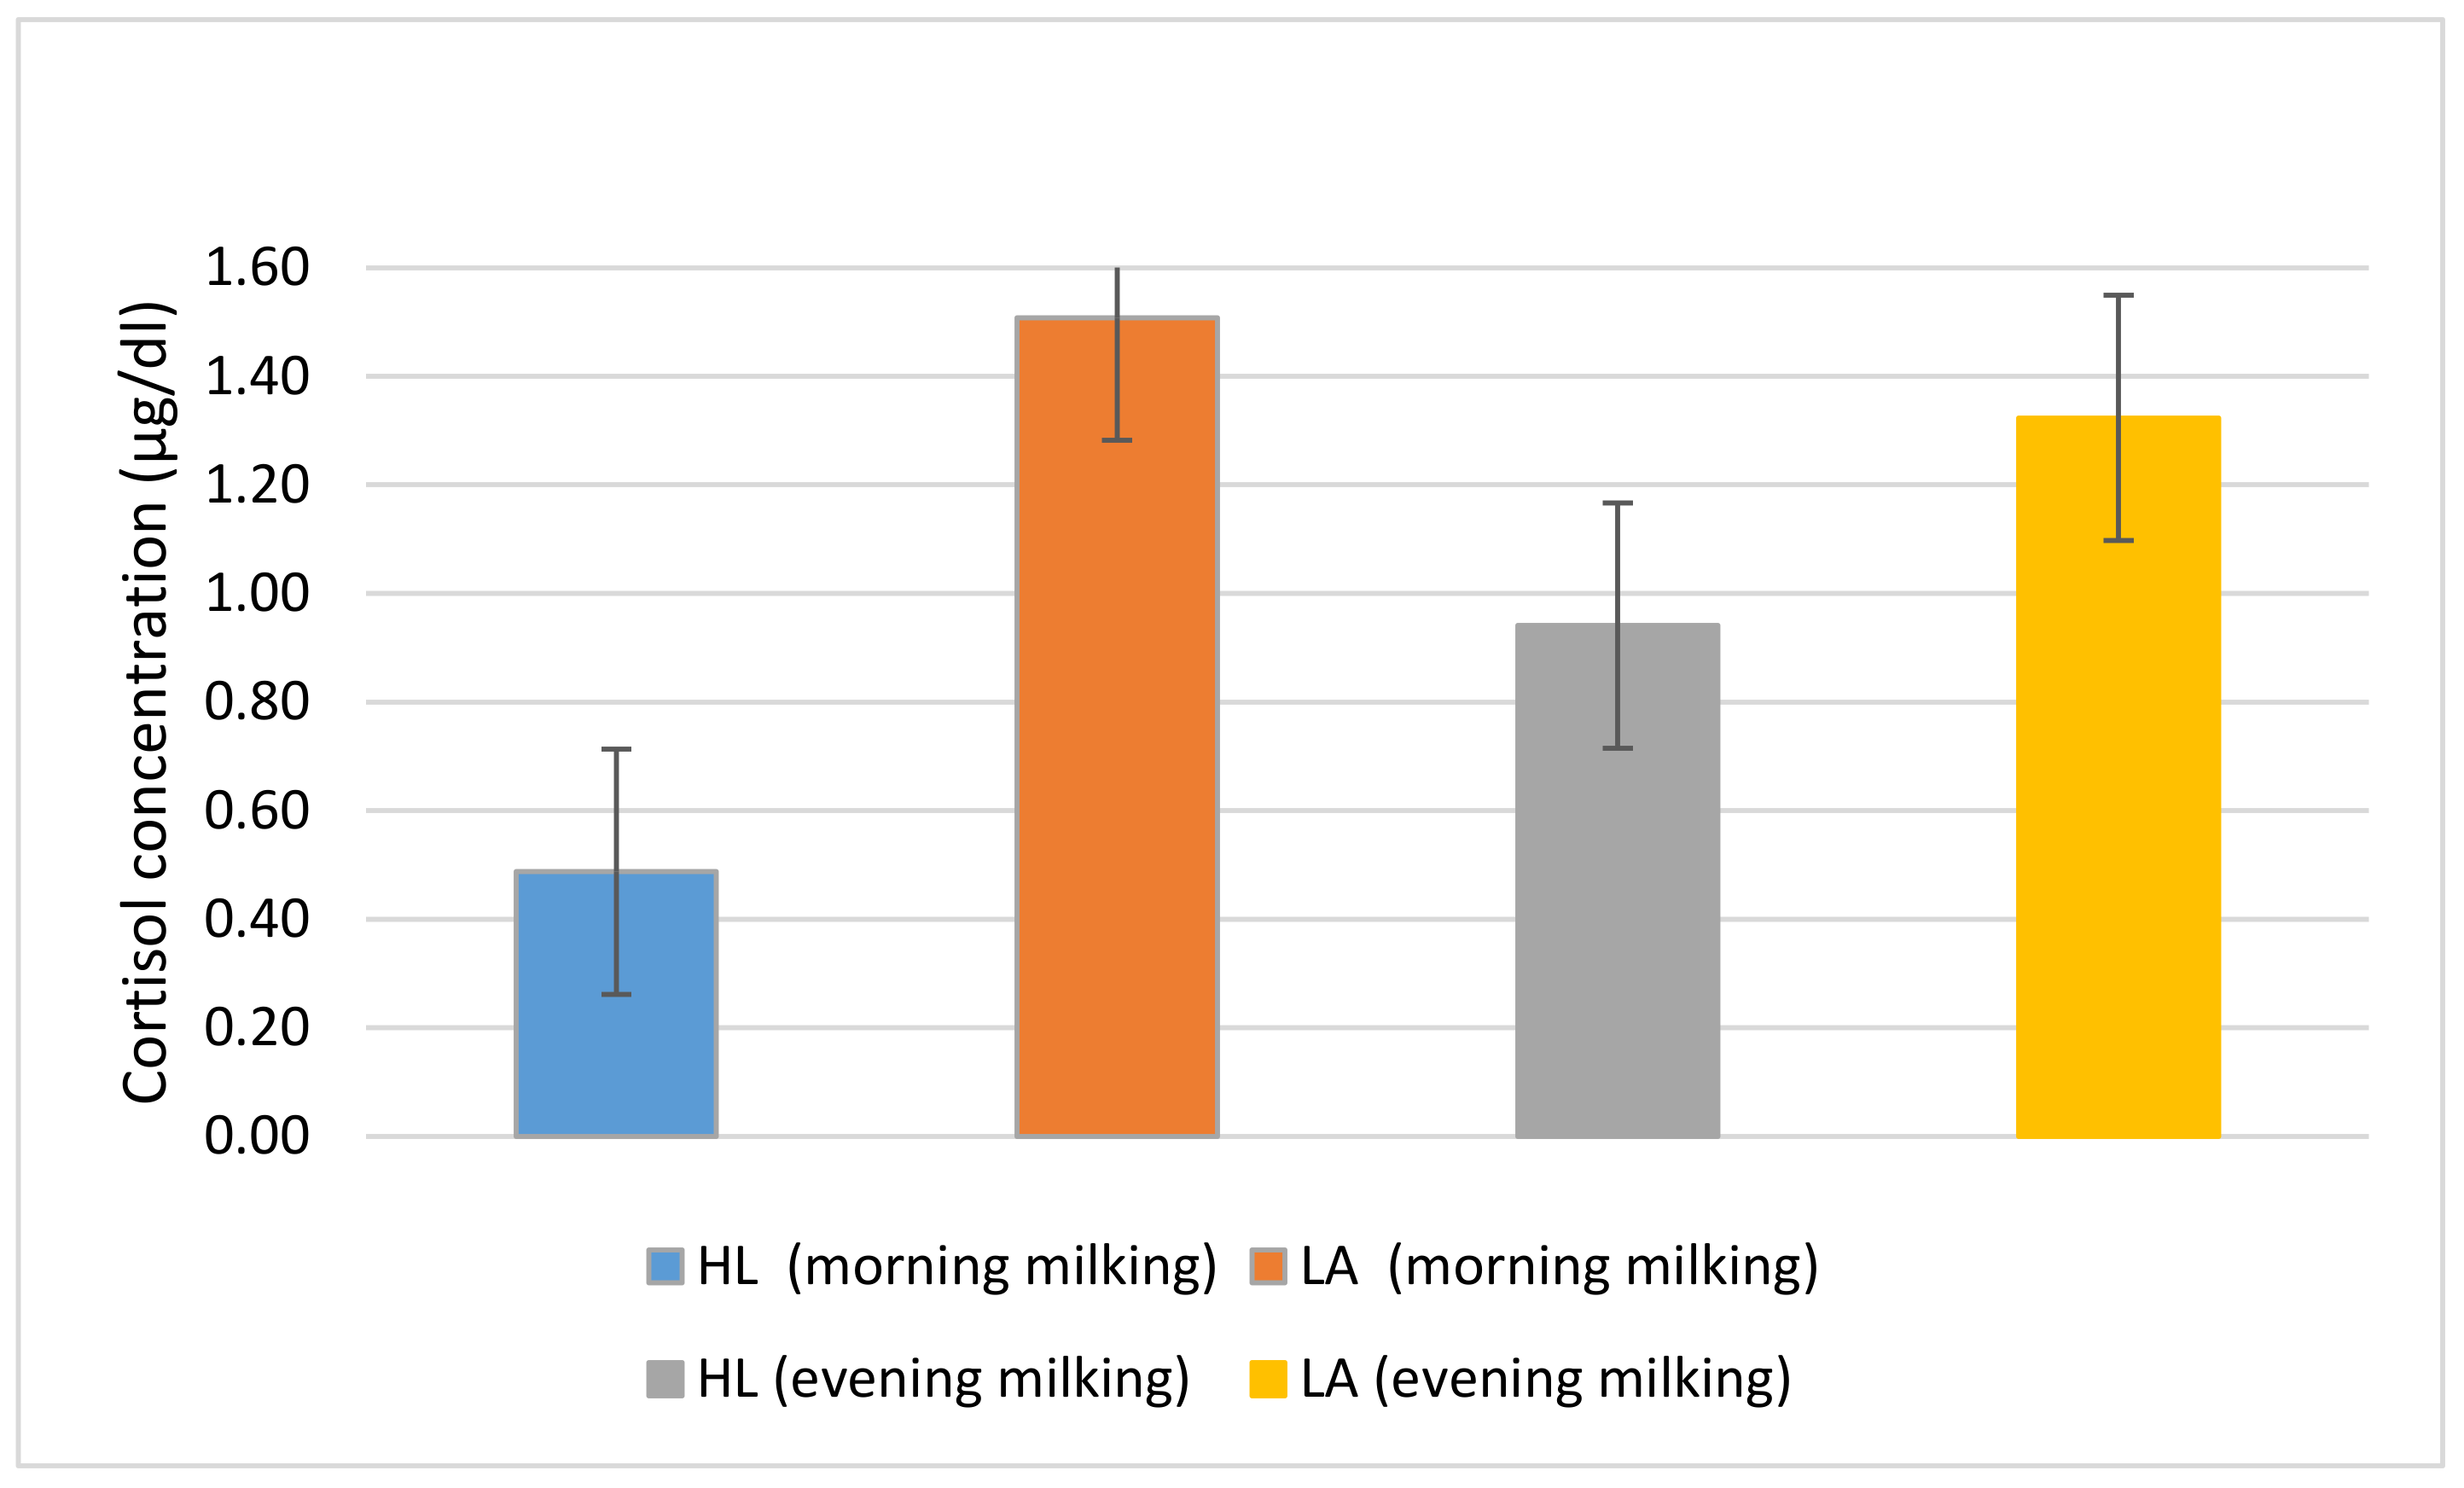
The average blood cortisol concentration of lame cows (1.40 ± 0.082 µg/dL) was 2.1 times higher (p < 0.001) than in healthy cows (0.68 ± 0.071 µg/dL).
As can be seen from the data in
Figure 6, healthy cows showed a higher blood cortisol concentration before evening milking (1.93 times,
p < 0.001), while lame cows, in contrast, before morning milking (1.14 times).
We also found that the concentration of cortisol was 1.9 times higher (p < 0.001) in cows with a bimodal milk flow curve (1.42 ± 0.090 µg/dL) compared to cows with a normal milk flow curve (0.73 ± 0.070 µg/dL). Blood cortisol concentration was positively associated with lameness as well as the bimodality of the milk flow curve.
Multivariable binary logistic regression analysis (
Table 6) showed that the blood cortisol concentration (
p = 0.001), the total cow’s milk yield (
p = 0.021), and the bimodality of the milk flow curve (
p = 0.015) can be used to predict lameness early. Of all the parameters studied, the risk of lameness was most clearly indicated by an increase in blood cortisol concentration. If its blood level in cows exceeds 1 µg/dL, the risk of identifying lameness increases 4.9 times (95% CI = 1.943–12.328).
4. Discussion
Lameness is the biggest challenge for dairy farms to overcome [
14]. Associations were found between lameness and many parameters measured automatically by sensors, revealing the high potential of detecting lameness by analyzing automatically measured performance and behavior data [
16]. This study showed that the level of blood cortisol in the HL group was lower than that in the LA group. Significantly higher levels of plasma cortisol concentration in the LA group can be associated with stress experienced by the animals in this group, and more pronounced reactions to the milking process. Cortisol concentration can be a valuable biomarker of chronic stress. On the day of diagnosis, elevated serum cortisol concentrations have been registered in cows diagnosed with lameness [
17].
The measurement of cortisol concentrations could detect clearly defined differences between healthy and clinically diseased (i.e., retained placenta, clinical hypocalcaemia, clinical mastitis, displaced abomasum, metritis, and surgical procedures) lactating cows for evaluation of the effect of a stressor, though a comparison of cortisol concentration with or without stressor would be necessary [
18]. As previously noted, on the day of diagnosis, increased concentrations of serum cortisol were determined in cows diagnosed with lameness [
19]. In a previous study the hair cortisol concentration of clinically sick (i.e., laminitis, metritis, mastitis) and cows with a compromised physiological state (parturition) was higher than that of clinically healthy cows [
19]. Redbo [
20] reported that chronic stress diminished the sensitivity of the adrenal cortex. Growing bulls responded to a long stress period due to tethering with a lower plasma cortisol concentration after receiving ACTH stimulation in comparison to bulls in the control group [
21]. Hair cortisol concentrations have been shown to correlate with adrenocortical activity after ACTH challenge during the 14-d interval before the collection of hair [
22], indicating its value as a biomarker for painful and acute events in this period for animals kept in the same environment [
8]. Fischer-Tenhagen et al. [
6] claim that cortisol concentration acts as a valuable biomarker for chronic lameness in dairy cows. Cortisol has been employed as a stress biomarker in lame cattle [
11]. On the day of diagnosis, serum cortisol concentrations were elevated in cows diagnosed with lameness [
23]. The study of O’Driscoll et al. [
17] demonstrated, that on the day of diagnosis, the cortisol concentration in serum was elevated in cows with sole ulcers. Our data did not show any influence of the lameness score on the cortisol concentration, which is in agreement with O’Driscoll et al. [
17] who reported the cortisol concentration in cows with sole hemorrhages.
In our study, the negative relationship between milk yield and blood cortisol concentration in cows of the LA group could be attributed to the deteriorating welfare of animals due to lameness. The results of this study are confirmed by the results obtained by Miyazawa [
24], where a negative association between milk yield and plasma cortisol concentration and hormone release in response to the process of milking has been established [
25]. This study concluded that lameness is a stress factor in Lithuanian black and white cows, which leads to elevated cortisol concentrations. The increase of stress in lame cows affected the milking process—weaker stimulation of milk ejection reflex and consequently lower milk yield in lame cows. During milking, the milk flow was recorded with a specially rebuilt set of Lactocorders (Werkzeug und Maschinenbau Berneck AG, Balgach, Switzerland). Over-milking has been defined as milking that has been continued after the milk flow has suddenly dropped below 0.2 kg/min. Milk within the udder can be divided into two fractions: cisternal milk, which is immediately extracted by the machine and does not require oxytocin release, and alveolar milk, which can only be removed by the active involvement of the animal, when oxytocin release affects the milk ejection [
26]. When the animals are physiologically stressed, suffering from acute events, or long-term bad conditions of milking [
27], we can record physiological responses such as high levels of cortisol and diminished sensitivity to ACTH [
28]. Redbo et al. [
20] documented that chronic stress leads to a lowered sensitivity of the adrenal cortex. Reduced secretion of ACTH and cortisol during continuous stressful situations, such as chronic lameness, is a clear example of the hormonal regulation to prevent prolonged exposure to elevated concentrations of cortisol as described by Knights and Smith [
29]. It is often described that this leads to a clear partial or total inhibition of the milk ejection reflex, a delay in milk ejection, and/or a reduced milk flow [
30]. Such a delayed milk ejection presents itself with bimodal milk flow curves [
31]. De Mol et al. [
32] and Kamphuis et al. [
33] also showed this effect in their models. Milk yield may have an effect on prediction accuracy for lameness, but Pavlenko et al. [
34] even excluded it from their models because it had no association with lameness in their data.


 ,
, 


