Article

A New Breeding Strategy towards Introgression and Characterization of Stay-Green QTL for Drought Tolerance in Sorghum

by
Nasrein Mohamed Kamal
1,2,*,
Yasir Serag Alnor Gorafi
1,3,
Hanan Abdeltwab
3,
Ishtiag Abdalla
3,4,
Hisashi Tsujimoto
1 and
Abdelbagi Mukhtar Ali Ghanim
1,5
1
Arid Land Research Center, Tottori University, 1390 Hamasaka, Tottori 680-0001, Japan
2
Biotechnology and Biosafety Research Centre, Agricultural Research Corporation, P.O. Box 30, Shambat, Khartoum North, Sudan
3
Agricultural Research Corporation, P.O. Box 126, Wad Medani, Sudan
4
Agribusiness and Consumer Sciences Department, Faculty of Agriculture and Food Sciences, King Faisal University, P.O. Box 400, Al-Ahssa 31982, Saudi Arabia
5
Plant Breeding and Genetics Laboratory, FAO/IAEA Joint Division, International Atomic Energy Agency (IAEA), 2444 Seibersdorf, Austria
*
Author to whom correspondence should be addressed.
Submission received: 2 June 2021 / Revised: 22 June 2021 / Accepted: 24 June 2021 / Published: 28 June 2021
(This article belongs to the Special Issue Biotic and Abiotic Stresses in Crop Plants)

Abstract

:
Several marker-assisted selection (MAS) or backcrossing (MAB) approaches exist for polygenic trait improvement. However, the implementation of MAB remains a challenge in many breeding programs, especially in the public sector. In MAB introgression programs, which usually do not include phenotypic selection, undesired donor traits may unexpectedly turn up regardless of how expensive and theoretically powerful a backcross scheme may be. Therefore, combining genotyping and phenotyping during selection will improve understanding of QTL interactions with the environment, especially for minor alleles that maximize the phenotypic expression of the traits. Here, we describe the introgression of stay-green QTL (Stg1–Stg4) from B35 into two sorghum backgrounds through an MAB that combines genotypic and phenotypic (C-MAB) selection during early backcross cycles. The background selection step is excluded. Since it is necessary to decrease further the cost associated with molecular marker assays, the costs of C-MAB were estimated. Lines with stay-green trait and good performance were identified at an early backcross generation, backcross two (BC2). Developed BC2F4 lines were evaluated under irrigated and drought as well as three rainfed environments varied in drought timing and severity. Under drought conditions, the mean grain yield of the most C-MAB-introgression lines was consistently higher than that of the recurrent parents. This study is one of the real applications of the successful use of C-MAB for the development of drought-tolerant sorghum lines for drought-prone areas.

1. Introduction

Conventional plant breeding is primarily based on a phenotypic selection of superior individuals among segregating progenies resulting from crossing. Crop improvement for agronomical traits through phenotypic selections has many difficulties due to genotypic-environment interactions (G × E). The results are also unreliable due to the complexity of the target traits or environment. Developing new varieties using conventional breeding usually takes 8 to 10 years [1]. Despite breeders’ keen interest over many years, the application of marker-assisted selection (MAS) or backcrossing (MAB) often fails to live up to expectations. MAS/MAB is distinguished from conventional breeding methods by being less time consuming and labor-intensive and provides better results. Generally, single characters with high heritability are easier to score phenotypically than polygenic traits with low heritability, and therefore there is a general concept that MAS/MAB should be applied to polygenic traits with low heritability [2,3]. One of MAS/MAB great advantages is the ability to eliminate plants with undesirable gene combinations at early stages. This will allow breeders to concentrate on a few high-priority lines in the subsequent generations, before considerable labor cost investments. However, despite all these merits, good agronomic performance and environmental interactions are very difficult to ascertain in small populations required for MAS/MAB. In other words, a marker assay may not predict phenotype with 100% reliability. To overcome this limitation in MAS and improve the selection efficiency and accuracy, researchers combined both the phenotypic and genotypic selections. Lande and Thompson [4] reported that combining MAS with phenotypic selection have many advantages over MAS or phenotypic screening alone. It maximizes the genetic gain. Bohn et al. [5] investigated the prospect of MAB for improving insect resistance in tropical maize and found that MAB alone was less efficient when comparing with conventional phenotypic selection, but the relative efficiency was slightly increased when MAB and phenotypic screening were combined. In identifying a major QTL for scab resistance on chromosome 3BS in wheat, a combination of MAS and phenotypic screening was more effective than phenotypic or genotypic screening alone [6]. The relative advantage of MAS over phenotypic selection decreases rapidly when the fraction of the total genotypic variance explained by the QTL included in the selection index decreased [7]. Moreau et al. [8] used the term ‘combined MAS’ (C-MAS) to describe the process in which MAS is combined with phenotypic selection. This approach could be used when some QTL controlling target traits are still unidentified or when manipulating many QTLs. The same conclusion was reported in introgression of drought tolerance in maize [9] and scab resistance in wheat [6]. Furthermore, it is necessary to confirm the MAS results for traits or genes their map location is unknown [10,11]. Another major disadvantage of applying MAS at early generations is the cost of plants genotyping. In developing countries, for instance, the labor cost of field screening or phenotyping is lower than the cost of MAS. In such cases, the C-MAS approach will increase the efficiency of selection in breeding programs, shorten the time required for cultivar development, and thereby reduce the cost.
Sorghum is the fifth most important crop worldwide and the first important crop in Sudan where drought stress is a major productivity-limiting factor since most of the sorghum is grown under rainfed conditions [12]. Therefore, there is a strong need to assist farmers in the developing world by providing them with well-characterized cultivars that perform well under irrigated conditions and withstand high levels of drought. Stay-green (delayed leaf senescence) sorghum lines have been associated with drought tolerance and stalk and root lodging [13,14]. The stay-green character has high heritability ranging from 0.75 to 0.80 [15]. In sorghum, four QTLs (Stg1–Stg4) were successfully introduced using MAB from B35 line (donor) to R16 synchronized line, increasing the capacity of drought stress tolerance, which resulted from the introgression lines as reported by Kassahun [16]. This study’s objective was to introduce four stay-green QTLs (Stg1–Stg4) from the stay-green donor B35 into the Sudanese drought-sensitive cultivar ‘Tabat’ and the moderately drought-sensitive ‘Wad Ahmed’, using C-MAB with a minimum possible cost. In sorghum, many studies addressed the MAB of stay-green traits in sorghum [13,16,17,18]; however, this is the first example of applying C-MAB to develop stay-green lines to enhance sorghum drought tolerance. The introgression of the stay-green QTL was efficient, and the cost of C-MAB was affordable. Under the irrigated conditions, the BC2F4 lines were superior to their donor parent in their agronomic performance and to the recurrent parents in their tolerance under drought conditions. The C-MAB can be used successfully to introduce the stay-green QTL and develop drought tolerant lines.

2. Materials and Methods

2.1. Plant Materials

Sorghum line B35 was used as a donor for the stay-green trait, and ‘Tabat’ (TAB) and ‘Wad Ahmed’ (WA) were used as recurrent parents. TAB and WA were selected based on their drought sensitivity, agronomical performance, and their molecular polymorphism with B35 (Ali et al. [19]). TAB and WA have excellent yield potential and good agronomic performance; TAB is sensitive to post-flowering drought [20,21], and WA is moderately sensitive [22]. B35 is a partially converted selection of the durra sorghum IS12555 from Ethiopia [23] and is tolerant to post-flowering drought.

2.2. SSR Markers and Stay-Green QTL

Four QTLs associated with the stay-green trait (Stg1Stg4), located on three linkage groups in the sorghum genome [24], were the targets of MAB. A total of 60 SSR markers, uniformly distributed throughout the 10 sorghum chromosomes [24] were used for the parental polymorphism survey among B35, TAB, and WA. Twenty-four SSR markers linked to the four stay-green QTLs in various linkage groups (Supplementary Table S1) and polymorphic among the parental lines were chosen to represent 6 markers for each of the stay-green QTL. These SSR markers were used for foreground selection to select individuals presumably having the donor allele at a particular target stay-green QTL.

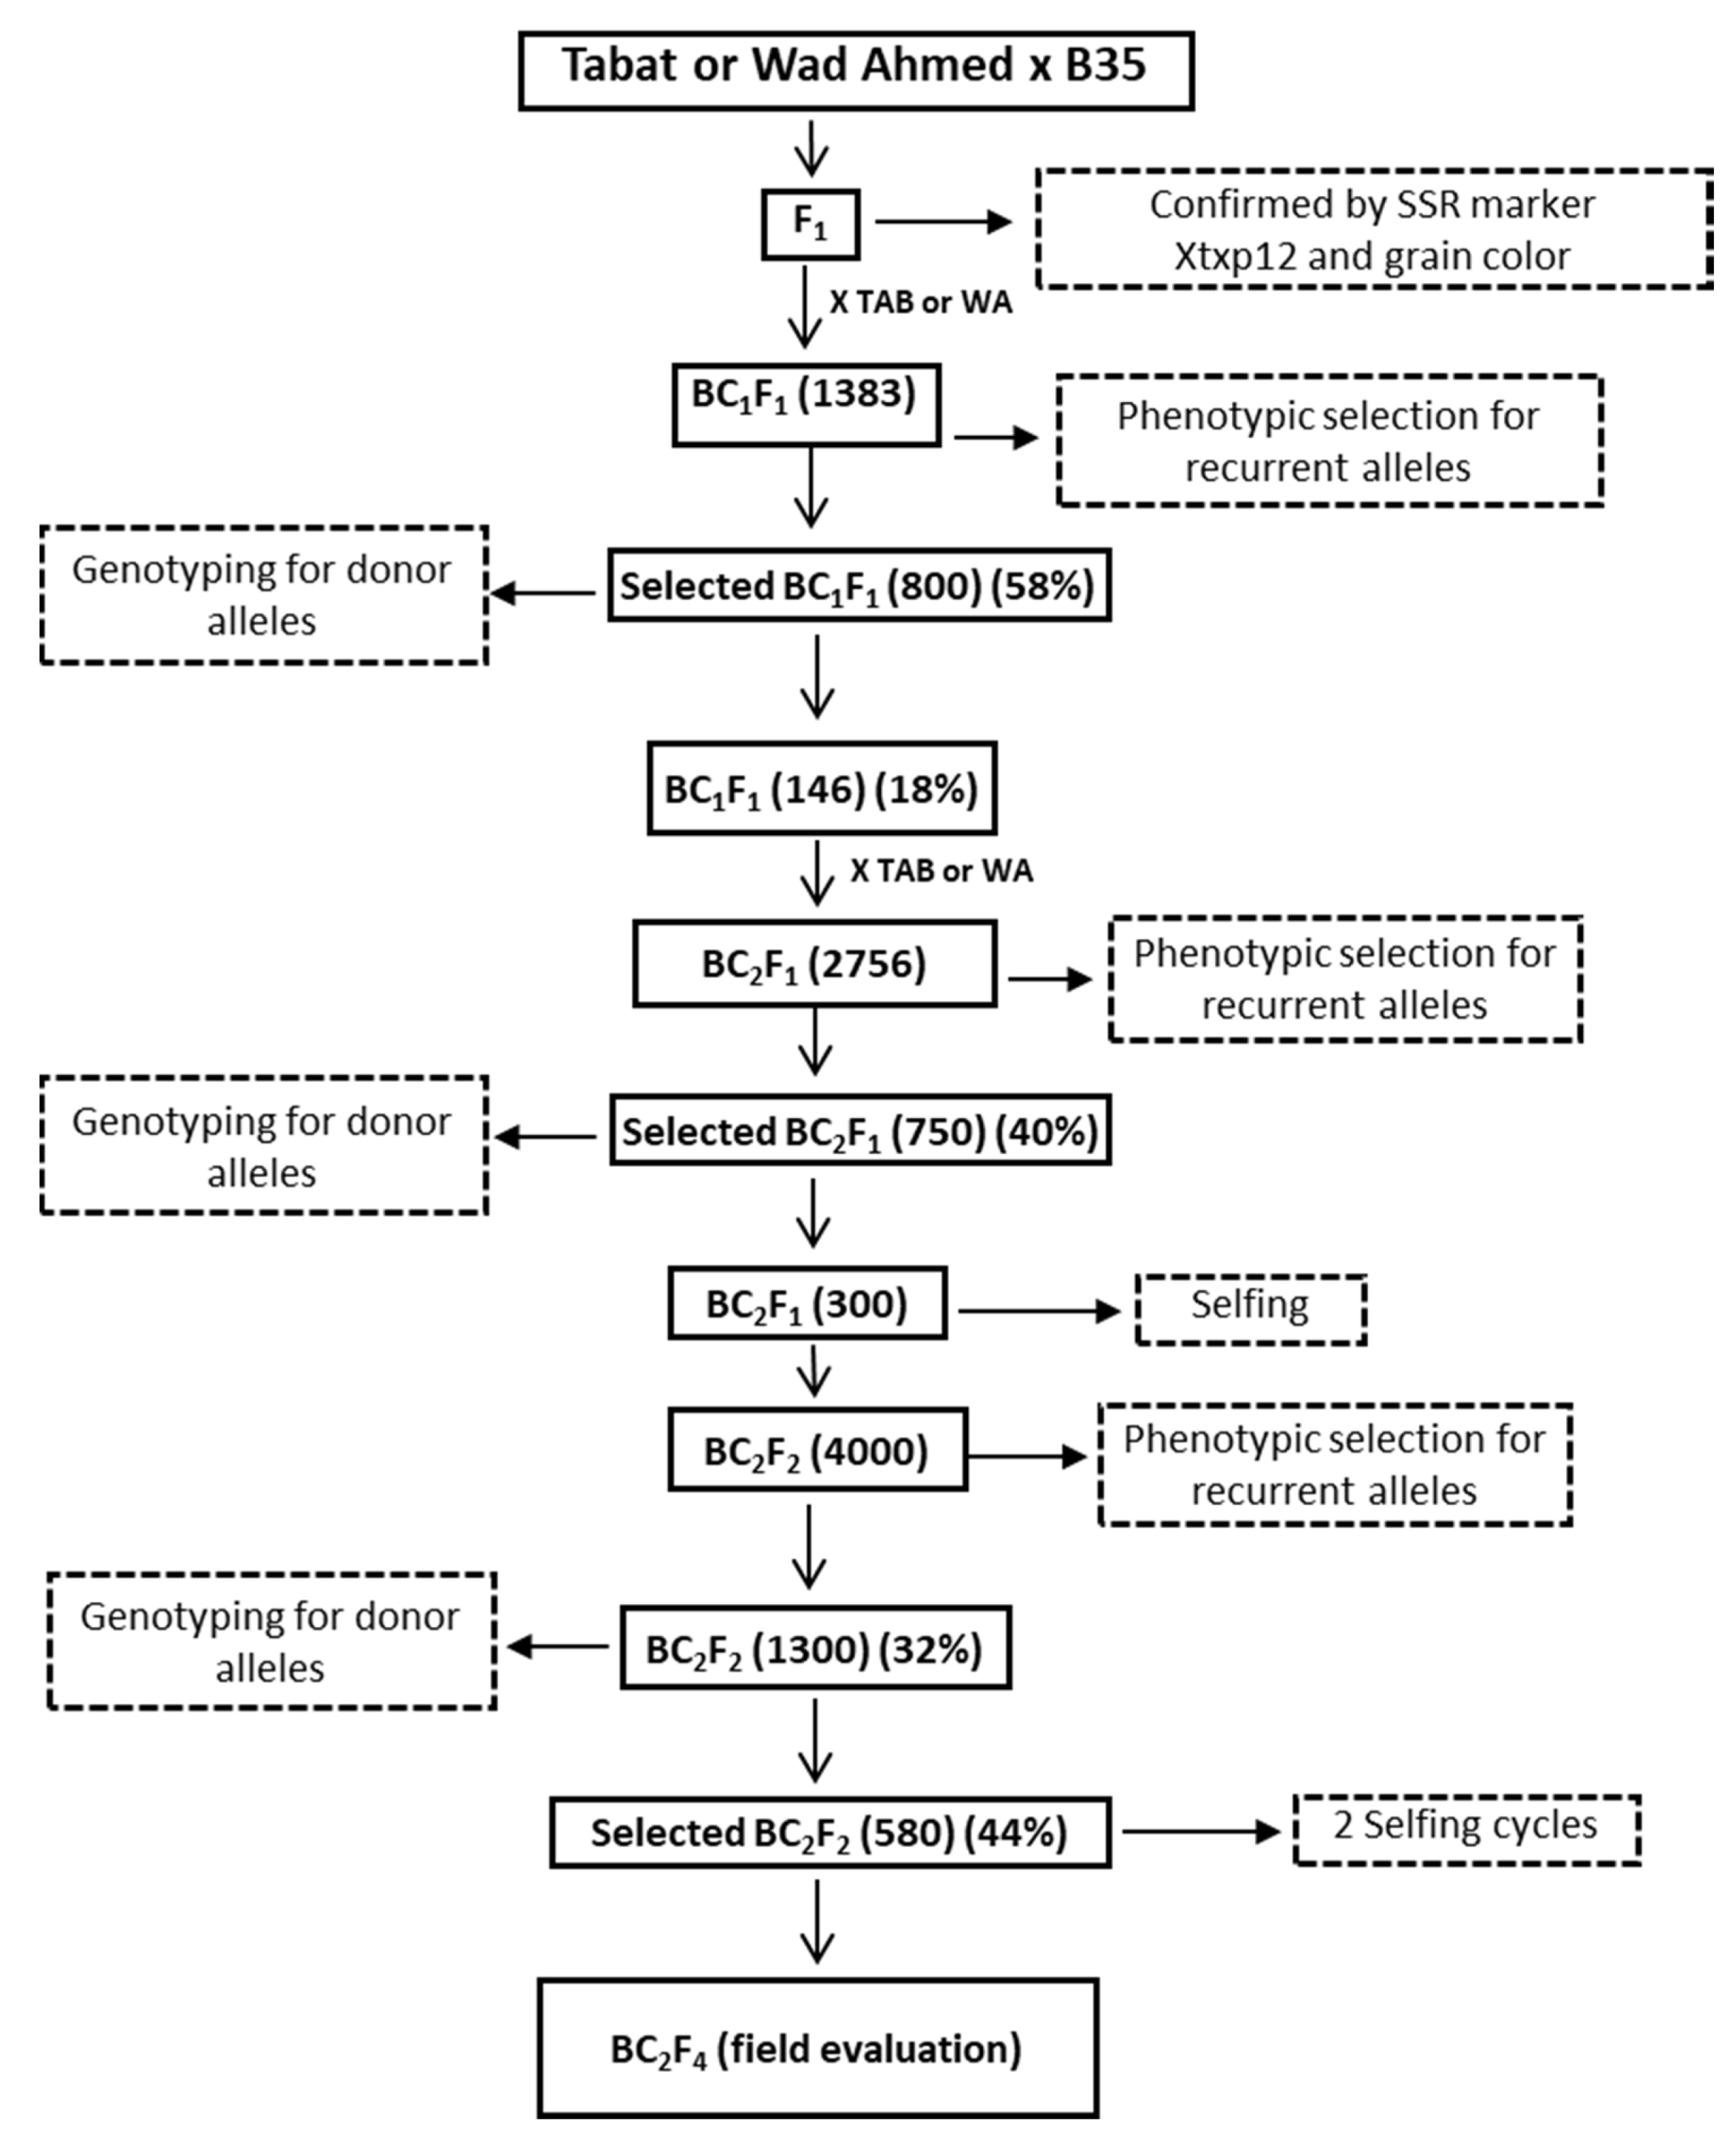
2.3. Crossing Scheme and Generations Development

C-MAB was used to introgress the stay-green loci into the TAB and WA backgrounds (Figure 1). B35 was crossed with TAB or WA, and the F1 plants were identified using the grain color phenotype (Dark creamy pericarp in B35 [25]), and then confirmed with the SSR marker Xtxp12 (Supplementary Figure S1). F1 plants were backcrossed to their recurrent parents (TAB or WA) to generate the BC1F1 and subsequent populations.
We grew the BC1F1 progeny in a nursery and scored their agronomic performance under irrigated condition on a scale from 1 to 3 (1, good (similar to TAB or WA); 2, medium; 3, poor). The stay-green trait was scored visually as in terms of greenness at physiological maturity (GM) (1, no senescence; 2, medium senescence; 3, complete senescence); a similar scale has been used in sorghum and maize [26,27,28]. Plants with poor agronomic performance (which required more BC cycles) and low GM were excluded from genotyping. Individuals carrying stay-green QTL in the BC1 and BC2 generations were selected during the first step (foreground selection). We did not apply background selection since we relied on agronomic performance, which was an effective alternative. The BC1F1 plants were backcrossed to the recurrent parent to generate BC2F1. The BC2F1 plants were self-pollinated, and the resulting BC2F2 plants from the TAB and WA populations were scored and the selected plants were genotyped and self-pollinated twice to produce BC2F4 lines (Figure 1).

2.4. DNA Pooling, Duplex, and Multiplex PCR Approach in Genotyping

Notable progress has been made in methods of duplex, triplex, and multiplex PCR as a rapid and accurate tool [29,30]. To reduce the cost of genotyping, we used pooled DNA genotyping coupled with duplex and triplex PCR (Supplementary Figure S2). Approximately 10 samples with the same DNA concentration and scores from different backcross lines were pooled; in pools positive for any of the target QTL, individual samples were tested. Based on the melting temperature, amplification product size, and sequence similarity, the primers were grouped into two and three pairs to be used simultaneously in a single reaction mix.

2.5. Drought Adaptation Experiment for BC2F4 Stay-Green Introgression Lines

To test the effects of the introgressed stay-green QTL and ensure the success of the C-MAB, we evaluated 98 stay-green introgression lines (BC2F4; 46 from TAB and 52 from WA) and their parents under irrigated and rainfed conditions. All the irrigated evaluation was conducted at the Faki Hashim Research Farm (15.841923° N, 32.552671° E), Khartoum North, Sudan. The soil was a Vertisol, clayey with low organic matter. We imposed two water regimes: W1, recommended optimum irrigation every 10 to 14 days until harvest, and W2, cessation of irrigation at 50% flowering to impose post-flowering drought. Plots in this trial consisted of three rows × 5 m in a 6 (blocks per replication) × 9 (entries per block) alpha design with three replications in each water regime. The recommended fertilizer dose for sorghum (Urea, 40 kg N/fedan) was applied. After 50% flowering, growing lines depended on the stored soil moisture insured the exposure to post-flowering drought stress during grain filling [31].
The rainfed experiments were conducted at three locations with different rainfall levels. The South and North Gedaref sites (14°34′ N, 35°54′ E) have an average annual rainfall of 514 mm (optimum) in the south and 175 mm (low) in the north, most of which occurs between July and September (Supplementary Figure S3a). The soil clay content is 75% to 80%. The water-holding capacity of the soil is very high and allows crops to grow on stored water during dry spells and long after the rainy season. Al Obeid site (13°11′ N, 30°13′ E) has low average annual rainfall, 271 mm (falling between July and September) (Supplementary Figure S3b). The soil is sandy clay with 25% clay, 67% sand, and 8% silt. The average rainfall differences during the cropping season are shown in Supplementary Figure S3.
At the irrigated site, data were collected on stay-green (delayed leaf senescence) parameters: greenness percentage (G) at grain filling (G.GF) and maturity (GM), green leaf area at maturity (GLA.M), and chlorophyll content score (visual scoring) based on Xu et al. [32] at grain filling (Chlo.GF) and maturity (Chlo.M), stem diameter (SD), plant height (PH), grain yield (GY), fresh plant biomass (PB), and harvest index (HI). In the rainfed environments, only GY and GM were collected. GM was calculated as the percentage of green leaves in the total number of leaves. GLA.M was estimated as the leaf area measured (cm2) multiplied by the number of green leaves.

2.6. Statistical Analysis

GenStat 18th Edition (VSN International, Hemel Hempstead, UK) was used to carry out analysis of variance (ANOVA) of phenotypic data. Multi-location alpha-lattice design was used in which genotype (G), environment/location (E), and their interaction (G × E) were considered fixed factors, while the interactions between the replications and blocks were considered random factors. Least significant difference (LSD0.05) test was used for mean separation comparisons. Multiple linear regression analysis, Pearson’s correlation, and PCA analysis were performed using the R package version 4.0.3. Phenotypic differences in rain fed experiments were analyzed by ReML analysis, with genotypes as fixed effects and replication and block within replication as random factors.

2.7. Cost Analysis

The budget analysis method incorporates aspects of economics (both fixed and variable costs) and plant breeding (breeding records and program details) that allow breeders to more quickly and efficiently judge how the implementation of DNA technologies affect costs and benefits their program [33]. The costs of inputs and activities were calculated and described (Table 1). The variable costs of inputs were estimated using world market prices for the imported inputs (laboratory materials excluding the labor component) and local prices for the local inputs (calculated in USD at the current exchange rate). Finally, the total costs were calculated [34] (Table 1).

3. Results

3.1. Development of Stay-Green Introgression Lines Using C-MAB

Details of C-MAB are shown in Figure 1. F1 plants were produced from the crosses of B35 (Dark creamy grain color) as reported by [25] with TAB and WA (white grain color). Based on the effect of the grain color (dark creamy grains) as a physio-morphological marker, F1 grains representing TAB and WA populations were selected. The F1 plants (having B35 color) were confirmed using the SSR marker Xtxp12 (polymorphic marker between donor and recurrent parents), whereas the selfed F1 (white seed color) were excluded (Supplementary Figure S1). The true F1 plants were backcrossed to their recurrent parents, and all BC1F1 grains (representing “TAB × B35” and “WA × B35” progenies) were sown in the field, and the introgression lines (ILs) were scored for agronomic performance. Among BC1F1 plants, 58% with a score of 1 were genotyped. ILs were genotyped using a minimum of four PCR-based markers flanking each locus within the target regions (on chromosomes 2, 3, and 10; linkage groups B, C, and J, respectively) (Supplementary Table S1). SSR Markers were selected based on the quality of their polymorphisms and their combinability for multiplexed PCR amplification based on Ribaut and Hoisington [35]. From the genotyped BC1F1, 18% were selected and classified based on their stay-green QTL composition (Figure 1). In the TAB × B35 population, 38 ILs had one QTL (54%), 23 had two QTLs (34%), 2 had three QTLs (7%), and 1 had four QTLs (64 ILs in total; Figure 2a). In the WA × B35 population, 45 ILs had one QTL (59%), 25 had two QTLs (32%), 2 had three QTLs (7%), and 2 had four QTLs (74 in total; Figure 2a). In both populations, ILs with a single Stg1 or Stg4 were most frequent and ILs with a single Stg3 were the least frequent.

3.2. Development of BC2F1 and BC2F2 Generation

The BC2F1 ILs (from the two populations) were obtained from backcrosses of the selected BC1F1 ILs to the recurrent parents (Figure 1). The ILs were scored for their agronomic performance, and 750 (27%) ILs with good agronomic performance were genotyped, of which 300 (40%) were heterozygous at all marker loci flanking the target stay-green QTL. These 300 ILs were self-pollinated, and more than 2000 BC2F2 lines in each population were produced. About 4000 BC2F2 ILs from both populations were scored in the field for their agronomic performance, and 1300 (32%) ILs from both populations were selected for genotyping with SSR markers. Using pooled DNA and multiplex markers, a total of 580 (14%) BC2F2 plants from the two populations were found to have one or more QTL; 115 BC2F2 plants were homozygous for the targeted stay-green QTL. Interestingly, 50% of stay-green QTL combinations in BC2F2 generation were similar in both TAB and WA lines since the selection was based on combining good agronomic performance with high stay-green score. A strong relationship was detected between the stay-green score and agronomic performance score of BC1 and BC2 under irrigated condition (R2 = 0.89 * and 0.87 ***, respectively).
In the BC1F1 in both populations, among ILs with single QTL, the proportions were highest for Stg1 followed by Stg4, whereas among ILs with more than one QTL the proportions for Stg1 + Stg4 were the highest (Figure 2a). In the BC2F2, the proportions of Stg1, Stg2, and Stg4 were the highest in both backgrounds (Figure 2b). The combinations of Stg4, Stg2 + 4 and Stg2 + 3, Stg3 + 4 were only presented in TAB and WA ILs, respectively at BC2F2. The ILs with one, two, and three QTLs represented 74%, 21%, and 5%, respectively, of the two populations (Figure 2b).
The homozygous BC2F2 plants were self-pollinated twice to produce BC2F4 lines from the two populations. As a preliminary evaluation for the success of the C-MAB, 25 lines were selected from BC2F3 generation based on their agronomic performance and stay-green score, and then tested under irrigated conditions for their performance compared to their parents as reported by Christopher and others [36]. The results of the BC2F3 selected lines showed that some ILs having Stg2 from the two populations were comparable to their recurrent parents in grain yield (GY) and all the ILs had greenness at maturity (GM) higher than recurrent parents (data not shown).

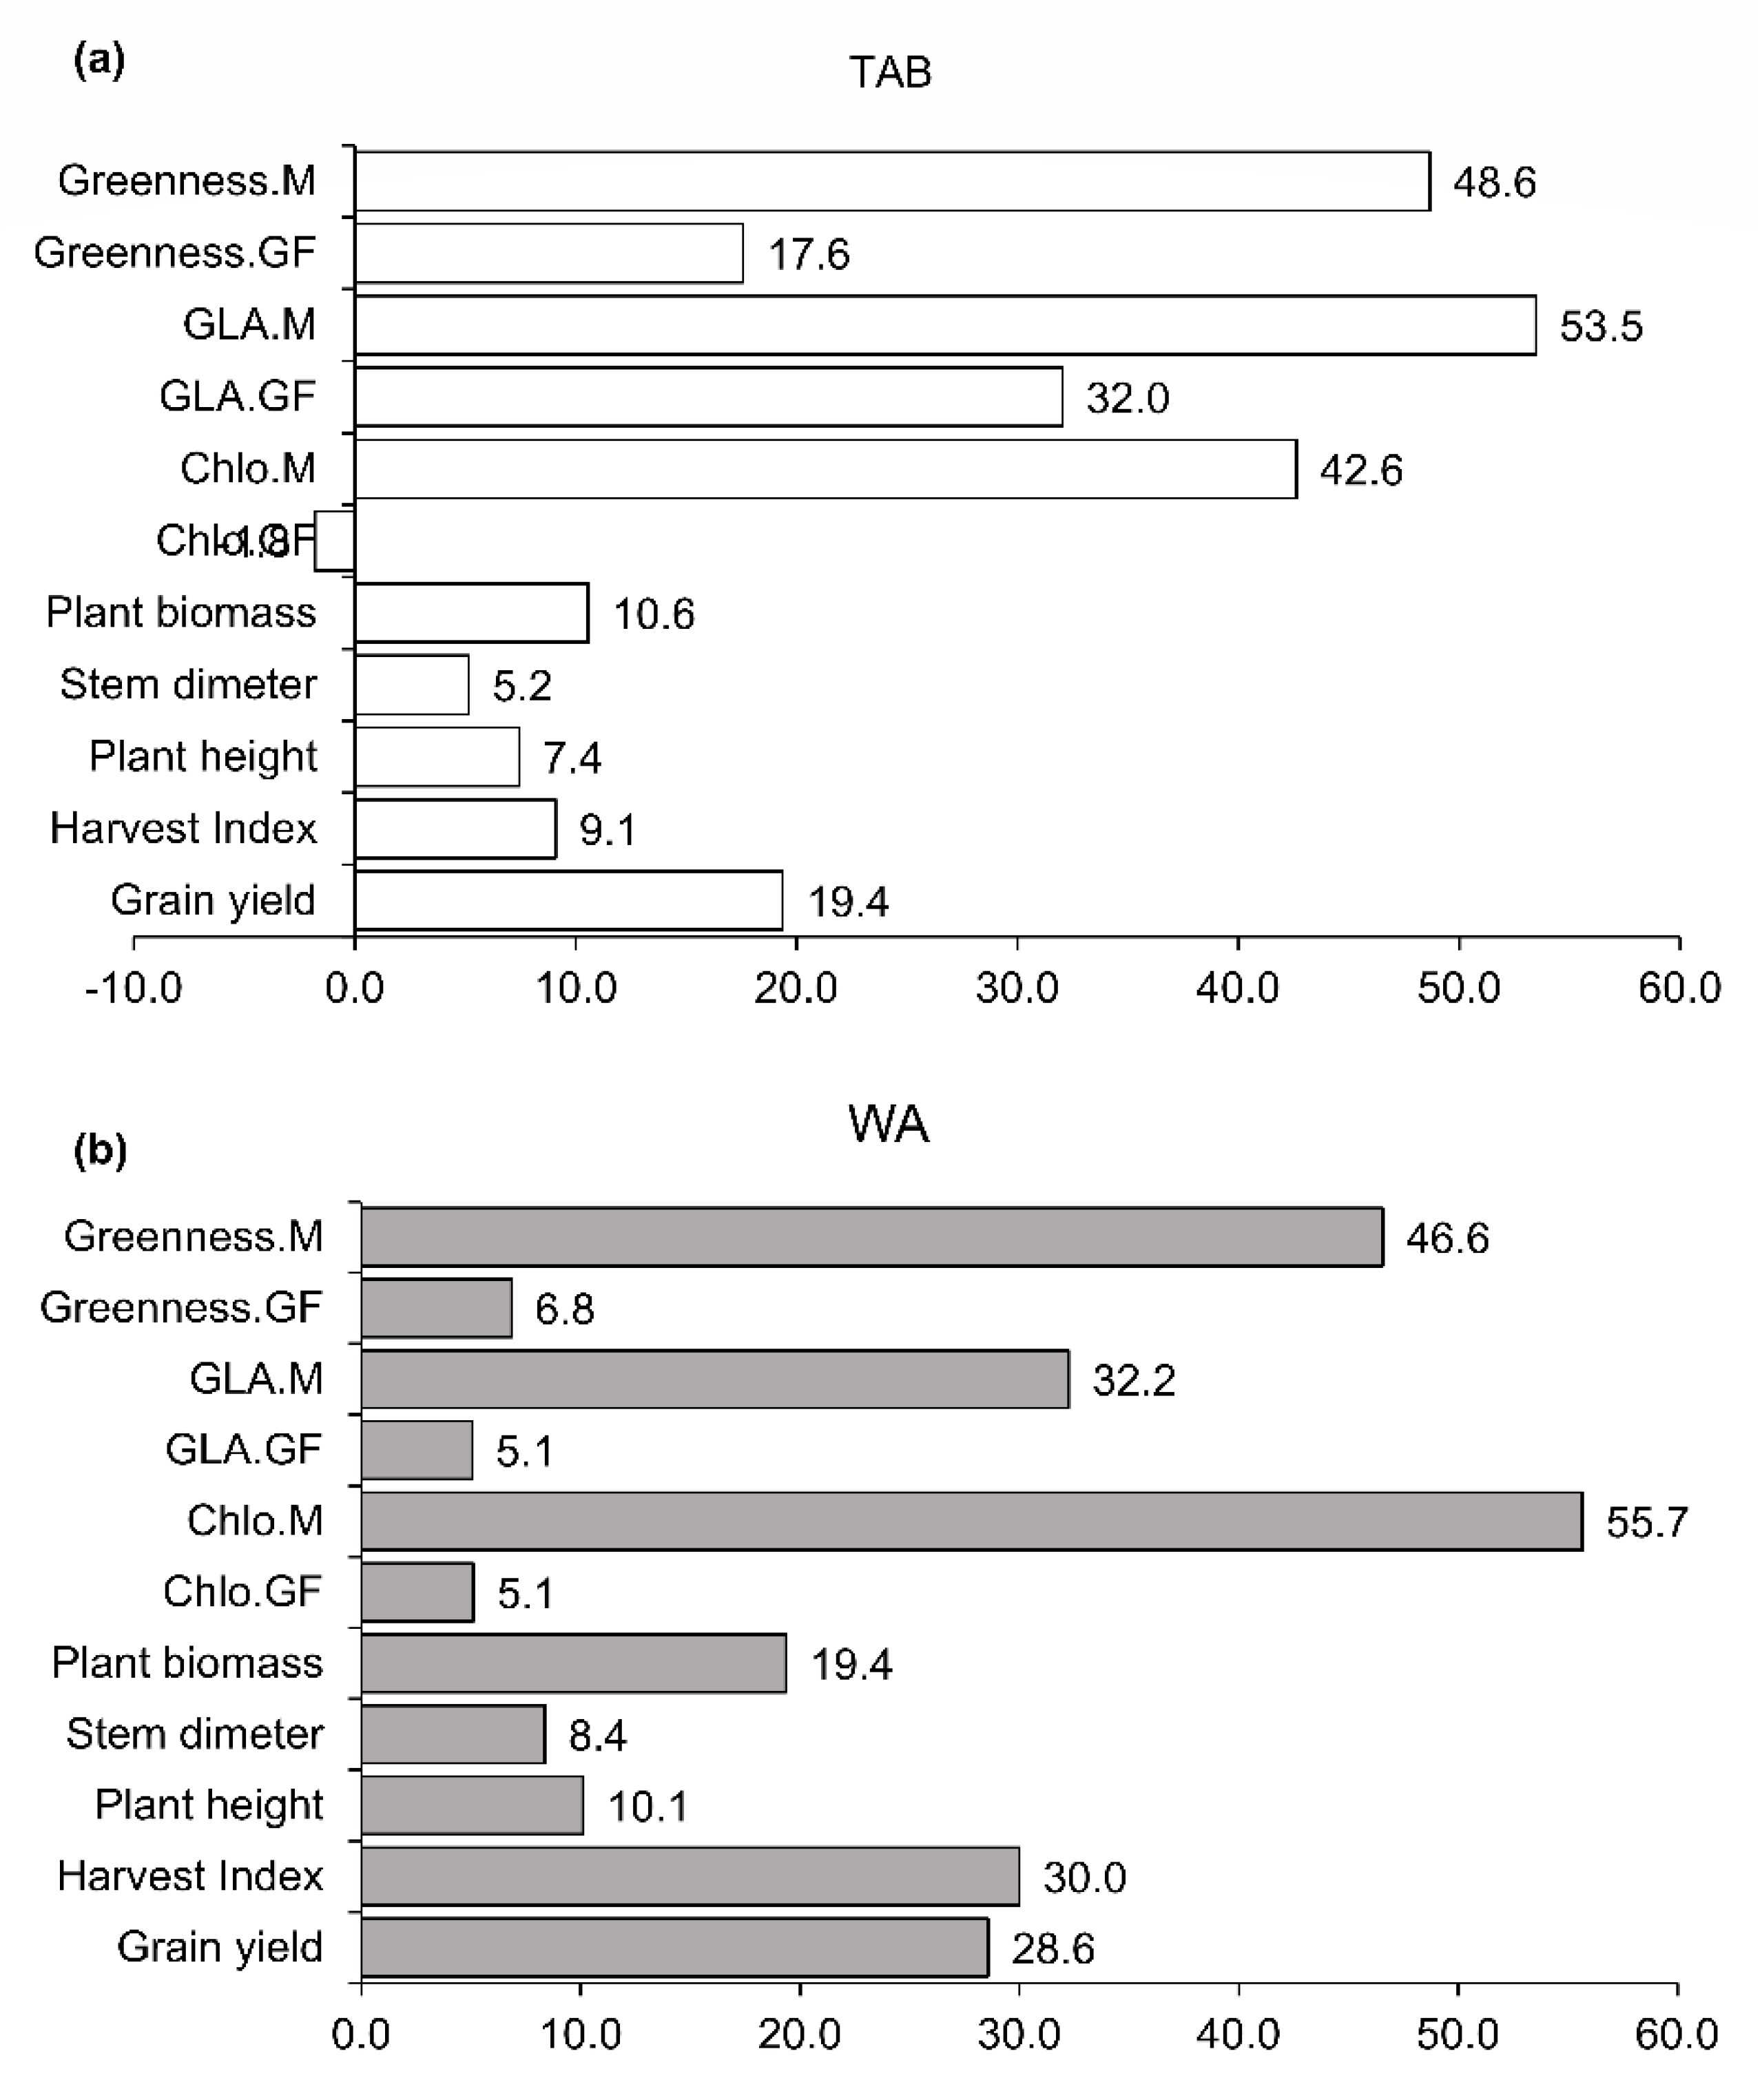
3.3. Field Performance of C-MAB-Introgression Lines

To assess and confirm the drought tolerance of the ILs from the two populations, BC2F4 ILs were evaluated in 5 different environments: irrigated (W1) and post-flowering drought (W2) in Faki Hashim Research Farm, Khartoum North, Sudan, early-onset drought stress in North Gedaref (NG) and Al Obeid (OB), and late-onset stress in South Gedaref (SG). These environments varied in their water availability (Supplementary Figures S3 and S4). The ILs and their parents were significantly different (p < 0.01) in most of the stay-green, grain yield, and its component traits both among individual plants and across the five environments (Supplementary Tables S2 and S3).

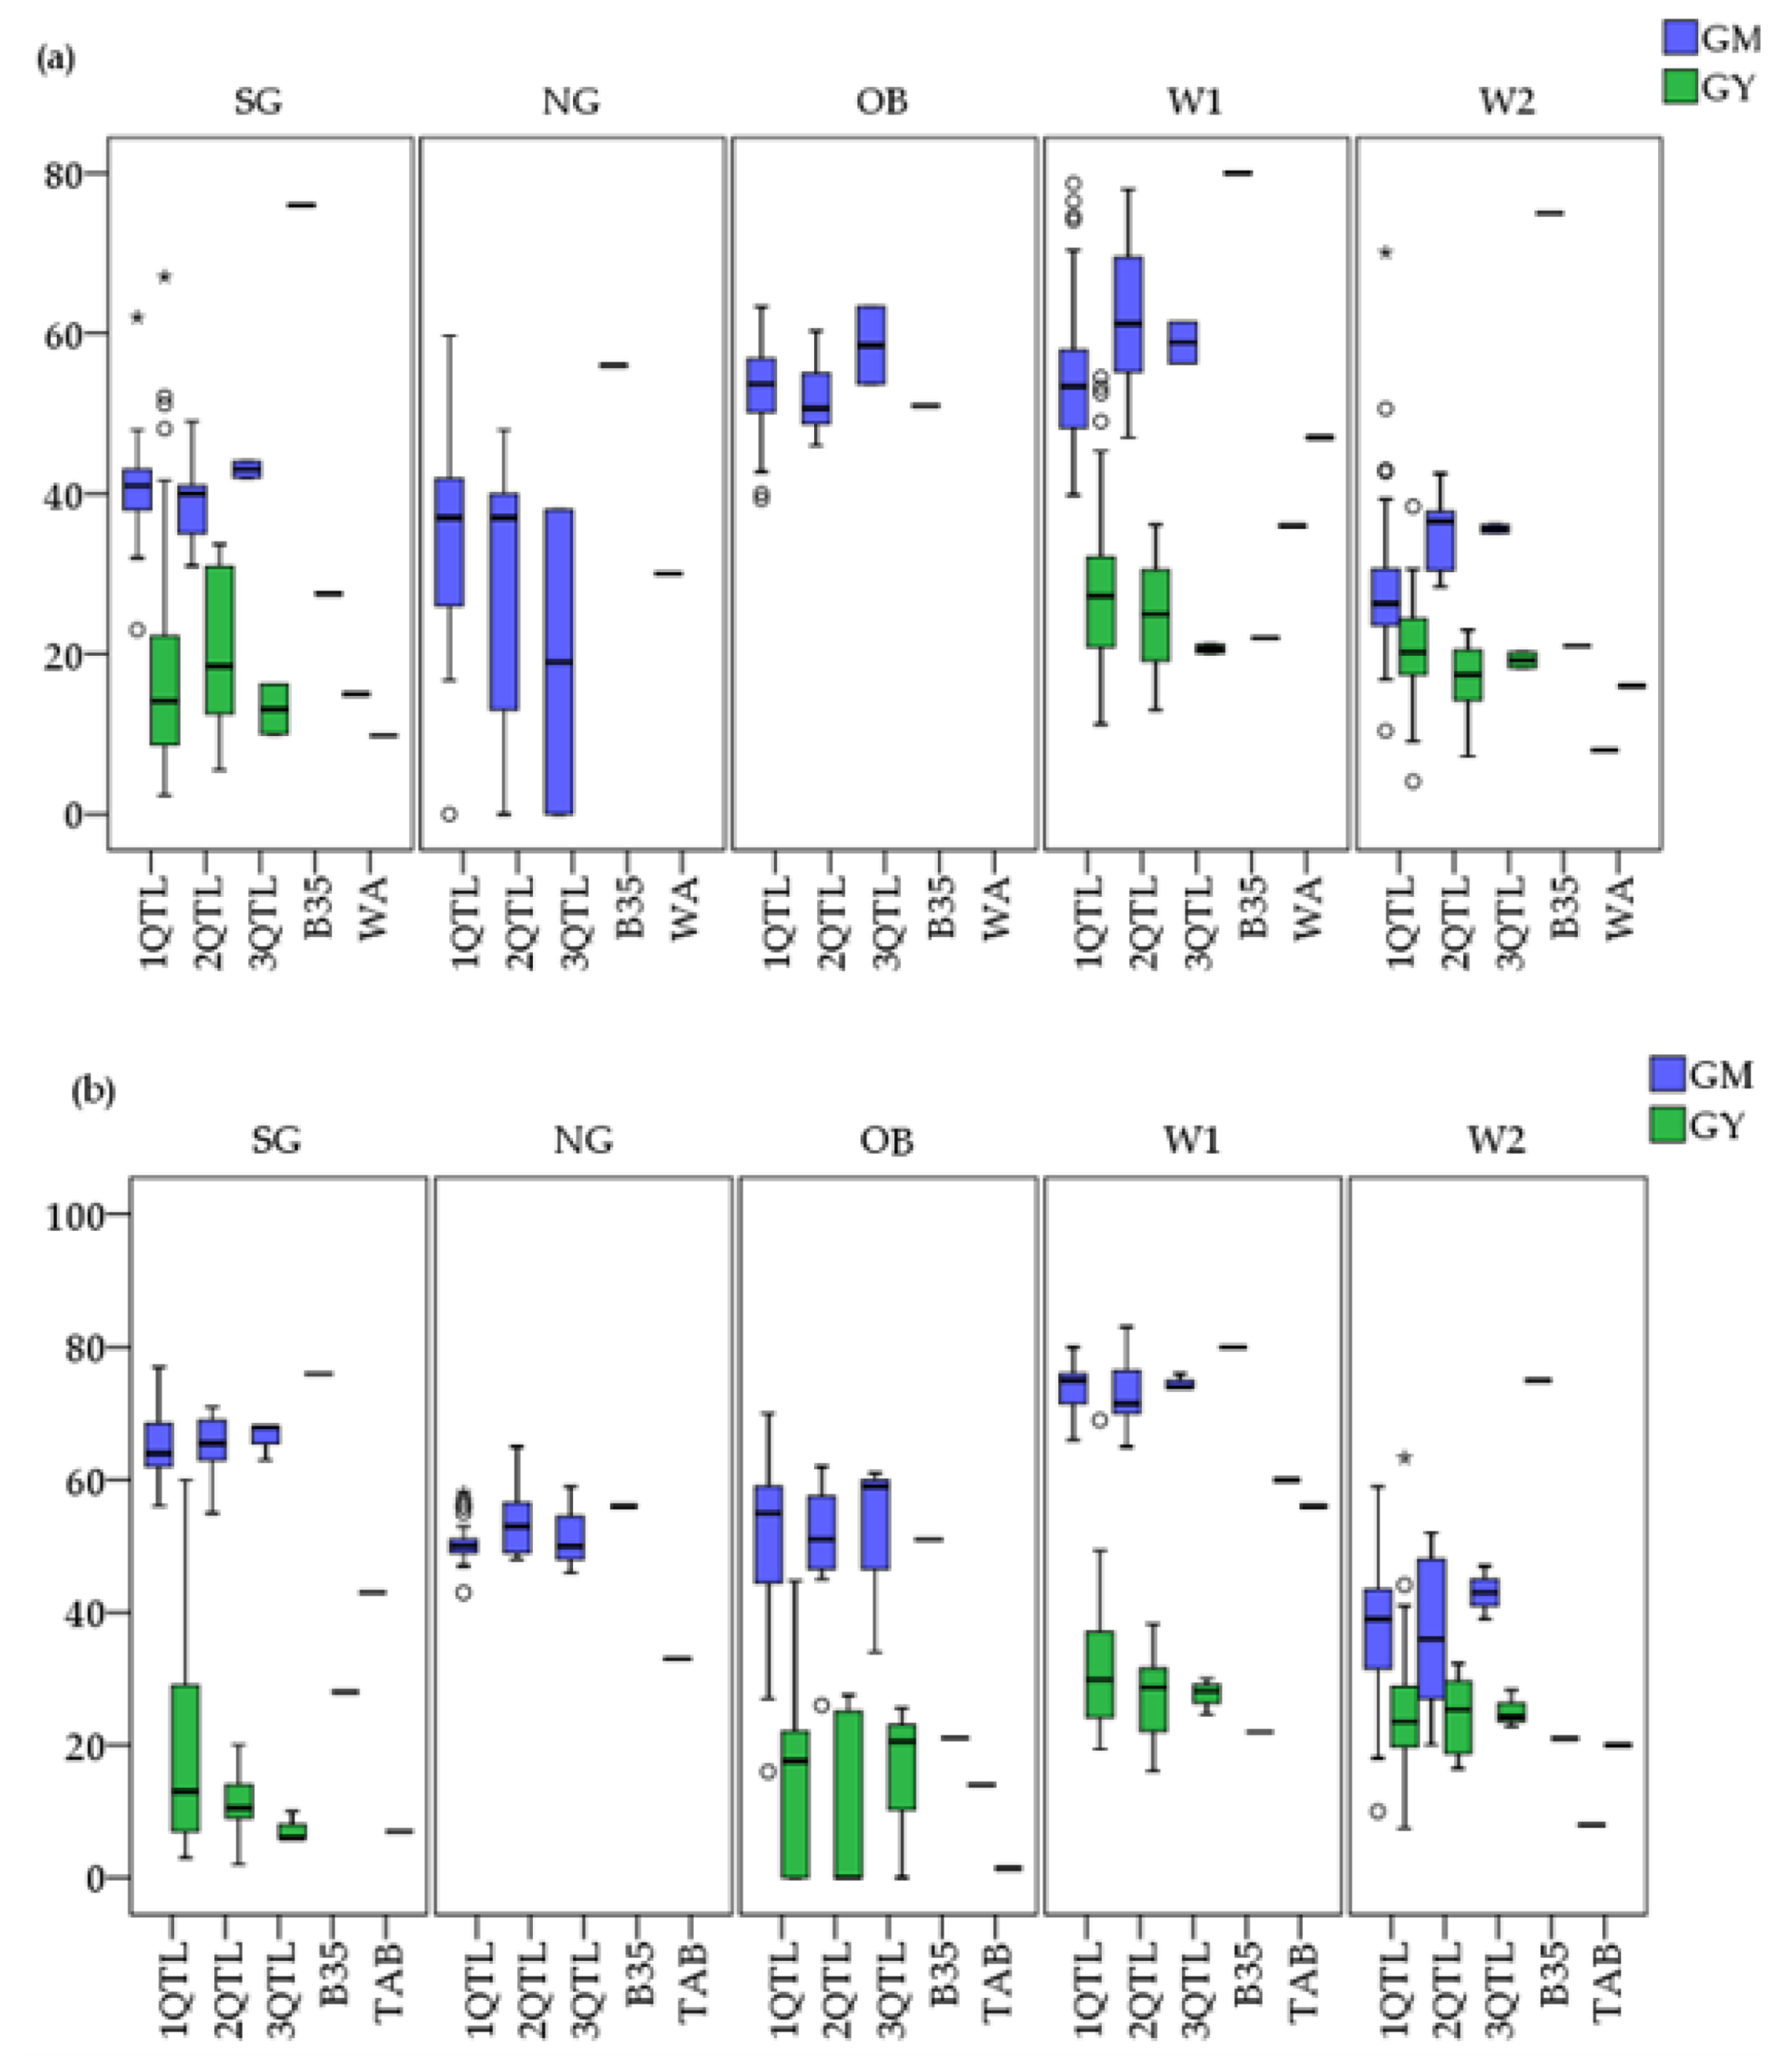
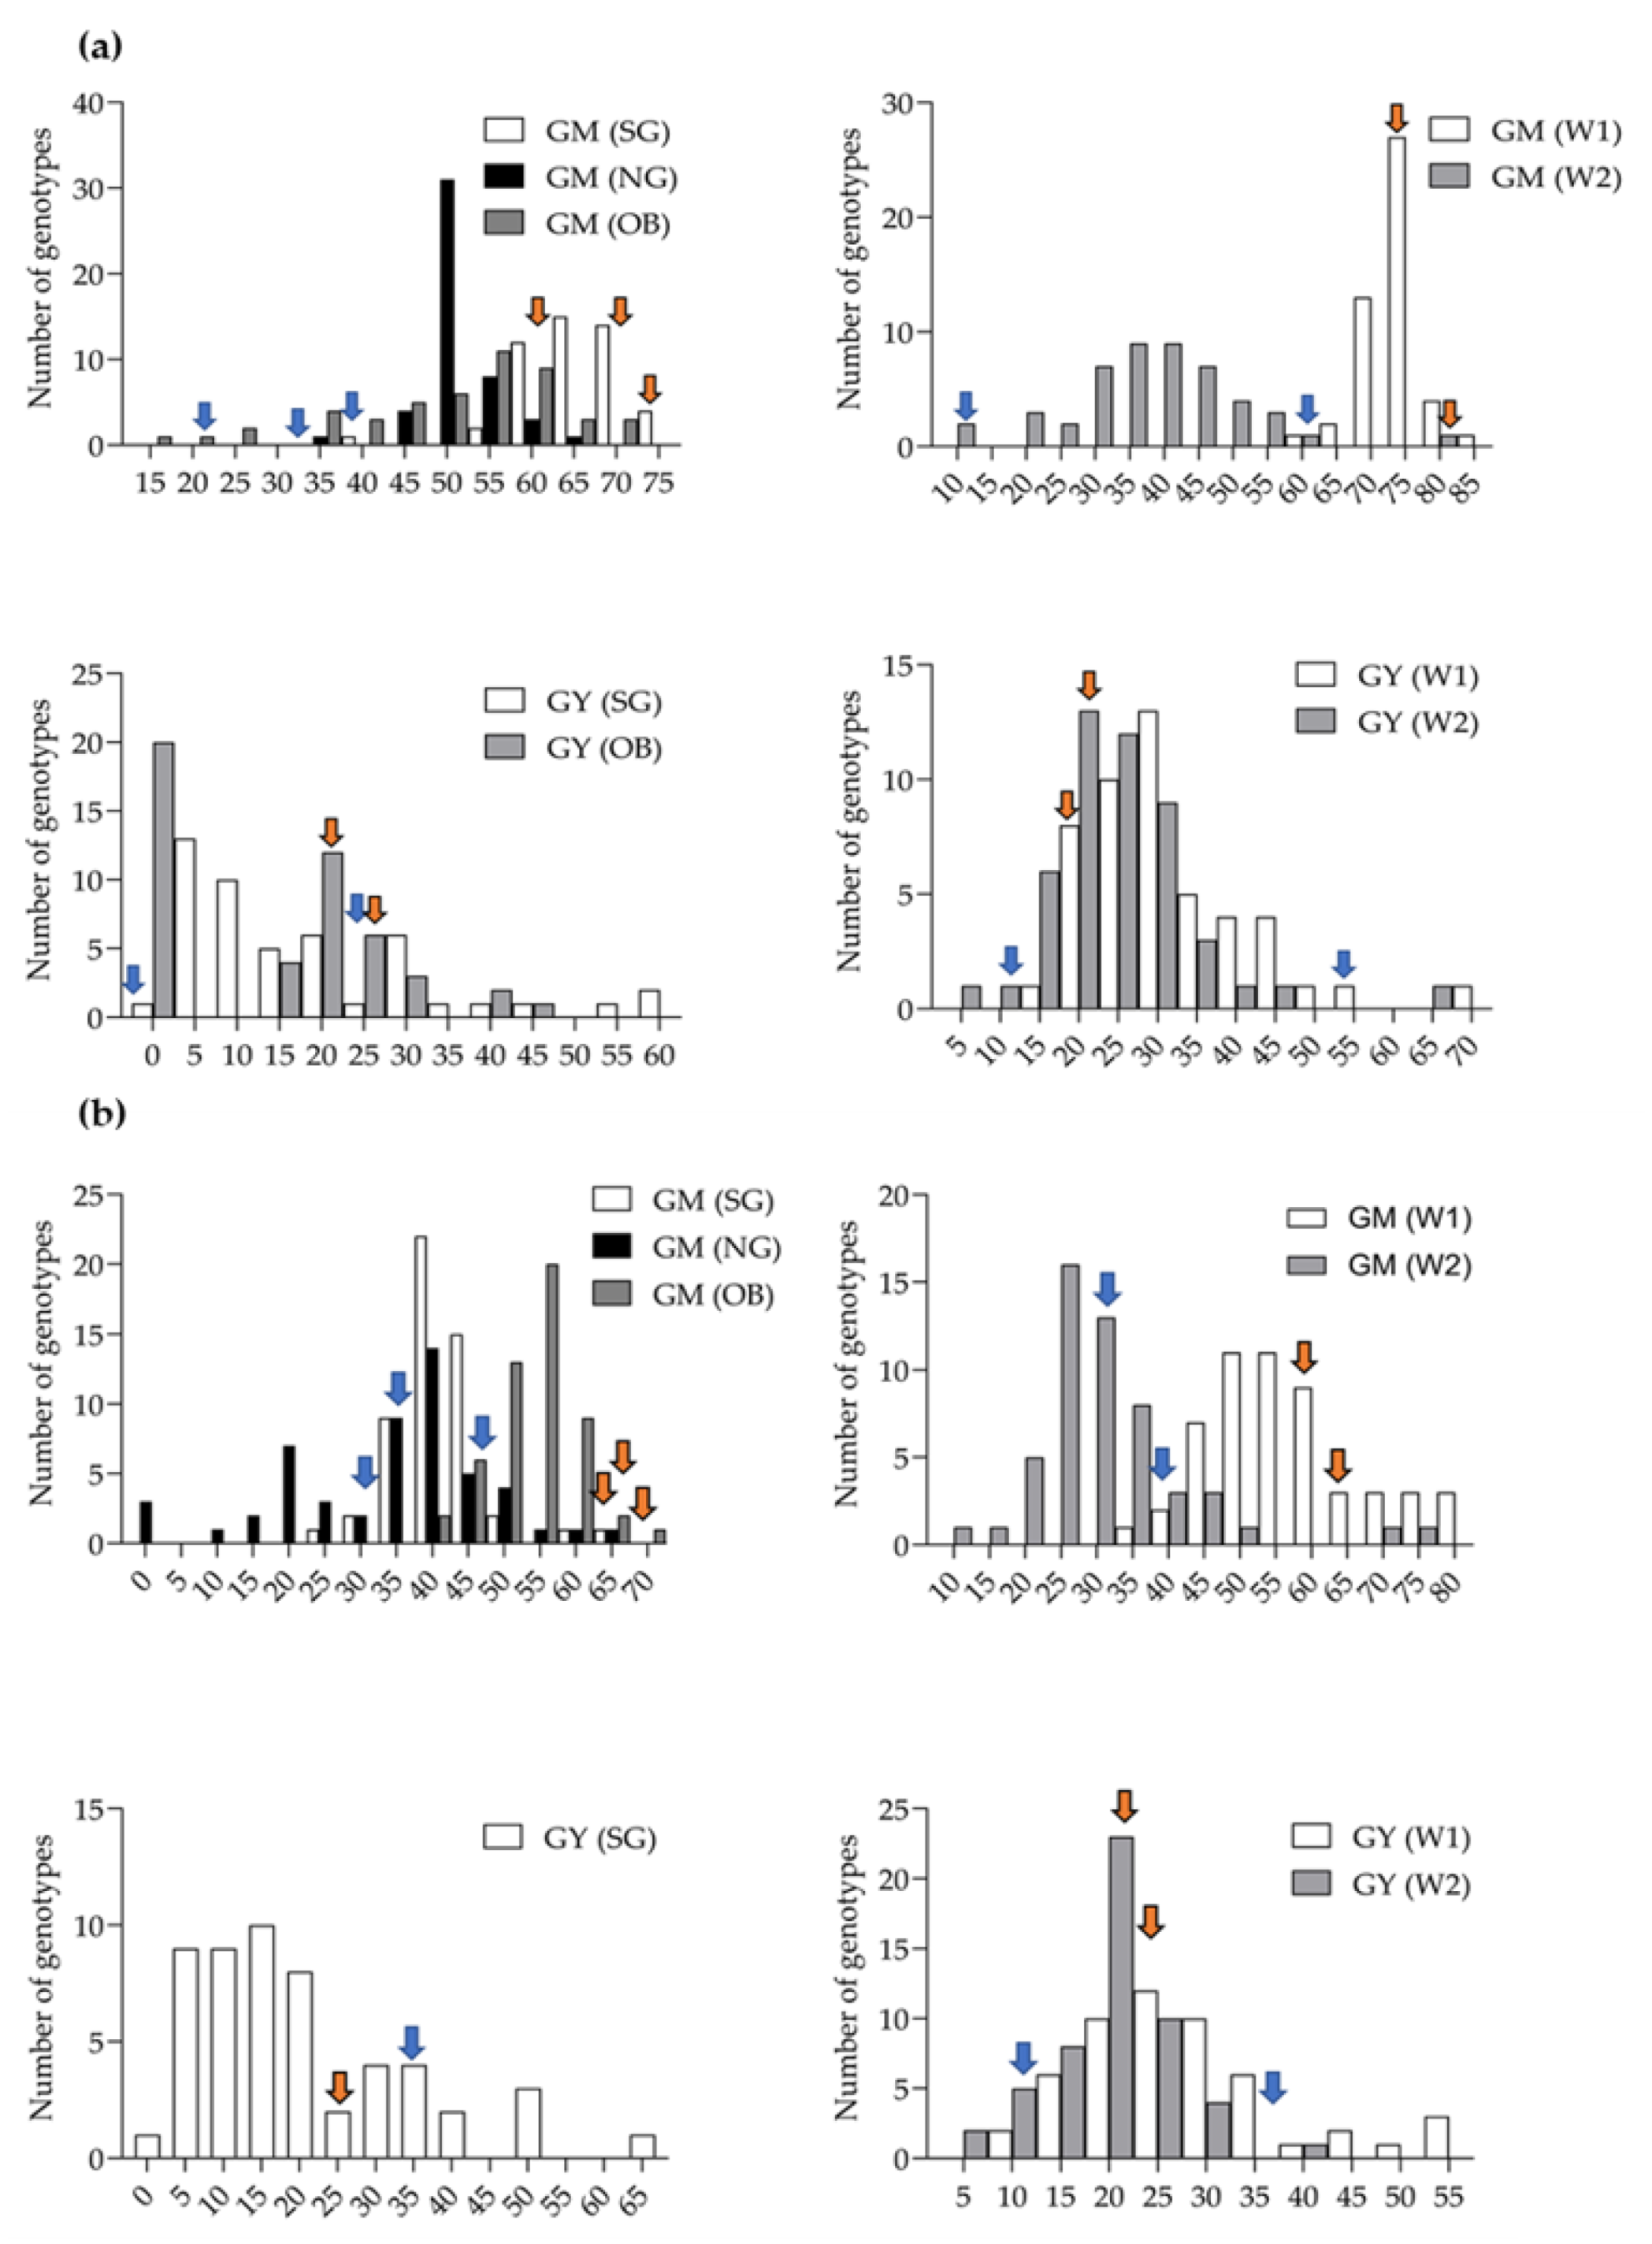
3.4. Performance of ILs under Irrigated and Rainfed Environments

At the Khartoum North experiment, post-flowering drought stress (W2) significantly (p < 0.01) affected most of the traits measured (Figure 3, Supplementary Table S2). However, the ILs maintained better tolerance than their recurrent parents. The two populations responded to drought differently. In stay-green related traits, in both populations, the reduction ranged from no or low reduction in chlorophyll at grain filling to more than 50% in green leaf area at maturity (Figure 3).
In yield related traits, the reduction was higher in WA than in TAB population. As the objective of field evaluation is to examine the C-MAB success in improving TAB and WA’s tolerance, only the results of the GY and GM as a measure of the stay-green trait were explained in detail.
In both populations, although the reduction in GY was lower in all ILs (7–25% and 9–29% in TAB and WA ILs, respectively) than in their recurrent parents in response to drought, under W1 conditions the average GY (from the 98 ILs representing different QTL combinations) was lower in the ILs than in the recurrent parents regardless of the number of QTLs introgressed (Figure 4, Supplementary Table S2). However, in TAB population, one line significantly out yielded TAB and one line had a comparable yield to TAB under W1 condition (Figure 5a) whereas, in WA population, five ILs were comparable to WA in their GY potential under W1 (Figure 5b). In both populations, ILs with one QTL had a higher reduction than ILs with two and three QTL (Supplementary Table S2).
Under the three rainfed environments (South Gedaref, North Gedaref, and Al Obeid, with optimum and low rainfall, respectively), the ILs differed significantly (p < 0.001) in all stay-green and GY traits, and the G × E interactions were also significant (p < 0.05) (Supplementary Table S3).
A severe drought during the vegetative stage resulted in no GY in most ILs in both populations in North Gedaref and the WA population in Al Obeid (Supplementary Figure S4).
In the three rainfed environments, GM and GY of ILs and parents varied in the two backgrounds (TAB and WA) (Figure 4, Supplementary Table S3). In South Gedaref, GY was higher in the ILs in both populations than in their recurrent parents. The yield advantage in the TAB population ranged from 32 to 65%, whereas in WA population, it ranged from 26 to 54%. In Al Obeid, GY was higher in ILs than in TAB, with a yield advantage ranging from 76 to 91% (Supplementary Table S3). At South Gedaref for TAB and WA populations, and Al Obeid for TAB population, we were able to identify ILs that had higher or comparable GY than recurrent parents. However, the highest number of ILs that out yielded TAB was observed in Al Obeid (Figure 5).
In both populations, GM was higher in ILs than in their recurrent parents under both W1 and W2 (Figure 4, Supplementary Table S2). B35 had the highest GM (75–82%) at both W1 and W2 and the lowest reduction (3.7–6.3%). The reduction in GM was highest in the recurrent parents and intermediate in ILs (39–50%). The lowest reduction was in ILs with three QTL and the highest reduction in those with one QTL (Supplementary Table S2). The same trend was observed under the three rainfed environments (Figure 4, Supplementary Table S3). The GM variation in TAB population was higher under W2 and Al Obeid compared to WA (Figure 4a,b); however, it was the opposite under North Gedaref. GM and GY’s frequency distribution showed a wide variation and G × E interaction among the ILs across the five environments. On the other hand, the distribution showed transgressive segregation in both populations, different responses of the two backgrounds to the different water levels, and the tolerance progress in both traits compared to the recurrent parents TAB and WA (Figure 5).

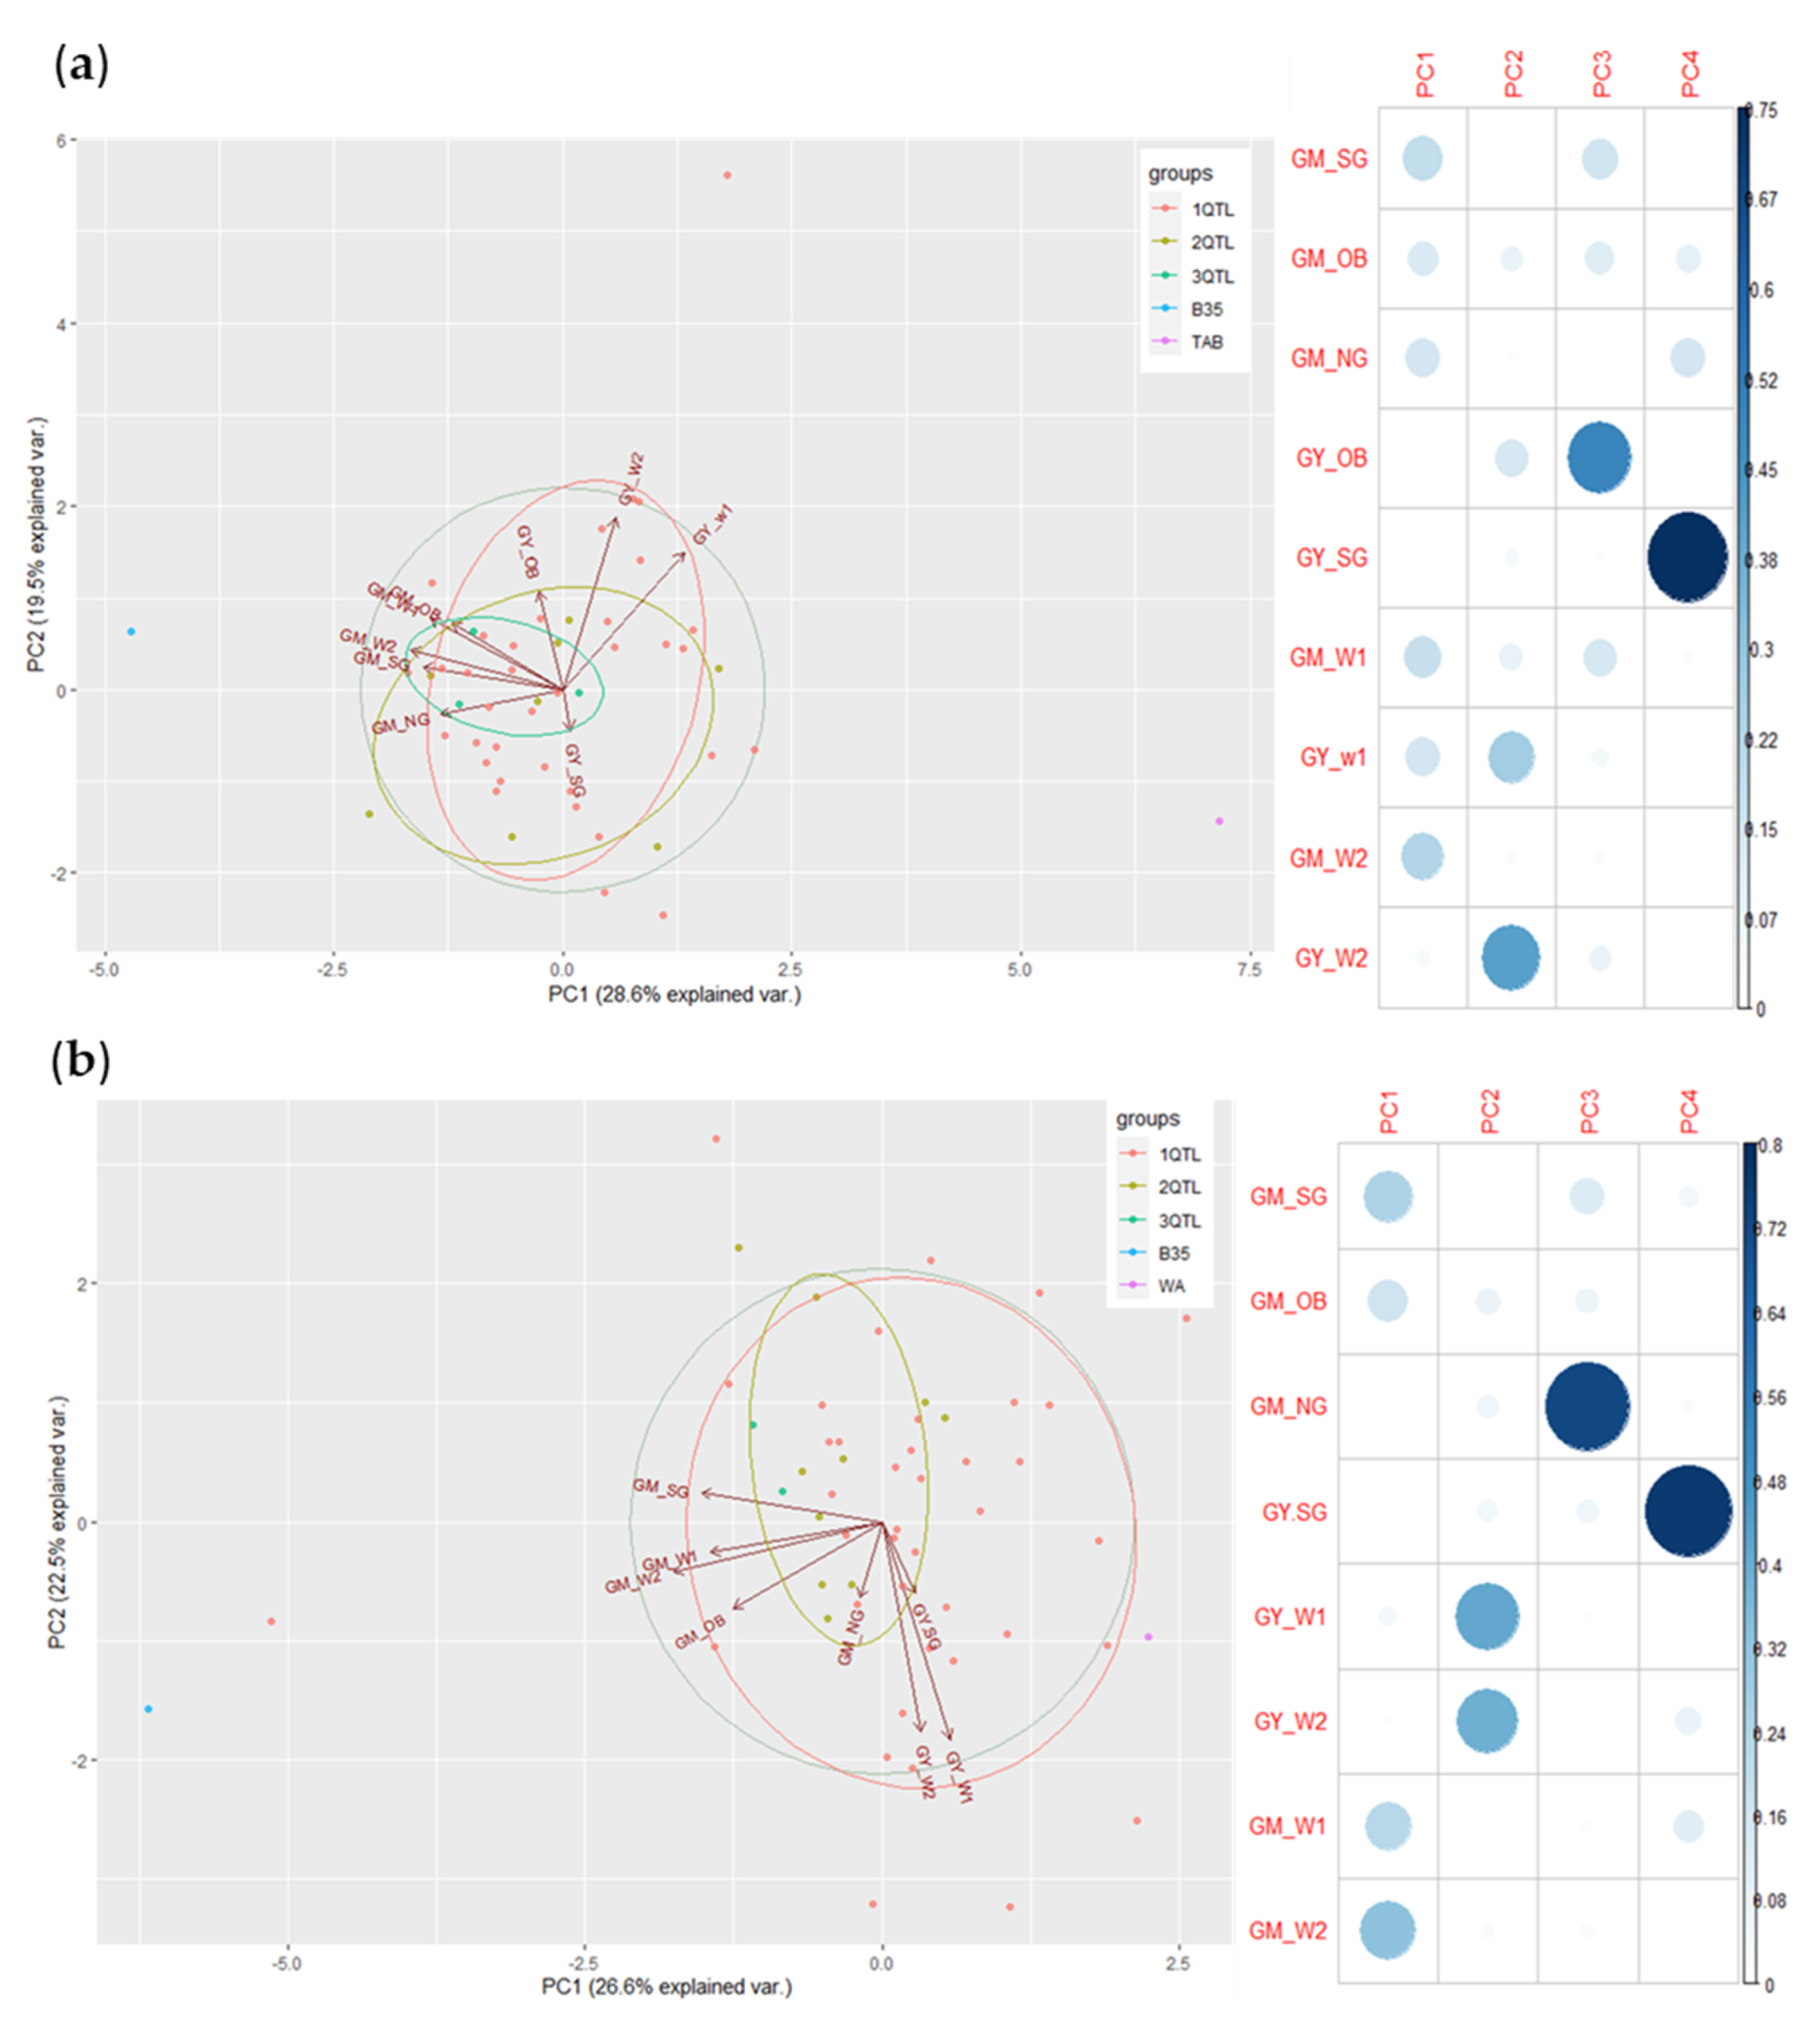
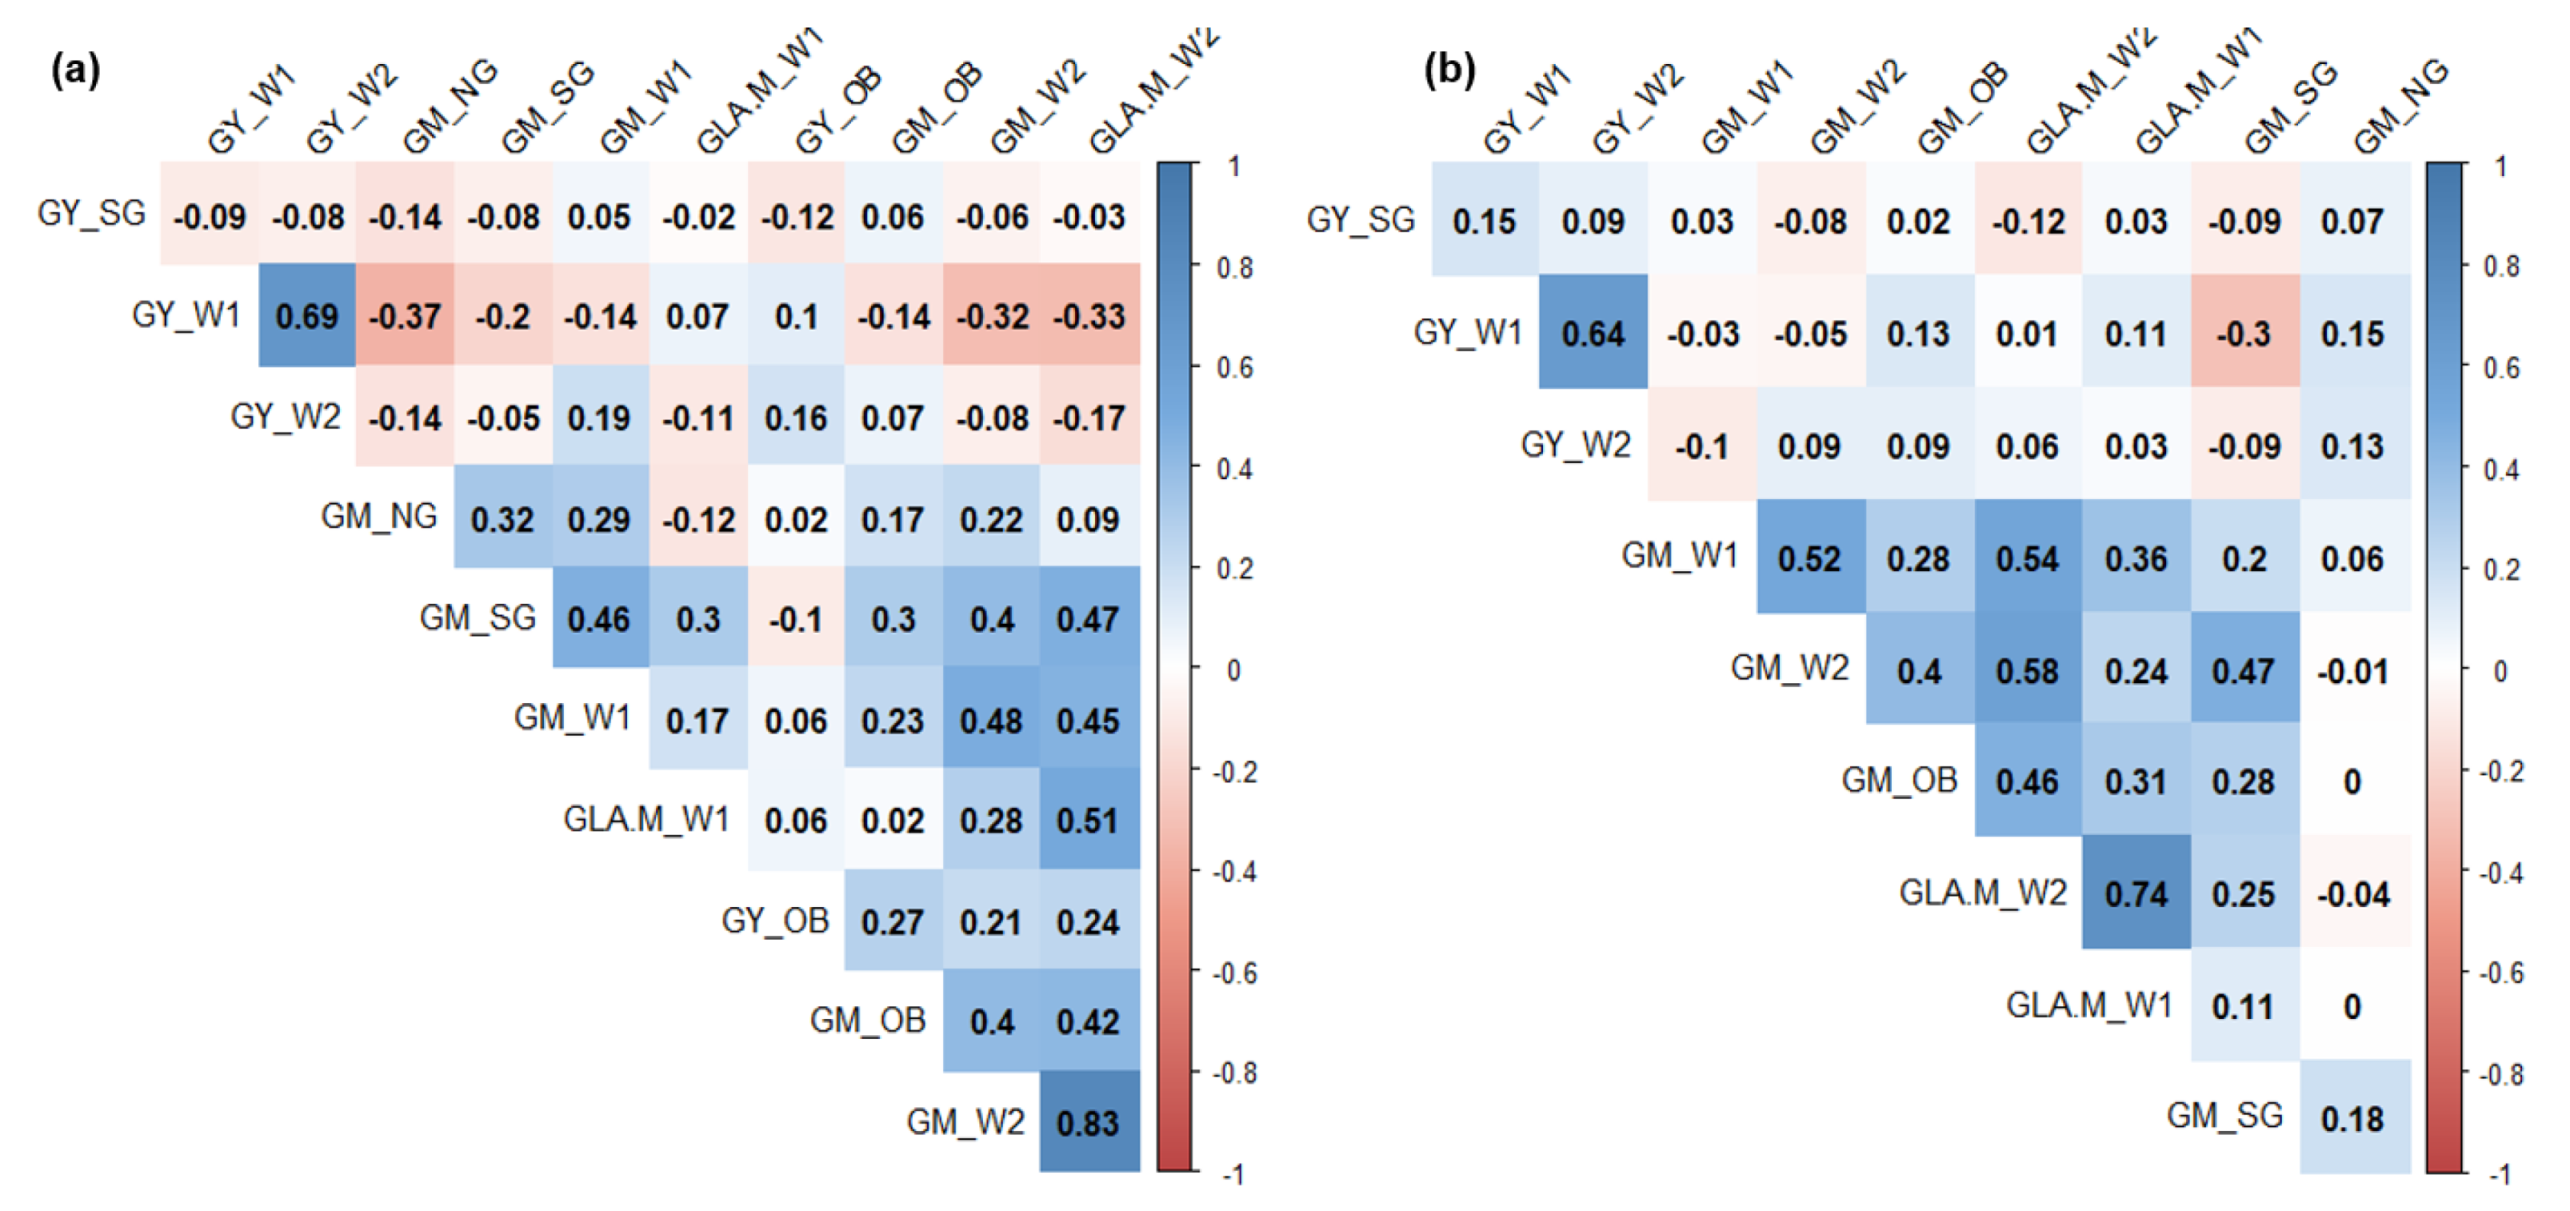
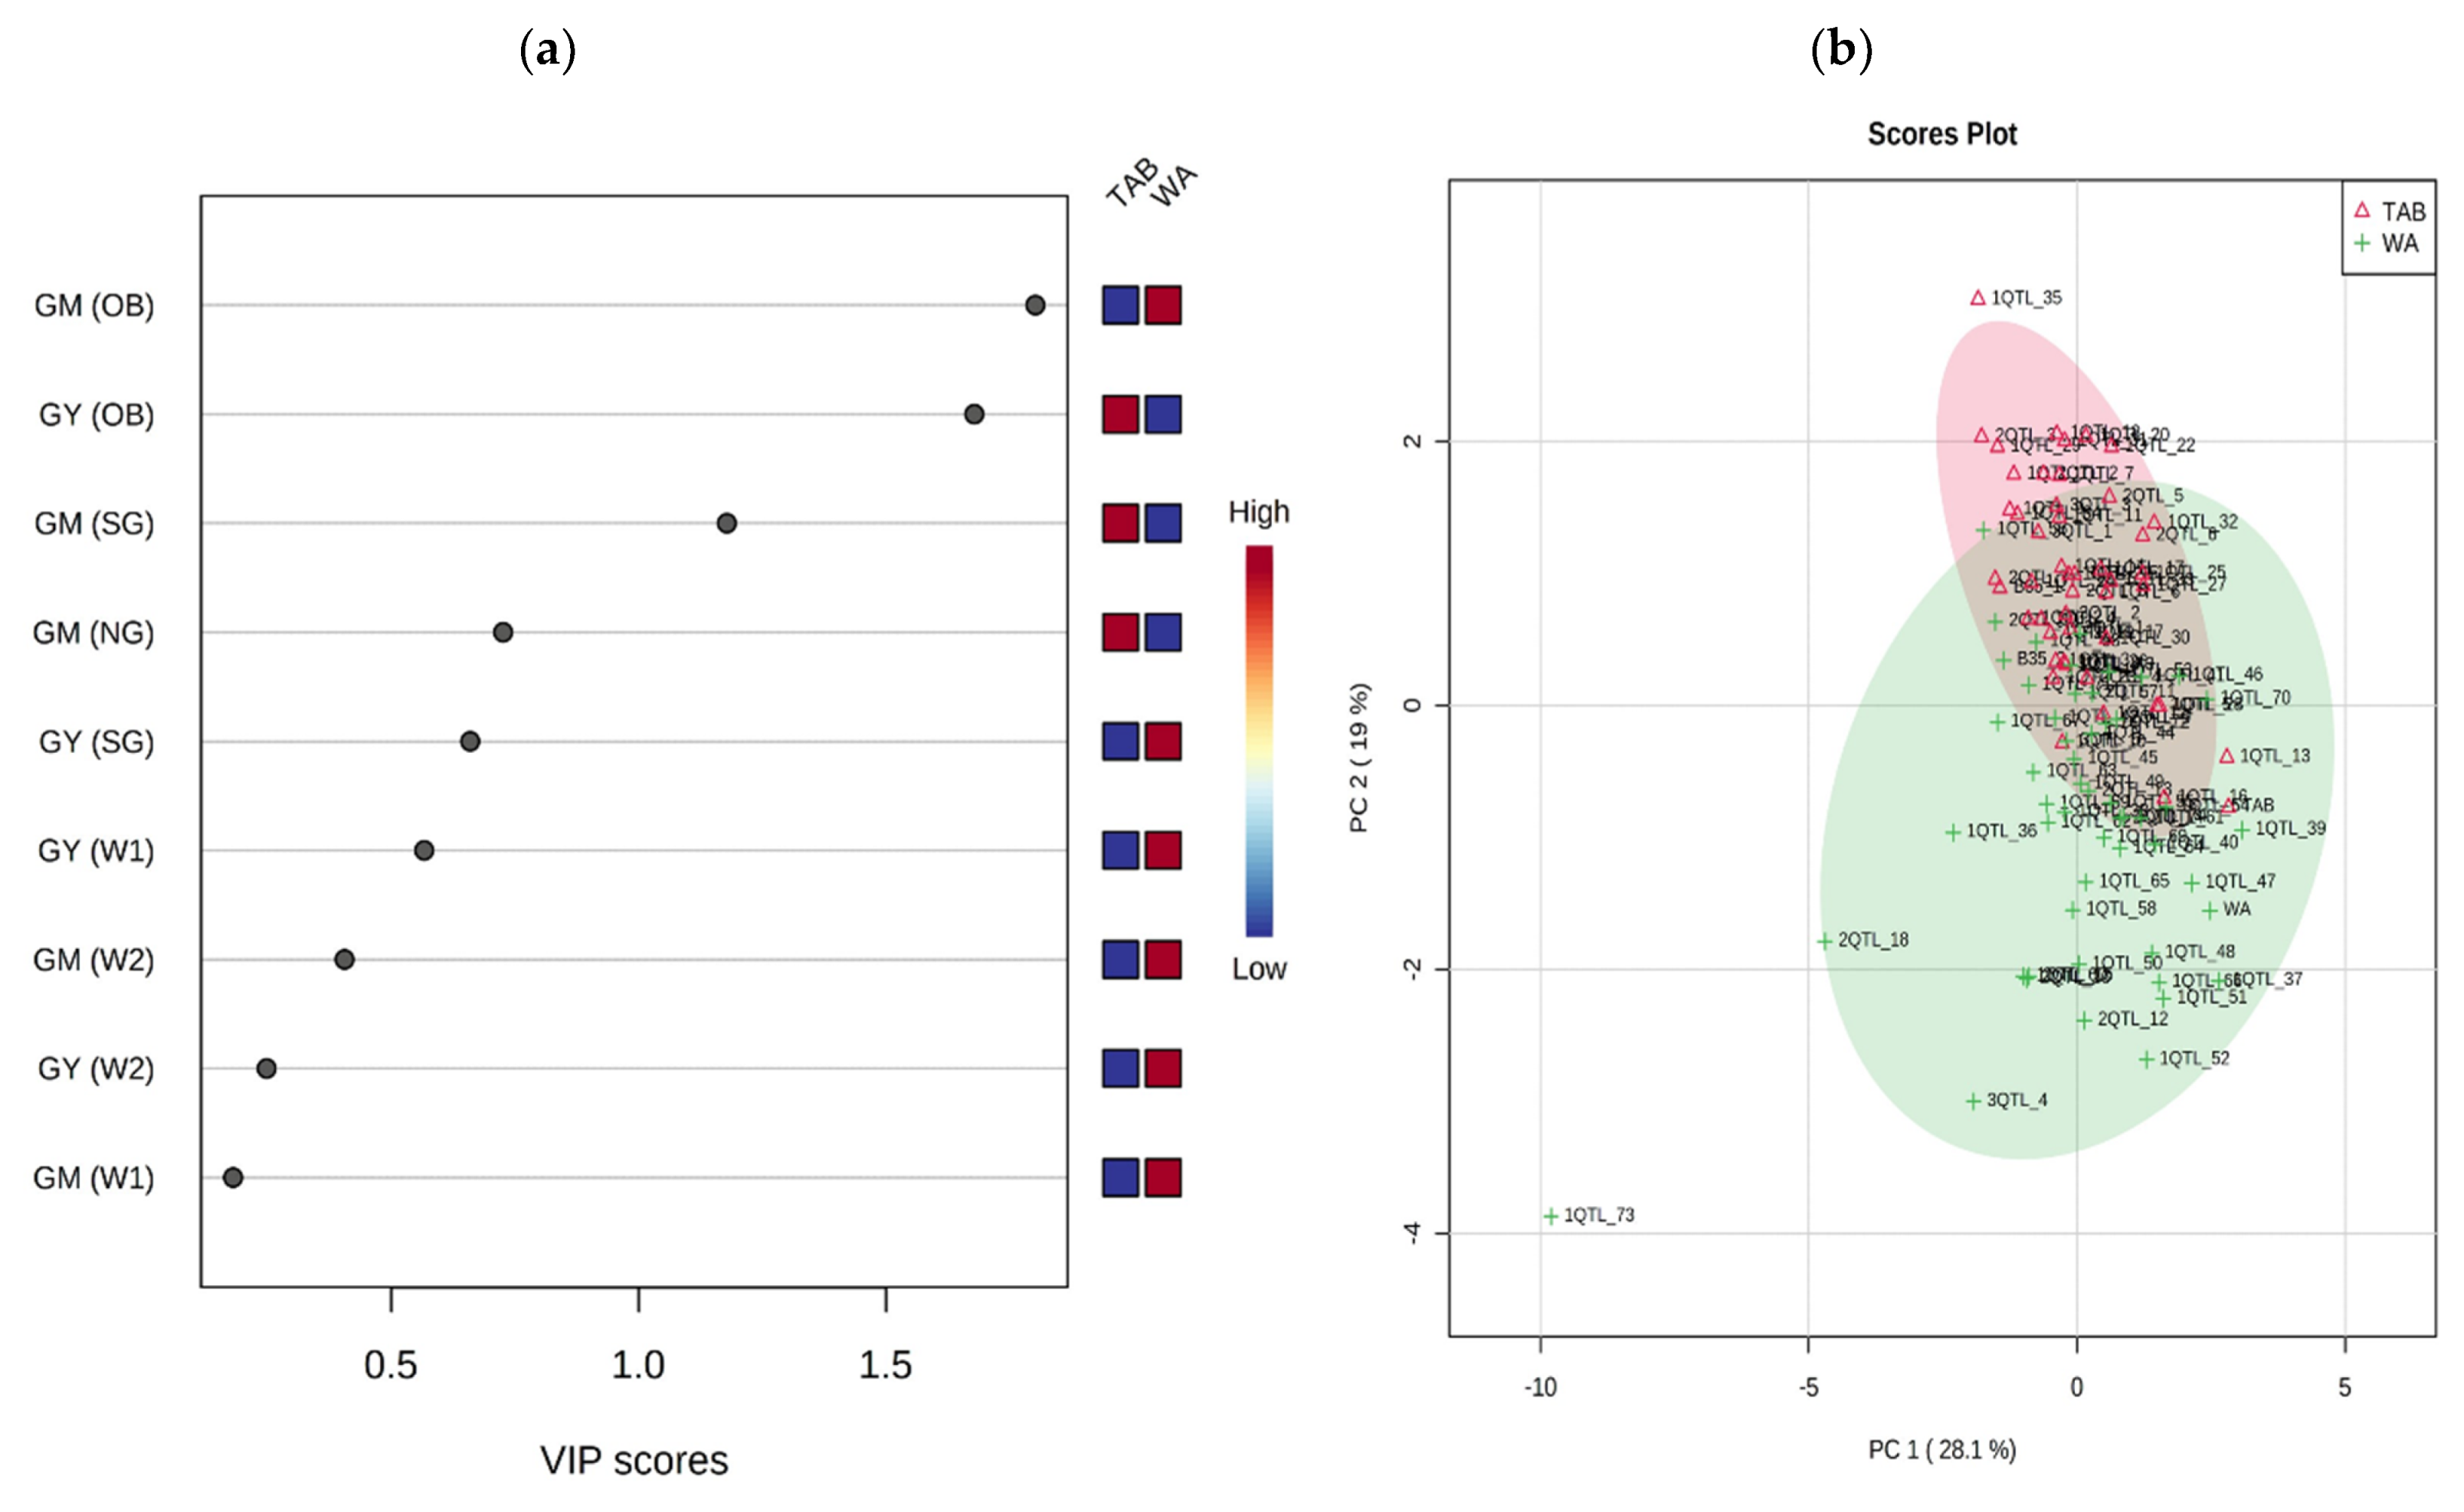
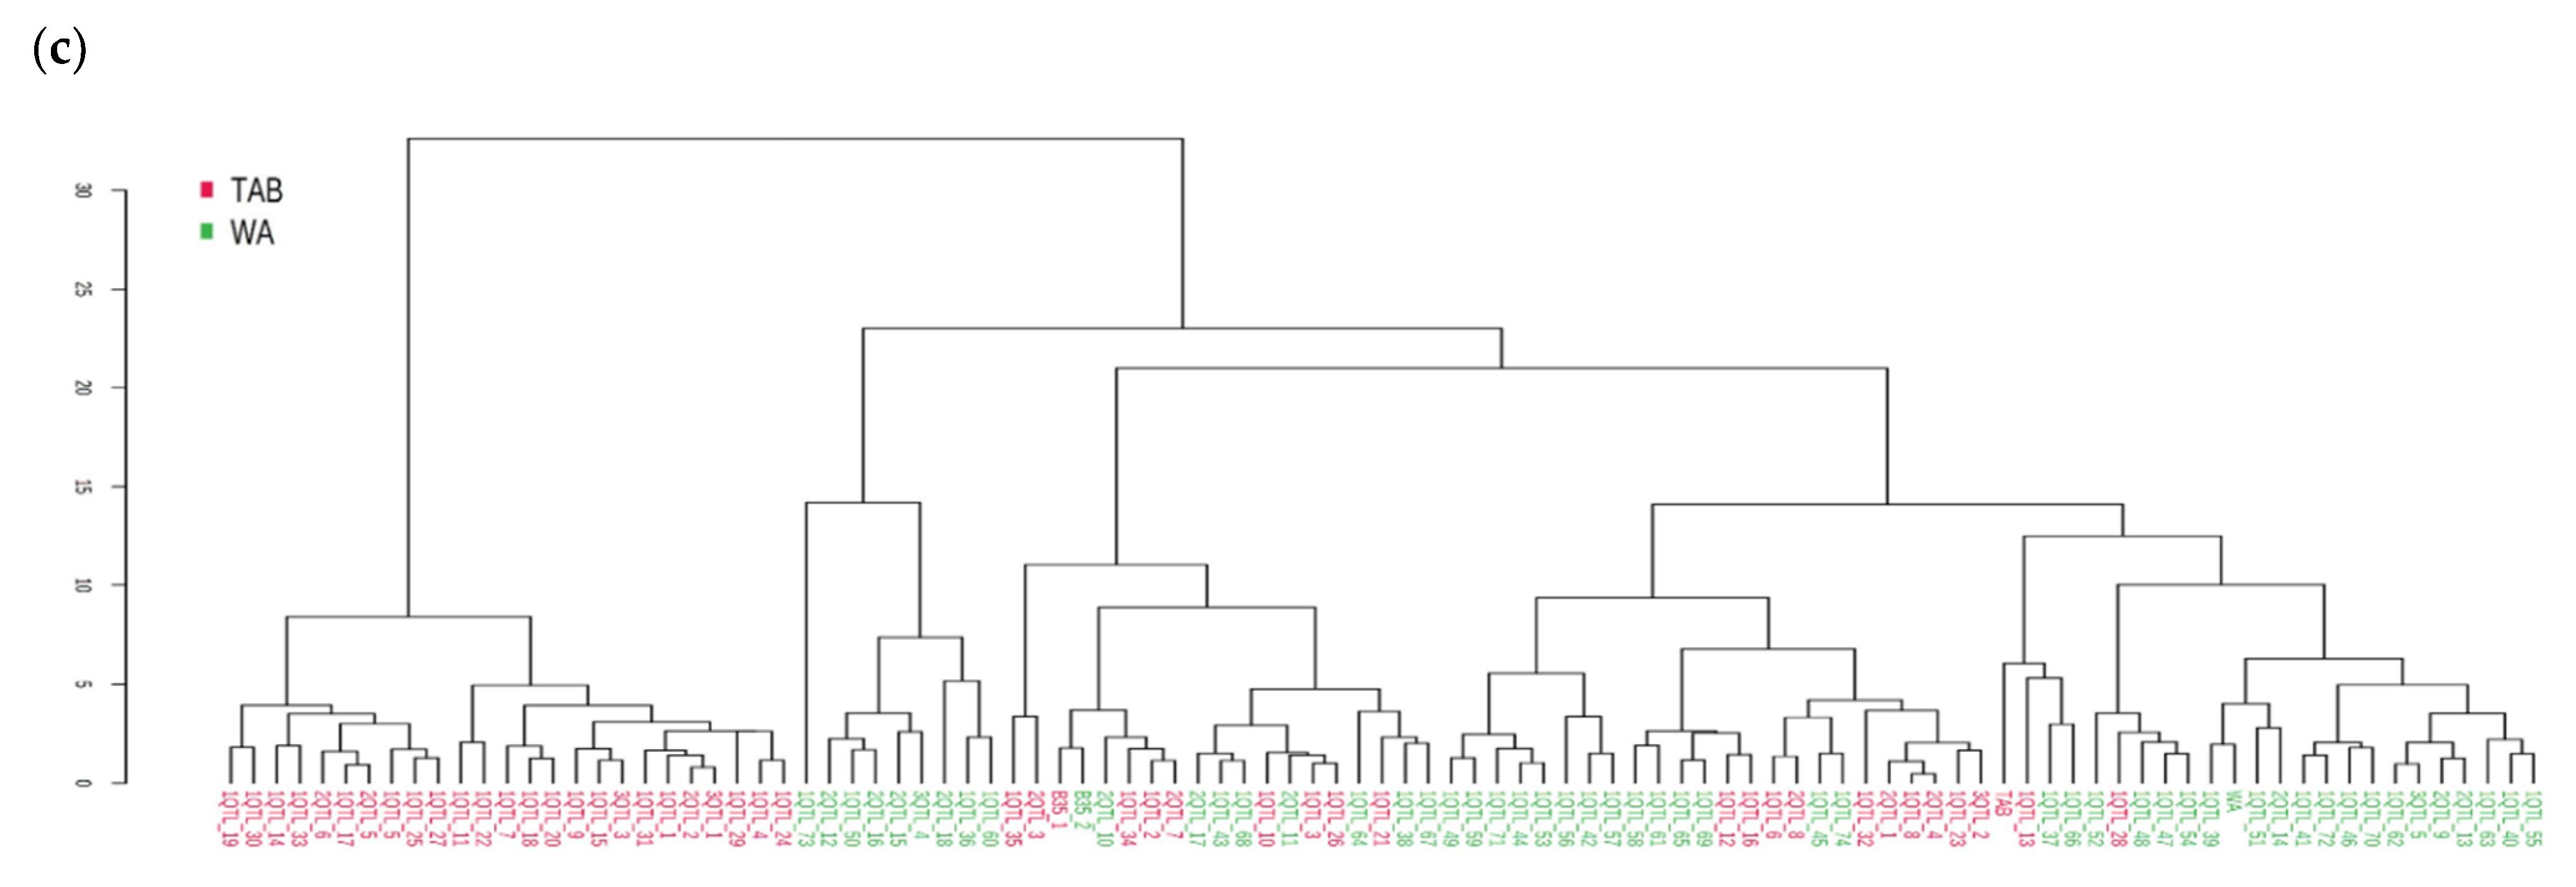
3.5. Principal Component Analysis and Pearson’s Correlation

The PCA results accounted for 49.1 and 48.1% of total variation for TAB and WA populations, respectively (Figure 6a,b). The GM was the main contributor on PC1, whereas GY contributed on PC2 and PC3 in both populations. The contribution of the GY under W1 and W2 was different in both backgrounds. In TAB population, comparing W2 and Al Obeid, the contribution of GY was on different PCs (Figure 6b).
The GY of W2 and Al Obeid were correlated in TAB population, whereas in WA, it was correlated for W1, W2, and South Gedaref (Figure 6a,b). The Pearson’s correlation analysis revealed that the GM was correlated with GY only under Al Obeid (severe drought stress), and the GM was highly correlated with green leaf area at maturity under all environments and for the two populations (Figure 7a,b).
The VIP scores of the PCA for the two populations showed that TAB (sensitive background) ILs performed better under severe stress (Al Obeid) compared to WA (moderately tolerant) ILs (Figure 8a). The combined dendrogram and PCA biplot clearly explained the unnecessity of QTL pyramiding in some combinations, since the ILs with one, two or three QTL from the two populations clustered together in the two populations (Figure 8b,c).

4. Discussion

Breeding for drought tolerance in sorghum is the most feasible method to cope with drought, but conventional breeding alone is time consuming, unreliable, and affected by many confounding environmental factors [37]. Although the use of MAB is increasing recently, it cannot yet be considered as a common breeding practice, especially in the public sector. In addition to cost, in the general MAB introgression program that usually does not include phenotypic selection, undesired donor traits may appear, and minor alleles may lose. Owing to these limitations in MAB and conventional breeding, researchers have attempted to find ways to increase the genetic gain in their breeding programs by relying on both phenotyping and genotyping [4,5,10,35,38,39].
We were able to successfully introduce the stay-green QTL (Stg1–Stg4) in sorghum cultivars TAB and WA through C-MAB. The cost was affordable and the desired lines were produced with two backcross cycles. C-MAB produces new ILs with the desired genes or QTLs incorporated into the genome of the recurrent parents. We aimed at producing drought-tolerant stay-green lines with good agronomic characteristics as TAB and WA and needed only two backcross cycles instead of four or five cycles that would be necessary to fully restore the backgrounds of TAB and WA in a conventional breeding method. The C-MAB included several phenotyping cycles for large populations and gave us a chance to select the best segregants that combined drought tolerance of B35 with the good agronomic performance of TAB and WA. However, maintaining the quality traits such as traits utilized to create additional end-use products (baking flours, pop sorghum, alcoholic beverages) remains to be confirmed in the future. Another useful aspect of C-MAB is that it allows selection for lines with minor alleles expression that maximize the phenotypic expression, which is usually lost in MAB because of the focus on only the target major QTL.
To select the F1 individuals, we used the grain color (a special character of B35) as reported by [25] and it was confirmed with the Xtxp12 marker (Supplementary Figure S1). It has been reported in sorghum that the dark creamy grain color gene is present in the dominant form [40]. The selection based on the grain color perfectly matched the marker results in the two backgrounds, indicating that the grain color was effective in selecting F1 individuals. This result revealed that the grain color could be used as a phenotypic marker to identify F1 individuals in crosses with the stay-green donor B35.

4.1. Effective C-MAB Strategy

We genotyped about 18 to 58% fewer ILs in the two backcrossing cycles of the progeny of the selected plants in the two populations to detect the four target QTL. This classification will help in understanding the phenotypic response of each QTL under different water stress/non-stress conditions. The results revealed that C-MAB was efficient at introducing the stay-green QTL at a reasonable cost, that could be lower than that of ordinary MAB in which extensive genotyping is required at each backcross cycle to select for both the foreground (donor) and background (recurrent) alleles. Compared with conventional breeding, our approach was less time-consuming, and we could introgress different stay-green QTLs and identify tolerant lines with yield performance better than recurrent parents under drought at BC2F4. The number of markers used in our study (4 per QTL) is enough, based on published recommendations [8,11]. Each chromosome should be checked with a minimum of two to three makers to minimize the risk of losing the target alleles/QTL and control the confidence intervals.
Usually, in MAB programs, the population size varies based on the crop, traits, and marker distance. BC1F1 and BC2F1 progeny were developed from the two populations to detect the presence of the major stay-green QTL. In breeding, the genetic potential of parental genomes during reproduction is determined during the random genome reshuffling. This means that the observation of the desired lines will be rare. Therefore, we used these large numbers of individuals to select visually the rare good segregants that potentially combine good agronomic performance and stay-green QTL. Transferring five QTL regions using an optimal selectable population size of 50 lines can only be obtained by screening a large population, as was the case in maize study [39], which used 2200 lines for each of the three selection cycles. In practical MAB applications, many research reports have shown contrasting results [8,41]. Ganal et al. [2] showed little advantage of MAB over the phenotypic selection, even though genetic gains obtained through MAB were reported. In contrast, [2,42] reported the successful applications of MAB in large-scale maize breeding programs.
The BC1F1, BC2F1, and BC2F2 progeny derived from the introgression of stay-green QTL into TAB and WA included 18%, 40%, and 44% of progeny, respectively, with one to three QTLs in both populations. We attribute these low numbers of QTL carriers to phenotypic selection based on good agronomic performance and stay-green score. Phenotypic selection could also explain the higher frequency of single and double QTL carriers than those with three QTL. In phenotypic selection based on agronomic performance, plants resembling the recurrent parents, i.e., plants with a lower proportion of the genome from the donor parent, were selected. The incorporation of many QTLs increases the proportion of undesirable genes from the donor parent [43]. Thus, we conclude that selection for good agronomic performance is the main cause of the low number of QTL carriers and of the increased frequency of single and double QTL carriers. On the other hand, the application of agronomic scoring at BC1 and BC2 made it difficult to have all the QTL combinations. The missing QTL combinations could be associated with high linkage drag, and larger populations would be needed to identify segregants with good agronomic performance and carrying the target QTL combinations.

4.2. Field Performance of Stay-Green Introgression Lines

The field evaluation showed that ILs having one, two or three QTL were mostly comparable to stay-green donor B35 in GM (Figure 4, Supplementary Tables S2 and S3), which indicated that the transfer of selected stay-green QTL is sufficient [15]. The GY of ILs was not intermediate between the donor parent and the recurrent parents for both TAB and WA except under W1 in the TAB population (Figure 4). In the WA population, GY of ILs with three QTLs was as the drought tolerant donor B35 under W1 and W2 (Figure 5b). This result suggests that, although the genetic background had a different level of sensitivity to drought stress, stay-green QTL can prove their tolerance level similarly or more depending on the trait and background itself. The consistency of Stg1 to Stg4 under different genetic backgrounds was previously reported in sorghum [44]. The transgressive segregation showed in our results (Figure 5) has been reported previously in a sorghum stay-green population [45]. Phenotypes are consequences of very large permutations by which the genomes of two genetically divergent parents could lead to many possible types of interactions, both ideal and non-ideal [46]. Under imposed drought (W2), GY was more sensitive in TAB ILs with one QTL than in those with two or three QTLs (Figure 4, Supplementary Table S2). In contrast, WA ILs with one QTL had better tolerance than those with two QTLs, suggesting that QTL pyramiding is not always necessary to ensure tolerance [47].
The severity of the drought in Al Obeid led to different wide ranges of GM between the WA and TAB backgrounds, probably because of a difference in QTL × background interactions [44]. On the other hand, we found previously that QTL expression is different depending on drought severity [47,48].
The PCA results revealed that GY is explained by different axes for the two populations and under each environment, suggesting the high G × E effect due to the different drought severity and timing (Figure 6). The strong relationship between GM and GLA.M made it very easy to select each of these methods to visually score the stay-green trait at maturity without a need for tedious work. The relationship between visual scoring and chlorophyll content was reported earlier by Xu et al. [49].
It is important to underline that in addition to the yield advantage obtained under the drought environments, no yield penalty was observed under well-watered conditions in the tested C-MAB lines in comparison with their parents. It is reported that different genetic mechanisms control the plant phenotype depending on the stress intensity and that under moderate stress conditions, GY depends on the plant yield potential and adaptation to drought is less of an issue [50]. In C-MAB, the use of stay-green and grain yield selection indices permits one to get close to or identify an ideal genotype [7,51].

4.3. The Cost of C-MAB

We estimated the costs of C-MAB. Field costs totaled about USD $700 per feddan (4200 m2) in Sudan. Our estimates indicate that costs of genotyping were higher than those of phenotypic selection. Our results differ from those of a study that examined the cost efficiency of selection for resistance to maize streak virus MSV [52]. Costs are likely to vary in different programs (primarily because of the differences in labor costs) but genotyping for disease traits was cheaper than selection under field conditions. The cost of using MAB compared with conventional phenotypic selection may vary considerably, although only a few studies have addressed this topic. Studies by [53,54] showed that the cost–benefit ratio of MAB might depend on many factors, such as trait inheritance, the phenotypic evaluation method, field trials, and labor costs. Furthermore, the labor cost based on [53] is about 50% from the total cost. In our study, we did not perform background selection because we relied on phenotypic selection, the labor cost of which was half the laboratory cost. It is also worth noting that large initial capital investments are required for the purchase of equipment, and regular expenses will be incurred for maintenance. Intellectual property rights may also affect the MAB cost [55,56]. One approach to solve this problem is to contract the marker works out to big laboratories that benefit from high-throughput equipment. Considering all these facts together and based on our results, we suggest that C-MAB could be a good option in developing countries, where field evaluation is cheap, and well-equipped laboratories and research funds are limited. Furthermore, for certain applications, C-MAB methods can substitute directly for conventional selection methods. For these applications, the relative cost-effectiveness of the two methods can be determined easily through comparing the screening cost per sample. For applications in which phenotypic screening is easy and cheap (e.g., visual scoring in current study), MAB will not offer any obvious advantages in terms of cost. However, for applications in which phenotypic screening is difficult or expensive (e.g., assessing traits that are not screened at the field site), MAS/MAB will often be preferable.

5. Conclusions

Based on genotypic and phenotypic data, we conclude that the stay-green trait was effectively transferred into TAB and WA using C-MAB. MAB is an effective and time-saving selection method that requires more financial resources than conventional breeding. C-MAB could provide a better chance than MAB to select the best segregants that harbor both the MAB-targeted major QTLs and non-targeted minor QTLs important to maximizing the phenotypic expression of the target trait. The high correlation between GY and GM could be used to predict or select high-yielding ILs from GM values. C-MAB is a cost-saving method compared with MAB in developing and other countries where field evaluation is cheap. There is no need for background selection since the visual evaluation is more reliable. The use of C-MAB in further improving grain yield under drought stresses in sorghum appears very promising.

Supplementary Materials

The following are available online at https://0-www-mdpi-com.brum.beds.ac.uk/article/10.3390/agriculture11070598/s1, Figure S1: Confirmation of the F1 plants from a cross between ‘Tabat’ and B35 using (a) grain color in donor parent (B35) and (b) PCR fragments for the Xtxp12 SSR marker. Figure S2: Representative profiles for multiplex PCR products showing a duplex of Xtxp23 and Xtxp15 (Markers 1 and 2) and a triplex of Xcup63, Xcup61, and KAF1 (Markers 1, 2, and 3). Figure S3: (a) Average rainfall (mm) and (b) average rainfall difference (mm) from June to the end of October in Khartoum. Figure S4: The five environments used to test introgression lines (ILs). Table S1: SSR markers selected from the consensus map of sorghum [17] used for MAB of the stay-green trait in this study. Table S2: Means and % reduction (R%) in the (a) 46 and (b) 52 BC2F4 stay-green introgression lines of ‘Tabat’ × B35 and ‘Wad Ahmed’ × B35 populations carrying one, two, and three QTL and their parents evaluated under irrigated (W1) and post-flowering drought (W2) at Faki Hashim, ARC, Khartoum North research farm. Table S3: ReML analysis for the scored parameters in introgression lines derived from ‘Tabat’ X B35 and ‘Wad Ahmed’ X B35 carrying one, two or three QTL combinations evaluated under rain fed condition at South Gadaref (SG), North Gadaref (NG) and Al Obeid (OB).

Author Contributions

N.M.K. proposed the research, performed the experiments, analyzed the data, and drafted the manuscript. Y.S.A.G. edited the manuscript. H.A. facilitated the work and collected the data with N.M.K. in the SG and NG field experiments. I.A. and Y.S.A.G. performed the economic analysis. H.T. revised the manuscript. A.M.A.G. was the project investigator and research supervisor. All authors have read and agreed to the published version of the manuscript.

Funding

This work was partially supported by Agricultural Research Corporation, Sudan, and Marginal Region Agriculture Projects of Tottori University.

Institutional Review Board Statement

Not applicable.

Informed Consent Statement

Not applicable.

Data Availability Statement

All data generated or analyzed during this study are included in this published article and its supplementary materials.

Acknowledgments

The authors are grateful to Offiong Edet (ALRC-Tottori University) for proofreading the manuscript, and to Abulgasim Ibrahim (ALRC-Tottori University) for providing the rainfall data figure. The authors greatly acknowledge Elnayer Hamid, Gedaref research station; Elgailani A. Abdalla, Al Obeid Research Station, for his support during the experiments at Al Obeid site.

Conflicts of Interest

The authors declare no competing interests.

Abbreviations

MASMarker-assisted selection
MABMarker -assisted backcrossing
C-MABCombined marker-assisted backcrossing
QTLQuantitative trait loci
NGNorth Gedaref
SGSouth Gedaref
OBAl Obeid
W1Irrigated control experiment
W2Post-flowering drought
GYGrain yield
GMPercentage greenness at maturity
GGFPercentage greenness at grain filling
Chlo.MChlorophyll content score at maturity
SDStem diameter
PHPlant height
GYGrain yield
PBPlant biomass
HIHarvest index
STIStress tolerance index
GLA.MGreen leaf area at maturity
R%Reduction percentage

References

  1. Voss-Fels, K.P.; Stahl, A.; Hickey, L.T. Q&A: Modern crop breeding for future food security. BMC Biol. 2019, 17, 1–7. [Google Scholar] [CrossRef] [Green Version]
  2. Ganal, M.W.; Röder, M.S. Microsatellite and SNP Markers in Wheat Breeding. In Genomics-Assisted Crop Improvement; Varshney, R.K., Tuberosa, R., Eds.; Springer: Dordrecht, The Netherlands, 2007; pp. 1–24. [Google Scholar] [CrossRef]
  3. Shu, Y.; Yu, D.; Wang, D.; Bai, X.; Zhu, Y.; Guo, C. Genomic selection of seed weight based on low-density SCAR markers in soybean. Genet. Mol. Res. 2013, 12, 2178–2188. [Google Scholar] [CrossRef]
  4. Lande, R.; Thompson, R. Efficiency of marker-assisted selection in the improvement of quantitative traits. Genetics 1990, 124, 743–756. [Google Scholar] [CrossRef]
  5. Bohn, M.; Groh, S.; Khairallah, M.M.; Hoisington, D.A.; Utz, H.F.; Melchinger, A.E. Re-evaluation of the prospects of marker-assisted selection for improving insect resistance against Diatraea spp. in tropical maize by cross validation and independent validation. Theor. Appl. Genet. 2001, 103, 1059–1067. [Google Scholar] [CrossRef]
  6. Zhou, W.C.; Kolb, F.L.; Bai, G.H.; Domier, L.L.; Boze, L.K.; Smith, N.J. Validation of a major QTL for scab resistance with SSR markers and use of marker-assisted selection in wheat. Plant Breed. 2003, 122, 40–46. [Google Scholar] [CrossRef]
  7. Stam, P. Marker-assisted breeding. In Biometrics in Plant Breeding: Applications of Molecular Markers, Proceedings of the Ninth Meeting of the EUCARPIA Section Biometrics in Plant Breeding, Wageningen, The Netherlands, 6–8 July 1994; Van Ooijen, J.W., Jansen, J., Eds.; CPRO-DLO: Wageningen, The Netherlands, 1995; pp. 32–44. [Google Scholar] [CrossRef]
  8. Moreau, L.; Charcosset, A.; Gallais, A. Experimental evaluation of several cycles of marker-assisted selection in maize. Euphytica 2004, 137, 111–118. [Google Scholar] [CrossRef]
  9. Belícuas, P.R.; Aguiar, A.M.; Bento, D.A.V.; Câmara, T.M.M.; Junior, C.L.D.S. Inheritance of the stay-green trait in tropical maize. Euphytica 2014, 198, 163–173. [Google Scholar] [CrossRef]
  10. Sánchez, A.; Brar, D.; Huang, N.; Li, Z.; Khush, G. Sequence Tagged Site Marker-Assisted Selection for Three Bacterial Blight Resistance Genes in Rice. Crop. Sci. 2000, 40, 792–797. [Google Scholar] [CrossRef]
  11. Sharp, P.J.; Johnston, S.; Brown, G.; McIntosh, R.A.; Pallotta, M.; Carter, M.; Bariana, H.S.; Khatkar, S.; Lagudah, E.S.; Singh, R.P.; et al. Validation of molecular markers for wheat breeding. Aust. J. Agric. Res. 2001, 52. [Google Scholar] [CrossRef]
  12. Elagib, N.A.; Khalifa, M.; Rahma, A.E.; Babker, Z.; Gamaledin, S.I. Performance of major mechanized rainfed agricultural production in Sudan: Sorghum vulnerability and resilience to climate since 1970. Agric. For. Meteorol. 2019, 276-277, 107640. [Google Scholar] [CrossRef]
  13. Borrell, A.K.; Bidinger, F.R.; Sunitha, K. Stay-green associated with yield in recombinant inbred sorghum lines varying in rate of leaf senescence. Int. Sorghum Millets Newsl. 1999, 40, 31–34. [Google Scholar]
  14. George-Jaeggli, B.; Mortlock, M.Y.; Borrell, A.K. Bigger is not always better: Reducing leaf area helps stay-green sorghum use soil water more slowly. Environ. Exp. Bot. 2017, 138, 119–129. [Google Scholar] [CrossRef] [Green Version]
  15. Kassahun, B.; Bidinger, F.R.; Hash, C.T.; Kuruvinashetti, M.S. Stay-green expression in early generation sorghum [Sorghum bicolor (L.) Moench] QTL introgression lines. Euphytica 2009, 172, 351–362. [Google Scholar] [CrossRef] [Green Version]
  16. Joshi, A.K.; Kumari, M.; Singh, V.P.; Reddy, C.M.; Kumar, S.; Rane, J.; Chand, R. Stay green trait: Variation, inheritance and its association with spot blotch resistance in spring wheat (Triticum aestivum L.). Euphytica 2006, 153, 59–71. [Google Scholar] [CrossRef]
  17. Haussmann, B.I.G.; Mahalakshmi, V.; Reddy, B.V.S.; Seetharama, N.; Hash, C.T.; Geiger, H.H. QTL mapping of stay-green in two sorghum recombinant inbred populations. Theor. Appl. Genet. 2002, 106, 133–142. [Google Scholar] [CrossRef] [PubMed] [Green Version]
  18. Harris, K.; Subudhi, P.K.; Borrell, A.; Jordan, D.; Rosenow, D.; Nguyen, H.; Klein, P.; Klein, R.; Mullet, J. Sorghum stay-green QTL individually reduce post-flowering drought-induced leaf senescence. J. Exp. Bot. 2006, 58, 327–338. [Google Scholar] [CrossRef] [Green Version]
  19. Ali, A.M.; Kamal, N.M.; Noureldin, I.Y.; Hiraoaka, Y.; Yamauchi, Y.; Sujimoto, Y. Marker-assisted breeding of stay-green trait of sorghum to enhance terminal drought tolerance: Candidate donor and recipient genotypes. Sudan J. Agric. Res. 2007, 10, 133–141. [Google Scholar]
  20. Salih, A.A.; Ali, I.A.; Lux, A.; Luxová, M.; Cohen, Y.; Sugimoto, Y.; Inanaga, S. Rooting, Water Uptake, and Xylem Structure Adaptation to Drought of Two Sorghum Cultivars. Crop. Sci. 1999, 39, 168–173. [Google Scholar] [CrossRef]
  21. Tsuji, W.; Ali, M.; Inanaga, S.; Sugimoto, Y. Growth and Gas Exchange of Three Sorghum Cultivars Under Drought Stress. Biol. Plant. 2003, 46, 583–587. [Google Scholar] [CrossRef]
  22. Kamal, N.M.; Gorafi, Y.S.A.; Ghanim, A.M.A. Performance of sorghum stay-green introgression lines under post-flowering drought. Int. J. Plant Res. 2017, 7, 65–74. [Google Scholar] [CrossRef]
  23. Rosenow, D.; Quisenberry, J.; Wendt, C.; Clark, L. Drought tolerant sorghum and cotton germplasm. Agric. Water Manag. 1983, 7, 207–222. [Google Scholar] [CrossRef]
  24. Bhattramakki, D.; Dong, J.; Chhabra, A.K.; Hart, G.E. An integrated SSR and RFLP linkage map of Sorghum bicolor (L.) Moench. Genome 2000, 43, 988–1002. [Google Scholar] [CrossRef] [PubMed]
  25. Rosenow, D.T.; Clark, L.E.; Dahlberg, J.A.; Frederiksen, R.A.; Odvody, G.N.; Peterson, G.C.; Miller, F.R.; Woodfin, C.A.; Schaefer, K.S.; Collins, D.; et al. Release of Four A/B Sorghum Parental Lines ATx642 through ATx645. 2002. Available online: https://lubbock.tamu.edu/programs/crops/sorghum/release-proposal-for-four-ab-sorghum-parental-lines/ (accessed on 10 August 2020).
  26. Duvick, D.N.; Smith, J.S.C.; Cooper, M.E. Long-Term Selection in a Commercial Hybrid Maize Breeding Program. In Plant Breeding Reviews: Long-term Selection: Crops, Animals, and Bacteria; Wiley: Hoboken, NJ, USA, 2010; Volume 24, Pt 2, pp. 109–151. [Google Scholar] [CrossRef]
  27. Câmara, T.M.M.; Bento, D.A.V.; Alves, G.F.; Santos, M.F.; Moreira, J.U.V.; Souza, C.L.J. Genetic parameters of drought tolerance related traits in tropical maize. Bragantia 2007, 66, 595–603. [Google Scholar] [CrossRef]
  28. Costa, E.F.N.; Santos, M.F.; Moro, G.V.; Alves, G.F.; Souza, C.L.J. Inheritance of the delayed senescence in maize. Pesq. Agropec. Bras. 2008, 43, 207–213. [Google Scholar] [CrossRef]
  29. Ragheb, S.M.; Yassin, A.S.; Amin, M.A. The Application of Uniplex, Duplex, and Multiplex PCR for the Absence of Specified Microorganism Testing of Pharmaceutical Excipients and Drug Products. PDA J. Pharm. Sci. Technol. 2012, 66, 307–317. [Google Scholar] [CrossRef] [PubMed]
  30. Nikiforova, M.N.; LaFramboise, W.A.; Nikiforov, Y.E. Amplification-Based Methods. Clin. Genom. 2015, 57–67. [Google Scholar] [CrossRef]
  31. Mahalakshmi, V.; Bidinger, F.R. Evaluation of stay-green sorghum germplasm lines at ICRISAT. Crop Sci. 2002, 42, 965–974. [Google Scholar]
  32. Xu, W.; Rosenow, D.T.; Nguyen, H.T. Stay green trait in grain sorghum: Relationship between visual rating and leaf chlorophyll concentration. Plant Breed. 2000, 119, 365–367. [Google Scholar] [CrossRef]
  33. Lema, M. Marker Assisted Selection in Comparison to Conventional Plant Breeding: Review Article. Agric. Res. Technol. Open Access J. 2018, 14. [Google Scholar] [CrossRef] [Green Version]
  34. Boughton, D.; Crawford, E.; Krause, M.; Henry, D.B. Economic Analysis of On-Farm Trials: A Review of Approaches and Implications for Research Program Design. Staff Paper No. 90-78; Department of Agricultural, Food and Resource Economics, Michigan State University: East Lansing, MI, USA, 1990. [Google Scholar]
  35. Ribaut, J.-M.; Hoisington, D. Marker-assisted selection: New tools and strategies. Trends Plant Sci. 1998, 3, 236–239. [Google Scholar] [CrossRef] [Green Version]
  36. Christopher, J.T.; Christopher, M.J.; Borrell, A.K.; Fletcher, S.; Chenu, K. Stay-green traits to improve wheat adaptation in well-watered and water-limited environments. J. Exp. Bot. 2016, 67, 5159–5172. [Google Scholar] [CrossRef] [Green Version]
  37. Cerrudo, D.; Cao, S.; Yuan, Y.; Martinez, C.; Suarez, E.A.; Babu, R.; Zhang, X.; Trachsel, S. Genomic Selection Outperforms Marker Assisted Selection for Grain Yield and Physiological Traits in a Maize Doubled Haploid Population Across Water Treatments. Front. Plant Sci. 2018, 9. [Google Scholar] [CrossRef] [Green Version]
  38. Moreau, L.; Charcosset, A.; Hospital, F.; Gallais, A. Marker-Assisted Selection Efficiency in Populations of Finite Size. Genetics 1998, 148, 1353–1365. [Google Scholar] [CrossRef] [PubMed]
  39. Ribaut, J.-M.; Ragot, M. Marker-assisted selection to improve drought adaptation in maize: The backcross approach, perspectives, limitations, and alternatives. J. Exp. Bot. 2006, 58, 351–360. [Google Scholar] [CrossRef] [Green Version]
  40. Valencia, R.C.; Rooney, W.L. Genetic Control of Sorghum Grain Color. INTSORMIL Presentations. Part of the Agronomy and Crop Sciences Commons, and the Plant Breeding and Genetics Commons. 2009. Available online: https://digitalcommons.unl.edu/intsormilpresent/10?utm (accessed on 15 August 2020).
  41. Moose, S.P.; Mumm, R.H. Molecular Plant Breeding as the Foundation for 21st Century Crop Improvement. Plant Physiol. 2008, 147, 969–977. [Google Scholar] [CrossRef] [Green Version]
  42. Johnson, R. Marker assisted selection. In Plant breeding reviews: Part 1: Long-Term Selection: Maize; Janick, J., Ed.; Wiley: Hoboken, NJ, USA, 2004; Volume 24, pp. 293–310. [Google Scholar]
  43. Reddy, N.R.R.; Ragimasalawada, M.; Sabbavarapu, M.M.; Nadoor, S.; Patil, J.V. Detection and validation of stay-green QTL in post-rainy sorghum involving widely adapted cultivar, M35-1 and a popular stay-green genotype B35. BMC Genom. 2014, 15, 1–16. [Google Scholar] [CrossRef] [PubMed] [Green Version]
  44. Subudhi, P.K.; Rosenow, D.T.; Nguyen, H.T. Quantitative trait loci for the stay green trait in sorghum (Sorghum bicolor L. Moench): Consistency across genetic backgrounds and environments. Theor. Appl. Genet. 2000, 101, 733–741. [Google Scholar] [CrossRef]
  45. Thomas, H.; Howarth, C.J. Five ways to stay green. J. Exp. Bot. 2000, 51, 329–337. [Google Scholar] [CrossRef] [Green Version]
  46. Reyes, B.G.D.L. Genomic and epigenomic bases of transgressive segregation–New breeding paradigm for novel plant phenotypes. Plant Sci. 2019, 288. [Google Scholar] [CrossRef]
  47. Kamal, N.M.; Gorafi, Y.S.A.; Tsujimoto, H.; Ghanim, A.M.A. Stay-Green QTLs Response in Adaptation to Post-Flowering Drought Depends on the Drought Severity. BioMed Res. Int. 2018, 2018, 1–15. [Google Scholar] [CrossRef]
  48. Kamal, N.M.; Gorafi, Y.S.A.; Abdelrahman, M.; Abdellatef, E.; Tsujimoto, H. Stay-Green Trait: A Prospective Approach for Yield Potential, and Drought and Heat Stress Adaptation in Globally Important Cereals. Int. J. Mol. Sci. 2019, 20, 5837. [Google Scholar] [CrossRef] [PubMed] [Green Version]
  49. Xu, W.; Subudhi, P.K.; Crasta, O.R.; Rosenow, D.T.; Mullet, J.E.; Nguyen, H.T. Molecular mapping of QTLs conferring stay-green in grain sorghum (Sorghum bicolor L. Moench). Genome 2000, 43, 461–469. [Google Scholar] [CrossRef] [PubMed]
  50. Blum, A. Drought adaptation in cereal crops a prologue. In Drought Tolerance in Cereals; Ribaut, J.-M., Ed.; The Haworth Press Inc.: Binghamtown, NY, USA, 2006; pp. 10–18. [Google Scholar]
  51. Van Berloo, R.; Stam, P. Simultaneous marker-assisted selection for multiple traits in autogamous crops. Theor. Appl. Genet. 2001, 102, 1107–1112. [Google Scholar] [CrossRef]
  52. Abalo, G.; Tongoona, P.; Derera, J.; Edema, R. A Comparative Analysis of Conventional and Marker-Assisted Selection Methods in Breeding Maize Streak Virus Resistance in Maize. Crop. Sci. 2009, 49, 509–520. [Google Scholar] [CrossRef]
  53. Dreher, K.; Khairallah, M.; Ribaut, J.-M.; Morris, M. Money matters (I): Costs of field and laboratory procedures associated with conventional and marker-assisted maize breeding at CIMMYT. Mol. Breed. 2003, 11, 221–234. [Google Scholar] [CrossRef]
  54. Morris, M.; Dreher, K.; Ribaut, J.-M.; Khairallah, M. Money matters (II): Costs of maize inbred line conversion schemes at CIMMYT using conventional and marker-assisted selection. Mol. Breed. 2003, 11, 235–247. [Google Scholar] [CrossRef]
  55. Jorasch, P. Intellectual Property Rights in the Field of Molecular Marker Analysis. In Molecular Marker Systems in Plant Breeding and Crop Improvement. Biotechnology in Agriculture and Forestry; Lorz, H., Wenzel, G., Eds.; Springer: Berlin/Heidelberg, Germany, 2004; Volume 55, pp. 433–471. [Google Scholar]
  56. Brennan, J.; Rehman, A.; Raman, H.; Milgate, A.W.; Pleming, D.; Martin, P.J. An economic assessment of the value of molecular markers in plant breeding programs. In Proceedings of the 49th Annual Conference of the Australian Agricultural and Resource Economics Society, Coffs Harbour, Australia, 9–11 February 2005; pp. 1–14. [Google Scholar] [CrossRef]
Figure 1. Combined marker-assisted backcrossing (C_MAB) steps used to transfer the stay-green trait from B35 into ‘Tabat’ (TAB) and ‘Wad Ahmed’ (WA) backgrounds.
Agriculture 11 00598 g001
Figure 2. Proportion of stay-green QTL combinations in (a) BC1F1 and (b) BC2F2 ‘Tabat’ (TAB) and ‘Wad Ahmed’ (WA) populations.
Agriculture 11 00598 g002
Figure 3. The reduction percentage in stay-green and grain yield related traits measured under irrigated and post-flowering drought in (a) 46 and (b) 52 stay-green introgression lines derived from crosses of B35 × Tabat (TAB) and B35 × Wad Ahmed (WA), respectively, at Faki Hashim Research Farm, Khartoum North, Sudan. Chlo and GLA denote chlorophyll content and green leaf area, respectively. GF and M denote grain filling and maturity, respectively.
Agriculture 11 00598 g003
Figure 4. Percentage greenness at maturity (GM) and grain yield (GY) of the (a) 46 and (b) 52 stay-green introgression lines with one, two, or three QTLs, and their parents ‘Tabat’ (TAB), ‘Wad Ahmed’ (WA), and B35 in five environments, South Gedaref (SG), North Gedaref (NG), El Obaied (OB), and Khartoum irrigated (W1) and drought (W2).
Agriculture 11 00598 g004
Figure 5. Frequency distribution of percentage greenness at maturity (GM) and grain yield (GY) of the (a) 46 and (b) 52 stay-green introgression lines and their parents ‘Tabat’, ‘Wad Ahmed’ (in blue arrows), and B35 (in orange arrows) at South Gedaref (SG), North Gedaref (NG), Al Obeid (OB), and Khartoum North irrigated (W1) and drought (W2). Arrows in different columns indicate the values in each trait.
Agriculture 11 00598 g005
Figure 6. PCA of percentage greenness at maturity (GM) and grain yield (GY) of the (a) 46 and (b) 52 stay-green introgression lines and their parents ‘Tabat’(Tab), ‘Wad Ahmed’ (WA), and B35 tested in South Gedaref (SG), North Gedaref (NG), El Obaied (OB), and Khartoum North irrigated (W1) and drought (W2).
Agriculture 11 00598 g006
Figure 7. Pearson’s correlation of percentage greenness at maturity (GM), green leaf area at maturity (GLA.M), and grain yield (GY) of the (a) 46 and (b) 52 stay-green introgression lines and their parents ‘Tabat’ and ‘Wad Ahmed,’ respectively, under irrigated (W1) and drought (W2) at Khartoum North, and rainfed at South Gedaref (SG), North Gedaref (NG) and El Obaied (OB). Absolute values > 0.30 were significant at (p = 0.05).
Agriculture 11 00598 g007
Figure 8. (a) Score plot of PLS-DA analysis of percentage greenness at maturity (GM) and grain yield (GY) of the 46 and 52 stay-green introgression lines and their parents ‘Tabat’ (TAB) and ‘Wad Ahmed’ (WA), respectively, under irrigated (W1) and drought (W2) at Khartoum North, and rainfed at South Gedaref (SG), North Gedaref (NG) and El Obaied (OB). Blue dots represent the TAB group, and red dots represent the WA group. PCA (b) and dendrogram (c) analysis of the 46 and 52 stay-green introgression lines and their parents.
Agriculture 11 00598 g008aAgriculture 11 00598 g008b
Table 1. The field and laboratory work cost associated with the combined marker-assisted backcrossing scheme.
Field Expenses/SeasonAmounts/UnitsCost per Unit (US$)Total Cost (US$)
Field fertilizer1 bag7070
Field supplies10 irrigations550
Labor2 persons/day for 4 months101200
Total 1320
Total Field cost for 3 cycles3960
Laboratory ExpensesCost per Sample (US$)No. of
Samples
Total Cost (US$)
DNA extraction0.7128502023.5
PCR analysis0.0820,8001664
Electrophoresis and gel visualization0.03820,800790.4
Labor0.0520,8001040
Total laboratory Cost5517.9
Total Field cost3960
Field and Laboratory expenses9477.9
Publisher’s Note: MDPI stays neutral with regard to jurisdictional claims in published maps and institutional affiliations.

