
Role of Camel Husbandry in Food Security of the Republic of Kazakhstan
by
 ,
,
Ayan Orazov
1,2,* ,
,
Liudmila Nadtochii
1,*,
Kazybay Bozymov
3,
Mariam Muradova
1 and
Araigul Zhumayeva
2 1
Faculty of Biotechnologies (BioTech), ITMO University, 197101 Saint Petersburg, Russia
2
Higher School of Technologies of Food and Processing Productions, Zhangir Khan University, Uralsk 090000, Kazakhstan
3
Department of Ecology and Biotechnology, West Kazakhstan Innovative and Technological University, Uralsk 090000, Kazakhstan
*
Authors to whom correspondence should be addressed.
Agriculture 2021, 11(7), 614; https://0-doi-org.brum.beds.ac.uk/10.3390/agriculture11070614
Submission received: 27 May 2021
/
Accepted: 26 June 2021
/
Published: 30 June 2021
(This article belongs to the Special Issue Livestock Farm and Agribusiness Management)
Abstract
:This paper examines the problem of food security in the Republic of Kazakhstan over the past 10 years. Based on statistical data, an assessment was made of the prevalence of malnutrition among the population of the country, including children under 5 years of age. There has been a trend towards for an improvement in the nutrition of the population for a few indicators; however, further optimization of food security indicators is required to achieve the goals of sustainable development (SDGs) of the FAO WHO Agenda for the period up to 2050 in Kazakhstan and in its individual regions. The paper reflects data on demographic changes over the past 10 years and its self-sufficiency in basic foods for 2019. A high degree of self-sufficiency in meat products (117.6%) is revealed in the population of the Republic of Kazakhstan. However, self-sufficiency in dairy products is at an extremely low level (0.1%). Camel breeding has been successfully developing in the country over the past 10 years. However, the number of camels in the country is still at a low level. Camel milk can be considered as a great source of macronutrients, its daily consumption partially facilitates the problem of Food Security in Kazakhstan.
1. Introduction
Food security and nutrition are major issues of the global agenda, which are directly linked to the Sustainable Development Goals (SDGs). SDG 2, in particular target 2.2, aims to end all forms of malnutrition in the world by 2030. Improving nutrition directly contributes to the achievement of the goal of ensuring healthy living conditions (SDG 3) and plays an important role in poverty eradication (SDG 1), quality education (SDG 4) and gender equality (SDG 5), in promoting economic growth (SDG 8) and reducing inequalities (SDG 10). Thus, nutrition is a critical factor in achieving the global sustainable development goals and progress towards a more stable and prosperous society.
There is a search for rational sources of high-value foods in conditions of natural resource depletion, climate change, and growth of the planet’s population, including in the Republic of Kazakhstan. The needs and priorities of food security for the world’s population are outlined in the FAO WHO, 2018, which reflects the Sustainable Development Goals (SDGs) and ways to increase resilience to climate impacts. Food security of an individual country is determined by climate conditions, demographic factors, self-sufficiency in the main types of food products, etc. [1].
Extreme measures are required to fulfill the global targets for improving food security and nutrition in the world and in a single country for the period up to 2025 (2030), particularly:
- ‒
- to decrease by 40 (50)% the total number of stunted children under five years of age;
- ‒
- to reduce by 30 (30)% the incidence of low birth weight;
- ‒
- to stop the growth in the prevalence of overweight among children; reduce and stabilize the prevalence of overweight in children below 3%;
- ‒
- to increase the prevalence of exclusive breastfeeding in the first six months of a child’s life by at least 50 (70)%;
- ‒
- to decline and stabilize the number of children suffering from wasting below 5 (3)%.
Central Asia, in particular the Republic of Kazakhstan, includes a wide range of climatic zones with significant temperature changes on the territory of the republic. The climate of the Republic of Kazakhstan is characterized as excessive continental arid, and semi-arid by hot and dry summer and relatively warm and humid climate in the winter in the south and cold with severe frosts in winter in the north of the country [2].
The wide variability of the climate of the Republic of Kazakhstan affects the diversity of animal husbandry, such as cattle, horse breeding, camel breeding, sheep breeding, etc. [3].
However, it is impossible to provide all social groups of the population in a stable manner in accordance with approved consumption rates due to unfavorable climatic conditions for the development in all areas of the agricultural sector [4]. The lack or absence of basic foods negatively affects the quality of human life and health. Meat and dairy products are considered as a source of basic macronutrients [5], especially complete protein and fat, as well as micronutrients and other biologically valuable substances [6], which are essential in the nutrition of the world’s population.
This paper aims to assess the role of camel breeding in providing the population with basic food products, the prospects for the industry development in the Republic of Kazakhstan as a whole and in its individual regions, in particular in the South-West of the country. The Republic of Kazakhstan as a whole and its individual territories are characterized by common problems, threats, and priorities of food supply [7].
This paper presents an analysis of food security factors and possible solution through the development of camel breeding in the Republic of Kazakhstan considering the statistical data (fao.stat и stat.gov.kz). These issues are directly related to the goals of eliminating hunger (SDG 2 target 1) and malnutrition (SDG 2 target 2) [1]. Analysis on the chemical and amino acid composition clearly displays that camel milk obtained in the Republic of Kazakhstan is a great source of macronutrients compared to milk of other farm animals.
2. Materials and Methods
2.1. Statistical Data
The data collected are issued from official FAO statistics, available on website www.fao.org (accessed on 26 May 2021). and Agency for Strategic planning and reforms of the Republic of Kazakhstan, Bureau of National statistics, which are available on website https://stat.gov.kz/ (accessed on 26 May 2021). The mission of the Bureau is to develop and implement state policy in the field of state statistics, aimed at meeting the needs of society, the state and the international community for official statistical information. The data were available from 2006 up to 2019, i.e., over 15 years.
The following data were analyzed from 2010 until 2019 regarding Food Security in the Republic Kazakhstan: prevalence of malnutrition, nutritional status of children under 5 years of age, infant mortality rate and population in.
2.1.1. Prevalence of Food Insecurity Based on the Food Insecurity Experience Scale (FIES)
FIES data collection is carried out using national representative population surveys, generally with a 12-month retrospective assessment period in respondents’ responses. The Food Insecurity Experience Scale (FIES) is most used to evaluate moderate to severe food insecurity. Data for the Republic of Kazakhstan were provided by the National Agency. Nationally generated data are subject to further calibration on the FIES global reference scale to ensure reliable global comparability. The advantage of the method using the FIES scale is to obtain results and estimate the situation in real time, rather than based on forecasts.
2.1.2. Prevalence of Undernourishment (PoU)
PoU is a national-level model-based indicator used by FAO to control access to food at the global and regional levels. PoU is a calculation method based on a statistical model, where the parameters of habitual consumption are transferred to a model of a representative of the population. Nowadays, most countries in the world provide information on the population’s access to food through periodic national population surveys, including Kazakhstan. This approach admits FAO to improve the calculation method for estimating PoU at the country level. The PoU values informed in the 2017 FAO report are derived from separate predictions for each of the following model parameters: dietary energy consumption (DEC), coefficient of variation (CV), and minimum dietary energy requirement (MDER).
2.1.3. Prevalence of Malnutrition among Children under 5 Years of Age
Prevalence of malnutrition was assessed through its varieties, in particular, such as obesity, wasting and underweight (standard deviation from the median weight-for-age according to the WHO child growth standards, >+2 or <−2). The prevalence of stunting in children under five years of age was analyzed using the standard deviation from the median height-for-age of the child in accordance with the World Health Organization (WHO) Child Growth Standards, <−2.
Data provided by the Bureau of National Statistics of the Agency for Strategic Planning and Reforms of the Republic of Kazakhstan based on a one-time survey—Multiple-Indicator Cluster Survey (MICS).
2.1.4. Under-Five Mortality Rate
Data on child mortality rates are provided by the Bureau of National Statistics of the Agency for Strategic Planning and Reforms of the Republic of Kazakhstan based on the organizational information systems “Registration office of the Civil Registry Office” Local executive body (LEB), “Register of population” of the country, Judicial authorities “Torelik” of the Supreme Court of the Republic of Kazakhstan.
2.1.5. Dynamics of Population Changes in Kazakhstan
Statistical data of dynamics of population changes over the past 10 years, including the urban and rural population groups, were retrieved from the Department of Social and Demographic Statistics of the Republic of Kazakhstan.
2.1.6. The production of Dairy and Meat Products in the Republic of Kazakhstan
The production of dairy and meat products in the Republic of Kazakhstan from 2010 to 2019 was presented based on statistical data provided by Bureau of National statistics
2.1.7. Dynamics of Population Camels in Kazakhstan
The assessment of changes in the population of camels over the past 10 years was carried out in comparison with other types of farm animals around the world as well as in the Republic of Kazakhstan. The data collected are issued from 2 resources such as official FAO statistics and Agency for Strategic planning and reforms of the Republic of Kazakhstan, Bureau of National statistics.
2.2. Self-Sufficiency in Dairy and Meat Products
Self-sufficiency is the most expedient regarding the best satisfaction requirements of the population and the criteria of economic production efficiency and sale of products. In this respect, the most important for the balance of the consumer market is the calculation of self-sufficiency levels of the region and the country in consumer products, which will have different meanings for various groups of products.
The requirement for dairy products (, kg) was calculated according to the following formula:
where, N—population, million/person;
301—rational milk (dairy products) consumption rate per capita, kg/year.
The requirement for meat products (, kg) was calculated according to the following formula:
where, N—population, million/person;
78.4—rational meat (meat products) consumption rate per capita, kg/year.
Self-sufficiency in dairy and meat products ) was calculated using the following formula:
where, k—the amount of meat/milk produced per year, kg;
100—self-sufficiency ratio, %;
Pi—needs for dairy/meat products, kg
2.3. Assessment of the Chemical Composition of Milk
The assessment of the chemical composition of various types of milk from farm animals was carried out on the basis of standardized indicators in accordance with TR CU 033/2013 “On the safety of milk and dairy products” [8]. The mass fraction of protein per 100 g of dry matter was recalculated for an equivalent evaluation of the protein component of milk from different farm animals.
3. Results
3.1. The Problem of Food Security in the Republic of Kazakhstan
Aspects of human vulnerability in the context of food security are based on three main factors: food production, environmental management, and health, which are directly dependent on regional climate and land use [4].
3.1.1. The Prevalence of Malnutrition in the Republic of Kazakhstan
According to the 2018 FAO WHO estimates the total number of people in the world suffering from malnutrition or persistent lack of access to food increased by almost 17 million in 2017 compared to 2016. Until recently, there has been a downward trend in malnutrition in Asia; however, there has been a significant slowdown at present. Table 1 provides information on the assessment of the level of food insecurity among the population of the Republic of Kazakhstan according to the “Food Insecurity Experience Scale” (FIES). Based on the presented data, there is moderate and severe food insecurity among the country’s population at the level of 5.3%, while severe food insecurity is observed among 1.9% of the country’s population. The indicator of severe food insecurity on the FIES is slightly higher in Central Asia to 2.5% in 2017 [1], which is 1.1% higher than in the Republic of Kazakhstan. However, the severe form of food insecurity was higher in 2019 than the data for previous years in the Republic of Kazakhstan (by 0.2% and by 0.5% compared to 2018 and 2015–2017).
The lack of food security among the population of the Republic of Kazakhstan can be explained by the high level of malnutrition. Table 2 represents the data on a high prevalence of malnutrition among the population in the Republic of Kazakhstan over the past 5 years (2015–2019), which exceeds this indicator for the period 2011–2014 by an average of 2%. At the same time, the prevalence of malnutrition was 2.6% lower in 2017 in the Republic of Kazakhstan compared to this indicator in Central Asia (6.2% in 2017) [1]. It should be mentioned that the prevalence of malnutrition among the urban population is 1% higher (2019) compared to this indicator for the rural population, which indicates a higher food supply for the rural population of the country, apparently due to self-sufficiency from farms.
According to statistics, about 50 million children under five years old suffer from malnutrition worldwide (FAO, WHO, 2018). Moreover, almost every tenth case of child malnutrition accounts for Asia and Oceania as a whole. According to the source (UNICEF, WHO and International Bank for Reconstruction and Development/World Bank. 2018. UNICEF, WHO, World Bank Group Regional and Global Joint Malnutrition Estimates, May 2018 Edition [9] significant changes from 2012 to 2017 for this indicator in Asian countries (excluding Japan) have not been recognized—at the average rate of 9.7% of children under five years old suffer from wasting.
Most cases occur in Central Asia, including Kazakhstan, Kyrgyzstan, Tajikistan, Turkmenistan and Uzbekistan where every seven out of ten children are affected by malnutrition [10].
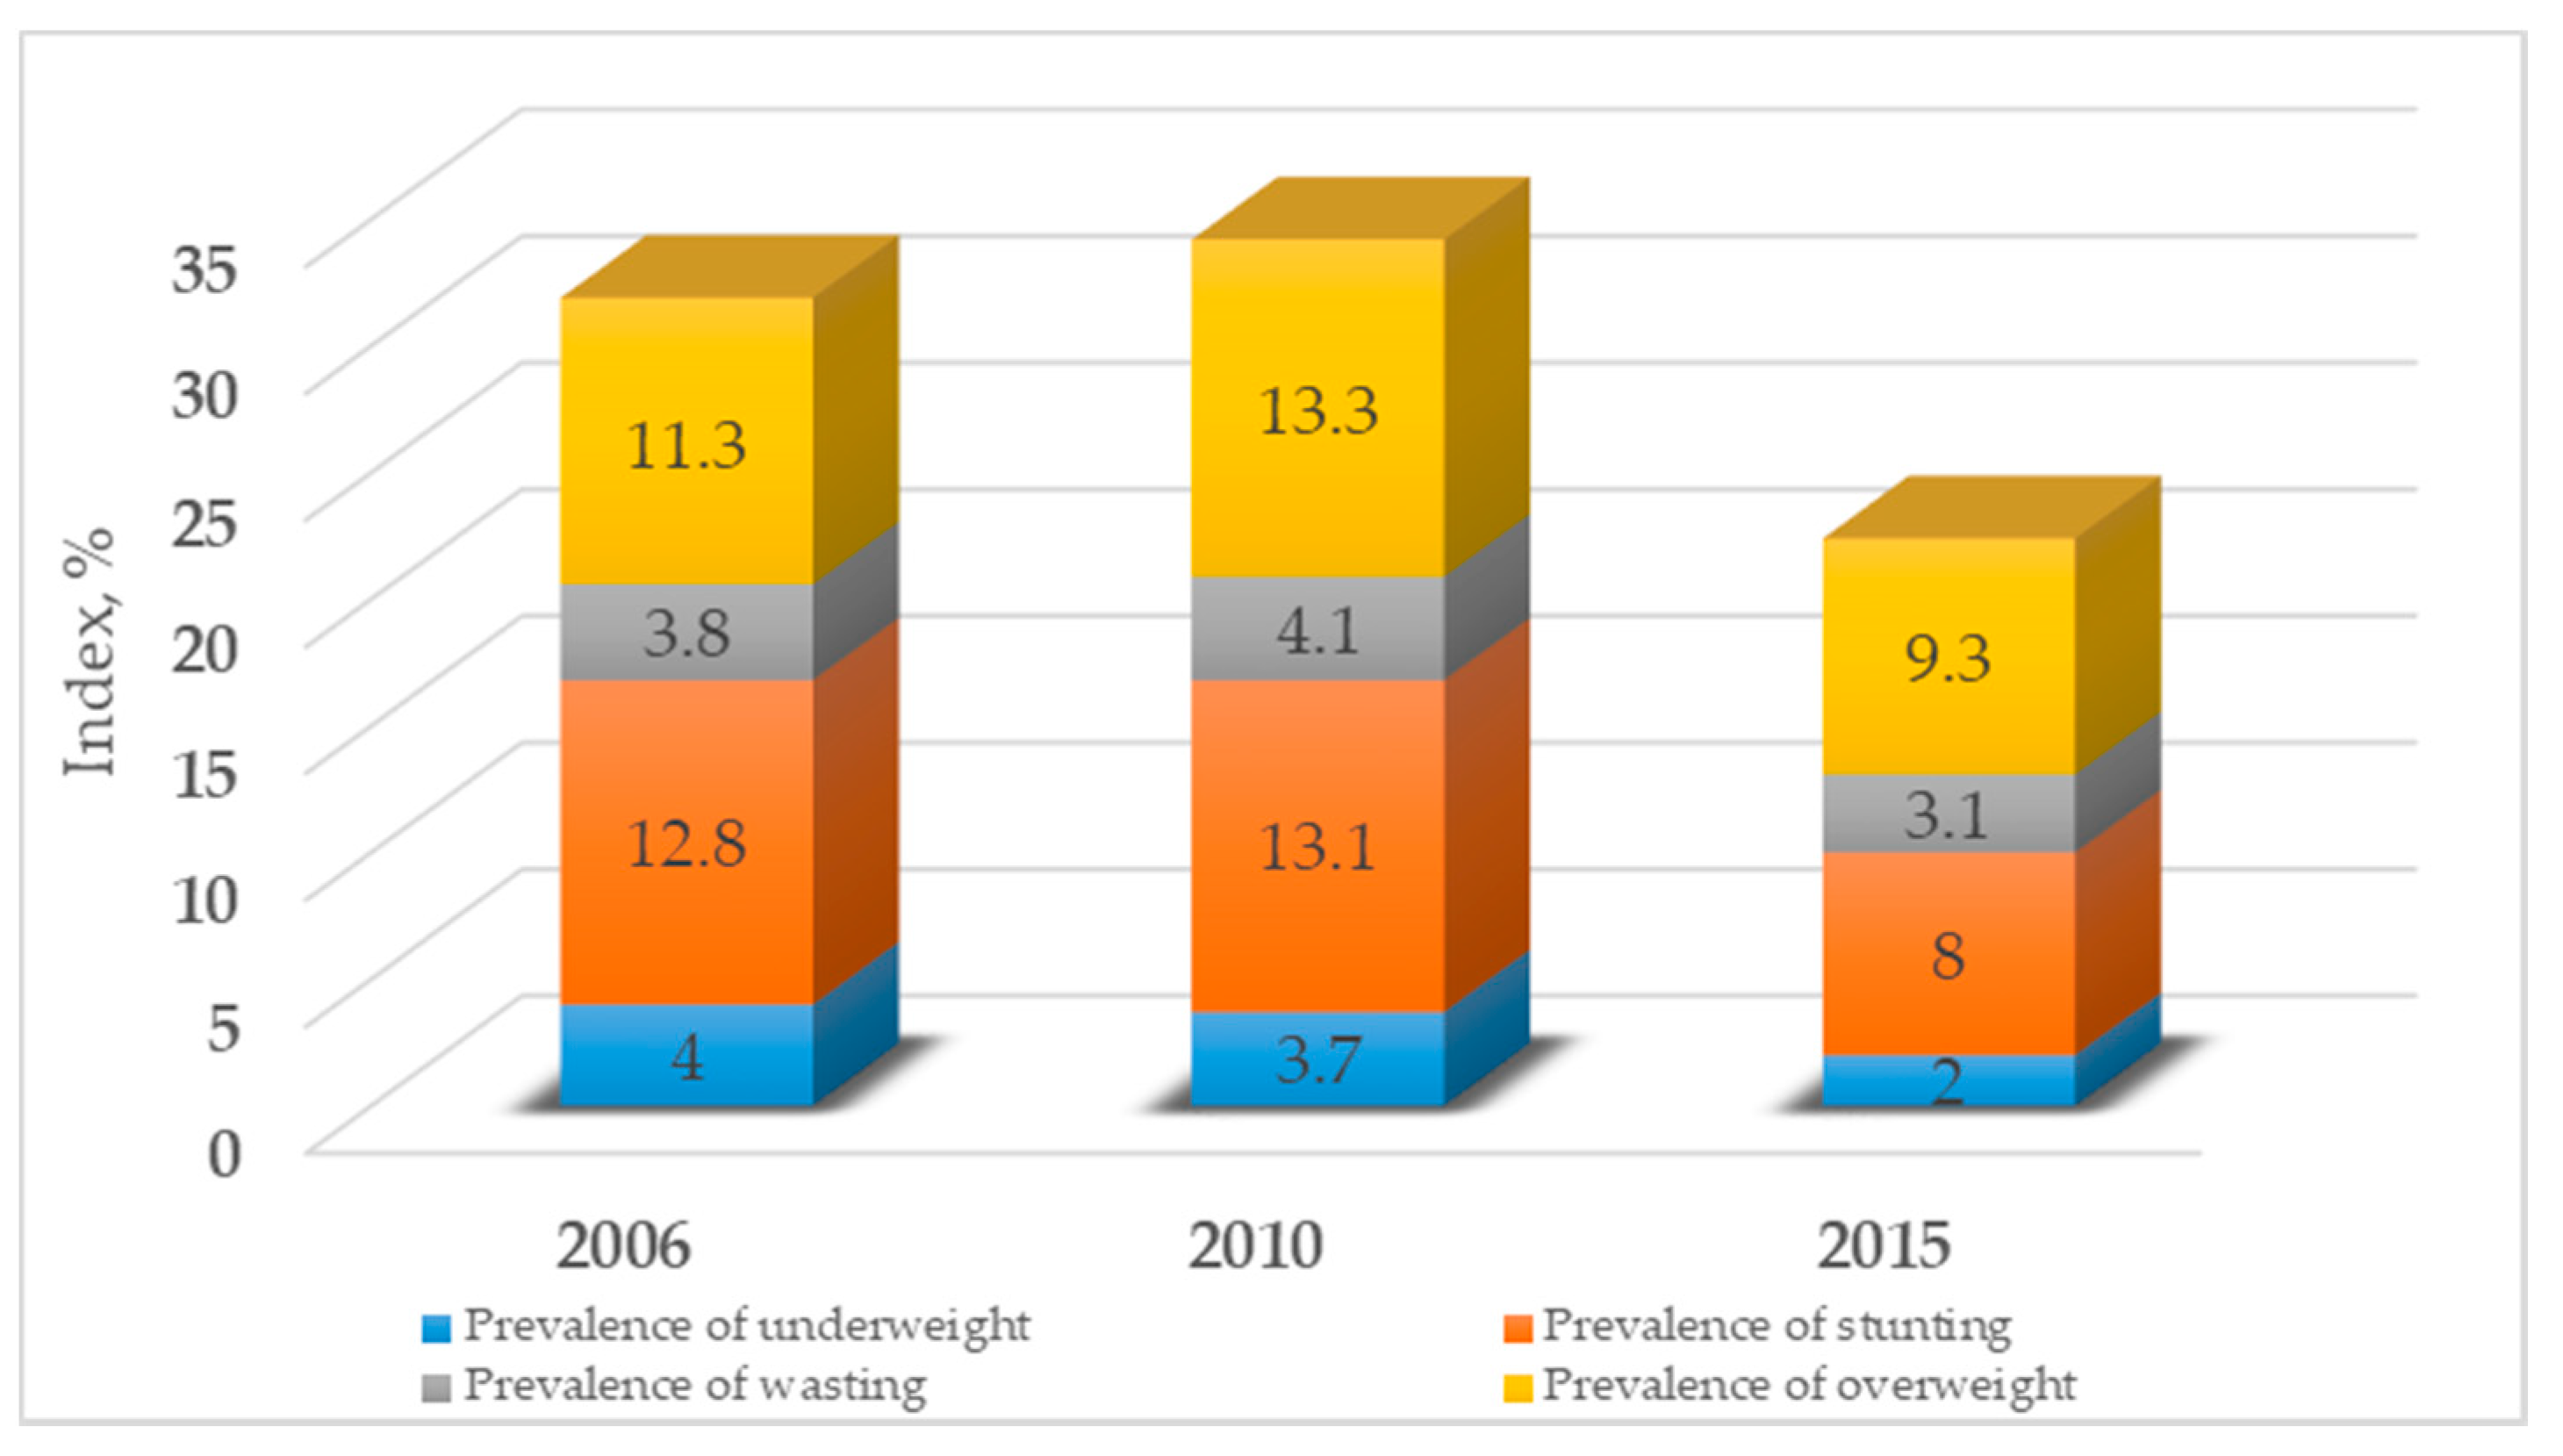
Figure 1 reveals the high degree of malnutrition among children under 5 years of age in the Republic of Kazakhstan (2006–2015). Overweight is in first place in terms of prevalence among children under 5 years of age (9.3% in 2015). It should be noted that this indicator is significantly lower compared to 2006 and 2010 by 2% and 4%, respectively. However, the share of overweight children in the Republic of Kazakhstan significantly exceeds this indicator in the world (5.4% in 2012 and 5.6% in 2017) and in Asia (4.5% in 2012 and 4.8% in 2017). A growth delay is in second place in terms of prevalence among children under 5 years of age. A deviation from the norm in stunting was noted in 8% of children in 2015, which is 4.8% and 5.1% lower compared to 2006 and 2010. The growth gap among children under 5 years old is significantly lower in the Republic of Kazakhstan than the values of this indicator in the world (24.9% in 2012 and 22.2% in 2017) and in Asia (27.1% in 2012 and 23.2% in 2017) [1].
The prevalence of wasting is in third place among children under 5 years of age, in particular 3.1% according to 2015 data, which is 0.7% and 1% lower compared to 2006 and 2010. The share of children suffering from wasting is significantly inferior in the Republic of Kazakhstan than in the world (7.5% in 2017) and in Asia (9.7% in 2017) [1]. Children under 5 years old are underweight in a minor degree: 2% in 2015, which is 2% and 1.7% lower compared to 2006 and 2010. Thus, for the period 2006–2015, there has been a positive tendency in all indicators of malnutrition among children under 5 years of age in the Republic of Kazakhstan. There was no observation of a significant difference in the prevalence of malnutrition (−0.7%) over this time, while there was a slight increase in the prevalence of severe wasting (+0.1%). However, there is a positive trend in the prevalence of underweight (−2%), stunting (−4.8%) and overweight (−2%).
However, severe malnutrition is observed among young children in the Republic of Kazakhstan. According to data for 2015 year, children from 0 to 5 months were more amenable to various forms of wasting (13.7%) in the Republic of Kazakhstan, where 4.9% with a severe form of deviation from the norm [11]. This can be since there are differences in rates of severe food insecurity among men (5.7%) and women (6.3%) in Central Asia [1]. This can negatively affect indicators of malnutrition in young children in women of childbearing age.
A child who is moderately or severely wasted has an increased risk of death. A conducted analysis in 2013 exhibited that about 12.6% of all deaths among children under the age of five were associated with wasting, where 7.4% were with severe forms [1].
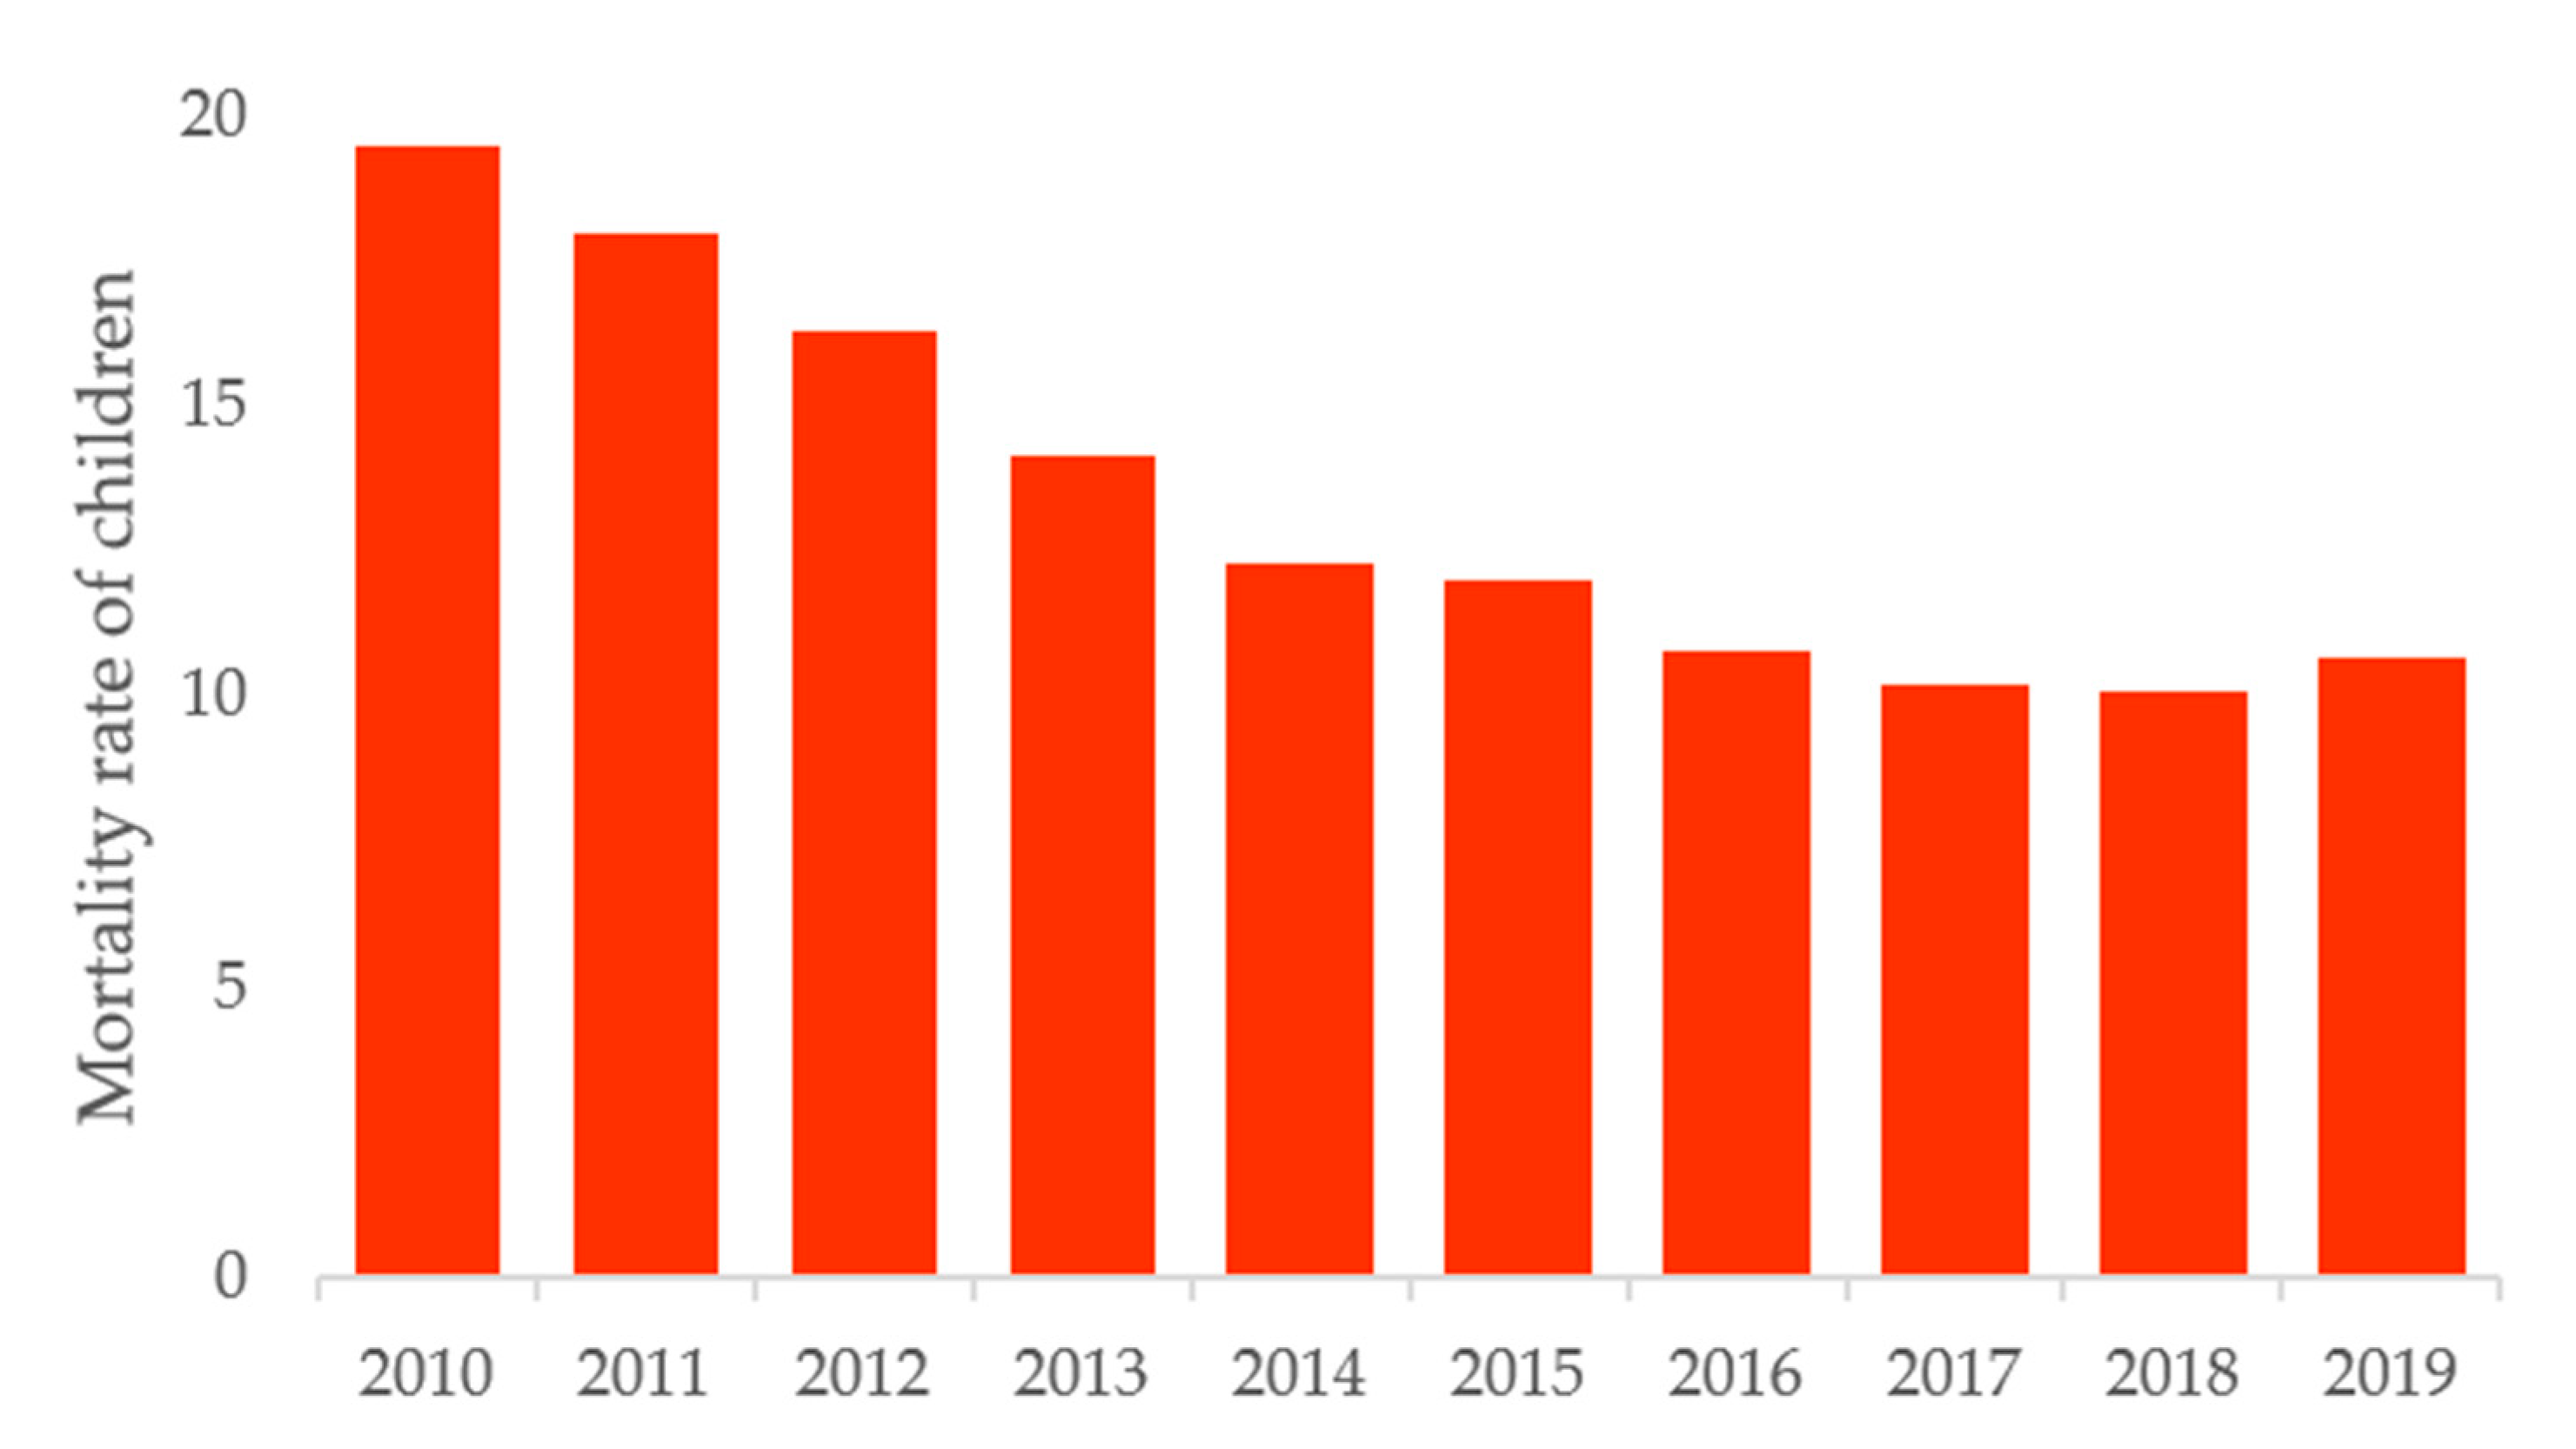
Figure 2 demonstrates information on mortality of children under 5 years of age in the Republic of Kazakhstan. Obviously, the infant mortality rate in the country has significantly decreased over the past 10 years and amounted to about 1%, however, the indicator is still at a fairly high level: about 10 infant deaths per 1000 births [11].
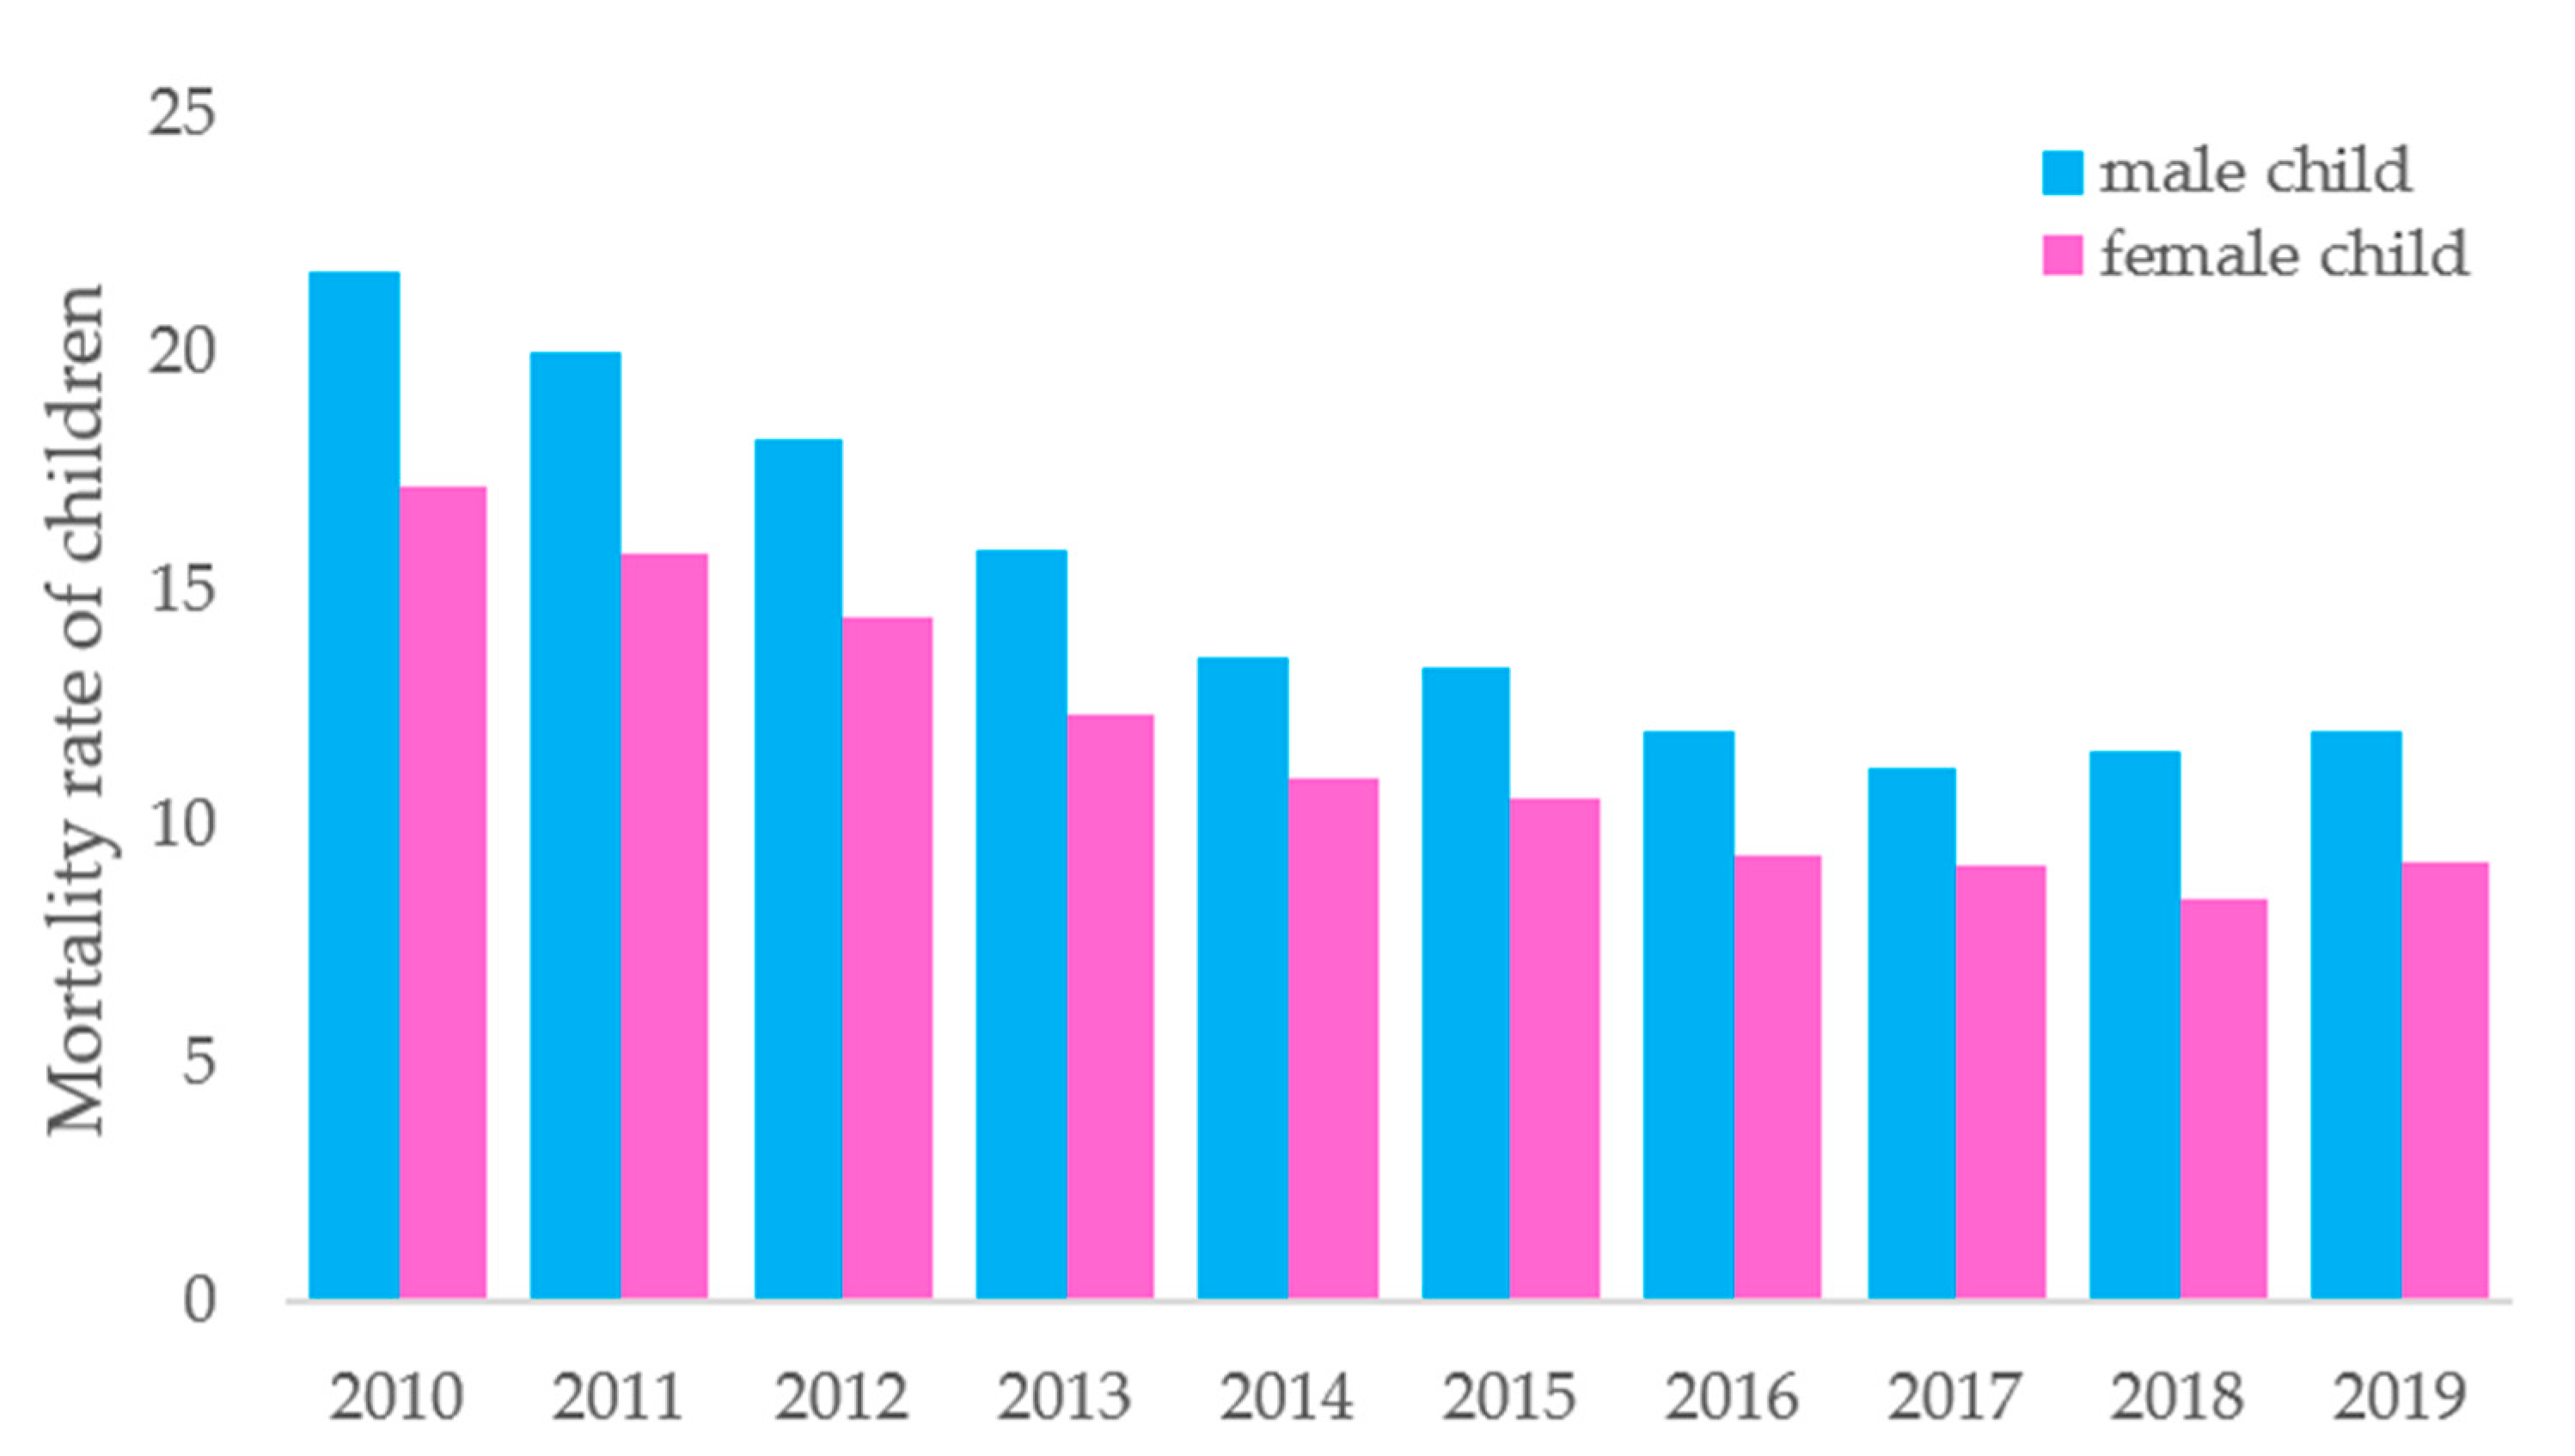
Figure 3 shows the gender difference in the mortality rate among young children in the Republic of Kazakhstan. Obviously, boys are more prone to child mortality (by 3.2% more cases among male children on average) [11].
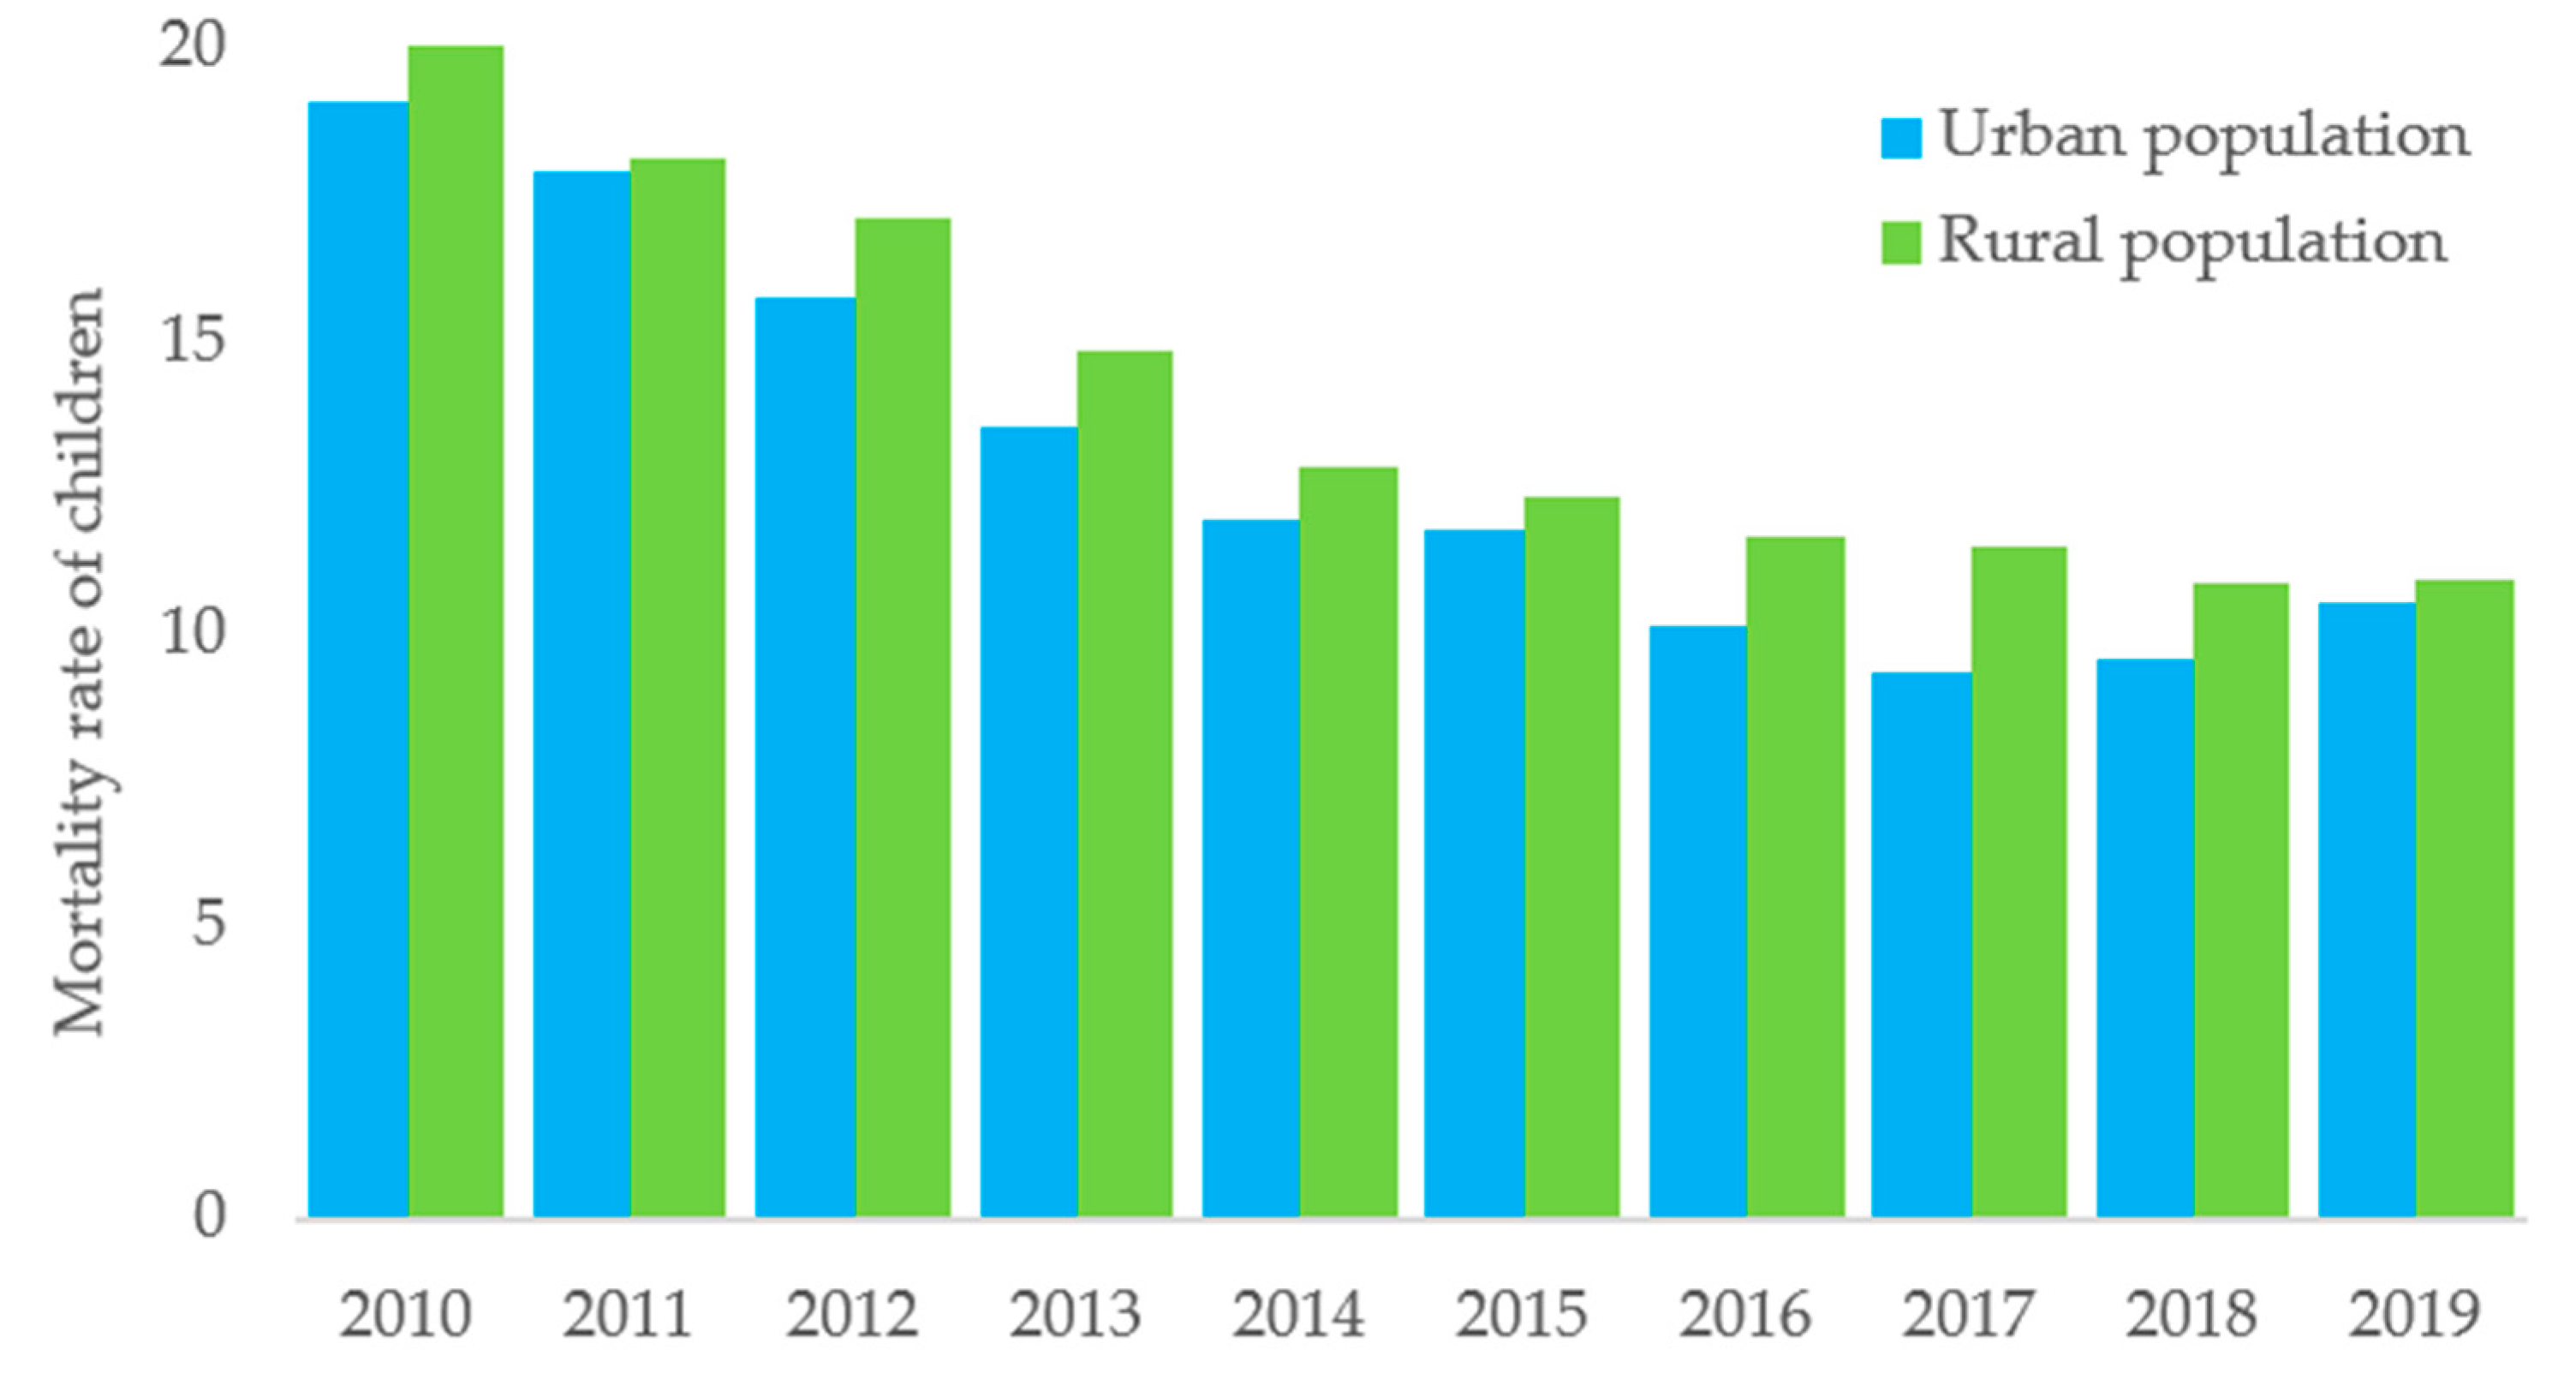
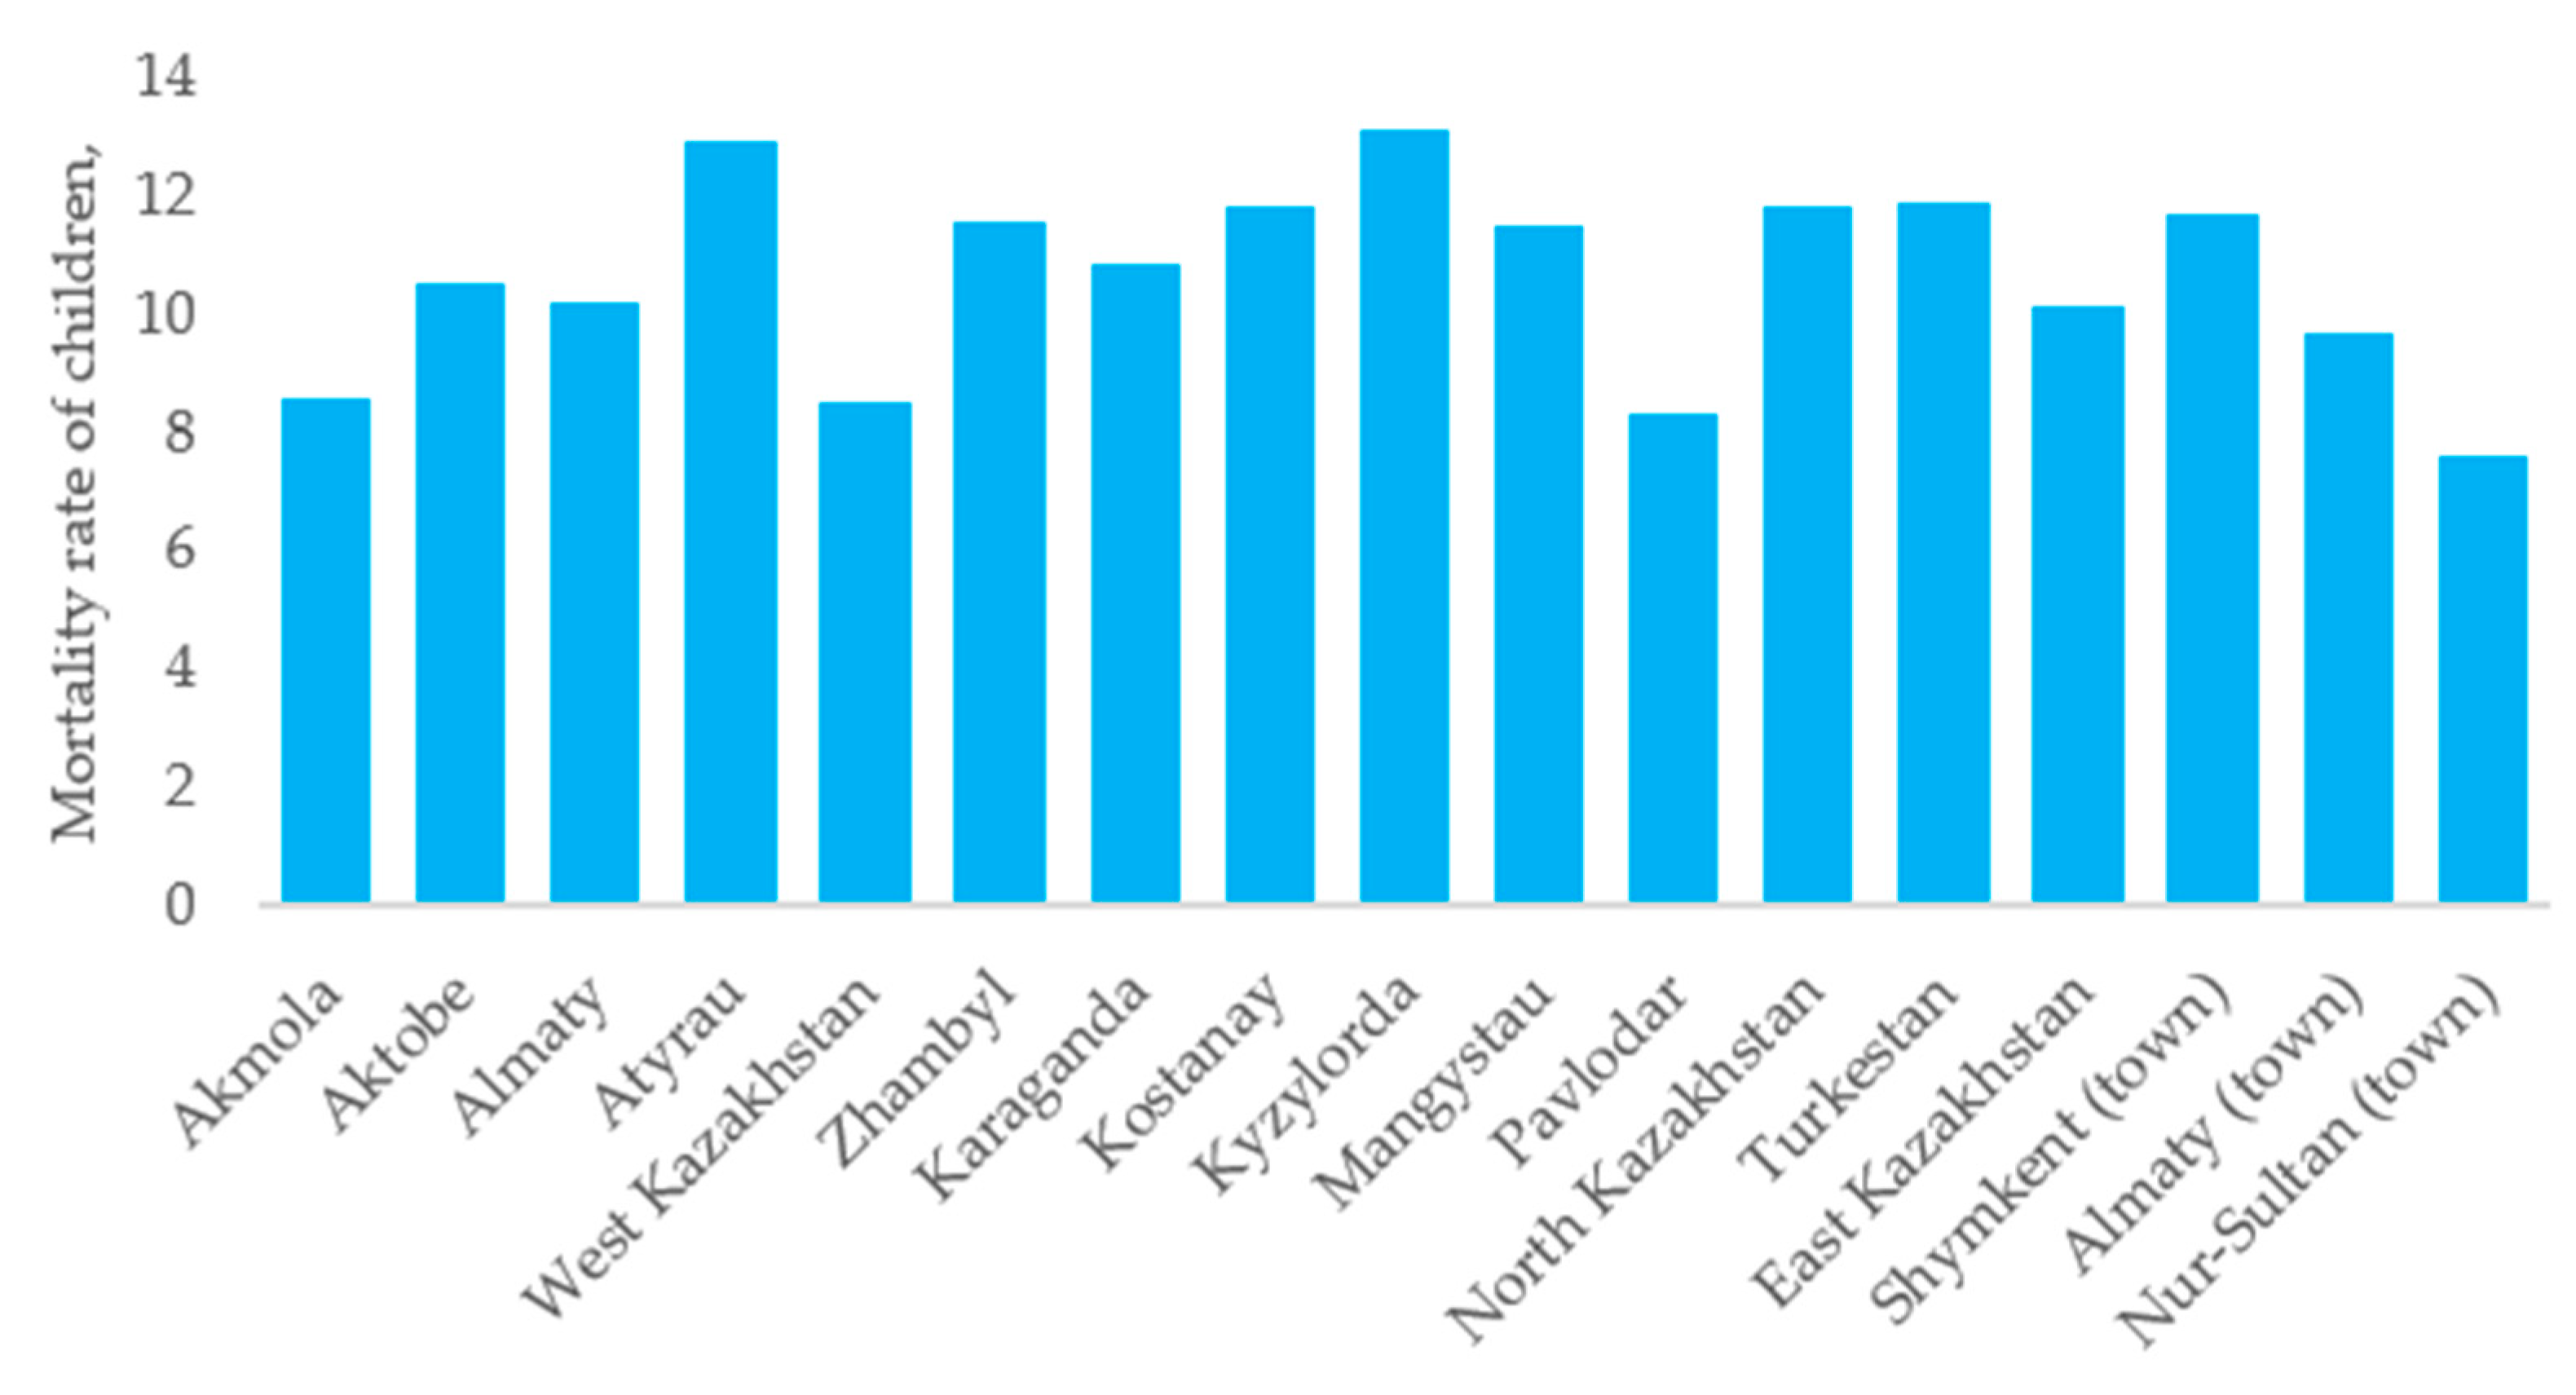
Figure 4 and Figure 5 exhibit the mortality rate of young children in the Republic of Kazakhstan, depending on the place of residence. According to the data, the infant mortality rate in rural areas is slightly higher than in urban areas, apparently due to the insufficient level of medical care and limited access to health care services in rural areas. There is a positive trend in the reduction of child mortality in rural areas, for instance the indicator was reduced by about half in 2019 compared to 2010.
Figure 5 shows the regions in the Republic of Kazakhstan where the infant mortality rate exceeds 1.2%—Atyrau and Kyzylorda (based on 2019 data). At the same time, the lowest indicator of 7.62 infant mortality was observed in Nur-Sultan [11,12].
According to FAO 2018, the absolute number of the world’s population suffering from malnutrition increased from about 804 million in 2016 to almost 821 million in 2017. This trend is prompting the global community to intensify its efforts to achieve targets of the Sustainable Development Goals (SDG 2.1) and ensure the poor and vulnerable population, including infants with access to safe, nutritious and sufficient food year-round by 2030. It is apparent that, in the next 5–10 years, strong measures must be adopted to regulate the number of children suffering from wasting in the country in order to reach the set level of below 5 and 3% by 2025 and 2030, respectively. In addition, the dynamics of the prevalence of malnutrition, combined with rapid population growth, will cause a growth in the total number of undernourished people [1].
There is no doubt that providing the Kazakh population with basic foods following approved consumption rates, considering the change in the population of the country will bring about the elimination of malnutrition [13].
3.1.2. Population of the Central Asia (CA) and the Republic of Kazakhstan
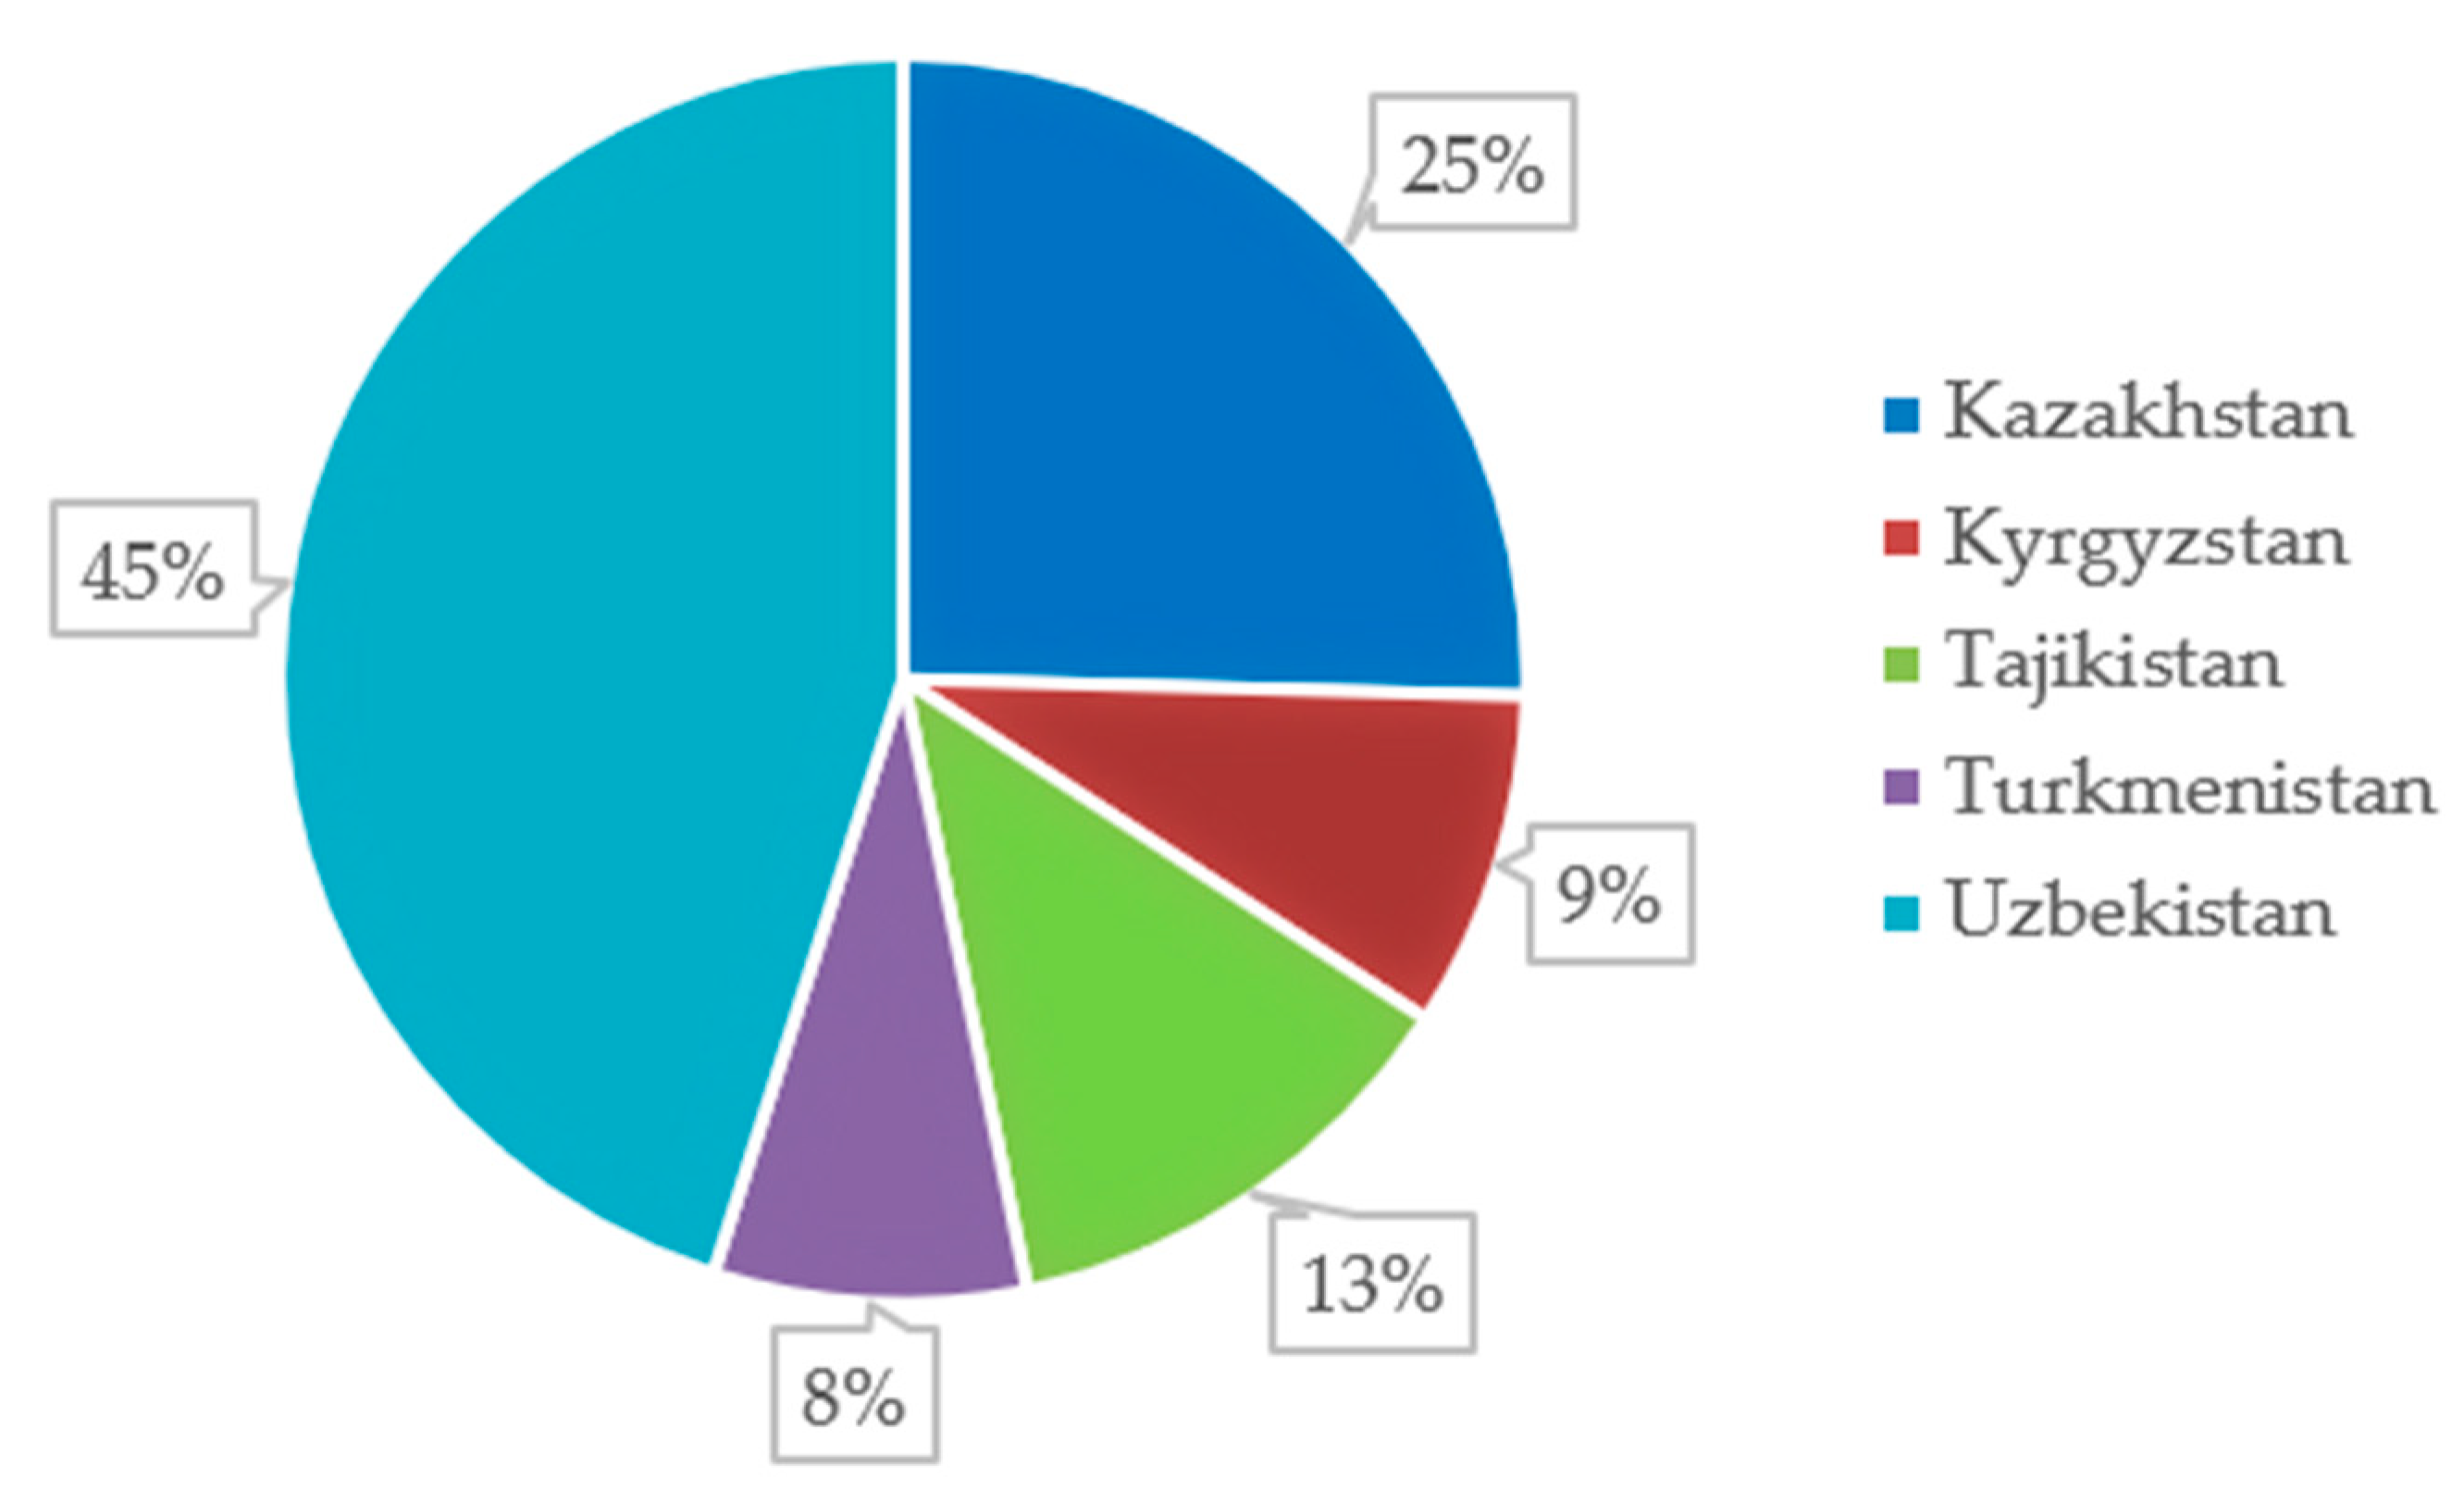
Central Asia is an extremely large region with a total surface area of more than 4 million square kilometers, which is sparsely and unevenly populated. Central Asia has a population more than 60 million, in comparison, Central Asia covers an area that exceeds the territory of Pakistan, India and Bangladesh combined [3,14,15]. According to FAO stat 2018, about 72 million people counted in Central Asia, and about 1 billion 726 million people in Pakistan, India, and Bangladesh in total, that is 24 times the population in Central Asia. Figure 6 reflects the uneven distribution of the Central Asian population among the countries of Uzbekistan—45% (over 32 million people), Kazakhstan—25% (over 18 million people), Tajikistan—13% (over 9 million people), Kyrgyzstan—9% (over 6 million people) and Turkmenistan—8% (slightly less than 6 million people).
Figure 6 represents the dynamics of population change for the period 2009–2019 to assess the level of self-sufficiency in food products in the Republic of Kazakhstan. There has been an increase in the Kazakh population growth over the past 10 years by about 2.6 million people, mainly due to the urban population growth (a rise of about 2.3 million people), while the rural population has remained practically unchanged (a rise of about 0.3 million people) (Figure 7). The data reveal the predominant migration of the Kazakh population to cities causes the irrational use of agricultural resources in the Republic of Kazakhstan, particularly due to the lack of human resources in rural areas.
The World Bank (WB, 2013) reported a low level of life quality for an average person in the Republic of Kazakhstan. The limited access to basic social services and the necessary infrastructure is caused by low population density and uneven distribution of the population living in urban and rural areas. Despite the relatively high human development index, a significant part of the Kazakh population is unemployed or employed in the informal sector, causing a high poverty rate. This tendency is exacerbated by the lack of access to basic public services, electricity, basic foods, and drinking water in certain regions [16].
3.1.3. Food Self-Sufficiency of the Republic of Kazakhstan
The estimation of the self-sufficiency of the Kazakh population in basic foods was executed over the past 10 years to assess the food security in the Republic of Kazakhstan.
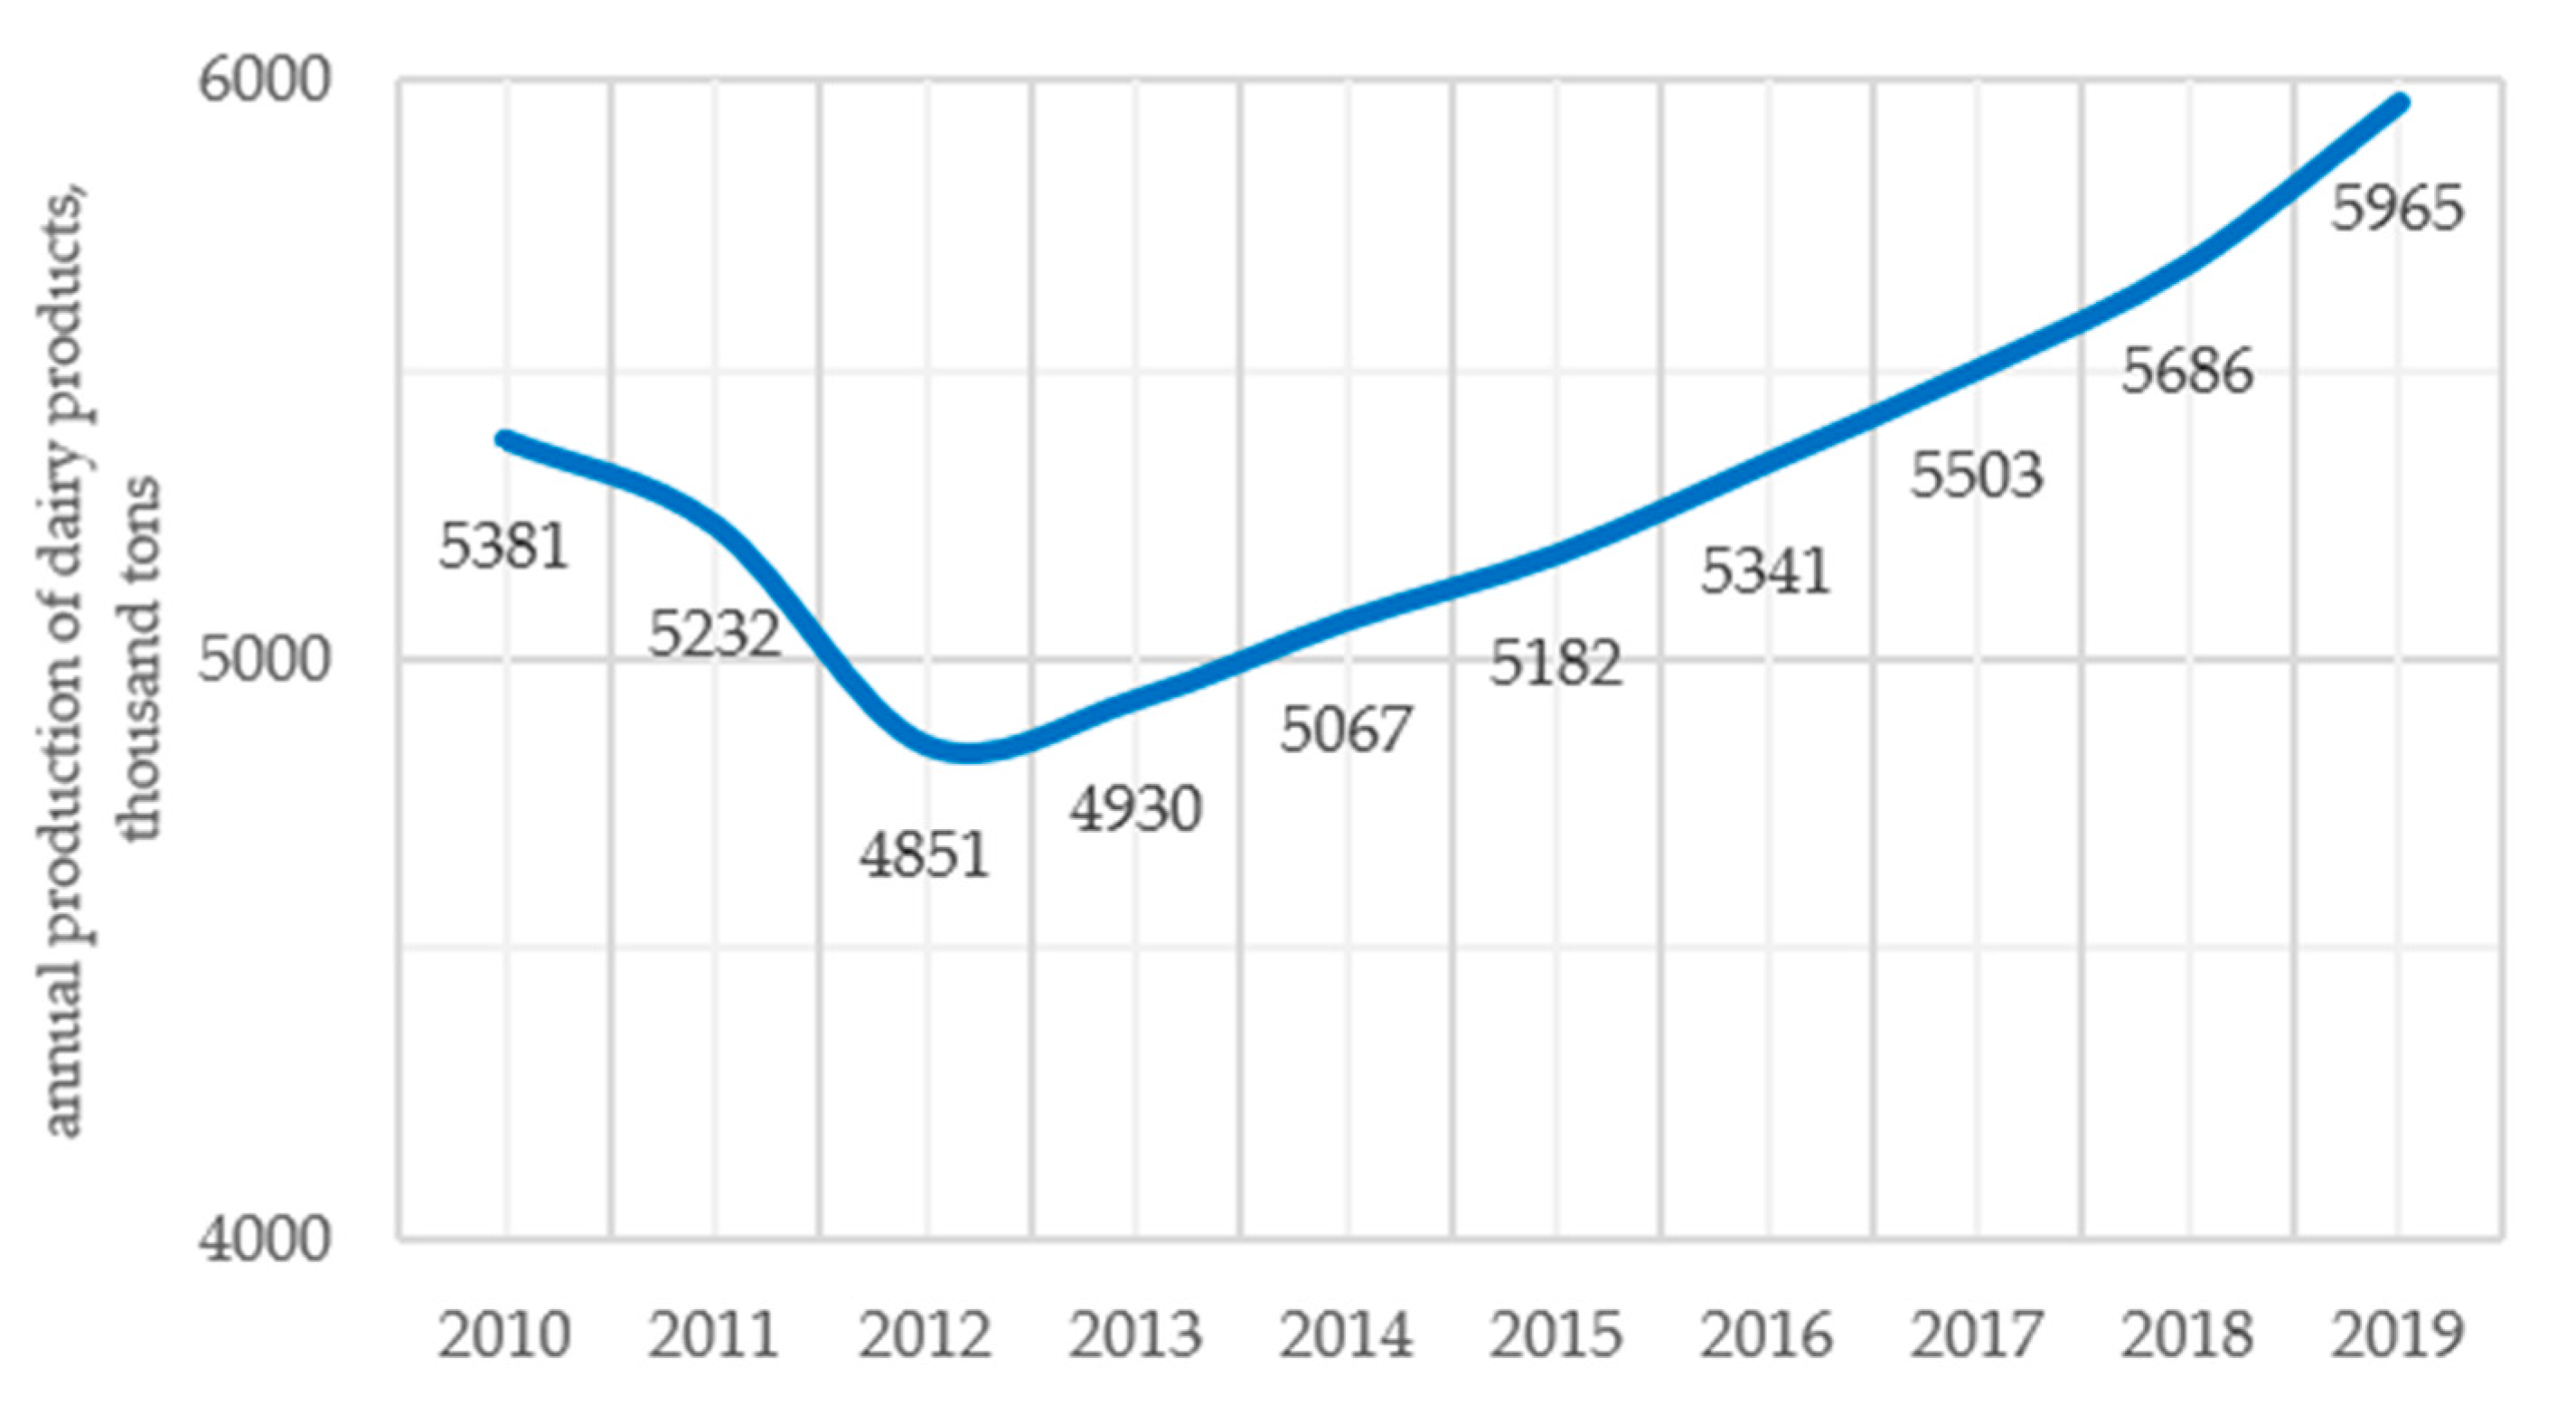
Figure 8 exhibits the dynamics of changes in the production of dairy products in the Republic of Kazakhstan for 2010–2019. It is shown that there is a decrease in the number of dairy products produced in the Republic of Kazakhstan until 2012. Besides, the volume of output of dairy products in 2010 was achieved again after 2016. The stable upward tendency in this indicator by 2019 facilitated the volume of dairy production in 5965 thousand tons, which is 584 tons and 1114 tons higher than 2010 and 2012.
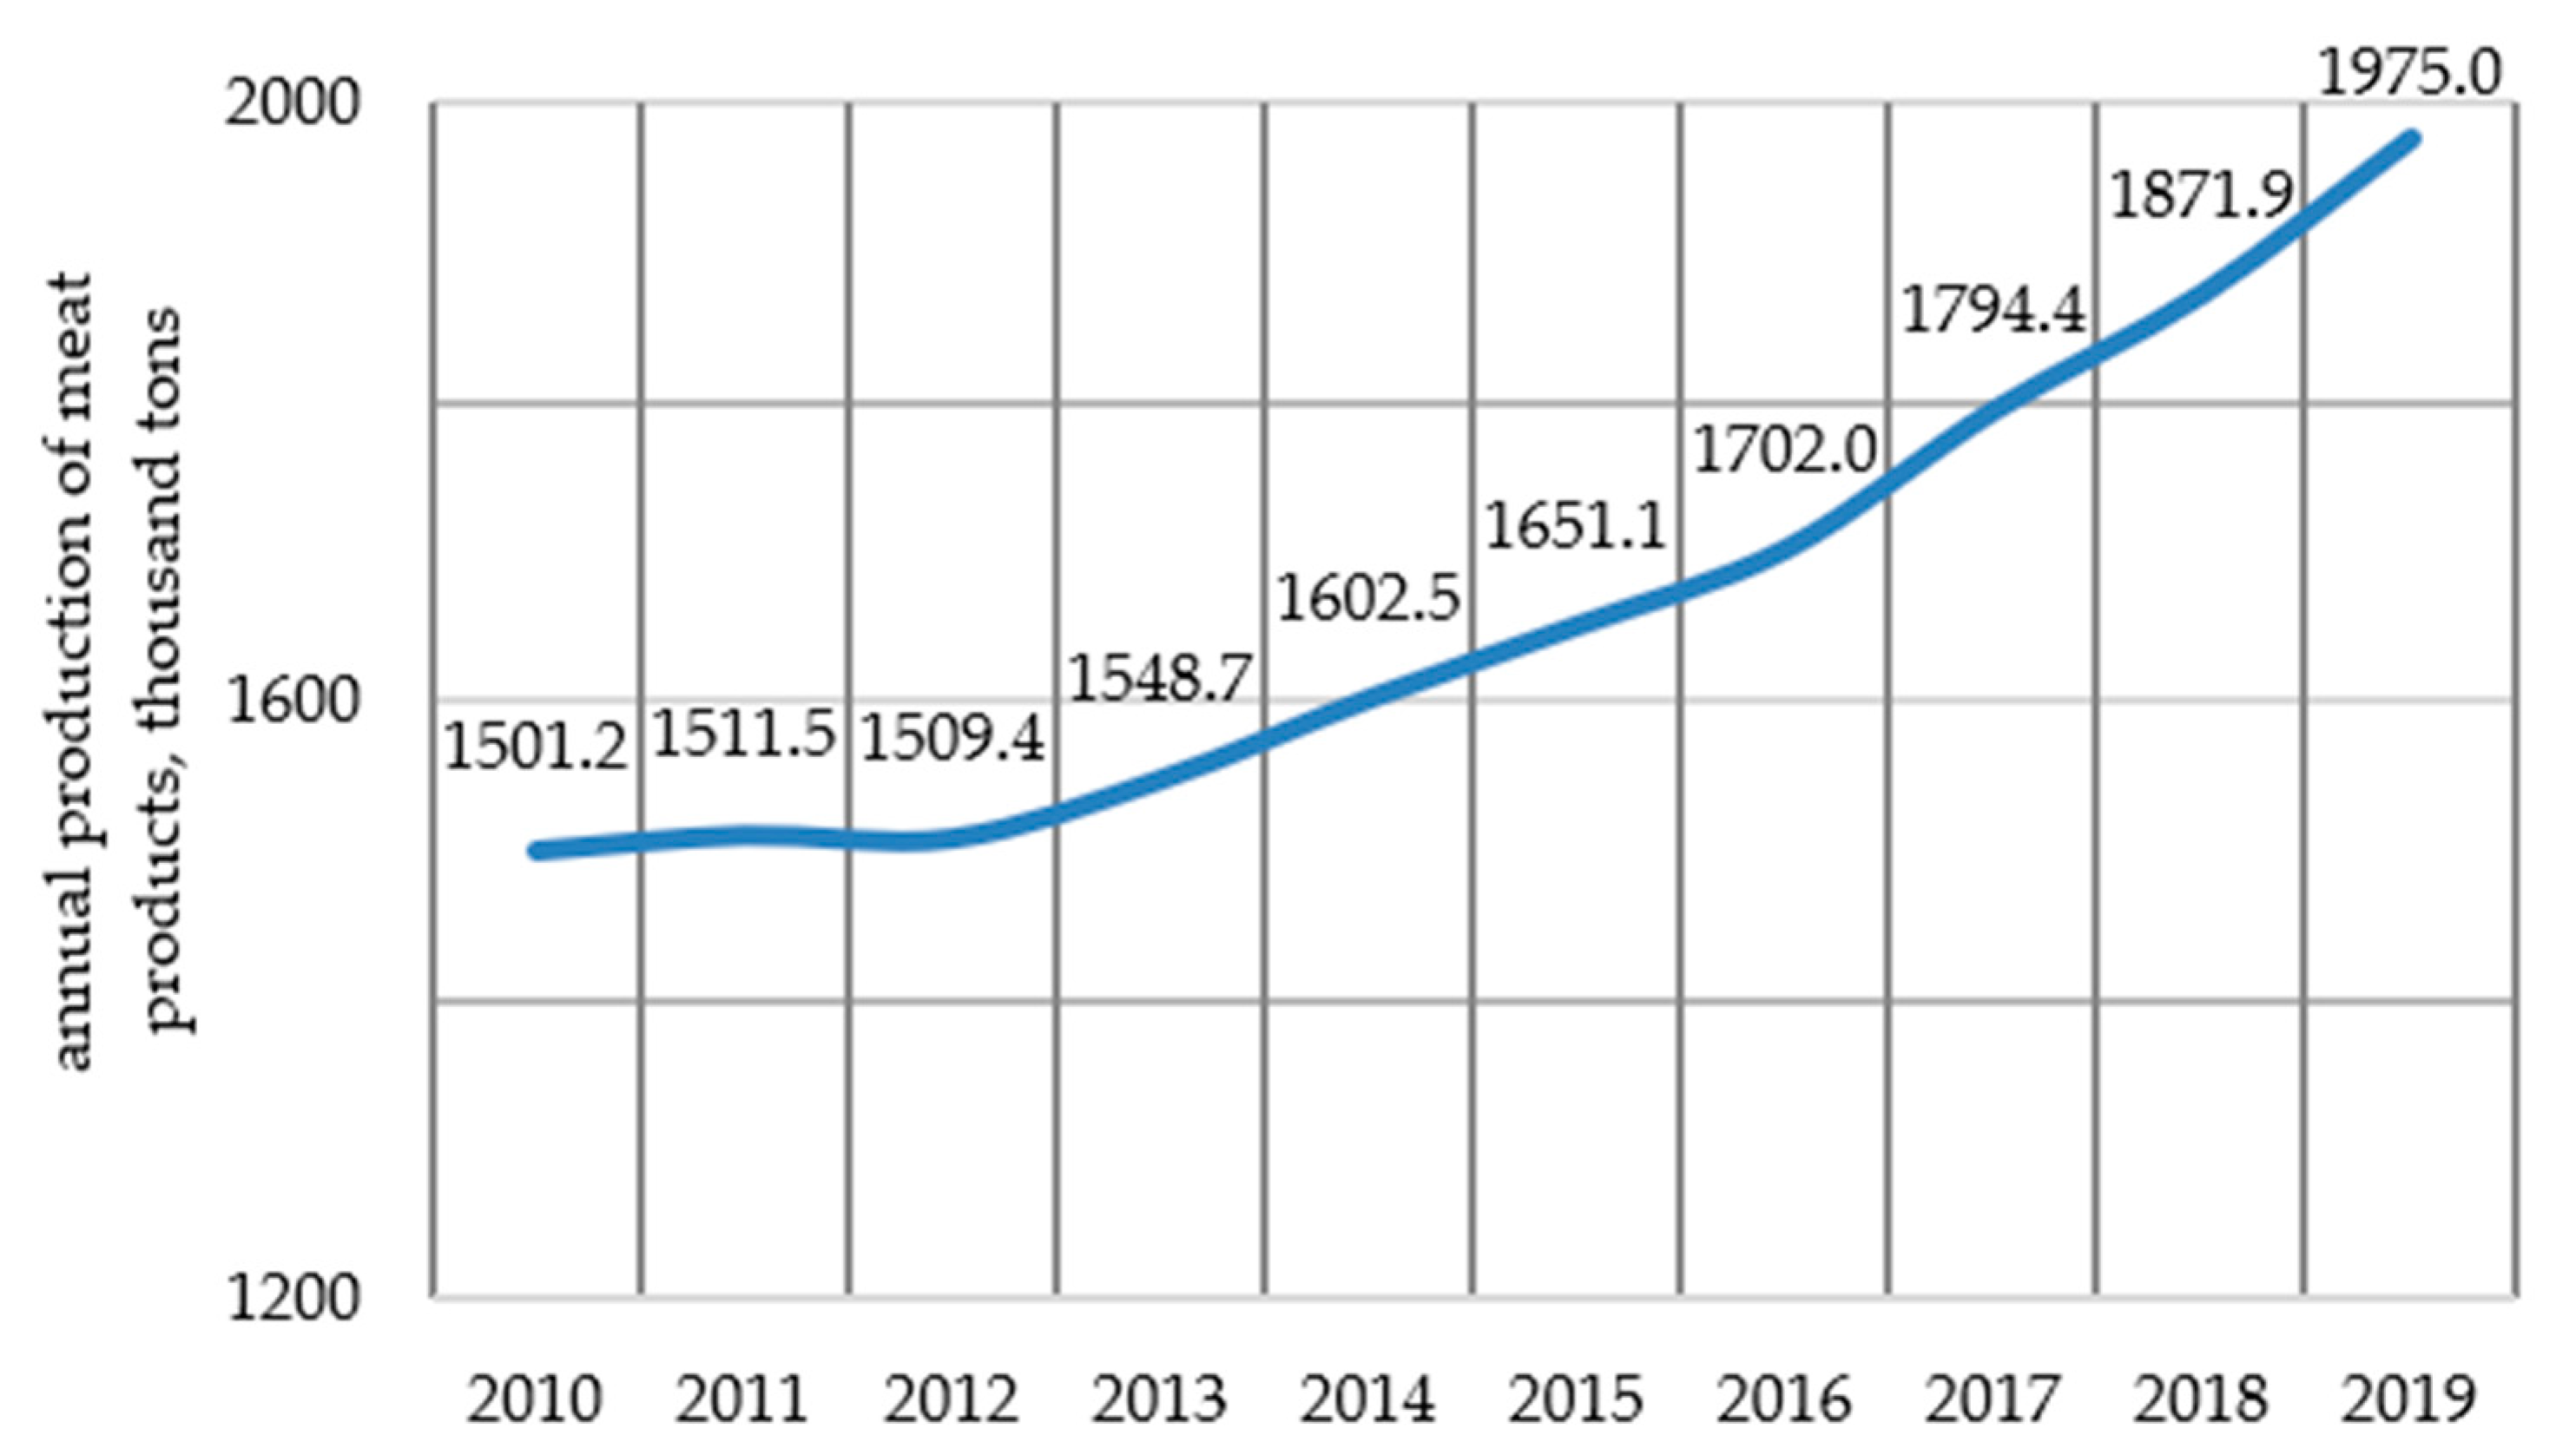
Figure 9 presents statistical data on the amount of meat products produced in the Republic of Kazakhstan for 2010–2019. Stable growth in meat production since 2012 has allowed production to increase by 474 and 465 tons from 2010 and 2012, respectively.
The assessment of the self-sufficiency of the Kazakh population in basic foods was executed by taking the amount of dairy and meat products produced in 2019, as well as the physiological need for food following approved based consumption rates in the amount of 301 and 78.4 kg of dairy and meat products per years, respectively [13]. The obtained data are represented in Table 3 and Table 4. It should be noted that Table 3 reflects only those regions where self-sufficiency in dairy products was reported above 0% (Nur-Sultan, Shymkent).
The data presented exhibits a high degree of self-sufficiency of the Kazakh population in meat products (117.6%); however, self-sufficiency in dairy products is at a low level (0.1%). Thus, Kazakhstan is confronted with a structural imbalance in raw materials and socio-economic problems, such as excessive dependence on the export of raw milk and products based on it [17]. This problem can be solved by increasing the rate of development of agriculture, through the development of camel breeding in Kazakhstan with the intervention of state regulation in this issue.
3.2. Development of Camel Breeding as an Approach to Solve the Problem of Food Security in the World and the Republic of Kazakhstan
Camel breeding is the most successful industry in the world, as shown by statistics from FAO WHO (Table 5). Over the past 10 years, the population of camels worldwide has increased by 29.4%, outgrowing the rise in the population of goats and sheep by 9.8 and 17% and significantly predominating the growth in populations of other types of farm animals, such as buffalo, cattle, horse. It should be noted that there was a tendency for a decline in horse populations by 2.6% for the period 2009–2019 in the world.
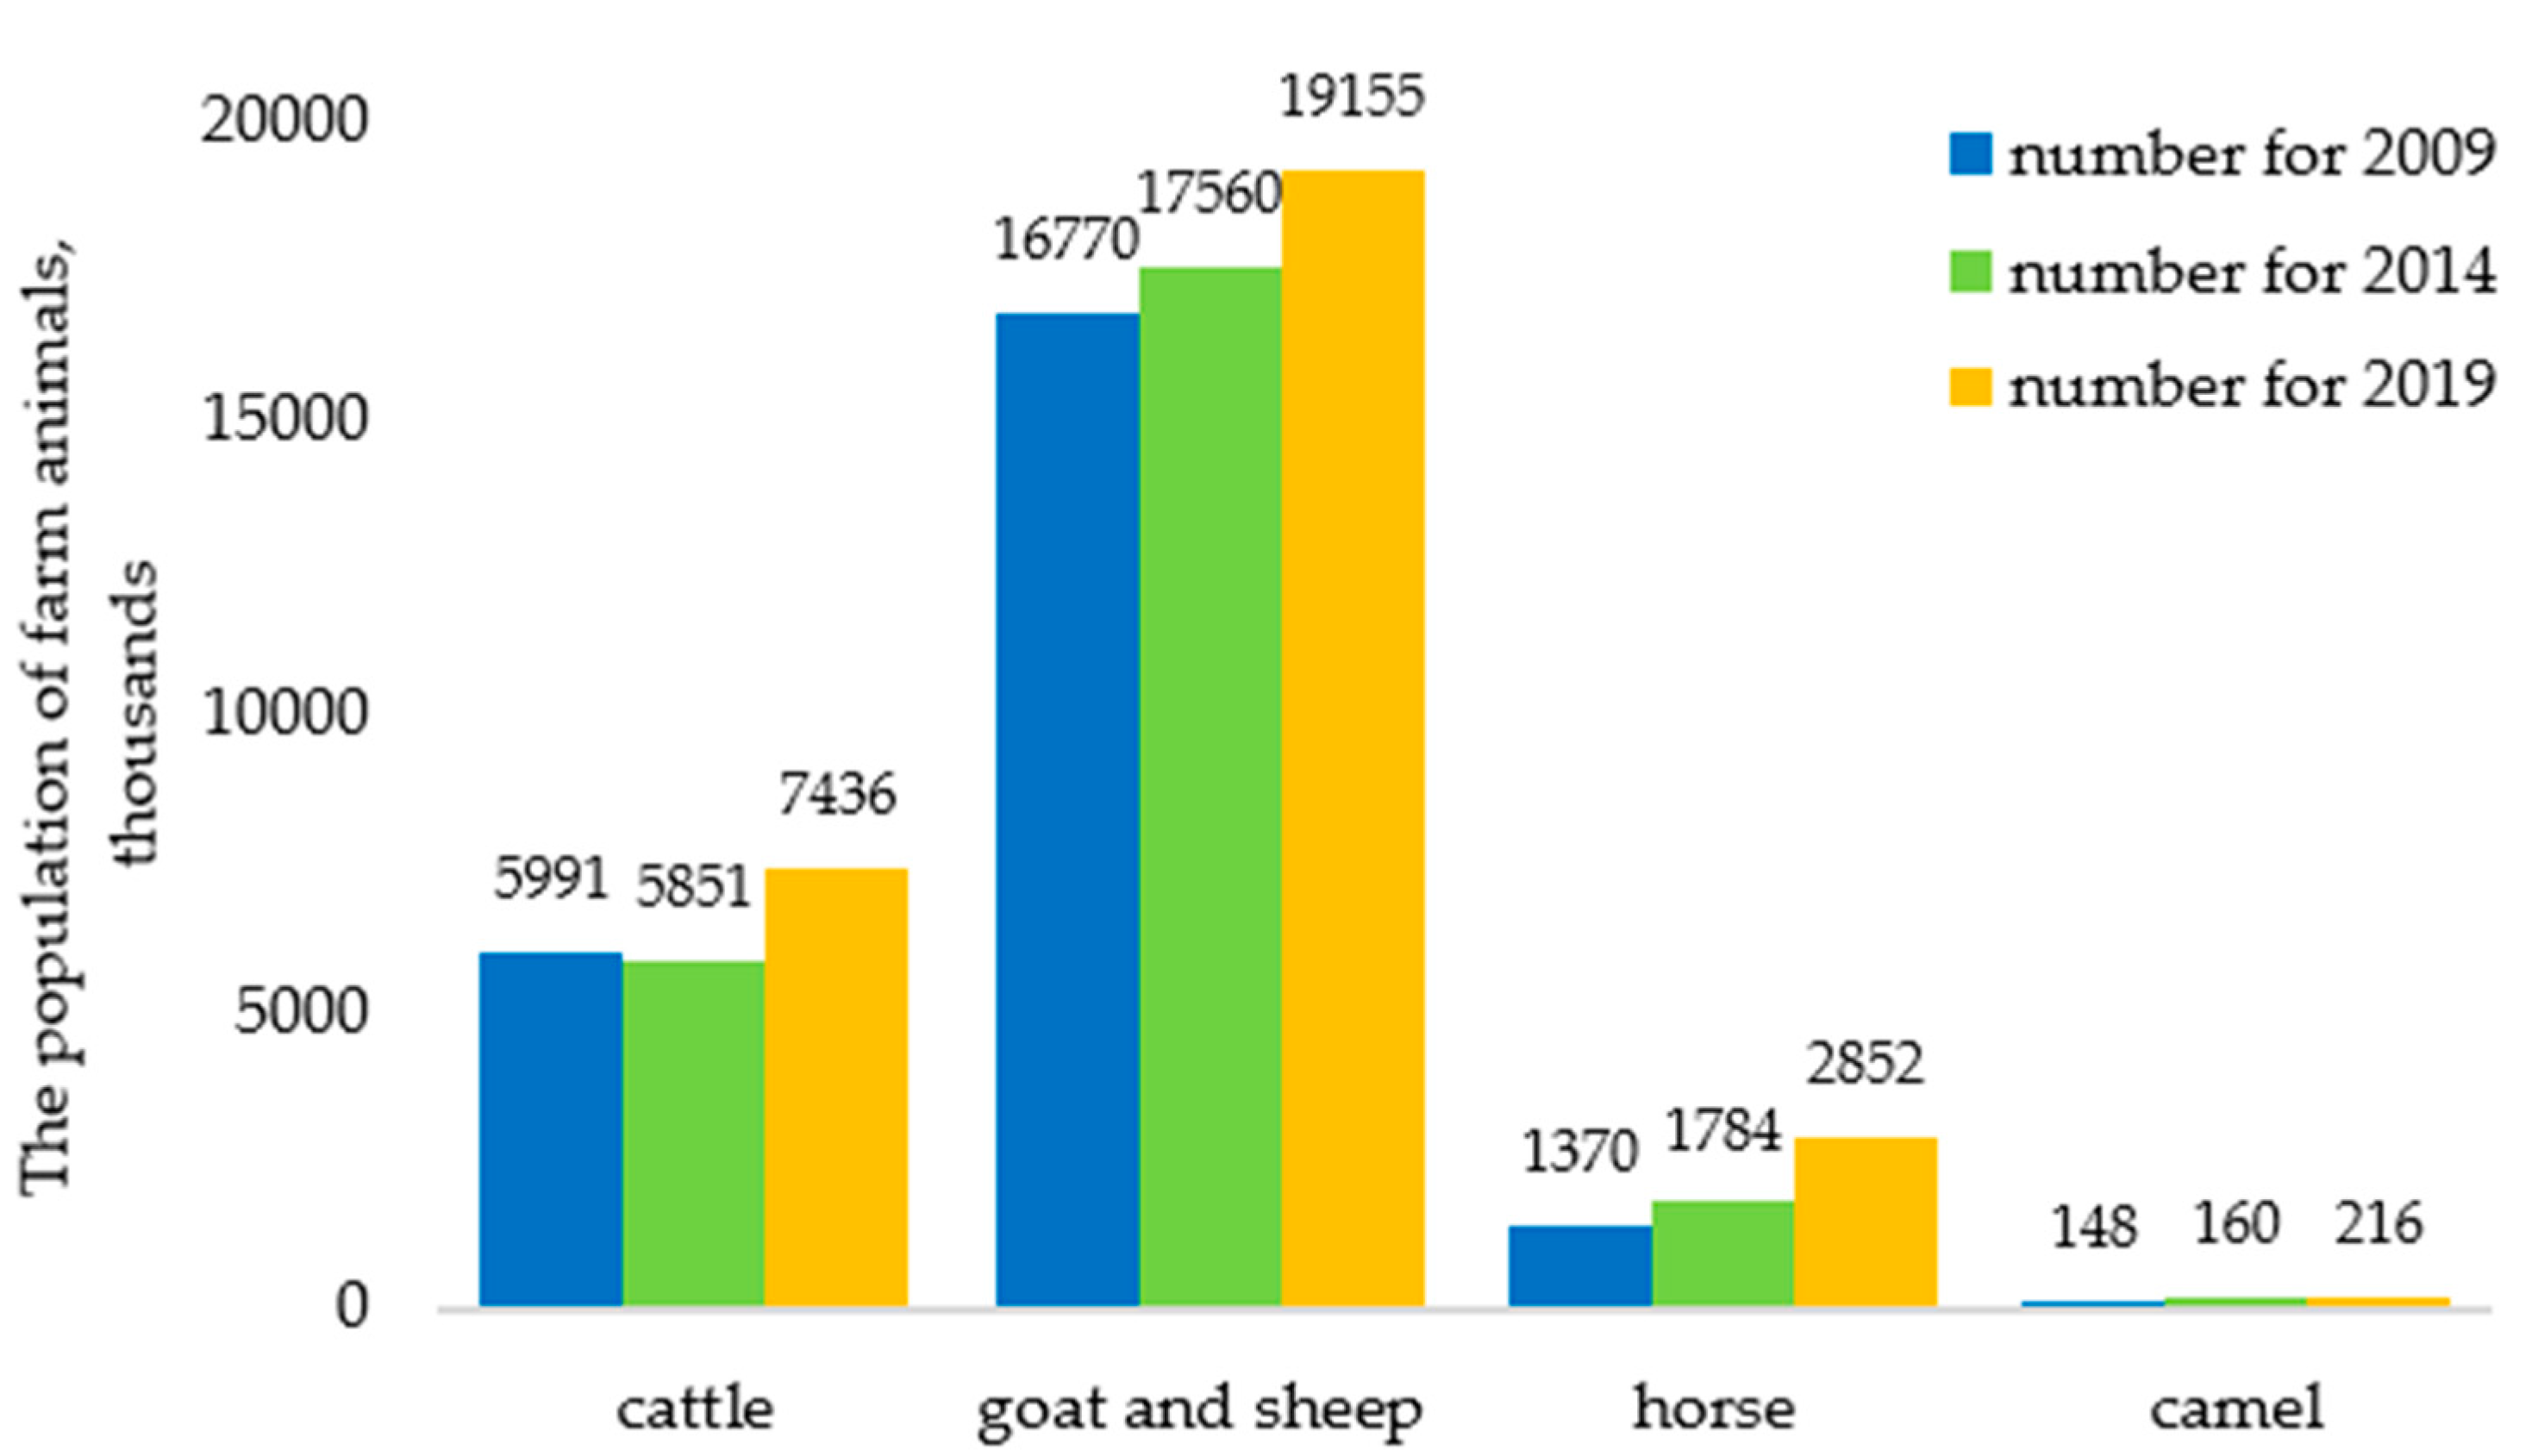
Statistical data from Stat.gov.kz and FAOstat on the population of camels in the Republic of Kazakhstan in the period of 2009–2019 are represented in Table 6. Stat.gov.kz and FAOstat showed identical data for the period of 2014, however, there are discrepancies for the period of 2019, and all data from Stat.gov.kz statistics have higher values compared to FAOstat data for 2019. Data presented in Stat.gov.kz (FAOstat) reflect a tendency of stable growth in the number of camels by 45.9% (+39.9%), with the largest increase by 37.4% (+31.4%) observed over the past 5 years. It should be mentioned that over the past 10 years the increase in the camel population in the Republic of Kazakhstan exceeds this indicator for cattle by 21.8% (20.6%), as well as for sheep and goats in total by 31.7% (by 28.4%). Despite the positive dynamics of growth in the number of camels and horses in the Republic of Kazakhstan, their number is significantly lower than the number of cattle, goats and sheep, therefore, any changes in the number of camels and horses will be significantly higher than changes in the number of other species of livestock (Figure 10). At the same time, the tendency for a high growth in the number of horses is explained by the specificity of herd horse breeding in the Republic of Kazakhstan. There are a number of prerequisites for the predominant development of horse breeding in the country, such as the presence of extensive pastures, centuries-old horse breeding experience, horse breeds adapted to the climate of Kazakhstan, as well as a high demand for horse meat and saumal (fresh mare’s milk) among local residents, etc. These factors provide a high potential of the horse breeding markets [18,19].
FAOstat statistics confirm that the number of camels is significantly lower than the number of cattle around the world, in particular in the Republic of Kazakhstan (Figure 10).
3.3. Camel Milk Is a Source of High-Quality Protein
Camels are considered as a good source of milk and meat products. Camels are divided into two main species regarding the genus Camelus such as Dromedary camels and Bactrian camels. Unlike dromedaries, Bactrian camels are more adapted to live in the cooler areas and are more common in Kazakhstan, as in other nearby regions, such as the East to the Northern China and in the West to Asia Minor and Southern Russia, including Mongolia. The chemical composition of milk of different types of camels (Dromedary camels and Bactrian camels) has significant differences [20,21]. It also depends on a number of other indicators, such as the health of the animal, the conditions of its maintenance, feeding characteristics, as well as climatic conditions, etc. Scientists have proved [22] that under the same conditions of camels breeding, milk from Bactrian camels has increased chemical composition indicators compared to milk from Dromedary camels, in particular in terms of such indicators as fat matter, total protein, vitamin C, calcium, phosphorus, and a lower content in lactose in Bactrian camel milk compared to dromedary milk.
Scientists have studied in sufficient detail the chemical composition of various types of livestock milk [22,23]. Data displayed in Table 7 present the standardized indicators of the chemical composition of milk from various farm animals. Obviously, that camel milk contains a high level of dry substances, in particular, protein than other types of milk from farm animals excluding of sheep milk. The recalculation of milk macronutrients for dry matter allows describing the quantitative characteristics of the chemical composition of different types of milk under the same conditions (based on 100 g of dry matter). According to the data obtained, the mass fraction of protein in camel milk is 25.3 (g per 100 g of dry matter), which is near to the mass fraction of protein in cow’s milk—25.5 (g per 100 g of dry matter). Camel and cow milk are inferior in this indicator to sheep milk by 2.3% and 2.1%, respectively. Besides, camel milk surpasses goat and mare’s milk in terms of the studied indicator by 4.4% and 4.7%, while cow milk exceeds goat and mare milk on this indicator by 4.6% and 4.9%.
Thus, camel milk can be considered as an alternative raw material to cow’s milk, which is a source of high-quality protein.
4. Discussion
The paper highlights the issues of human vulnerability in the context of food security, considering the three main factors, such as human health, self-sufficiency in basic foods, and environmental management. Displayed data revealed a continuous negative tendency on the level of food insecurity among the population of the Republic of Kazakhstan in recent years. 1.9% of the country’s population was severely food insecure in 2019; however, the rate is 0.4% lower than the established level for the population of Central Asia (2.3%) according to FAO, 2020.
The prevalence of malnutrition among the population of the Republic of Kazakhstan is noted at 4.1% (according to the statistics of the Republic of Kazakhstan for 2019), which exceeds the projected value of the indicator for Central Asia (2.7%) according to FAO, 2020. The difference in the prevalence of malnutrition was established among the population of the country, depending on the place of residence, in particular the indicator for rural residents is 1% lower than for urban residents. The existing situation negatively affects the malnutrition of children under 5 years of age in the Republic of Kazakhstan. According to the latest data, 9.3% of children are overweight, 8% are stunted, 3.1% are wasted and 2% are underweight. The situation is aggravated by high infant mortality, mostly among children under 1 year of age. It was revealed that there was a positive trend in the reduction of cases of underweight, stunting, and overweight among children under 5 years of age in the Republic of Kazakhstan in 2015. However, further optimization is required in this issue in order to achieve the established indicators of the FAO WHO SDGs in the short term (until 2025) and in the medium term (until 2050). Considering the steady growth of the population of the Republic of Kazakhstan, a low level of self-sufficiency in dairy products has been established, the use of which is most important in the nutrition of young children. Despite the high potential for the development of camel breeding in the country, the number of camels remains at an extremely low level. The industry needs significant government support.
Based on the calculated data, it has been shown that camel milk is a great source of macronutrients, in particular high-quality protein, and is rightfully considered an alternative source to cow’s milk. Consumption of one liter of camel milk will provide at least 38 g of high-quality protein, which will cover more than 50% of the average person’s daily protein requirement (recommended dietary allowances (RDA) for human is 63 g of protein [26].
It is expected that the development of camel breeding in the country can partially solve the problem of malnutrition by optimizing the self-sufficiency of the population with dairy products, which are especially needed in the nutrition of young children. More than that camel breeding has shown successful development over the past 10 years and has all the prerequisites for further development.
5. Conclusions
The program for the development of the agro-industrial complex in Kazakhstan (2013–2020) demonstrated the feasibility of using new instruments of state regulation and modernization of the industry. Camel farming has shown successful development in the country over the past 10 years, however, it requires further development, considering state support programs in the form of subsidies, grants, etc. An integrated approach at the state and regional level will partially solve the problem of self-sufficiency of the population with dairy products and reduce the level of malnutrition in the republic, especially among young children.
Camel milk is a balanced source of food macronutrients (25% of dry matter is protein). The daily consumption of camel milk can achieve food security indicators and improve the nutritional status of children under 5 years of age, in particular:
- ‒
- reduce the total number of stunted children under five years old;
- ‒
- decrease the incidence of low birth weight;
- ‒
- reduce and stabilize the prevalence of overweight in children;
- ‒
- decline and stabilize the number of malnourished children.
Author Contributions
Conceptualization, A.O. and L.N.; methodology, M.M.; validation, L.N. and K.B.; formal analysis, A.Z.; investigation, A.O. and M.M.; writing—original draft preparation, L.N.; writing—review and editing, A.O.; visualization A.Z.; supervision L.N.; project administration, A.O.; funding acquisition K.B.; All authors have read and agreed to the published version of the manuscript.
Funding
This research was funded by ITMO University in the framework of fundamental research “Development of an integrated technology of nanostructured micelated forms of biologically active substances of natural origin”, No 620162”.
Institutional Review Board Statement
Not applicable.
Conflicts of Interest
The authors declare no conflict of interest.
References
- FAO; IFAD; UNICEF; WFP; WHO. The State of Food Security and Nutrition in the World 2018. In Building Climate Resilience for Food Security and Nutrition; FAO: Rome, Italy, 2018. [Google Scholar]
- Faye, B. Camel Farming Sustainability: The Challenges of the Camel Farming System in the XXIth Century. J. Sustain. Dev. 2013, 6, 74–82. [Google Scholar] [CrossRef] [Green Version]
- Hauck, M.; Artykbaeva, G.T.; Zozulya, T.N.; Dulamsuren, C. Pastoral livestock husbandry and rural livelihoods in the forest-steppe of east Kazakhstan. J. Arid Environ. 2016, 133, 102–111. [Google Scholar] [CrossRef]
- Lioubimtseva, E.; Henebry, G.M. Climate and environmental change in arid Central Asia: Impacts, vulnerability, and adaptations. J. Arid Environ. 2009, 73, 963–977. [Google Scholar] [CrossRef]
- Strohmaier, R.; Rioux, J.; Seggel, A.; Meybeck, A.; Bernoux, M.; Salvatore, M.; Miranda, J.; Agostini, A. The agriculture sectors in the Intended Nationally Determined Contributions: Analysis. In Environment and Natural Resources Management Working Paper; FAO: Rome, Italy, 2016. [Google Scholar]
- Biesalski, H.K.; Jana, T. Micronutrients in the life cycle: Requirements and sufficient supply. NFS J. 2018, 11, 1–11. [Google Scholar] [CrossRef]
- Faye, B.; Bonnet, P. Camel Sciences and Economy in the World: Current Situation and Perspectives. In Proceedings of the Third Conference of the International Society of Camelid Research and Development, Keynote presentations, Muscat, Sultanate of Oman, 29 January–1 February 2012; pp. 2–15. [Google Scholar]
- Technical Regulations of the Customs Union 033/2013 “On the safety of milk and dairy products” (TR CU 033/2013). Available online: http://docs.cntd.ru/document/499050562 (accessed on 19 March 2021).
- Technical Notes from the background document for country consultations on the 2021 edition of the UNICEF-WHO-World Bank Joint Malnutrition Estimates SDG Indicators 2.2.1 on stunting, 2.2.2a on wasting and 2.2.2b on overweight, May 2021. Available online: https://data.unicef.org/resources/jme-2021-country-consultations/ (accessed on 19 March 2021).
- Suleimenov, M.; Iniguez, L.; Mursayeva, M. Policy reforms and livestock development in Central Asia. In Policy Reforms and Agriculture Development in Central Asia; Babu, S.C., Djalalov, S., Eds.; Springer: New York, NY, USA, 2006; pp. 277–310. [Google Scholar]
- Agency for Strategic Planning and Reforms of the Republic of Kazakhstan, Bureau of National Statistics. Available online: https://stat.gov.kz/ (accessed on 26 May 2021).
- Small, I.; Bunce, N. The Aral Sea disaster and the disaster of international assistance. J. Int. Aff. 2003, 56, 11–13. [Google Scholar]
- Executive Order of the Minister of National Economy of the Republic of Kazakhstan dated December 9, 2016 No. 503. Registered with the Ministry of Justice of the Republic of Kazakhstan on January 13, 2017 No. 14674. Available online: https://www.gov.kz/memleket/entities/economy?lang=en (accessed on 14 March 2021).
- Lioubimtseva, E. Possible changes in the carbon budget of arid and semi-arid Central Asia inferred from land-use/land cover analyses during 1981–2001. In Climate Change and Terrestrial Carbon Sequestration in Central Asia; Taylor & Francis: London, UK, 2007; pp. 441–452. [Google Scholar]
- Li, J.; Chena, H.; Zhang, C. Impacts of climate change on key soil ecosystem services and interactions in Central Asia. Ecol. Indic. 2020, 116, 1–12. [Google Scholar] [CrossRef]
- Mukhtarova, K.; Zhidebekkyzy, A. Development of Green Economy via Commercialization of Green Technologies: Experience of Kazakhstan. J. Asian Financ. Econ. Bus. 2015, 9, 21–29. [Google Scholar] [CrossRef]
- Aigarinova, G.T.; Shulanbekova, G.K. Legal Backing of Food Security–As a Major Component of the National Security of the Republic of Kazakhstan. Procedia Soc. Behav. Sci. 2013, 81, 510–513. [Google Scholar] [CrossRef] [Green Version]
- Sa´nchez-Zapata, J.A.; Carrete, M.; Gravilov, A.; Sklyarenko, S.; Ceballos, O.; Donázar, J.A.; Hiraldo, F. Land use changes and raptor conservation in steppe habitats of Eastern Kazakhstan. Biol. Conserv. 2003, 111, 71–77. [Google Scholar] [CrossRef] [Green Version]
- UNICEF; WHO; International Bank for Reconstruction and Development/World Bank. UNICEF, WHO, World Bank Group Regional and Global Joint Malnutrition Estimates, May 2018 Edition. 2018. Available online: https://data.unicef.org/topic/nutrition (accessed on 19 April 2021).
- Farid, M. Nutrient requirements of dromedary camels: Protein and energy requirements for maintenance. J. Arid Environ. 1995, 30, 207–218. [Google Scholar] [CrossRef]
- Al Haj, O.A.; Al Kanha, H.A. Compositional, technological and nutritional aspects of dromedary camel milk. Int. Dairy J. 2010, 20, 811–821. [Google Scholar] [CrossRef]
- Nadtochii, L.; Orazov, A.; Muradova, M.; Bozymov, K.; Japarova, A.; Baranenko, D. Comparison of the energy efficiency of production of camel’s and cow’s milk resources. Energy Procedia 2018, 147, 510–517. [Google Scholar] [CrossRef]
- Konuspayeva, G.; Faye, B.; Loiseau, G. The composition of camel milk: A meta-analysis of the literature data. J. Food Compos. Anal. 2009, 22, 95–101. [Google Scholar] [CrossRef]
- Abe, I.A.; Koffi, M.; Sokouri, P.D.; Konan, T.K.; Yavo, W.; Tidou, S.A.; N’guetta, S. Molecular characterization and in silico analysis of mutations associated with extended-spectrum beta-lactamase resistance in uropathogenic Escherichia coli and Klebisiella pneumoniae in two hospitals, Côte d’Ivoire. Int. J. Genet. Mol. Biol. 2021, 13, 9–20. [Google Scholar]
- Faraz, A.; Waheed, A.; Mirza, R.H.; Ishaq, H.M. Role of Camel in Food Security: A Perspective Aspect. J. Fish. Livest. Prod. 2019, 7, 1–2. [Google Scholar]
- Shamsia, S.M. Nutritional and therapeutic properties of camel and human milks. Int. J. Genet. Mol. Biol. 2009, 1, 52–58. [Google Scholar]
Figure 1.
Nutritional status of Children under Five Years of Age. Source: Bureau of National Statistics of the Agency for Strategic Planning and Reforms of the Republic of Kazakhstan. Available online: https://stat.gov.kz/ (accessed on 26 May 2021).
Figure 1.
Nutritional status of Children under Five Years of Age. Source: Bureau of National Statistics of the Agency for Strategic Planning and Reforms of the Republic of Kazakhstan. Available online: https://stat.gov.kz/ (accessed on 26 May 2021).

Figure 2.
Bureau of National Statistics of the Agency for Strategic Planning and Reforms of the Republic of Kazakhstan. Available online: https://stat.gov.kz/ (accessed on 26 May 2021).
Figure 2.
Bureau of National Statistics of the Agency for Strategic Planning and Reforms of the Republic of Kazakhstan. Available online: https://stat.gov.kz/ (accessed on 26 May 2021).

Figure 3.
The mortality rate among children under 5 years of age by gender per 1000 births. Source: Bureau of National Statistics of the Agency for Strategic Planning and Reforms of the Republic of Kazakhstan. Available online: https://stat.gov.kz/ (accessed on 26 May 2021).
Figure 3.
The mortality rate among children under 5 years of age by gender per 1000 births. Source: Bureau of National Statistics of the Agency for Strategic Planning and Reforms of the Republic of Kazakhstan. Available online: https://stat.gov.kz/ (accessed on 26 May 2021).

Figure 4.
The mortality rate among the urban and rural population of children under 5 years of age per 1000 births. Source: Bureau of National Statistics of the Agency for Strategic Planning and Reforms of the Republic of Kazakhstan. Available online: https://stat.gov.kz/ (accessed on 26 May 2021).
Figure 4.
The mortality rate among the urban and rural population of children under 5 years of age per 1000 births. Source: Bureau of National Statistics of the Agency for Strategic Planning and Reforms of the Republic of Kazakhstan. Available online: https://stat.gov.kz/ (accessed on 26 May 2021).

Figure 5.
The mortality rate of children under 5 years of age in various regions of the Republic of Kazakhstan (The infant mortality rate is an indicator that measures the mortality rate of infants under 1 year of age (0 years). It is calculated as the annual number of infant deaths under 1 year of age per 1000 births). Source: Bureau of National Statistics of the Agency for Strategic Planning and Reforms of the Republic of Kazakhstan. Available online: https://stat.gov.kz/ (accessed on 26 May 2021).

Figure 6.
Population of Central Asian Countries, percentage. Source: FAOstat, 2021. Available online: www.fao.org (accessed on 26 May 2021).
Figure 6.
Population of Central Asian Countries, percentage. Source: FAOstat, 2021. Available online: www.fao.org (accessed on 26 May 2021).

Figure 7.
Population of the Republic of Kazakhstan. Source: Stat.gov.kz, 2021. Available online: https://stat.gov.kz/ (accessed on 26 May 2021).
Figure 7.
Population of the Republic of Kazakhstan. Source: Stat.gov.kz, 2021. Available online: https://stat.gov.kz/ (accessed on 26 May 2021).

Figure 8.
Production of milk and dairy products in the Republic of Kazakhstan for 2010–2019. Source: Stat.gov.kz, 2021. Available online: https://stat.gov.kz/ (accessed on 26 May 2021).
Figure 8.
Production of milk and dairy products in the Republic of Kazakhstan for 2010–2019. Source: Stat.gov.kz, 2021. Available online: https://stat.gov.kz/ (accessed on 26 May 2021).

Figure 9.
Production of meat products in the Republic of Kazakhstan for 2010–2019. Source: Stat.gov.kz, 2021. Available online: https://stat.gov.kz/ (accessed on 26 May 2021).
Figure 9.
Production of meat products in the Republic of Kazakhstan for 2010–2019. Source: Stat.gov.kz, 2021. Available online: https://stat.gov.kz/ (accessed on 26 May 2021).

Figure 10.
Number of livestock in the Republic of Kazakhstan for 2009, 2014, 2019. Source: Stat.gov.kz, 2021. Available online: https://stat.gov.kz/ (accessed on 26 May 2021).
Figure 10.
Number of livestock in the Republic of Kazakhstan for 2009, 2014, 2019. Source: Stat.gov.kz, 2021. Available online: https://stat.gov.kz/ (accessed on 26 May 2021).


Table 1.
The level of food insecurity among the population of the Republic of Kazakhstan (source: FAO, WHO, 2018; * and Bureau of National Statistics of the Agency for Strategic Planning and Reforms of the Republic of Kazakhstan **).
Table 1.
The level of food insecurity among the population of the Republic of Kazakhstan (source: FAO, WHO, 2018; * and Bureau of National Statistics of the Agency for Strategic Planning and Reforms of the Republic of Kazakhstan **).
| The Level of Food Insecurity in the Country | Population Prevalence, % | ||
|---|---|---|---|
| 2015–2017 | 2018 | 2019 | |
| Moderate and severe levels of food insecurity | 7.8 * | 4.2 ** | 5.3 ** |
| Severe food insecurity | 1.4 * | 1.7 ** | 1.9 ** |
Table 2.
The prevalence of undernourishment (PoU) in the Republic of Kazakhstan (source: Bureau of National Statistics of the Agency for Strategic Planning and Reforms of the Republic of Kazakhstan).
Table 2.
The prevalence of undernourishment (PoU) in the Republic of Kazakhstan (source: Bureau of National Statistics of the Agency for Strategic Planning and Reforms of the Republic of Kazakhstan).
| Population of the Republic of Kazakhstan | Prevalence of Malnutrition between 2011 and 2019, % | ||||||||
|---|---|---|---|---|---|---|---|---|---|
| 2011 | 2012 | 2013 | 2014 | 2015 | 2016 | 2017 | 2018 | 2019 | |
| total population | 3.0 | 1.8 | 1.2 | 1.3 | 3.1 | 4.5 | 3.6 | 4.6 | 4.1 |
| urban population | 3.0 | 2.8 | 1.8 | 1.8 | 3.2 | 4.6 | 3.5 | 4.5 | 4.1 |
| rural population | 3.0 | 0.9 | 0.8 | 0.8 | 2.5 | 3.7 | 3.0 | 3.7 | 3.1 |
Table 3.
Average self-sufficiency of the Republic of Kazakhstan in dairy products (2019) (source: Stat.gov.kz, 2021. Available online: https://stat.gov.kz/ (accessed on 26 May 2021).
Table 3.
Average self-sufficiency of the Republic of Kazakhstan in dairy products (2019) (source: Stat.gov.kz, 2021. Available online: https://stat.gov.kz/ (accessed on 26 May 2021).
| Milk Production in 2019, kg | Kazakh Population at the Beginning 2019 | Self-Sufficiency in Dairy Products, % | |
|---|---|---|---|
| The Republic of Kazakhstan | 5965.000 | 18,395.567 | 0.1 |
| Akmola | 397.906 | 738.587 | 0.2 |
| Aktobe | 3379.937 | 869.637 | 1.3 |
| Almaty | 7928.375 | 2038.934 | 1.3 |
| Atyrau | 636.027 | 633.791 | 0.3 |
| West Kazakhstan | 2368.101 | 652.325 | 1.2 |
| Zhambyl | 3236.227 | 1125.442 | 1.0 |
| Karaganda | 4901.993 | 1378.533 | 1.2 |
| Kostanay | 4203.878 | 872.795 | 1.6 |
| Kyzylorda | 939.131 | 794.334 | 0.4 |
| Mangystau | 124.802 | 678.199 | 0.1 |
| Pavlodar | 393.200 | 753.853 | 0.2 |
| North Kazakhstan | 565.600 | 554.517 | 0.3 |
| Turkestan | 730.200 | 1983.967 | 0.1 |
| East Kazakhstan | 954.300 | 1378.527 | 0.2 |
Table 4.
Average self-sufficiency of the Republic of Kazakhstan in meat products (2019) (source: Stat.gov.kz, 2021. Available online: https://stat.gov.kz/ (accessed on 26 May 2021).
Table 4.
Average self-sufficiency of the Republic of Kazakhstan in meat products (2019) (source: Stat.gov.kz, 2021. Available online: https://stat.gov.kz/ (accessed on 26 May 2021).
| Meat Production in 2019, kg | Kazakh Population at the Beginning 2019 | Self-Sufficiency in Meat Products, % | |
|---|---|---|---|
| The Republic of Kazakhstan | 1,695,338.000 | 18,395.567 | 136.9 |
| Akmola | 81,752.000 | 738.587 | 242.0 |
| Aktobe | 148,194.000 | 869.637 | 220.9 |
| Almaty | 278,133.000 | 2038.934 | 237.8 |
| Atyrau | 53,084.000 | 633.791 | 106.9 |
| West Kazakhstan | 86,182.000 | 652.325 | 189.5 |
| Zhambyl | 126,196.000 | 1125.442 | 151.1 |
| Karaganda | 133,354.000 | 1378.533 | 137.3 |
| Kostanay | 90,133.000 | 872.795 | 143.1 |
| Kyzylorda | 37,395.000 | 794.334 | 60.1 |
| Mangystau | 11,090.000 | 678.199 | 21.0 |
| Pavlodar | 93,572.000 | 753.853 | 158.3 |
| North Kazakhstan | 92,722.000 | 554.517 | 213.3 |
| Turkestan | 216,418.000 | 1983.967 | 139.1 |
| East Kazakhstan | 234,114.000 | 1378.527 | 216.6 |
| Nur-Sultan | 159.000 | 1078.384 | 0.2 |
| Almaty | 514.000 | 1854.656 | 0.4 |
| Shymkent | 12,321.000 | 1009.086 | 15.6 |
Table 5.
Livestock population growth between 2009 and 2019 (index 100 in 2009) (source: FAOstat, 2021. Available online: www.fao.org (accessed on 26 May 2021)).
Table 5.
Livestock population growth between 2009 and 2019 (index 100 in 2009) (source: FAOstat, 2021. Available online: www.fao.org (accessed on 26 May 2021)).
| Species | Number of Animal Species for 2009 | Number of Animal Species for 2019 | Index Change in 2019 |
|---|---|---|---|
| Buffalo | 194,135.166 | 204,342.419 | +5.3 |
| Cattle | 1,410,028.351 | 1,510,995.410 | +7.2 |
| Goat | 914,492.177 | 1,093,732.777 | +19.6 |
| Horse | 58,957.285 | 57,419.470 | −2.6 |
| Sheep | 1,101,150.948 | 1,237,608.071 | +12.4 |
| Camel | 28,999.683 | 37,509.691 | +29.4 |
Table 6.
Livestock population growth in the Republic of Kazakhstan between 2009 and 2019 (index 100 in 2009) (source: Stat.gov.kz, 2021 and FAOstat. Available online: https://stat.gov.kz/ (accessed on 26 May 2021) and www.fao.org (accessed on 26 May 2021).
Table 6.
Livestock population growth in the Republic of Kazakhstan between 2009 and 2019 (index 100 in 2009) (source: Stat.gov.kz, 2021 and FAOstat. Available online: https://stat.gov.kz/ (accessed on 26 May 2021) and www.fao.org (accessed on 26 May 2021).
| Species | Dynamics of Changes in the Number of Livestock in the Republic of Kazakhstan for the Last 5 and 10 Years, % | |||
|---|---|---|---|---|
| Stat.gov.kz | FAOstat | |||
| 2014 | 2019 | 2014 | 2019 | |
| Cattle | −2.3 | +24.1 | −2.3 | +19.3 |
| Camel | +8.5 | +45.9 | +8.5 | +39.9 |
| Horse | +30.2 | +108.1 | +30.2 | +93.1 |
| Sheep and goat | +4.7 | +14.2 | +4.7 | +11.5 |
Table 7.
Chemical composition of milk of different farm animals. (source: TR CU 033/2013 “On the safety of milk and dairy products”, * Russian Federation).
Table 7.
Chemical composition of milk of different farm animals. (source: TR CU 033/2013 “On the safety of milk and dairy products”, * Russian Federation).
| Milk Type | Dry Substances, %, Average * | Protein, %, Not Less Than * | Protein, % of Dry Substances, Not Less Than |
|---|---|---|---|
| Cow milk | 11.0 | 2.8 | 25.5 |
| Goat milk | 13.4 | 2.8 | 20.9 |
| Sheep milk | 18.5 | 5.1 | 27.6 |
| Mare milk | 10.7 | 2.2 | 20.6 |
| Camel milk | 15.0 | 3.8 | 25.3 |
Publisher’s Note: MDPI stays neutral with regard to jurisdictional claims in published maps and institutional affiliations. |
© 2021 by the authors. Licensee MDPI, Basel, Switzerland. This article is an open access article distributed under the terms and conditions of the Creative Commons Attribution (CC BY) license (https://creativecommons.org/licenses/by/4.0/).
Share and Cite
MDPI and ACS Style
Orazov, A.; Nadtochii, L.; Bozymov, K.; Muradova, M.; Zhumayeva, A. Role of Camel Husbandry in Food Security of the Republic of Kazakhstan. Agriculture 2021, 11, 614. https://0-doi-org.brum.beds.ac.uk/10.3390/agriculture11070614
AMA Style
Orazov A, Nadtochii L, Bozymov K, Muradova M, Zhumayeva A. Role of Camel Husbandry in Food Security of the Republic of Kazakhstan. Agriculture. 2021; 11(7):614. https://0-doi-org.brum.beds.ac.uk/10.3390/agriculture11070614
Chicago/Turabian StyleOrazov, Ayan, Liudmila Nadtochii, Kazybay Bozymov, Mariam Muradova, and Araigul Zhumayeva. 2021. "Role of Camel Husbandry in Food Security of the Republic of Kazakhstan" Agriculture 11, no. 7: 614. https://0-doi-org.brum.beds.ac.uk/10.3390/agriculture11070614
Note that from the first issue of 2016, this journal uses article numbers instead of page numbers. See further details here.