Article

Multi-Allelic Haplotype-Based Association Analysis Identifies Genomic Regions Controlling Domestication Traits in Intermediate Wheatgrass

Department of Agronomy and Plant Genetics, University of Minnesota, St. Paul, MN 55108, USA
*
Authors to whom correspondence should be addressed.
Submission received: 27 May 2021 / Revised: 9 July 2021 / Accepted: 12 July 2021 / Published: 15 July 2021

Abstract

:
Intermediate wheatgrass (IWG) is a perennial forage grass undergoing a rigorous domestication as a grain crop. As a young grain crop, several agronomic and domestication traits need improvement for IWG to be relevant in current agricultural landscapes. This study genetically maps six domestication traits in the fourth cycle IWG breeding population at the University of Minnesota: height, seed length, seed width, shattering, threshability, and seed mass. A weak population structure was observed and linkage disequilibrium (r2) declined rapidly: 0.23 mega base pairs at conventional r2 value of 0.2. Broad-sense heritabilities were overall high and ranged from 0.71–0.92. Association analysis was carried out using 25,909 single SNP markers and 5379 haplotype blocks. Thirty-one SNP markers and 17 haplotype blocks were significantly associated with the domestication traits. These associations were of moderate effect as they explained 4–6% of the observed phenotypic variation. Ten SNP markers were also detected by the haplotype association analysis. One SNP marker on Chromosome 8, also discovered in haplotype block analysis, was common between seed length and seed mass. Increasing the frequency of favorable alleles in IWG populations via marker-assisted selection and genomic selection is an effective approach to improve IWG’s domestication traits.

1. Introduction

Intermediate wheatgrass [IWG, Thinopyrum intermedium (Host) Barkworth & D.R. Dewey subsp. intermedium, 2n = 6x = 42] is a perennial forage grass species currently under domestication as a new grain crop [1]. In addition to its grain’s use as human food [2], IWG offers remarkable ecosystem services such as reduction in soil erosion, surface nutrient runoff, nutrient leaching to groundwater, and increased carbon sequestration [3,4,5]. A close relative of wheat (both belong to the Triticeae tribe), IWG was introduced into the United States from the Maikop region of Russia in 1932 [6]. The crop was recently adopted by multiple breeding programs in an attempt to domesticate it as a food crop.
The University of Minnesota (UMN) started its IWG domestication program in 2011 from 2,560 individuals that were derived 66 mother plants of the third recurrent selection cycle at The Land Institute in Salina, KS, USA [7]. The main goals of the breeding program are to improve grain yield and yield component traits, domestication traits such as seed shatter, free threshing grain, and seed size as well as other agronomic characteristics such as height, resistance to lodging, uniform flowering and maturity, and disease resistance. Between 2011 and 2020, the UMN IWG breeding program has completed four selection cycles and extensive progress has been made in improving these traits. This progress throughout the years enabled the breeding program to release the first synthetic IWG cultivar for grain production, MN-Clearwater, in 2019 [8].
Despite the progress made in improving IWG germplasm, IWG is still in the early stages of domestication. Several key traits need major improvement to help improve the crop’s agronomic performance. A set of traits, commonly known as the “domestication syndrome”, distinguishes most food crops from their wild progenitors as they essentially inspired humans to adopt plant cultivation [9,10]. Examples of domestication traits include larger seed size (mass and dimensions), reduced seed shattering, better grain threshing, i.e. de-hulled state, and short plant height. Intermediate wheatgrass was selected out of 100 other perennial grain species because of its easily threshed seeds, relatively large seeds, and resistance to shatter [1]. Yet, after nearly four decades of selection, further improvement of these traits is still needed to ensure the crop’s success in the future.
One approach to improve traits of interest is by recurrent phenotypic selection. This was the primary method of IWG germplasm improvement until the mid-2010s when Zhang et al. [7] optimized a genomic selection-based breeding approach in IWG. Vital to the success of genomic as well as marker-based selection methods is the availability of genome-wide markers that provide adequate coverage of loci controlling the traits of interest [11]. Discovery of markers in strong linkage with trait loci can assist in marker-assisted selection of suitable genotypes as well as in discovery of candidate genes [12]. Such marker-trait associations (MTAs) are generally uncovered by association mapping studies or genome-wide association studies that evaluate large populations for traits of interest and regress the trait data on marker information to identify the MTAs. As the significance of MTAs can confound with allelic frequency due to population structure, it is important to correct for existing population structures to avoid false associations [13]. In recent years, association studies have increasingly used mixed models with genetic relationships as cofactors to correct for population structure to lower the number of false signals [14]. When paired with high-throughput marker systems, association studies report higher levels of marker polymorphism and allelic variation, thus aiding the discovery of useful, novel alleles associated with the traits [15,16].
Single nucleotide polymorphism (SNP) markers are the widely preferred high-throughput marker system for genomic studies including gene mapping approaches. They are abundant in most genomes, offer better discriminatory power relative to other marker types, and are easily converted to molecular markers for wet-lab assays [17]. SNP markers discovered via partial or whole-genome sequencing also enable the discovery of population-specific SNPs free of ascertainment bias at a low cost per data point [18,19,20]. In most methods of association analysis, SNP markers are independently tested for their association with the trait, but this can be problematic for complex traits controlled by several genomic loci [21,22]. In addition, a single-SNP model might not be able to capture the true allelic diversity given their usual bi-allelic nature [23]. Testing multiple SNP markers, either with a multi-locus model that simultaneously evaluates adjacent markers or with haplotype blocks where tightly linked markers are converted to a single multi-locus haplotype block, is proposed to better represent the genetic architecture of complex traits [24,25].
This research study was therefore carried out with the following objectives: (i) discover genome-wide markers and describe the haplotype distribution in the fourth cycle IWG breeding population at the University of Minnesota; (ii) evaluate trait relationships and heritabilities, linkage disequilibrium, and population structure; and (iii) use single SNPs and multi-allelic haplotypes to characterize genomic regions controlling six important domestication traits: plant height, seed length, seed width, shattering, and threshability.

2. Materials and Methods

2.1. Plant Population

The population used for association analysis in this study is the fourth recurrent selection cycle (C4) at the University of Minnesota (UMN_C4 hereafter). This population was obtained by crossing 73 cycle 3 (UMN_C3) IWG genets selected based on their superior genomic estimated breeding values (GEBVs) obtained from genomic selection models trained on the UMN_C3 field data collected during 2017–2019. A genet is defined as a genetically unique organism and refers to individual plants in an outcrossing species such as IWG [7]. These 73 parental genets were selected mainly for larger seed size, better threshability, and reduced seed shattering, while strong selection pressure was also placed on higher grain yield and reduced plant height. The parental genets were vernalized at 4 °C for 8 weeks during November-December 2017 and intercrossed in a greenhouse during January-March 2018. From each mother plant, nine random seeds were germinated in June 2018, cloned into two replicates in August 2018, and transplanted in the field in September 2018 at two MN locations: Crookston and St. Paul. Transplanted clones were planted approximately 0.91 m (3 ft) apart and IWG border plants surrounded the plots on all sides. In both cropping years (2019, 2020), 45 kg ha−1 of N was applied in April in St. Paul and in May in Crookston. Weed control in the plots was done with mechanical cultivation and manual labor. The herbicide Dual II Magnum (S-Metolachlor 82.4%, Syngenta) was applied in April of both years at a rate of 1.2 L ha−1. After harvesting the grain, plants were mowed to 15–20 cm. In the final association analysis, 637 genets were used after discarding genets that were lost due to plant death or poor genotypic data.

2.2. Genotyping

DNA was extracted from 10–15 cm long leaf tissue using the BioSprint 96 DNA Plant Kit (QIAGEN, Valencia, CA). Extracted DNA was quantified using picogreen, normalized to 10 ng/µL, and digested with the enzymes PstI and MspI. Samples were pooled at 192-plex to form sequencing libraries that were sequenced on Illumina’s Novaseq 600. Generated read sequences were passed through a quality filter of Q > 30 and de-multiplexed to obtain reads for each genet. Reads were aligned to the IWG reference genome v2.1 [26] using ‘bwa mem’ [27], and SNP-calling was done with ‘samtools mpileup’ and ‘bcftools’ [28]. SNPs with minor allele frequency (MAF) of less than 3% and more than 20% missing data were removed which resulted in 25,909 high quality SNPs. This SNP-set was imputed in Tassel version 5.2.71 [29] with the LD-kNNi method [30] using 30 nearest neighbors. To estimate imputation accuracy, known genotypes of 20% alleles in the input file were masked before imputation then compared with allelic predictions of the masked genotypes. Forced-imputation was not carried out if the missing genotype of a locus could not be resolved.

2.3. Phenotyping and Statistical Analysis

The UMN_C4 IWG population was evaluated at Crookston, MN and St. Paul, MN in 2019 and 2020 for multiple agronomic and domestication traits, of which we focus our association analysis on six important domestication traits: (1) plant height, (2) seed length, (3) seed width, (4) shattering, (5) free grain threshing (threshability hereafter), and (6) seed mass measured in terms of thousand kernel weight (TKW). To measure these traits, 10 mature spikes were harvested per plant and dried at 32 °C for 72 h. Plant height was measured 1–7 d before harvest by measuring the length from base (ground) to the tallest inflorescence. Shattering was measured as the percentage of seed, spikelets, and occasionally a portion of the spike itself that broke off from the spike. It was measured on a 0–9 scale where 0 is no shattering observed and 9 is 90% or more shattering. Spikes were threshed using a Wintersteiger LD 350 (Wintersteiger Inc, Salt Lake City, UT, USA), and threshability was measured on a 0–9 scale where 0 was assigned to completely hulled grain and 9 for 90% or more de-hulled (naked) grain. Approximately 100–300 de-hulled grain of each genet were scanned using a Marvin seed analyzer (MARViTECH GmbH, Wittenburg, Germany) to obtain seed dimensions. The same imaged seeds were weighed to obtain TKW.
A mixed model in the R package ‘lme4’ was used to correct the trait data for trial effect (i.e., environmental variability) and obtain the best linear unbiased estimate (BLUE) for each genet. Specifically, BLUEs were obtained by removing the fixed effect estimate for each environment from the trait value for each genet in that environment. Broad-sense heritability (H) of each trait was calculated on a genet-mean basis using the following formula:
H = σg2/(σg2 + σgl2/l + σgy2/y + σe2/ly),
where σg2 is the genetic variance, σgl2 is the genotype x location variance, σgy2 is the genotype x year variance, σe2 is the residual variance, l is the number of locations, and y is the number of years.

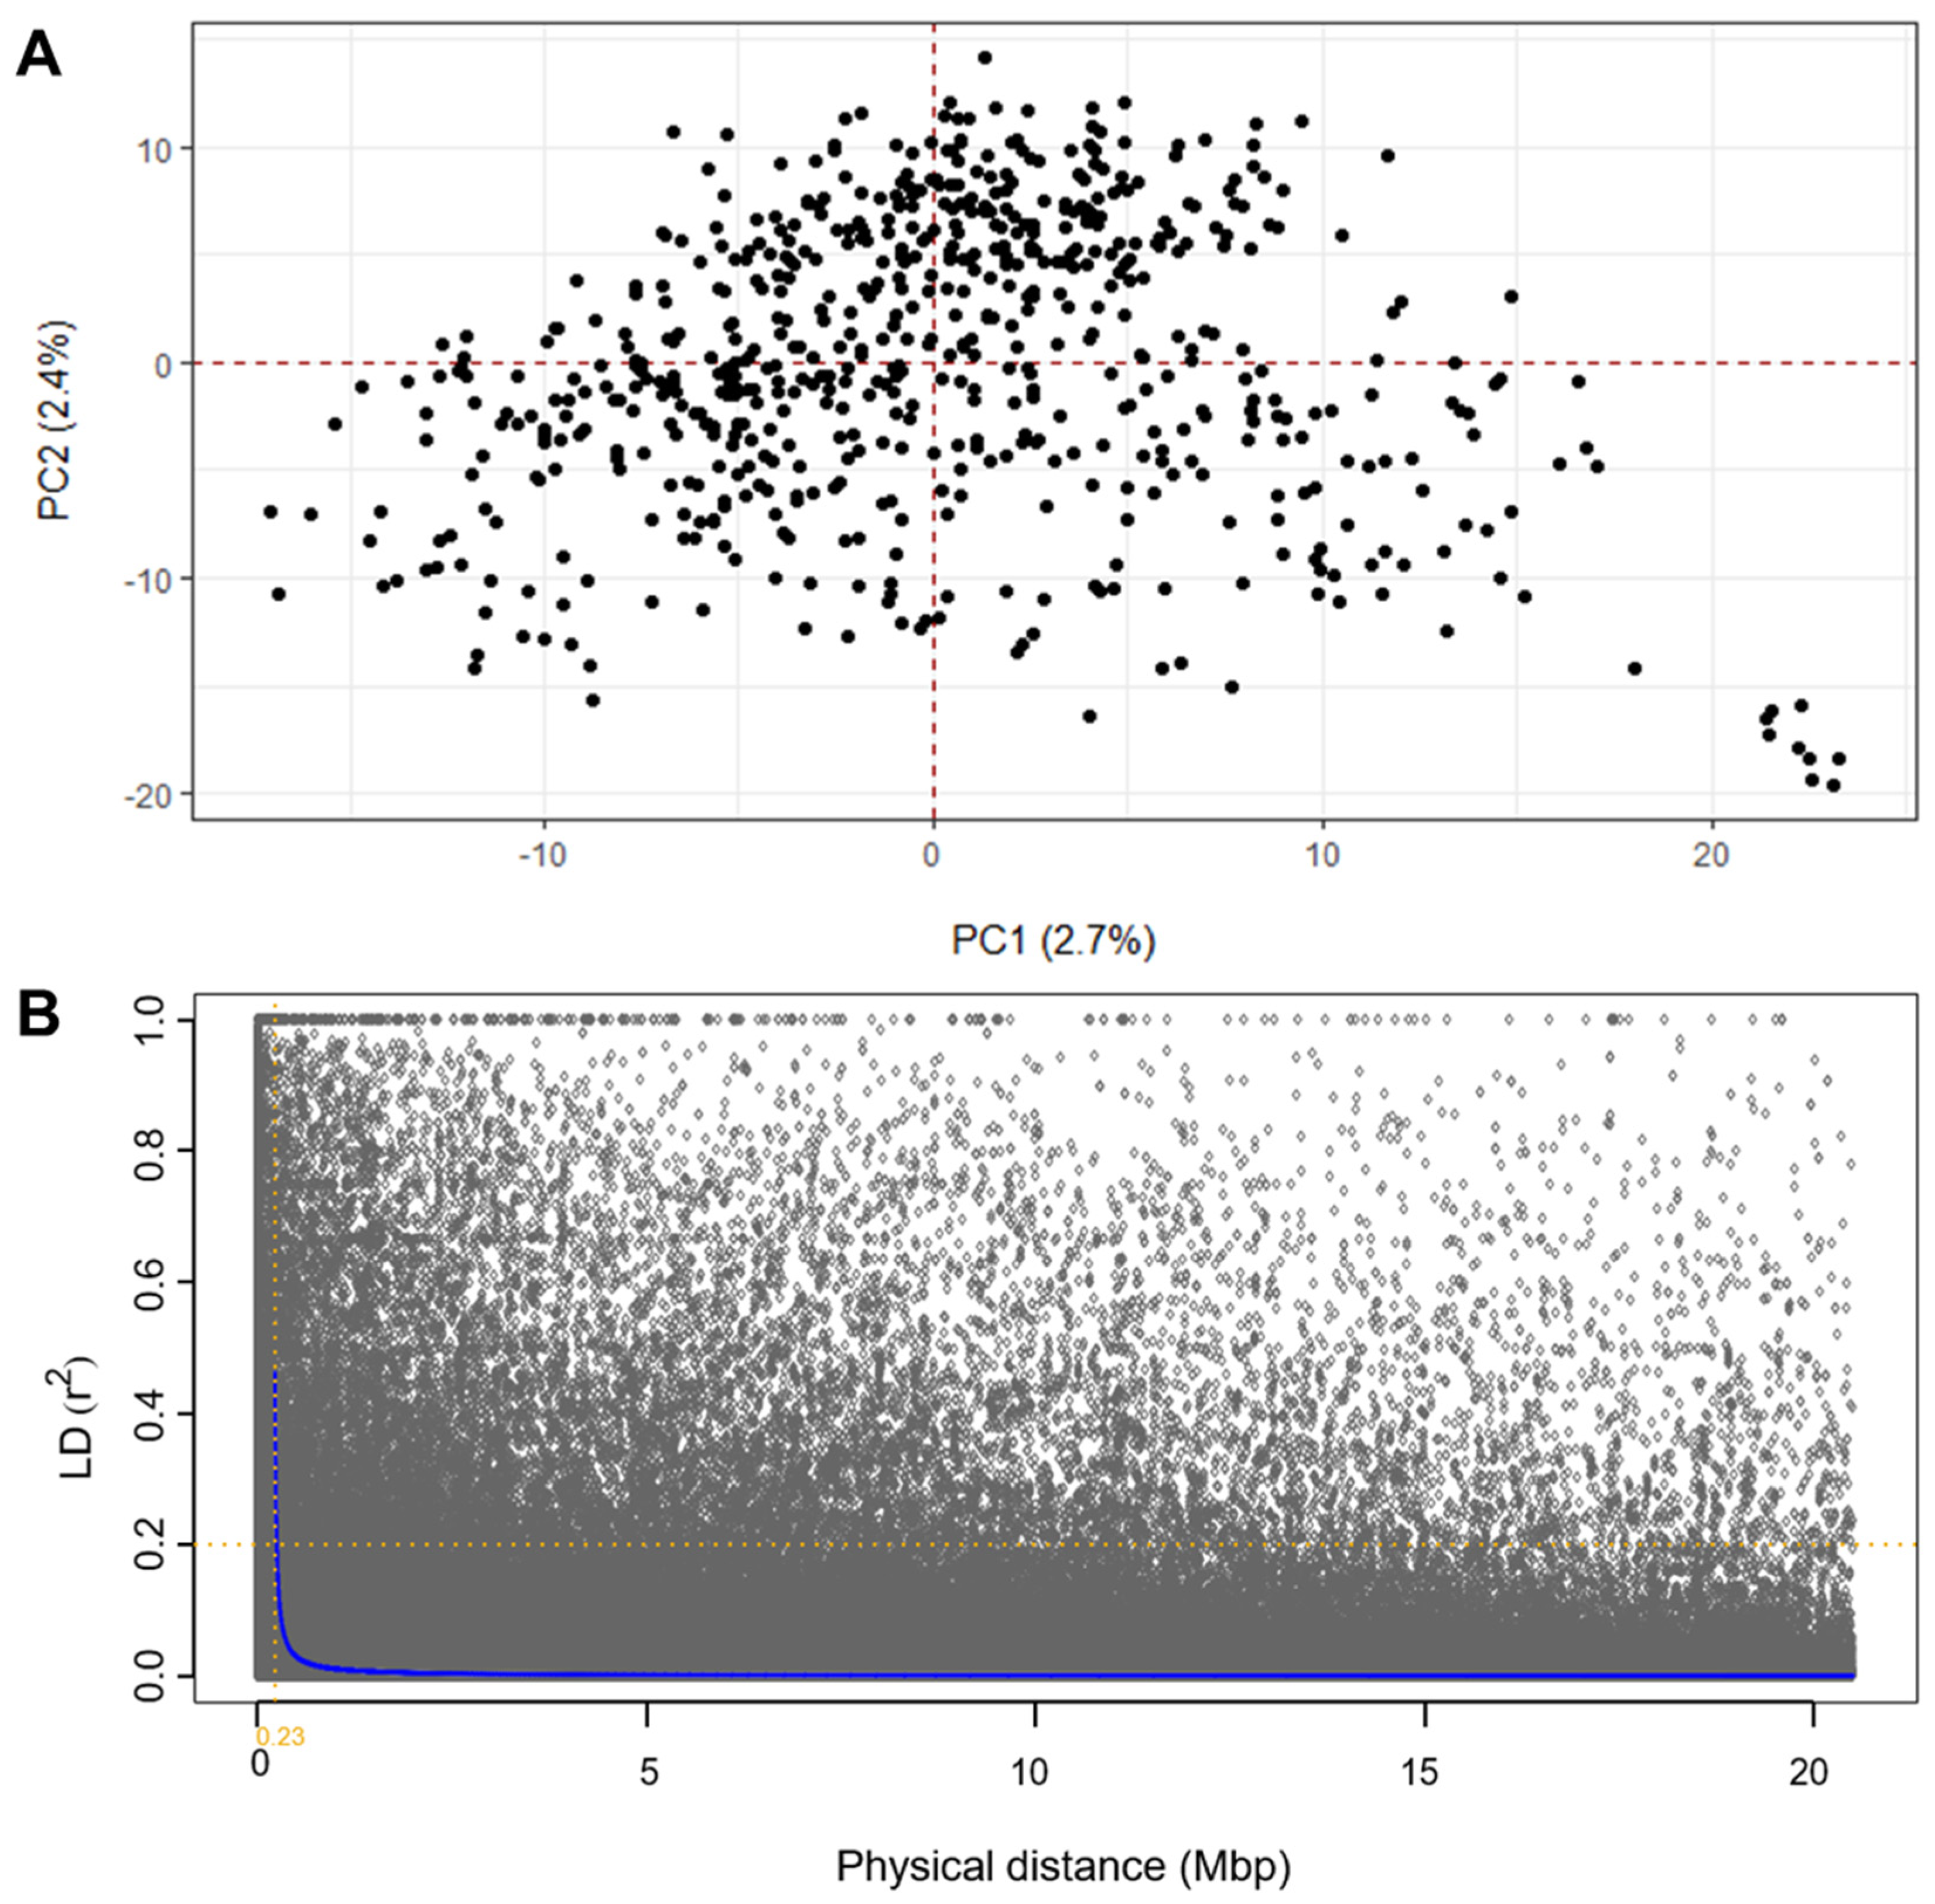
2.4. Linkage Disequilibrium and Population Relatedness

Pairwise linkage disequilibrium (LD) among the markers was calculated in Tassel 5.2.71 with a sliding window of 50 markers. Obtained LD (r2) values were plotted against the physical distance obtained from IWG v2.1 reference genome and a locally weighted polynomial regression (LOWESS) curve was fitted to display the LD decay. Decay distance of LD was estimated using the method of Hill and Weir [31], and assessed at the conventionally accepted r2 value of 0.2 [32]. Genetic relatedness among the genets was estimated in Tassel 5.2.71 using the Centered_IBS method with default parameters. Population structure was analyzed using principal component (PC) analysis with the function prcomp in R.

2.5. Haplotype Construction

Haplotype blocks were constructed for each chromosome separately using HAPLOVIEW 4.2 [33]. Block construction was done based on the confidence interval algorithm of Gabriel et al. [34] that considers LD (D’) among the markers or loci within and outside a proposed block. SNP markers were considered to be in strong LD if the lower boundary confidence interval of D’ was ≥0.80 and the upper boundary was ≥0.98. Haplotype blocks were converted into multi-allelic markers by considering allelic combinations within each block as independent alleles. Thus, haplotype blocks were numbered in ascending order (1,2,3… n) if a block was not observed before [35]. Singletons, i.e., haplotypes defined by a single SNP, were not used in the association analysis that used multi-allelic haplotype markers.

2.6. Association Analysis

Association analysis was carried out using the trait BLUEs, as described above. Single SNP analysis was done using the ‘FarmCPU’ model in the R package ‘GAPIT’ [36,37]. FarmCPU is a multi-locus mixed linear model and is known to control false positive and false negative associations. Association analysis using multi-allelic haplotype data was done in Tassel 3 with the mixed linear model [29]. Because of a weak population structure, PC values were not included in the model for association analyses. In both association analyses, significant quantitative trait loci (QTL) were declared at default Bonferroni thresholds at α = 0.05, i.e.,
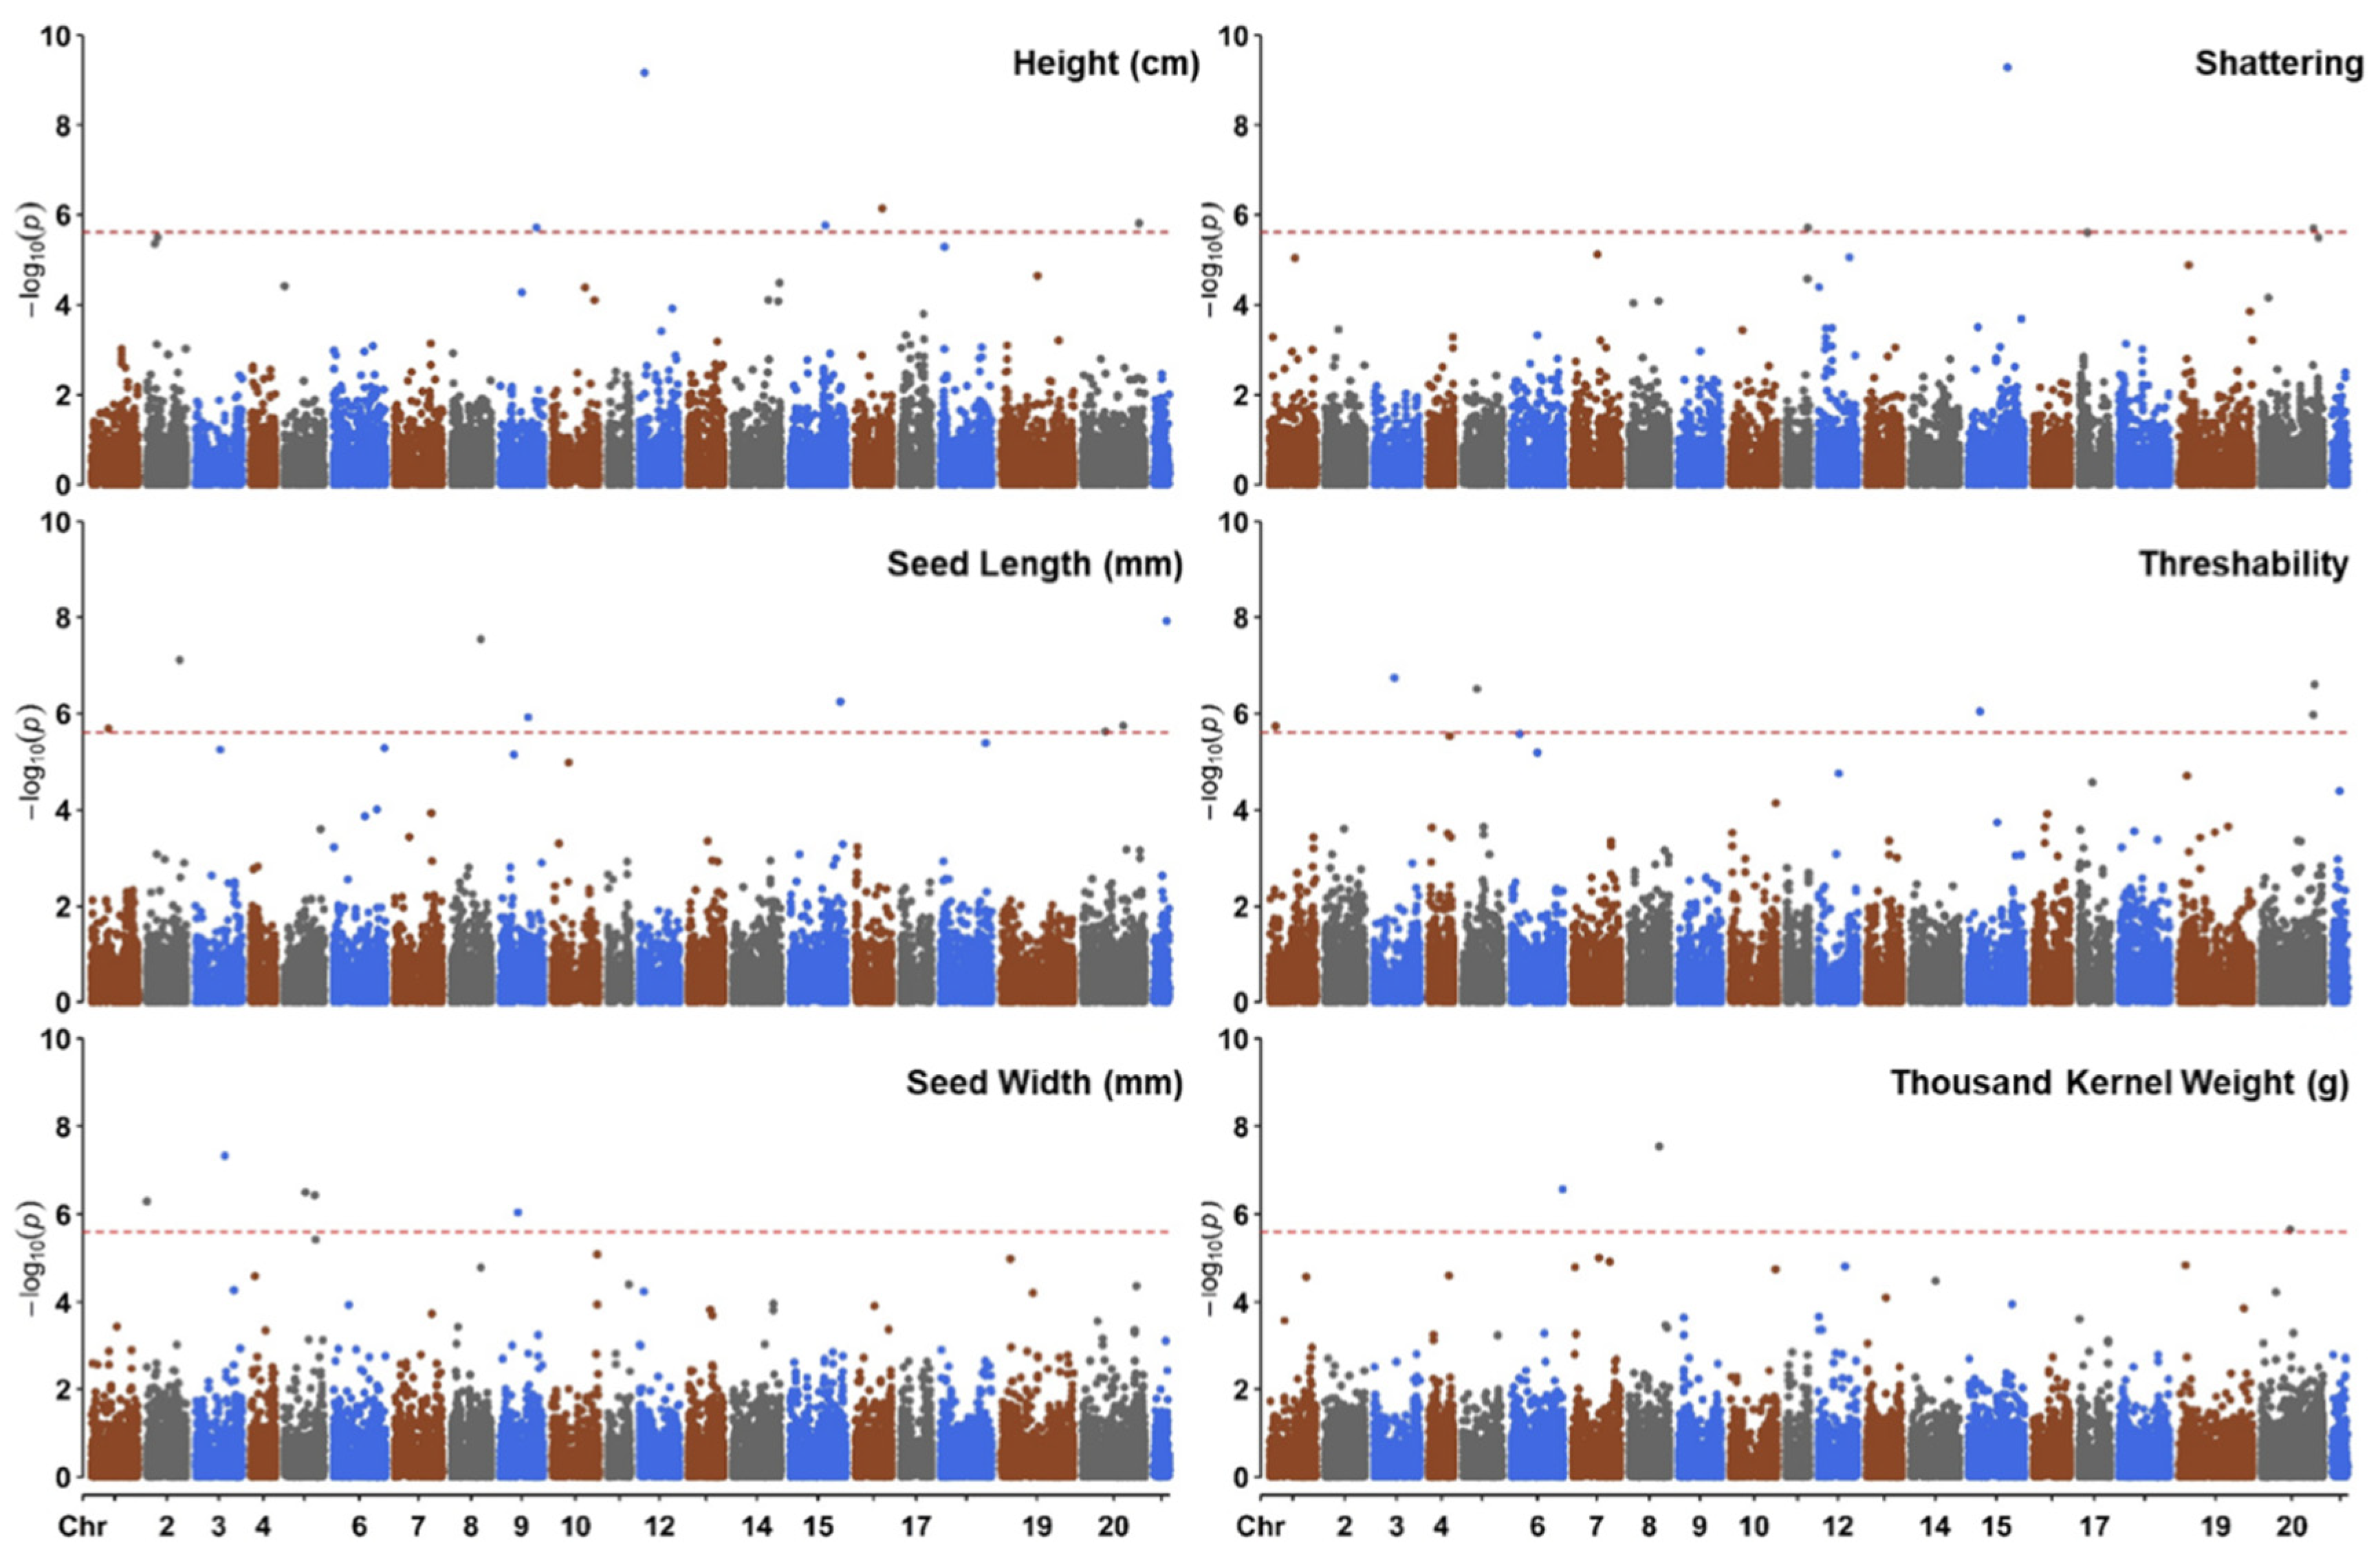
  • For single SNP markers: at α/no. of observations = 0.05/25909 = p value of 1.93 × 10−06 or LOD equivalent of 5.71, and
  • For multi-allelic haplotype blocks: at α/no. of observations = 0.05/5379 = p value of 9.30 × 10−06 or LOD equivalent of 5.03
In both analyses, the percentage of phenotypic variation explained by the significant markers (R2) were estimated following the method of Sen and Churchill [38] as implemented in the R package ‘qtl’ [39]. Favorable alleles in this study are defined as alleles that contribute towards the improvement of trait values for seed length, seed width, threshability, and thousand kernel weight (TKW) and that reduce trait values of plant height and shattering.

3. Results

3.1. Genotyping and Population Properties

Allele calling using the IWG reference genome v2.1 resulted in discovery of 4,782,922 genome-wide SNP markers in the UMN_C4 population. After discarding SNP markers with minor allele frequency lower than 3%, 1,820,973 remained, which subsequently reduced to 25,909 after removing markers with missing allele proportion of >20%. The average marker distribution per chromosome was 1234 and ranged from 588 (Chromosome 21) to 2177 (Chromosome 20). Missing allelic information was imputed using the LD-kNNi method in Tassel using 30 nearest SNPs. Imputation accuracy on this set of 25,909 SNPs was 94.7%. The imputation step also lowered the highest missing allele proportion from 20% to 3.1%. The overall population heterozygosity was 34%.
A weak population structure was observed among the genets in UMN_C4 as the first two principal component (PC) axes explained 5.1% of the total genetic variation (Figure 1A); the first 10 PC axes explained <16% of the total genetic variation. Mean genome-wide LD (r2) value was 0.05 and ranged from 0.04 (Chromosome 21) to 0.06 (Chromosome 11). The physical distance at which LD reduced to half its value at conventional r2 = 0.20 was found to be 0.23 mega base pairs (Mbp) (Figure 1B).

3.2. Haplotype Distribution

Haplotype construction using HAPLOVIEW resulted in the placement of 14,951 (58%) out of 25,909 SNP markers in 5379 haplotype blocks (Table 1). On average, each chromosome housed 256 haplotype blocks with the least number of blocks (127) on Chromosome 21 and the highest number of blocks (453) on Chromosome 20. The average number of unique haplotype blocks per chromosome was 8. Most haplotype blocks were formed with 2 SNP markers (58%) followed by 3 (23%). The maximum number of SNP markers in the blocks was 11 (<0.5%). Haplotypes were converted to multi-allelic markers by considering allelic combinations within each block as independent alleles. The number of alleles (i.e., nucleotide base calls) in these multi-allelic markers ranged between two and 68 per block, with an average of 11 alleles (median = 7). The most frequent haplotype block consisted of seven allelic combinations (10%), followed by four and six (both at 9% frequency).

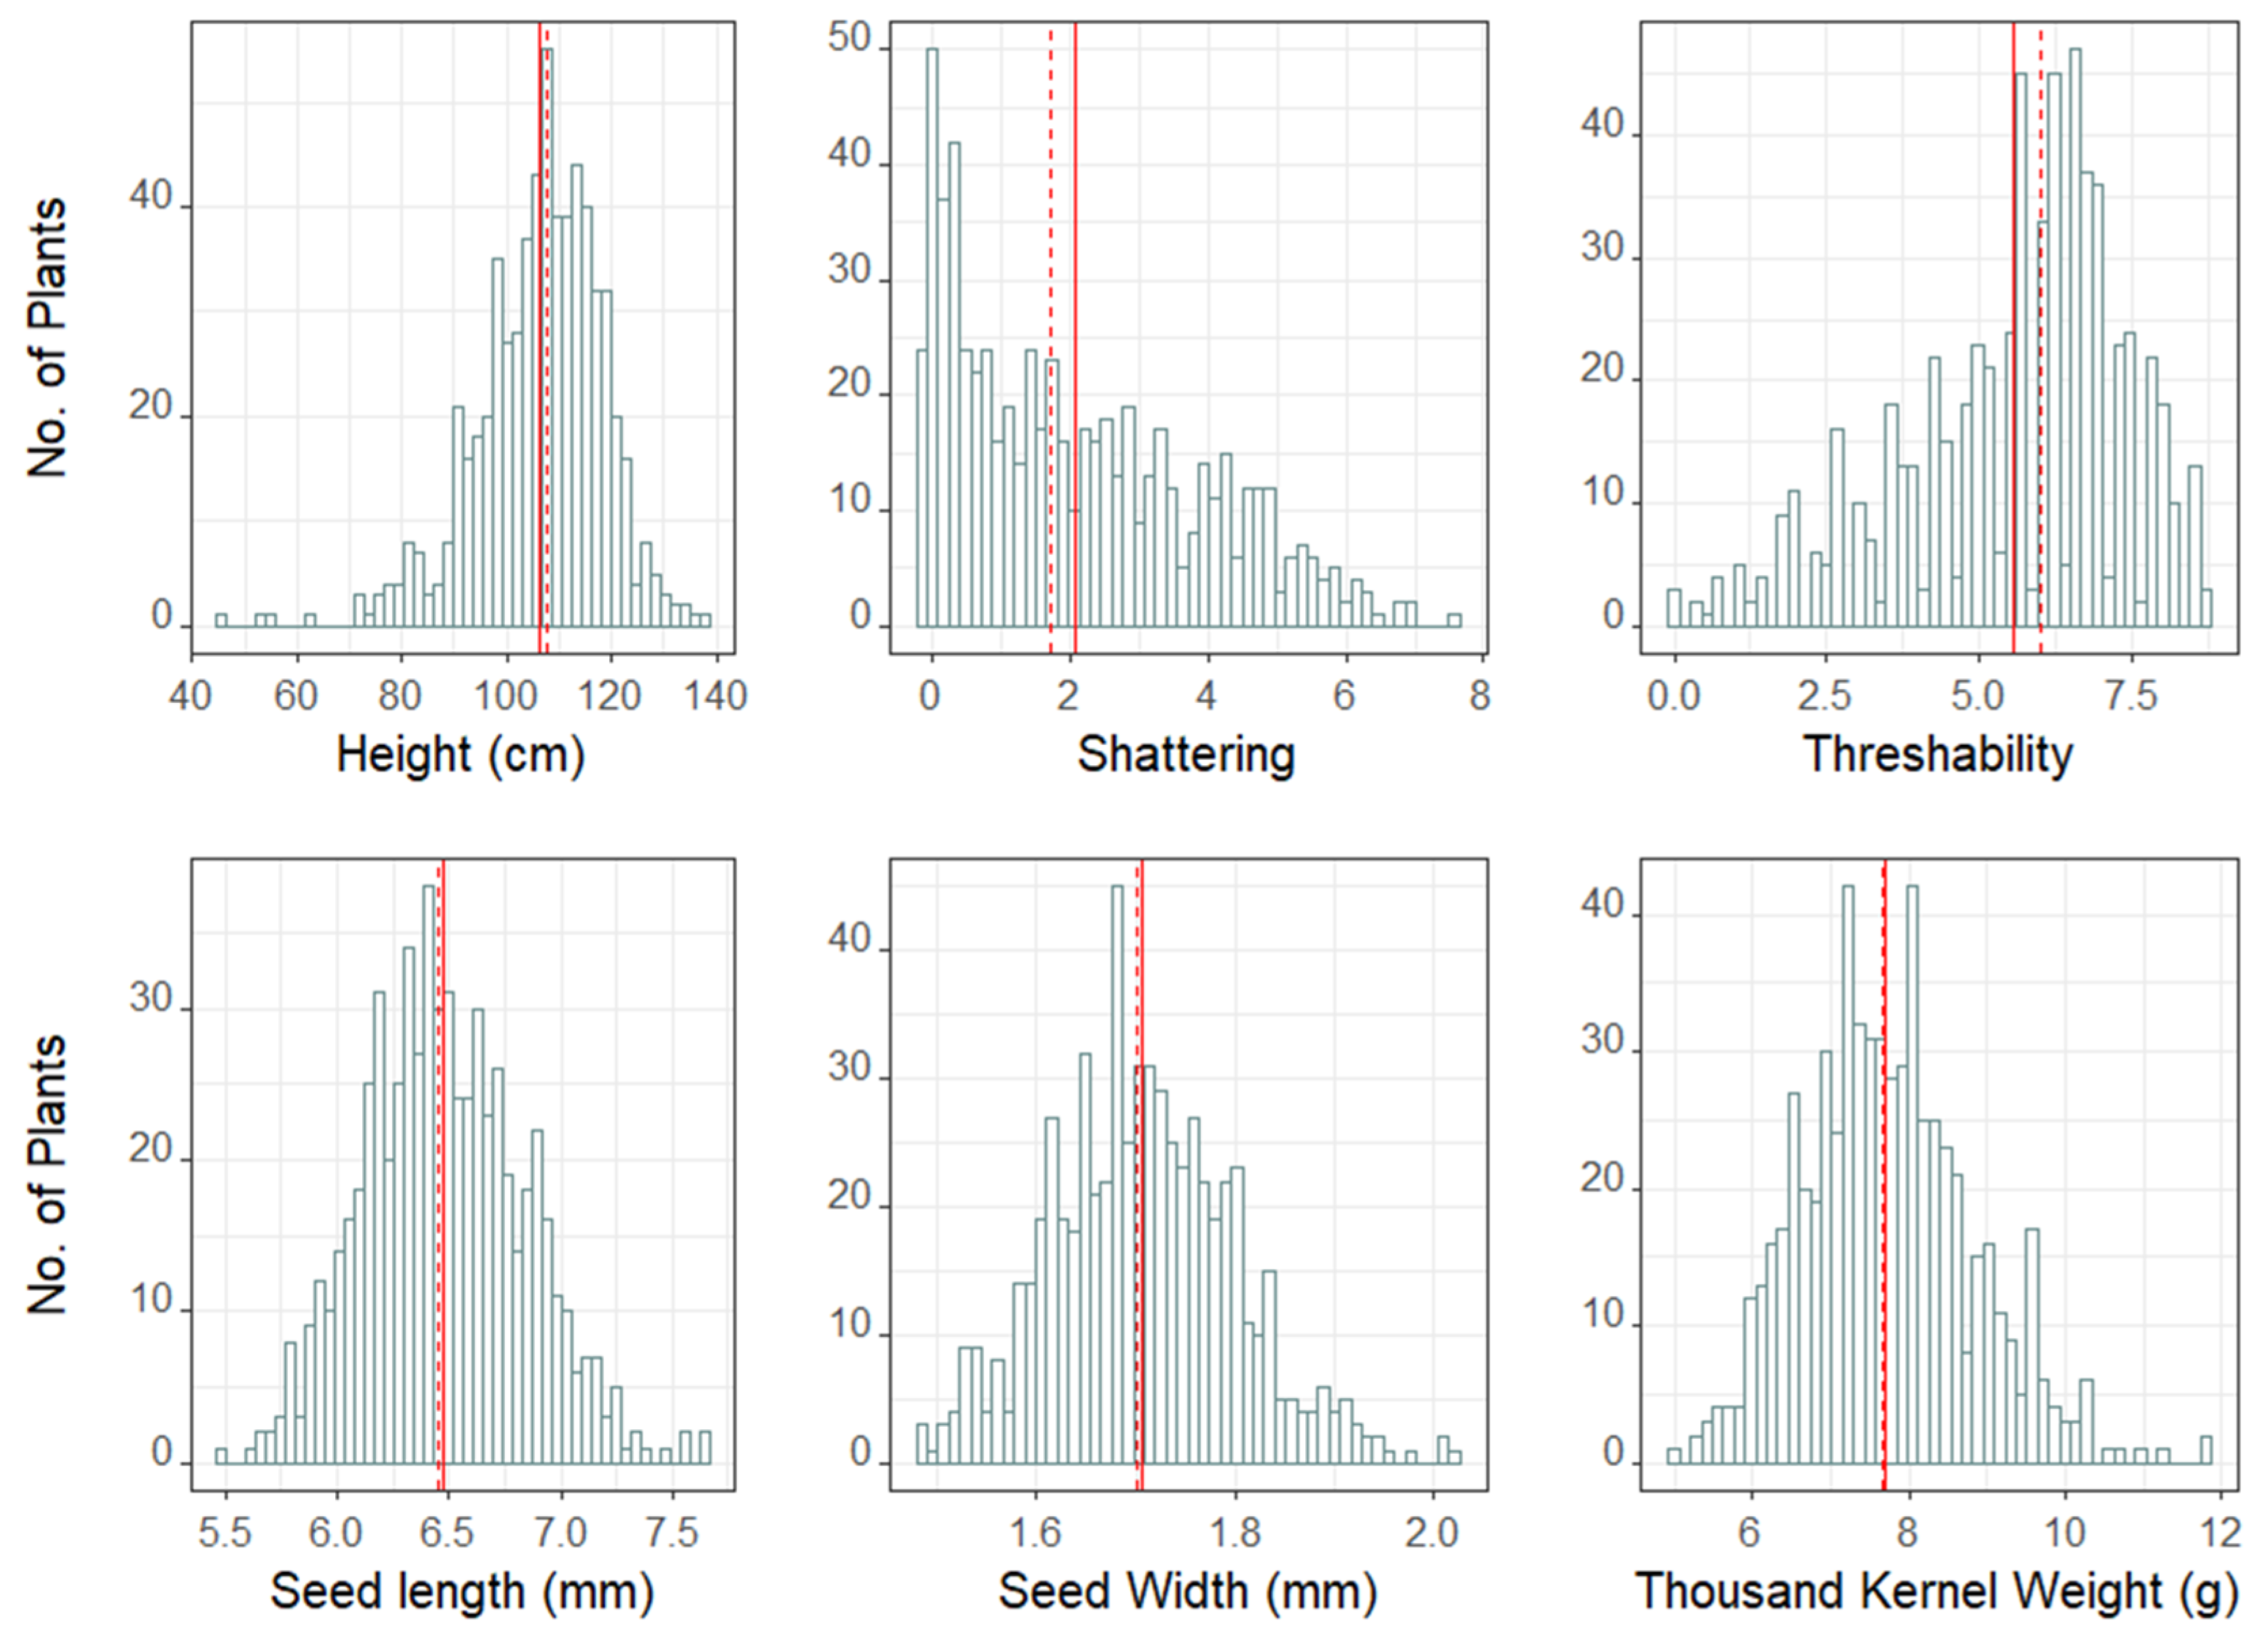
3.3. Trait Distribution, Correlation, Heritability

A broad range of phenotypic variation was observed in the UMN_C4 IWG population for the traits plant height, shattering, threshability, seed length, seed width, and seed mass (measured as thousand kernel weight, TKW) (Figure 2). The mean plant height was 132 cm with the shortest plant measuring 64 cm and the tallest plant measuring 162 cm. The average shattering score was 3, with a majority of the population, i.e., 431 genets (68%) exhibiting high resistance to seed shatter (≤30% shatter). The average threshability score was 6, and a majority of the population, i.e., 407 genets (64%), had a high proportion of de-hulled grain (≥60% de-hulled). The shortest seed length and seed width were 5.2 mm and 1.5 mm, respectively; the longest seed length and seed width were 7.5 mm and 2.0 mm, respectively. Population means for seed length and seed width were 6.2 mm and 1.7 mm, respectively. The smallest seed mass (TKW) was 5.7 g and the largest was 12.3 g with an average of 8.3 g.
Pairwise trait correlations varied by trait pairs (Table 2). The strongest positive correlation was observed between seed length and TKW with the coefficient of correlation, r = 0.67 followed by seed width and TKW (r = 0.66) and shattering and seed width (r = 0.34). The strongest negative correlation was observed between seed width and threshability (r = −0.42), followed by shattering and threshability (r = −0.37). Threshability was negatively correlated with all other domestication traits. Plant height was moderately, yet significantly, correlated with seed length (r = 0.20), seed width (r = 0.11), and TKW (r = 0.20).
Overall, high estimates of broad sense heritability (H) were obtained for all traits (Table S1). The highest H was observed for seed length (0.92), and the lowest was for shattering (0.71). The estimate of H was 0.73 for plant height, and 0.79 for both threshability and TKW.

3.4. Association Analysis

Association analysis using the FarmCPU method with single SNP markers resulted in detection of 31 significant marker-trait associations (MTAs) in 14 chromosomes (Table 3, Figure 3 and Figure S2). The greatest number of MTAs were detected in Chromosome 20 (7). Five MTAs were discovered for plant height and explained a total of 23% of observed phenotypic variation. Two of the five MTAs contributed favorable alleles, i.e., they conditioned for shorter plant height with the largest favorable allele contributed by the marker S20_613713856. Seed length had the most MTAs identified, with eight, and were distributed in seven chromosomes; these eight MTAs explained a combined phenotypic variation of 36.6%, and three contributed favorable alleles. Five MTAs were discovered for seed width on four chromosomes (2, 3, 5, 9) that explained 23% of the phenotypic variation and alleles of three of the five significant markers had positive phenotypic effect. Four MTAs were discovered for shattering in four chromosomes that explained a total of 18.6% of the phenotypic variation. Alleles from all but one SNP marker were favorable and contributed towards reduction in seed shatter. Six MTAs were discovered for threshability in five chromosomes that explained a total of 26.6% of the phenotypic variation. Of the six MTAs for threshability, alleles of four SNP markers contributed toward better threshability and two against. Seed mass (TKW) had the least number of MTAs identified at three in three chromosomes that explained 14% of the total observed phenotypic variation in the UMN_C4 population. Only one out of the three significant SNP markers had a favorable allele. MAF for all observed MTAs ranged from 7.2% to 44.4%. No large-effect QTL were observed as all MTAs accounted for phenotypic variation in the range of 4.0–6.5%. The SNP marker S08_323540788 on chromosome 8 was a common MTA between seed length and TKW; no other common markers were observed among the remaining traits. The average minor allele frequency (MAF) of all significant loci was 0.22
Association analysis using the haplotype blocks resulted in detection of 17 significant haplotype-trait associations (HTAs) in 11 chromosomes (Table 4). Chromosome 8 had the highest frequency (3) of HTAs. Six HTAs were discovered for plant height that explained a total of 26.4% of observed phenotypic variation; three of which were favorable. Three HTAs were discovered for threshability that explained a total of 17.4% of phenotypic variation; two of the three HTAs had favorable alleles, i.e., they contributed towards improved threshability. Seed length, seed width, shattering, and seed mass (TKW) each had two HTAs detected and explained a combined phenotypic variation of 11%, 11.7%, 11.9%, and 11.1%, respectively. One of the two HTAs for seed length and seed width had favorable alleles, whereas both significant alleles within HTAs for TKW were unfavorable and contributed towards smaller seed mass. No large-effect loci were detected as all HTAs accounted for phenotypic variation in the range of 4–5%. The haplotype block Chr08-Hb.228 was common between seed length and TKW; no other common blocks were observed among the remaining traits.

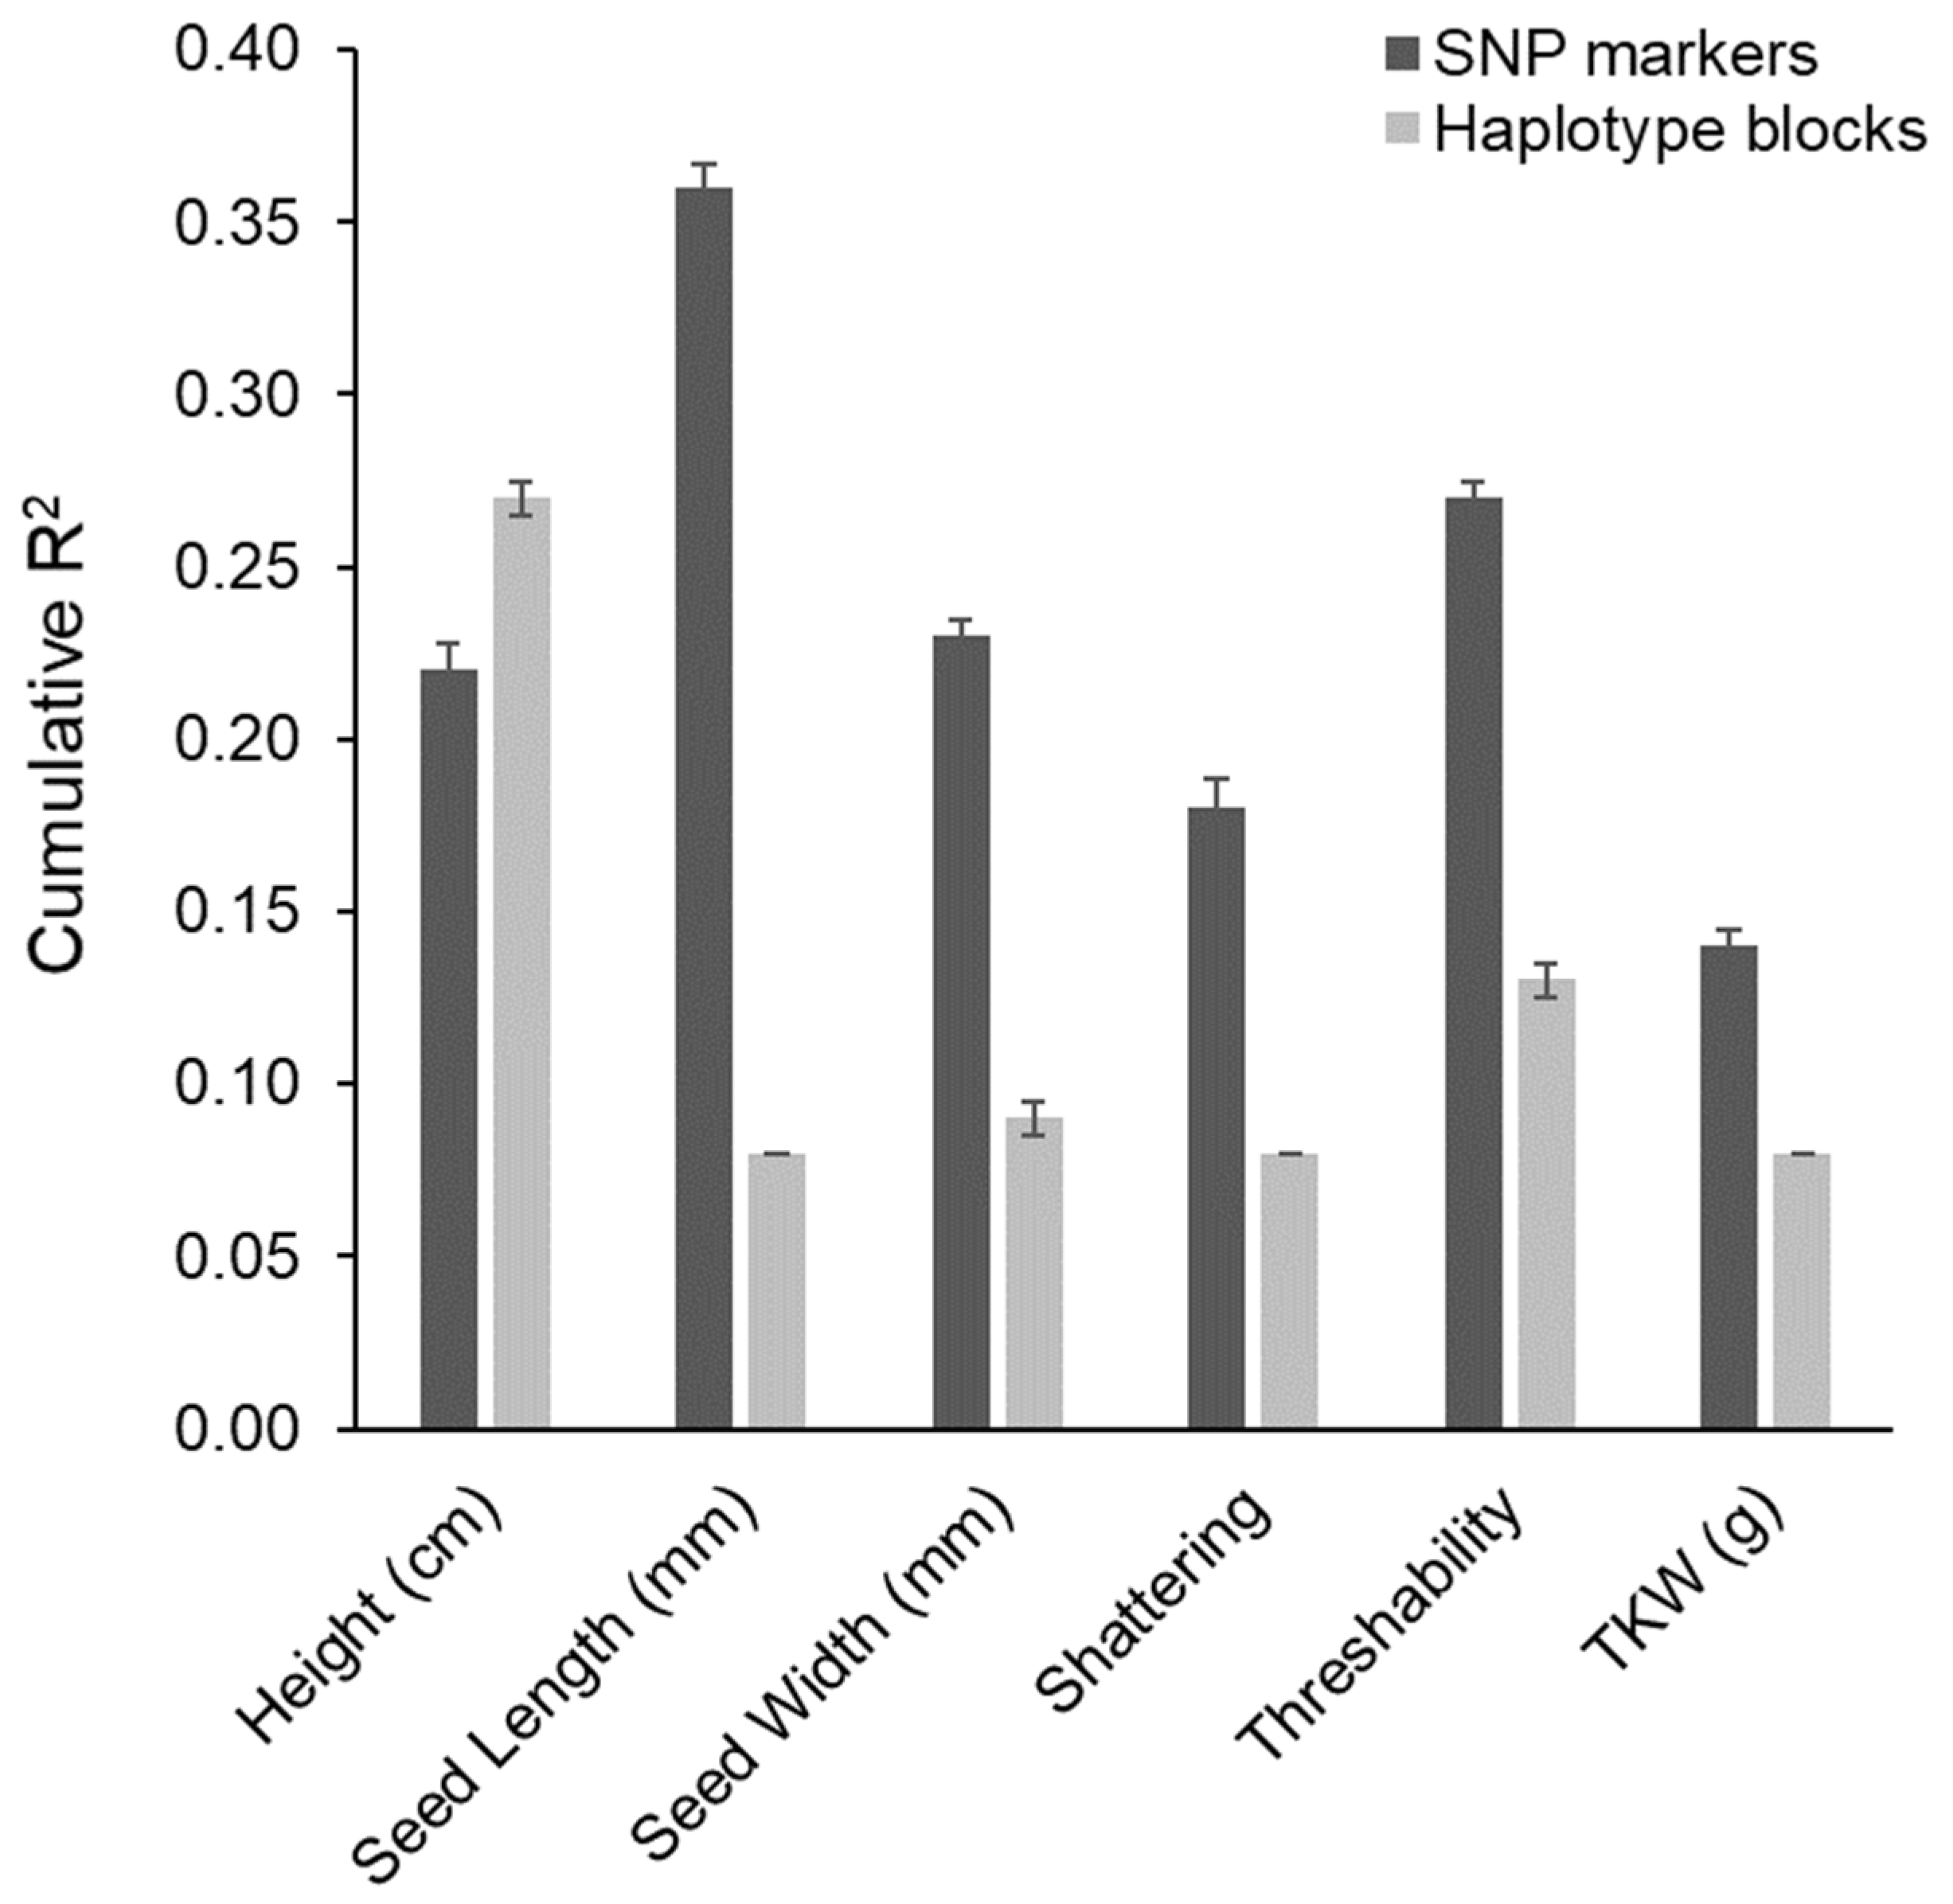
3.5. Comparison of Mapping Results between Marker Types

Few SNP markers discovered in the single marker association analysis were also discovered in haplotype analysis. Of the 31 single significant markers, 14 were binned into 14 haplotype blocks in nine chromosomes (Table 3). The haplotype block Chr08-Hb.228 housed the SNP marker S08_323540788, a common MTA between seed length and TKW. Of the 17 HTAs, 10 blocks had SNPs that were also significant in single SNP association analysis (Table 4). For these 10 common SNPs, pairwise correlation coefficients for their p-values of marker-trait associations, percentage of phenotypic variation explained (R2), and additive allelic effect were 0.25, 0.41, and 0.99, respectively.
For the six domestication traits, more MTAs were discovered relative to HTAs, i.e., 31 MTAs and 17 HTAs. Cumulative R2 values of the MTAs were therefore larger than cumulative R2 values of HTAs for all traits except plant height (Figure 4). For plant height, the HTAs explained 27% of the observed phenotypic variation whereas the MTAs explained 22%. For remaining traits, R2 values for MTAs exceeded BTA R2 by 58% on average. The largest difference was observed for seed length where MTAs explained 36% of observed phenotypic variation whereas the HTAs explained only 8%.

4. Discussion

4.1. IWG Population, Trait Properties, and Association Mapping

In this study, we used the IWG breeding germplasm from the fourth recurrent selection cycle at the University of Minnesota (UMN_C4) to analyze population properties and carry out marker-trait associations. Similar to our third cycle breeding germplasm (UMN_C3), UMN_C4 also showed a rapid decline in LD with decay at 0.23 Mbp when r2 = 0.2 [40]. Also similar to UMN_C3, UMN_C4 lacked strong population stratification as the first two PC axes explained only 5.1% of the variation; this value was 3.9% in UMN_C3. In another study that combined several IWG populations from the University of Minnesota and The Land Institute (Salina, KS, USA), the first two PC axes explained 4.9% of the genotypic variation [41]. This lack of a strong population structure in IWG breeding populations is likely due to the limited number of founder parents [1]. Yet, population divergence could occur in future populations as breeding programs impose differential selection pressure on various agronomic and local adaptation traits.
We evaluated six important domestication traits, plant height, seed length, seed width, shattering, threshability, and seed mass expressed in terms of thousand kernel weight (TKW), in the UMN_C4 IWG breeding population and mapped genomic loci controlling these traits. Heritability estimates for these traits were in general high and agreed with previous studies [40,42,43]. Most traits had moderate to strong correlations among each other with few notable exceptions, e.g., r = −0.07 between height and threshability and r = −0.05 between seed length and threshability (Table 2). Threshability had significant yet negative correlations with shattering (r = −0.37) and seed width (r = −0.42). Negative relationships of threshability with shattering and seed dimensions have also been previously observed in different IWG populations [42,44], and present a unique challenge to a breeder. Plants that produce larger seeds with minimal to no shattering and high threshability are desired to maximize the yield potential of IWG. As threshability is negatively correlated with shattering and seed weight, improving it increases the risk of depreciating trait values for the other traits. Yet, a large enough breeding population could provide the opportunity for genotypes with desirable trait combinations to exist, e.g., individuals that have reduced shattering and high threshability with larger grain. For example, in UMN_C4, there were 59 (9%) out of 657 genets with no more than 30% seed shatter and 70% or higher threshability with grain width ranging from 1.70–1.90 mm; the widest grain was 2.03 mm in the population. A careful and strong selection pressure is thus warranted to simultaneously improve these three traits in IWG.
We carried out association analysis using multi-allelic haplotypes for the first time in IWG. Ten of 17 (59%) blocks that were significantly associated with our domestication traits also contained SNP markers discovered using the single marker association analysis (Table 3 and Table 4). Differences between haplotype analysis and single marker analysis are not uncommon [35,45,46]. These differences are primarily attributed to the differences in allelic composition and frequencies as well as LD with the causative loci [47,48]. This difference was evident in our UMN_C4 population as a majority (81%) of the haplotype blocks were formed with 2–3 SNPs, likely due to a rapid decline in LD (0.23 Mbp). Because of the inherent differences between the two marker types, multiple studies have suggested using both single markers and haplotypes as they often complement each-other [45,49]. Our results corroborate that it is best to use both marker types in association analysis to obtain a better understanding of the genetic control behind complex quantitative traits in IWG.

4.2. Comparison with Existing IWG QTL

Association analysis of six domestication traits in the UMN_C4 IWG breeding population led to discovery of 31 single marker-trait associations (MTAs) and 17 haplotype block trait associations (HTAs). The locus S09_398417599 was significantly associated with plant height in UMN_C4 and falls within the lower (Chr09_370475337) and upper (Chr09_81355723) bounds of the QTL associated with stem length discovered by Larson et al. [42]. Larson et al. [42] also reported that their QTL region was proximally aligned to the barley DENSO (Semidwarf 1) gene [50]. All other MTAs and HTAs discovered for plant height appear to be unique to our population.
More than 60 QTL have been reported for seed length in different IWG populations [40,42,51]. The SNP marker S08_323540788 and the haplotype block Chr08-Hb.228 (which contained S08_323540788) were significantly associated with seed length in UMN_C4. This marker is located at a distance of <1 Mbp from the significant marker S08_323540788 for seed length discovered by Bajgain et al. [40] in an association mapping study in the UMN_C3 population. Likewise, more than 50 QTL have been reported for seed width in IWG [40,42,51]. All MTAs and HTAs detected in our study were >17 Mbp away from these previously reported QTL and thus likely are unique to our population. Of the MTAs and HTAs we discovered for TKW, the significant marker S20_314990021 is located <1 Mbp away from the QTL Ti_QSws.umn_20.2 reported by Zhang et al. [51]. In Zhang et al.’s study, the QTL Ti_QSws.umn_20.2 was associated with the traits TKW and seed area in two different populations and had allelic effect of −0.31 for TKW and −0.21 for seed area. In our study, this marker had a larger, positive allelic effect (0.32) and explained 5% of the observed phenotypic variation.
In this study, we discovered five unique associations (between MTA and BTA) on chromosomes 11, 15, 17, and 20 for shattering. In various IWG populations, more than 50 QTL have been reported for resistance to shatter [42,44]. The significant SNP marker S11_233685188 was located less than 4 Mbp and 2 Mbp from the markers S11_229911033 and S11_231841692 in studies by Larson et al. [42] and Altendorf [44], respectively. It is therefore likely that these three markers represent the same locus/gene. The significant marker S05_156358046 for threshability was also discovered in a nested association mapping population created from genets of the UMN_C2 population [44]. The SNP marker S05_156358046 explained 5% of the phenotypic variation (R2) and had an allelic effect of 0.35 in our study whereas in Altendorf’s study, this marker had a larger R2 value depending on the environment (10.4–13.8%) yet smaller allelic effect (0.008–0.011). Another SNP marker, S20_583569893, is located more than 7 Mbp away from the marker S20_590832266 discovered by Altendorf et al. [44], and is therefore unlikely to be the same locus.

4.3. QTL Size and Implications in Intermediate Wheatgrass Breeding

For all domestication traits in our UMN_C4 population, we observed high broad-sense heritability estimates (H ≥ 0.71). This indicates that the variations observed for all traits were largely under the control of genetic factors. Despite a higher degree of genetic control over the traits, all genomic loci associated with the traits were of small to moderate effects (proportion of explained phenotypic variance, R2 = 4–6%). The cumulative phenotypic variance explained by the MTAs and HTAs are likely a function of number of discovered loci as previously suggested [35]. Yet, it was interesting to observe higher cumulative R2 for HTAs relative to MTAs. However, the small to moderate effects of the QTL pose a two-fold problem: (1) the difficulty in combining the loci and using markers associated with these loci in marker-assisted selection is higher, and (2) improving trait values and increasing genetic gain from phenotypic selection only can be more challenging because of the resources required to accumulate many small-effect loci. The problem is exacerbated in a near-obligate out-crossing species such as IWG with heterogeneous population composition and many heterozygous loci. Allelic interactions in such populations are likely to dissociate rapidly with each advancing generation [52], hindering the process of rapid accumulation of favorable alleles.
A better method to accumulate causative loci and their favorable alleles is an in silico selection approach, such as genomic selection that evaluates all genome-wide markers to predict traits of interest [53]. In particular, significant markers from association studies, when used in genomic prediction models as covariates, are known to improve traits prediction in self-pollinated as well as cross-pollinated crop species [54,55,56]. Similar results have also been observed in IWG where the use of significant markers from association mapping has improved trait predictive ability of genomic prediction models in disease and yield component traits [40,57]. When significant markers are fitted as fixed effects, the model estimates effects of remaining markers, potentially avoiding strong shrinkage due to medium-large fixed-effect markers and allows the model to predict trait values with higher accuracy [58,59]. The use of genome-wide markers, including significant markers, in genomic selection can therefore improve important traits while saving time and resources compared to phenotypic selection only.
To summarize, IWG is a novel perennial grain crop that offers substantial ecological benefits, while producing edible grain. Because the domestication timeline of IWG is very short, with modern genomic tools not applied until recently, the crop still requires significant improvements of several agronomic and domestication traits. We identified several genomic loci–31 single markers and 17 haplotype blocks–that control six important domestication traits in IWG: plant height, seed length, seed width, shattering, threshability, and seed mass. The accumulation of these loci by increasing the frequencies of their favorable alleles in IWG breeding germplasm will be instrumental in improving this crop.

Supplementary Materials

The following are available online at https://0-www-mdpi-com.brum.beds.ac.uk/article/10.3390/agriculture11070667/s1, Figure S1: Squared allele-frequency correlations (r2) plotted against physical distance (mega base pairs, Mbp) in the UMN_C4 intermediate wheatgrass population. The decline of linkage disequilibrium is shown by plotting the LOWESS curve in blue color. Figure S2: QQ-plots generated by FarmCPU model during genome-wide association scan for significant SNP markers. A: Height (cm), B: Seed length (mm), C: Seed width (mm), D: Shattering, E: Threshability, F: Thousand kernel weight (TKW, g). Table S1: Variance components for the six domestication traits in the UMN_C4 intermediate wheatgrass population.

Author Contributions

Conceptualization, P.B. and J.A.A.; methodology, P.B.; software, P.B.; formal analysis, P.B.; investigation, P.B.; resources, J.A.A..; data curation, P.B.; writing—original draft preparation, P.B.; writing—review and editing, P.B. and J.A.A.; visualization, P.B.; supervision, J.A.A.; funding acquisition, P.B. and J.A.A. All authors have read and agreed to the published version of the manuscript.

Funding

This research was funded by the Forever Green Initiative at the University of Minnesota through the Minnesota Department of Agriculture, the Minnesota Department of Agriculture’s AGRI Crop Research Grant, and the General Mills Foundation.

Institutional Review Board Statement

Not applicable.

Data Availability Statement

Sequence data of UMN_C4 can be accessed through NCBI’s SRA Bio-project PRJNA722274. Phenotypic data is available for research purposes upon a reasonable request.

Acknowledgments

We thank the University of Minnesota Genomics Center, the University of Minnesota Supercomputing Institute, University of Minnesota Agricultural Experiment Station, and Anderson Laboratory personnel, specifically Brett Heim, for their technical support during the study.

Conflicts of Interest

The authors declare no conflict of interest.

References

  1. Wagoner, P. Perennial Grain New Use for Intermediate Wheatgrass. J. Soil Water Conserv. 1990, 45, 81–82. [Google Scholar]
  2. DeHaan, L.R.; Ismail, B.P. Perennial Cereals Provide Ecosystem Benefits. Cereal Foods World 2017, 62, 278–281. [Google Scholar] [CrossRef]
  3. Culman, S.W.; Snapp, S.S.; Ollenburger, M.; Basso, B.; DeHaan, L.R. Soil and Water Quality Rapidly Responds to the Perennial Grain Kernza Wheatgrass. Agron. J. 2013, 105, 735–744. [Google Scholar] [CrossRef] [Green Version]
  4. Bergquist, G.E. Biomass Yield and Soil Microbial Response to Management of Perennial Intermediate Wheatgrass (Thinopyrum Intermedium) as Grain Crop and Carbon Sink; University of Minnesota: Minneapolis, MN, USA, 2019. [Google Scholar]
  5. Jungers, J.M.; DeHaan, L.H.; Mulla, D.J.; Sheaffer, C.C.; Wyse, D.L. Reduced Nitrate Leaching in a Perennial Grain Crop Compared to Maize in the Upper Midwest, USA. Agric. Ecosyst. Environ. 2019, 272, 63–73. [Google Scholar] [CrossRef]
  6. Vogel, K.P.; Jensen, K.J. Adaptation of Perennial Triticeae to the Eastern Central Great Plains. J. Range Manag. 2001, 54, 674–679. [Google Scholar] [CrossRef]
  7. Zhang, X.; Sallam, A.; Gao, L.; Kantarski, T.; Poland, J.; DeHaan, L.R.; Wyse, D.L.; Anderson, J.A. Establishment and Optimization of Genomic Selection to Accelerate the Domestication and Improvement of Intermediate Wheatgrass. Plant Genome 2016, 9. [Google Scholar] [CrossRef] [PubMed] [Green Version]
  8. Bajgain, P.; Zhang, X.; Jungers, J.M.; DeHaan, L.R.; Heim, B.; Sheaffer, C.C.; Wyse, D.L.; Anderson, J.A. ‘MN-Clearwater’, the First Food-Grade Intermediate Wheatgrass (Kernza Perennial Grain) Cultivar. J. Plant Regist. 2020, 14, 288–297. [Google Scholar] [CrossRef]
  9. Doebley, J.F.; Gaut, B.S.; Smith, B.D. The Molecular Genetics of Crop Domestication. Cell 2006, 127, 1309–1321. [Google Scholar] [CrossRef] [Green Version]
  10. Purugganan, M.D.; Fuller, D.Q. The Nature of Selection during Plant Domestication. Nature 2009, 457, 843–848. [Google Scholar] [CrossRef]
  11. Solberg, T.R.; Sonesson, A.K.; Woolliams, J.A.; Meuwissen, T.H.E. Genomic Selection Using Different Marker Types and Densities. J. Anim. Sci. 2008, 86, 2447–2454. [Google Scholar] [CrossRef] [Green Version]
  12. Korte, A.; Farlow, A. The Advantages and Limitations of Trait Analysis with GWAS: A Review. Plant Methods 2013, 9, 29. [Google Scholar] [CrossRef] [PubMed] [Green Version]
  13. Vilhjálmsson, B.J.; Nordborg, M. The Nature of Confounding in Genome-Wide Association Studies. Nat. Rev. Genet. 2013, 14, 1–2. [Google Scholar] [CrossRef]
  14. Yu, J.; Pressoir, G.; Briggs, W.H.; Vroh Bi, I.; Yamasaki, M.; Doebley, J.F.; McMullen, M.D.; Gaut, B.S.; Nielsen, D.M.; Holland, J.B.; et al. A Unified Mixed-Model Method for Association Mapping That Accounts for Multiple Levels of Relatedness. Nat. Genet. 2005, 38, 203. [Google Scholar] [CrossRef]
  15. Jannink, J.-L.; Bink, M.C.A.M.; Jansen, R.C. Using Complex Plant Pedigrees to Map Valuable Genes. Trends Plant Sci. 2001, 6, 337–342. [Google Scholar] [CrossRef]
  16. Buckler, E.S.; Thornsberry, J.M. Plant Molecular Diversity and Applications to Genomics. Curr. Opin. Plant Biol. 2002, 5, 107–111. [Google Scholar] [CrossRef]
  17. Mammadov, J.; Aggarwal, R.; Buyyarapu, R.; Kumpatla, S. SNP Markers and Their Impact on Plant Breeding. Int. J. Plant Genomics 2012, 2012, 728398. [Google Scholar] [CrossRef]
  18. Albrechtsen, A.; Nielsen, F.C.; Nielsen, R. Ascertainment Biases in SNP Chips Affect Measures of Population Divergence. Mol. Biol. Evol. 2010, 27, 2534–2547. [Google Scholar] [CrossRef] [Green Version]
  19. Poland, J.A.; Brown, P.J.; Sorrells, M.E.; Jannink, J.-L. Development of High-Density Genetic Maps for Barley and Wheat Using a Novel Two-Enzyme Genotyping-by-Sequencing Approach. PLoS ONE 2012, 7, e32253. [Google Scholar] [CrossRef] [Green Version]
  20. Bajgain, P.; Rouse, M.N.; Anderson, J.A. Comparing Genotyping-by-Sequencing and Single Nucleotide Polymorphism Chip Genotyping for Quantitative Trait Loci Mapping in Wheat. Crop Sci. 2016, 56, 232–248. [Google Scholar] [CrossRef]
  21. Gupta, P.K.; Kulwal, P.L.; Jaiswal, V. Chapter Two-Association Mapping in Crop Plants: Opportunities and Challenges. In Advances in Genetics; Friedmann, T., Dunlap, J.C., Goodwin, S.F., Eds.; Academic Press: Cambridge, MA, USA, 2014; Volume 85, pp. 109–147. ISBN 0065-2660. [Google Scholar]
  22. Wen, Y.-J.; Zhang, H.; Ni, Y.-L.; Huang, B.; Zhang, J.; Feng, J.-Y.; Wang, S.-B.; Dunwell, J.M.; Zhang, Y.-M.; Wu, R. Methodological Implementation of Mixed Linear Models in Multi-Locus Genome-Wide Association Studies. Brief. Bioinform. 2018, 19, 700–712. [Google Scholar] [CrossRef] [PubMed] [Green Version]
  23. Lu, Y.; Shah, T.; Hao, Z.; Taba, S.; Zhang, S.; Gao, S.; Liu, J.; Cao, M.; Wang, J.; Prakash, A.B.; et al. Comparative SNP and Haplotype Analysis Reveals a Higher Genetic Diversity and Rapider LD Decay in Tropical than Temperate Germplasm in Maize. PLoS ONE 2011, 6, e24861. [Google Scholar] [CrossRef] [Green Version]
  24. Da, Y. Multi-Allelic Haplotype Model Based on Genetic Partition for Genomic Prediction and Variance Component Estimation Using SNP Markers. BMC Genet. 2015, 16, 144. [Google Scholar] [CrossRef] [PubMed] [Green Version]
  25. Wang, S.-B.; Feng, J.-Y.; Ren, W.-L.; Huang, B.; Zhou, L.; Wen, Y.-J.; Zhang, J.; Dunwell, J.M.; Xu, S.; Zhang, Y.-M. Improving Power and Accuracy of Genome-Wide Association Studies via a Multi-Locus Mixed Linear Model Methodology. Sci. Rep. 2016, 6, 19444. [Google Scholar] [CrossRef] [Green Version]
  26. Thinopyrum Intermedium Genome Sequencing Consortium Thinopyrum Intermedium v2.1 DOE-JGI. Available online: http://Phytozome.Jgi.Doe.Gov/ (accessed on 14 July 2021).
  27. Li, H.; Durbin, R. Fast and Accurate Short Read Alignment with Burrows–Wheeler Transform. Bioinformatics 2009, 25, 1754–1760. [Google Scholar] [CrossRef] [Green Version]
  28. Li, H. A Statistical Framework for SNP Calling, Mutation Discovery, Association Mapping and Population Genetical Parameter Estimation from Sequencing Data. Bioinforma. Oxf. Engl. 2011, 27, 2987–2993. [Google Scholar] [CrossRef] [Green Version]
  29. Bradbury, P.J.; Zhang, Z.; Kroon, D.E.; Casstevens, T.M.; Ramdoss, Y.; Buckler, E.S. TASSEL: Software for Association Mapping of Complex Traits in Diverse Samples. Bioinformatics 2007, 23, 2633–2635. [Google Scholar] [CrossRef] [PubMed]
  30. Money, D.; Gardner, K.; Migicovsky, Z.; Schwaninger, H.; Zhong, G.-Y.; Myles, S. LinkImpute: Fast and Accurate Genotype Imputation for Nonmodel Organisms. G3 Genes Genomes Genet. 2015, 5, 2383–2390. [Google Scholar] [CrossRef] [PubMed] [Green Version]
  31. Hill, W.G.; Weir, B.S. Variances and Covariances of Squared Linkage Disequilibria in Finite Populations. Theor. Popul. Biol. 1988, 33, 54–78. [Google Scholar] [CrossRef]
  32. Vos, P.G.; Paulo, M.J.; Voorrips, R.E.; Visser, R.G.F.; van Eck, H.J.; van Eeuwijk, F.A. Evaluation of LD Decay and Various LD-Decay Estimators in Simulated and SNP-Array Data of Tetraploid Potato. TAG Theor. Appl. Genet. Theor. Angew. Genet. 2017, 130, 123–135. [Google Scholar] [CrossRef] [PubMed] [Green Version]
  33. Barrett, J.C.; Fry, B.; Maller, J.; Daly, M.J. Haploview: Analysis and Visualization of LD and Haplotype Maps. Bioinformatics 2004, 21, 263–265. [Google Scholar] [CrossRef] [Green Version]
  34. Gabriel, S.B.; Schaffner, S.F.; Nguyen, H.; Moore, J.M.; Roy, J.; Blumenstiel, B.; Higgins, J.; DeFelice, M.; Lochner, A.; Faggart, M.; et al. The Structure of Haplotype Blocks in the Human Genome. Science 2002, 296, 2225. [Google Scholar] [CrossRef] [Green Version]
  35. Abed, A.; Belzile, F. Comparing Single-SNP, Multi-SNP, and Haplotype-Based Approaches in Association Studies for Major Traits in Barley. Plant Genome 2019, 12, 190036. [Google Scholar] [CrossRef] [Green Version]
  36. Lipka, A.E.; Tian, F.; Wang, Q.; Peiffer, J.; Li, M.; Bradbury, P.J.; Gore, M.A.; Buckler, E.S.; Zhang, Z. GAPIT: Genome Association and Prediction Integrated Tool. Bioinformatics 2012, 28, 2397–2399. [Google Scholar] [CrossRef] [Green Version]
  37. Liu, X.; Huang, M.; Fan, B.; Buckler, E.S.; Zhang, Z. Iterative Usage of Fixed and Random Effect Models for Powerful and Efficient Genome-Wide Association Studies. PLoS Genet. 2016, 12, e1005767. [Google Scholar] [CrossRef] [PubMed]
  38. Sen, Ś.; Churchill, G.A. A Statistical Framework for Quantitative Trait Mapping. Genetics 2001, 159, 371. [Google Scholar] [CrossRef]
  39. Broman, K.W.; Wu, H.; Sen, Ś.; Churchill, G.A. R/Qtl: QTL Mapping in Experimental Crosses. Bioinformatics 2003, 19, 889–890. [Google Scholar] [CrossRef] [PubMed] [Green Version]
  40. Bajgain, P.; Zhang, X.; Anderson, J.A. Genome-Wide Association Study of Yield Component Traits in Intermediate Wheatgrass and Implications in Genomic Selection and Breeding. G3 Genes Genomes Genet. 2019, 9, 2429–2439. [Google Scholar] [CrossRef] [PubMed] [Green Version]
  41. Crain, J.; Bajgain, P.; Anderson, J.; Zhang, X.; Poland, J.; DeHaan, L. Enhancing Crop Domestication Through Genomic Selection, a Case Study of Intermediate Wheatgrass. Front. Plant Sci. 2020. [Google Scholar] [CrossRef] [PubMed] [Green Version]
  42. Larson, S.; DeHaan, L.; Poland, J.; Zhang, X.; Dorn, K.; Kantarski, T.; Anderson, J.; Schmutz, J.; Grimwood, J.; Jenkins, J.; et al. Genome Mapping of Quantitative Trait Loci (QTL) Controlling Domestication Traits of Intermediate Wheatgrass (Thinopyrum Intermedium). Theor. Appl. Genet. 2019, 132, 2325–2351. [Google Scholar] [CrossRef]
  43. Altendorf, K.R.; DeHaan, L.R.; Heineck, G.C.; Zhang, X.; Anderson, J.A. Floret Site Utilization and Reproductive Tiller Number Are Primary Components of Grain Yield in Intermediate Wheatgrass Spaced Plants. Crop Sci. 2021, 61, 1073–1088. [Google Scholar] [CrossRef]
  44. Altendorf, K. Phenotypic and Genetic Characterization of Domestication and Yield Component Traits in the Perennial Grain Crop Intermediate Wheatgrass; University of Minnesota: Minneapolis, MN, USA, 2020. [Google Scholar]
  45. Lorenz, A.J.; Hamblin, M.T.; Jannink, J.-L. Performance of Single Nucleotide Polymorphisms versus Haplotypes for Genome-Wide Association Analysis in Barley. PLoS ONE 2010, 5, e14079. [Google Scholar] [CrossRef] [PubMed] [Green Version]
  46. Luján Basile, S.M.; Ramírez, I.A.; Crescente, J.M.; Conde, M.B.; Demichelis, M.; Abbate, P.; Rogers, W.J.; Pontaroli, A.C.; Helguera, M.; Vanzetti, L.S. Haplotype Block Analysis of an Argentinean Hexaploid Wheat Collection and GWAS for Yield Components and Adaptation. BMC Plant Biol. 2019, 19, 553. [Google Scholar] [CrossRef]
  47. Slatkin, M. Linkage Disequilibrium—Understanding the Evolutionary Past and Mapping the Medical Future. Nat. Rev. Genet. 2008, 9, 477–485. [Google Scholar] [CrossRef] [PubMed] [Green Version]
  48. Hamblin, M.T.; Jannink, J.-L. Factors Affecting the Power of Haplotype Markers in Association Studies. Plant Genome 2011, 4. [Google Scholar] [CrossRef] [Green Version]
  49. Contreras-Soto, R.I.; Mora, F.; de Oliveira, M.A.R.; Higashi, W.; Scapim, C.A.; Schuster, I. A Genome-Wide Association Study for Agronomic Traits in Soybean Using SNP Markers and SNP-Based Haplotype Analysis. PLoS ONE 2017, 12, e0171105. [Google Scholar] [CrossRef]
  50. Jia, Q.; Zhang, J.; Westcott, S.; Zhang, X.-Q.; Bellgard, M.; Lance, R.; Li, C. GA-20 Oxidase as a Candidate for the Semidwarf Gene Sdw1/Denso in Barley. Funct. Integr. Genom. 2009, 9, 255–262. [Google Scholar] [CrossRef] [Green Version]
  51. Zhang, X.; Larson, S.R.; Gao, L.; Teh, S.L.; DeHaan, L.R.; Fraser, M.; Sallam, A.; Kantarski, T.; Frels, K.; Poland, J.; et al. Uncovering the Genetic Architecture of Seed Weight and Size in Intermediate Wheatgrass through Linkage and Association Mapping. Plant Genome 2017, 10. [Google Scholar] [CrossRef] [PubMed] [Green Version]
  52. Allard, R.W. History of Plant Population Genetics. Annu. Rev. Genet. 1999, 33, 1–27. [Google Scholar] [CrossRef]
  53. Meuwissen, T.H.; Hayes, B.J.; Goddard, M.E. Prediction of Total Genetic Value Using Genome-Wide Dense Marker Maps. Genetics 2001, 157, 1819–1829. [Google Scholar] [CrossRef] [PubMed]
  54. Sarinelli, J.M.; Murphy, J.P.; Tyagi, P.; Holland, J.B.; Johnson, J.W.; Mergoum, M.; Mason, R.E.; Babar, A.; Harrison, S.; Sutton, R.; et al. Training Population Selection and Use of Fixed Effects to Optimize Genomic Predictions in a Historical USA Winter Wheat Panel. Theor. Appl. Genet. 2019, 132, 1247–1261. [Google Scholar] [CrossRef] [Green Version]
  55. Spindel, J.; Begum, H.; Akdemir, D.; Virk, P.; Collard, B.; Redoña, E.; Atlin, G.; Jannink, J.-L.; McCouch, S.R. Genomic Selection and Association Mapping in Rice (Oryza Sativa): Effect of Trait Genetic Architecture, Training Population Composition, Marker Number and Statistical Model on Accuracy of Rice Genomic Selection in Elite, Tropical Rice Breeding Lines. PLoS Genet. 2015, 11, e1004982. [Google Scholar] [CrossRef] [Green Version]
  56. Minamikawa, M.F.; Nonaka, K.; Kaminuma, E.; Kajiya-Kanegae, H.; Onogi, A.; Goto, S.; Yoshioka, T.; Imai, A.; Hamada, H.; Hayashi, T.; et al. Genome-Wide Association Study and Genomic Prediction in Citrus: Potential of Genomics-Assisted Breeding for Fruit Quality Traits. Sci. Rep. 2017, 7, 4721. [Google Scholar] [CrossRef] [PubMed]
  57. Bajgain, P.; Zhang, X.; Turner, K.M.; Curland, D.R.; Heim, B.; Dill-Macky, R.; Ishimaru, A.C.; Anderson, A.J. Characterization of Genetic Resistance to Fusarium Head Blight and Bacterial Leaf Streak in Intermediate Wheatgrass (Thinopyrum Intermedium). Agronomy 2019, 9, 429. [Google Scholar] [CrossRef] [Green Version]
  58. Endelman, J.B. Ridge Regression and Other Kernels for Genomic Selection with R Package RrBLUP. Plant Genome 2011, 4, 250–255. [Google Scholar] [CrossRef] [Green Version]
  59. Pérez, P.; de los Campos, G. Genome-Wide Regression and Prediction with the BGLR Statistical Package. Genetics 2014, 198, 483–495. [Google Scholar] [CrossRef]
Figure 1. Scatter plots showing principal component 1 (PC1) plotted against principal component 2 (PC2) (Panel A) and squared allele-frequency correlations (r2) plotted against physical distance (mega base pairs, Mbp) in the UMN_C4 intermediate wheatgrass population (Panel B). The decline of linkage disequilibrium is shown by plotting the LOWESS curve in blue color. To improve the visibility of the curve, the x-axis shows LD decline within 20 Mbp only; a plot with a full range of genome-wide distances is shown in Figure S1.
Agriculture 11 00667 g001
Figure 2. Histogram distributions of six domestication traits in the UMN_C4 intermediate wheatgrass population. Dashed red line is the trait median and solid red line is mean.
Agriculture 11 00667 g002
Figure 3. Manhattan plots showing significant SNP markers discovered for each trait by association analysis. Dashed red line indicates the Bonferroni threshold at α = 0.05.
Agriculture 11 00667 g003
Figure 4. Comparison between the cumulative phenotypic variance explained (R2) by significant SNP markers and haplotype blocks domestication traits in the UMN_C4 intermediate wheatgrass population. Error bars represent standard deviations.
Agriculture 11 00667 g004
Table 1. Distribution summary of SNP markers and haplotype blocks in the UMN_C4 intermediate wheatgrass population.
Haplotype Blocks
ChromosomeNo. of SNPsSNP Position Range (bp)TotalNo. of SNPs
114001,326,898–507,102,603294825
21617300,679–433,297,397325928
310652,940,432–513,687,187224626
41133115,039–267,218,805234626
58501,020,684–434,249,891197515
613771,845,863–570,323,785267747
71173364,376–520,161,072231645
81472678,201–432,546,992325910
9111142,820–473,689,827240647
10961811,258–512,842,958185514
1178970,253–250,601,048163457
128191,201,293–434,811,611175469
1313111,606,077–385,563,675274777
141252265,147–524,672,644246695
151573359,226–611,692,208329928
16985949,133–400,595,591205584
179791,637–337,127,221205531
18137249,467–560,298,643283776
1919052,330,783–801,761,0173971117
202177276,951–676,545,6994531290
21588134,660–169,591,600127344
Mean1234--256712
Total25,909--537914,951
Table 2. Pearson correlation coefficients among domestication traits in the UMN_C4 intermediate wheatgrass population. The symbol * next to the correlation coefficient values indicates significance at α = 0.05.
TraitHeight (cm)ShatteringThreshabilitySeed Length (mm)Seed Width (mm)
Shattering0.13 *
Threshability−0.07−0.37 *
Seed Length (mm)0.20 *0.15 *−0.05
Seed Width (mm)0.11 *0.34 *−0.42 *0.30 *
TKW (g)0.20 *0.19 *−0.060.67 *0.66 *
Table 3. SNP markers, significantly associated with the domestication traits height, seed length, seed width, shattering, threshability, and thousand kernel weight (TKW) in the UMN_C4 intermediate wheatgrass population. ‘MAF’ is minor allele frequency, ‘LOD’ is −log10 p-value of association analysis, and ‘R2’ is the proportion of phenotypic variance explained by the significant haplotype block. Column ‘Hb’ indicates if the SNP marker belongs to a haplotype block, ‘NA’ means the SNP marker was not binned into a haplotype block.
TraitSNP MarkerChrPos (Mbp)AllelesMAFLODR2Allelic EffectHb
Height (cm)S09_3984175999398.42G/T0.155.710.04−3.43NA
Height (cm)S12_540859411254.09G/C0.309.180.063.58Chr12-Hb.032
Height (cm)S15_38441440315384.41C/T0.105.760.04−3.58Chr15-Hb.150
Height (cm)S16_29322046516293.22G/C0.276.140.04−2.70Chr16-Hb.110
Height (cm)S20_61371385620613.71A/G0.115.810.044.13Chr20-Hb.395
Seed Length (mm)S01_1843754811184.38C/T0.095.690.04−0.10NA
Seed Length (mm)S02_3602226832360.22C/G0.097.110.050.13Chr02-Hb.254
Seed Length (mm)S08_3235407888323.54C/A0.307.540.05−0.08Chr08-Hb.228
Seed Length (mm)S09_3066723319306.67C/A0.425.920.040.06NA
Seed Length (mm)S15_55000861115550.01T/A0.146.250.04−0.09Chr15-Hb.298
Seed Length (mm)S20_24828875820248.29C/T0.175.630.04−0.09NA
Seed Length (mm)S20_44003661320440.04G/A0.095.750.040.13NA
Seed Length (mm)S21_13905460621139.05G/A0.197.930.06−0.10NA
Seed Width (mm)S02_62705420.63A/C0.226.300.04−0.02Chr02-Hb.001
Seed Width (mm)S03_3243398213324.34G/C0.267.330.050.02NA
Seed Width (mm)S05_2291079425229.11A/G0.146.500.050.03Chr05-Hb.076
Seed Width (mm)S05_3306870255330.69T/C0.306.440.050.02NA
Seed Width (mm)S09_1944638419194.46G/A0.126.050.04−0.03NA
ShatteringS11_23368518811233.69C/A0.405.710.040.15NA
ShatteringS15_42777344015427.77C/A0.449.300.06−0.20Chr15-Hb.183
ShatteringS17_893886991789.39C/T0.305.610.04−0.19NA
ShatteringS20_56994939120569.95A/G0.185.700.04−0.26NA
ThreshabilityS01_67160311167.16G/T0.245.740.04−0.40Chr01-Hb.041
ThreshabilityS03_2310830923231.08A/G0.136.740.050.51NA
ThreshabilityS05_1563580465156.36G/T0.386.510.050.35NA
ThreshabilityS15_12755693315127.56G/A0.076.050.04−0.69NA
ThreshabilityS20_56884972420568.85T/C0.255.980.040.43Chr20-Hb.349
ThreshabilityS20_58356989320583.57G/C0.086.610.050.61Chr20-Hb.361
TKW (g)S06_5586126226558.61T/C0.226.570.05−0.33Chr06-Hb.258
TKW (g)S08_3235407888323.54C/A0.307.550.05−0.26Chr08-Hb.228
TKW (g)S20_31499002120314.99A/G0.255.650.040.32NA
Table 4. Haplotype blocks in significant association with the domestication traits height, seed length, seed width, shattering, threshability, and thousand kernel weight (TKW) in the UMN_C4 intermediate wheatgrass population. ‘LOD’ is −log10 p-value of association analysis, and ‘R2’ is the proportion of phenotypic variance explained by the significant haplotype block. ‘SigSNP’ indicates SNP markers within the significant haplotype block that were also significant in the single marker analysis; ‘NA’ means no SNP marker was binned into the haplotype block.
TraitHbSNPs in BlockChrLODR2Allelic EffectSigSNP
Height (cm)Chr01-Hb.2243Chr016.710.053.46NA
Height (cm)Chr08-Hb.1972Chr085.080.04−10.02NA
Height (cm)Chr12-Hb.0322Chr126.970.056.29S12_54085941
Height (cm)Chr14-Hb.1074Chr146.080.04−24.63NA
Height (cm)Chr15-Hb.1503Chr155.820.04−8.44S15_384414403
Height (cm)Chr18-Hb.2673Chr186.750.057.44NA
Seed Length (mm)Chr02-Hb.2542Chr025.850.040.02S02_360222683
Seed Length (mm)Chr08-Hb.2284Chr085.180.04−0.14S08_323540788
Seed Width (mm)Chr02-Hb.0012Chr025.340.04−0.10S02_627054
Seed Width (mm)Chr05-Hb.0765Chr056.410.050.08S05_229107942
ShatteringChr11-Hb.1347Chr115.950.040.42NA
ShatteringChr15-Hb.1834Chr155.900.04−0.22S15_427773440
ThreshabilityChr06-Hb.1804Chr065.140.04−1.66NA
ThreshabilityChr20-Hb.3493Chr205.600.040.68S20_568849724
ThreshabilityChr20-Hb.3612Chr206.690.050.84S20_583569893
TKW (g)Chr06-Hb.1862Chr066.010.04−3.77NA
TKW (g)Chr08-Hb.2284Chr085.090.04−0.47S08_323540788
Publisher’s Note: MDPI stays neutral with regard to jurisdictional claims in published maps and institutional affiliations.

