Article

MODIS NDVI Multi-Temporal Analysis Confirms Farmer Perceptions on Seasonality Variations Affecting Apple Orchards in Kinnaur, Himachal Pradesh

1
Institute for the Advanced Study of Sustainability, United Nations University, Tokyo 150-8925, Japan
2
Institute for Future Initiatives, The University of Tokyo, Tokyo 113-0032, Japan
3
Department of Environment Studies, Panjab University, Chandigarh 160-014, India
4
National Remote Sensing Centre, Indian Space Research Organisation, Hyderabad 500-037, India
5
Faculty of Environmental Earth Science, Hokkaido University, Sapporo 060-0810, Japan
*
Author to whom correspondence should be addressed.
Submission received: 2 July 2021 / Revised: 26 July 2021 / Accepted: 27 July 2021 / Published: 30 July 2021

Abstract

:
Apple cultivation in the Kinnaur district of the northern Indian State of Himachal Pradesh faces challenges from climatic changes and developmental activities. Farmers in the neighboring districts have already faced a major loss of livelihood due to seasonal changes. Therefore, it is important to study the extent of seasonal variations in the apple growing locations of this region. This study makes that attempt by assessing seasonality variations during a 15-year period from 2004 to 2018 when maximum construction activities occurred in this region. The study uses geospatial and statistical techniques in addition to farmer perceptions obtained during a field visit in November 2019. A temporal pattern using a normalized difference vegetation index (NDVI) based on Moderate Resolution Imaging Spectroradiometer (MODIS) was studied for seven apple-growing locations in the district. The results show high seasonal variations and reduced snowfall at lower elevations, resulting in less chilling hours, which are necessary for the healthy growth of apples. The normalized difference snow index (NDSI) and rainfall show a high correlation with apple growth. Local farmers are unprepared for future seasonal disturbances, as they lack early warning systems, insurance for apple crops, and alternative livelihood options.

1. Introduction

Himachal Pradesh in the western Himalayas is one of the four biodiversity hotspots in India. It hosts a variety of endemic species but is vulnerable to climatic changes [1,2,3,4]. The western Himalayan region has experienced significant warming in the past five to six decades [5]. In addition, there has been a rampant shift from subsistence to commercial crops, which is eroding genetic diversity [6]. Forests are becoming degraded due to developmental activities such as road construction and dam-building, which have changed the traditional sustainable use of natural resources [7]. Irrespective of what is causing a change in the Land Use Land Cover (LULC), it is acting as a major driver for biodiversity loss and reduction in water availability and quality, apart from affecting mountain sustainability [8].
The Kinnaur district in the northern State of Himachal Pradesh, known for its apples, faces similar challenges. Kinnaur apples are popular for their natural sweetness, color, juiciness, and prolonged shelf life. Apple is the most prevalent commercial crop of the region, and its production is constantly shifting to high altitude districts [9,10]. Apple production in the entire state in 2019–2020 was 715.25 thousand tonnes, and it constitutes about 49% of the total area under fruit crops and about 85% of the total fruit production in the State [11]. The area of the State that is used for apple cultivation in Kinnaur has increased from 2.59% of the State’s total geographical in 1971–1972 to 10.03% in 2016–2017 [9]. Apple productivity has also increased from 4273 kg per hectare (kg/ha) in 1971–1972 to 5366.79 kg/ha in 2016–2017. Kinnaur contributed 12.86% to the State’s apple production in 2016–2017 [9]. The contribution of Kinnaur apples to the Gross State Domestic Product (GSDP) and local livelihoods is significant. As production declines in neighboring districts, this region is being envisioned as the hub of apple production due to rising temperatures and shifting apple orchards in the coming decades. However, the stability of this produce is threatened, as both apple productivity and apple production in low altitude regions are declining [10]. Very recently (2005 to 2014), Kinnaur’s apple production contribution to the Himachal Pradesh state decreased slightly, by 1.5% [10]. This reduction of apple produce, no matter how small, could be alarming for farmer livelihoods in the near future.
The region also faces multiple challenges due to extreme events and construction activities. Previous studies on this region have focused on the loss of medicinal plants [12,13,14,15], vulnerability assessments and land use change [3,16,17,18], extreme events including earthquakes and landslides [19,20], and the impacts of hydropower dams [21,22,23]. All of these challenges together play a significant role in transforming the agriscapes in the region, especially due to the deterioration of water resources, biodiversity loss, and unsustainable construction activities. Studies in this region have also been conducted using Geographic Information System (GIS) and remote sensing. These studies include morphometric analysis for the development of hydropower projects [24], vulnerability assessments [17], the classification of landscapes in the upper Satluj River watershed [25], glacial variations in Baspa river basin [26], the mapping of apple orchards [27], and to show changes in the built-up area, horticulture, and wasteland [18]. The district is highly vulnerable due to its complex geophysical setting [17]. It ranks 5th in climate vulnerability in the State [16]. About 95% of the forest grids in the district are expected to undergo a forest type shift in the Representative Concentration Pathway (RCP) 4.5 long term scenario [3]. The climate impacts on apple plantations are already visible. The chill unit requirements for apple cultivation showed decreasing trends up to 2400 above mean sea level (amsl) from Bajaura in Kullu at 1221 amsl to Sarbo in Kinnaur at 2400 amsl, while the income of the farmers from fruit production showed a decrease of more than 27% in the Kullu and Shimla districts of the State compared to 1995 [28]. The winter chill is largely affected due to climatic variability [10], which is threatening livelihoods in the regions where apple is the cash crop.
This study is driven by past examples from other districts of the State, the Kullu and Shimla, where apple orchards have been wiped out due to reduced winter chill, which has affected the local economy [29,30,31] and has caused the loss of a primary source of livelihood. The farmers in this region report changes in the snowfall patterns, which is shifting an ecological niche for traditionally and commercially important apple cultivars and showing an increase in low chill cultivars [29]. This is causing them to either switch to new crops or shift to higher altitudes. Apple production, however, has been increasing in high altitude regions such as in Jammu and Kashmir [32]. Kinnaur is also among the high-altitude regions, which makes it important to study whether this region will see an increase or a decline in apple production in the future.
To achieve more clarity on these issues and to collect ground control points, a field visit to the villages of the Kinnaur district was conducted in November 2019. Interviews with the local farmers were conducted, which helped in the acquisition of more primary information regarding the selected apple orchard sites during a 15-year period (2004–2018). In addition, the perception of local farmers on the intensity of seasonal variations and their impact, if any, revealed significant information on the frequency of extreme events, the loss of orchards/production, and unsustainable development. All of these perceived drivers seemed to have a high potential for impacting apple production. This ground information further sparked the need for and formed the basis of this study. Undoubtedly, it is important to study the fate of apple production and seasonal variations in the district, considering that this is the major source of livelihood in the region.
For this study, time series analysis was conducted using the normalized difference vegetation index (NDVI) based on Moderate Resolution Imaging Spectroradiometer (MODIS) data for seven apple orchard control sites located at different altitudes. It aimed to assess the seasonality variations in apple plantations of Kinnaur from 2004 to 2018. This period saw maximum construction activities in this region, specifically, the construction of major dams on the Satluj and Baspa rivers. During the same time, people reported variability in their apple produce. Therefore, seasonality parameters (phenological indices) that include start of season (SOS), length of season (LOS), peak of season (POS), and end of season (EOS) were correlated to the rainfall and normalized difference snow index (NDSI) of Kinnaur to determine the impact of climatic variables on seasonality at different altitudes. This study indicated a marked seasonal variation at all altitudes, the thinning of flowers during SOS, reduced snowfall in the low-altitude region, and a positive correlation between the NDSI and the SOS. Although this district may see a boon of apple production in the future as a result of climatic change, lower altitudes may face enhanced seasonal variations or a fate similar to that of the neighboring districts.

2. Study Area

Kinnaur is one of the 12 administrative districts in the State of Himachal Pradesh. The district covers an area of 6401 km2 and extends from 31°19′04″ N to 32°05′59″ N latitude and 77°82′01″ E to 78°83′05″ E longitude. It is a mountainous district, ranging in altitude from 1226 m above mean sea level (amsl) to 6759 m amsl (Figure 1). This district has three mountain ranges namely, the Zanskar, the Greater Himalayas, and the Dauladhar mountain ranges, and is drained by the Satluj, Baspa, and Spiti rivers and their tributaries. The district shares an international border with China (Tibet) in the east. Kinnaur enjoys a temperate climate due to its high elevation with long winters from October to May and short summers from June to September. The lower parts of the Sutlej and Bapsa valley receive monsoon rains, particularly in the month of July. The upper part of the valley is in the rain-shadow area and exhibits arid climatic features identical to Tibet. Alpine species such as juniper, pine, fir, cypress, and rhododendron are found at elevations between 3500 to 5000 m amsl. At lower altitudes, temperate trees such as oak, chestnut, maple, birch, alder, magnolia, apple, and apricot can be found.
Kinnaur has about 660 villages, out of which 234 are inhabited and 426 are uninhabited [33]. The district has a population of 84,121 with a density of 13 persons per km2 and a population growth rate of 7.39% [33]. Agriculture is the major occupation, but over time, commercial apple production has become the main source of income. The selected apple orchard sampling locations are spread throughout the region, from lower elevations (2014 m amsl) to higher elevations (3163 m amsl), as shown in Figure 1. The seven apple orchard control sites were selected in the following villages, where apple plantation was dominant throughout the duration of this study from 2004 to 2018: Nichar (KR1—2014 m amsl), Sangla (KR2—2723 m amsl), Kalpa (KR3—2775 m amsl), Moorang (KR4—2503 m amsl), Ropa (KR5—3163 m amsl), Namgia Khas (KR6—2800 m amsl), and Chango (KR7—3066 m amsl).

3. Materials and Methods

Following major tasks were conducted for this study: a LULC analysis for 2018, a pixel-based time series analysis of the MODIS-NDVI data, a phenological modelling, and a statistical analysis. The data sets used for this study were the LANDSAT 8 satellite data, the MODIS NDVI (250 m) data, the MOD09A1.006 Terra Surface Reflectance data, and the India Meteorological Department (IMD)’s gridded precipitation data. The different software programs that were used include ArcMap (ESRI), ERDAS Imagine (Hexagon Geospatial), and TIMESAT (Lund University). Figure 2 presents the flowchart of the methodology used for the analysis. The details of the conducted tasks are mentioned in Section 3.1, Section 3.2, Section 3.3 and Section 3.4. The research took a 15-year period to assess seasonal variations, and thus, the selected plantation sites based on 2018 image classification were checked for the presence of plantations back in 2004 with the help of Google Earth data and interviews with local farmers during the field visit in November 2019.

3.1. Local Farmer Interviews

Local farmer interviews were conducted in the seven selected locations with apple plantations. The farmer perceptions have been used to determine the ground control points and to understand the local dynamics concerning apple production in the region. They also helped to understand how Kinnauri apple farmers perceive seasonal changes. The apple farmers were selected randomly and had small or large apple farms. They had a good understanding of the changing climatic conditions, their impact, and their inclination towards new apple cultivars. Nearly 10–15 farmers from each selected site (85 in total) were interviewed, and the interview was based on an unstructured set of questions. Not all locations had many farms, hence the minor difference in the number of chosen farmers. All interviewees had their own apple farms in addition to livestock. Perceptions were recorded on the seasonal changes, their impacts on apple production (due to seasonality/other activity), and future adaptation options.

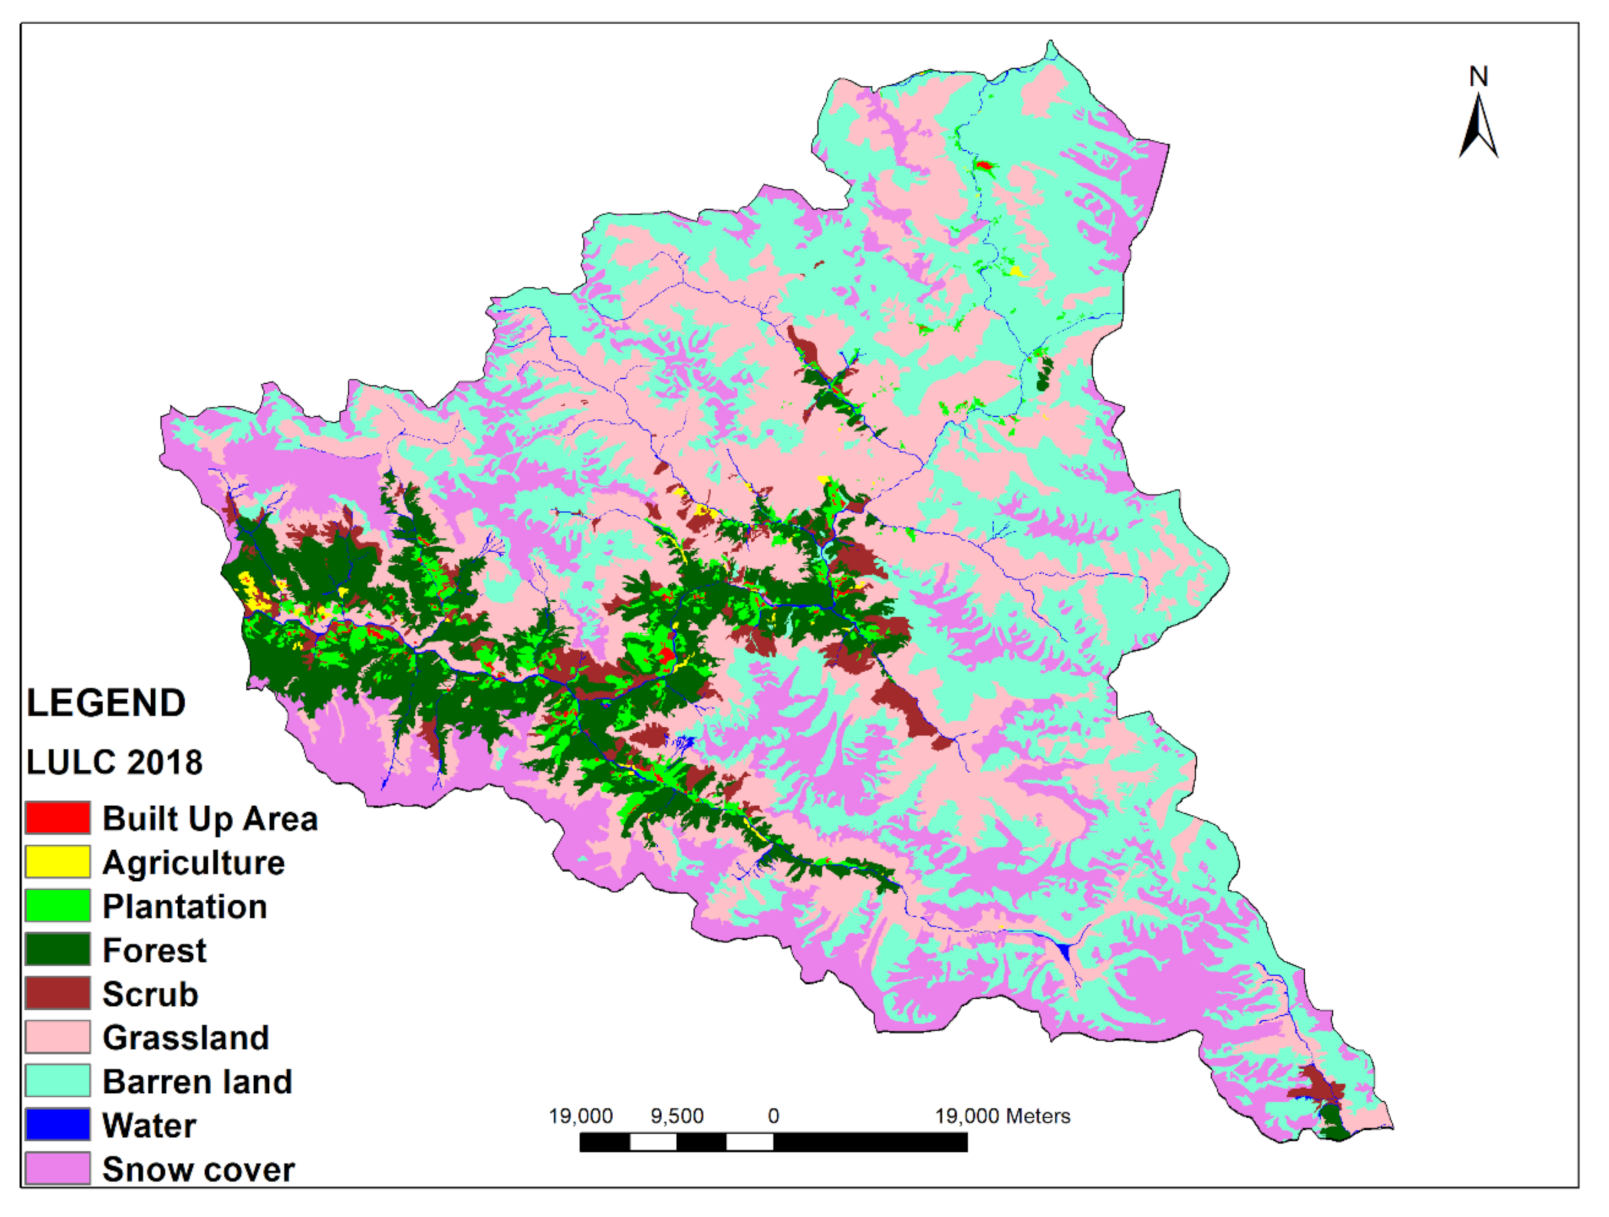
3.2. Land Use Land Cover (LULC)

The study uses orthorectified data from the Landsat-8 Operational Land Imager (OLI) with 30 m spatial resolution data for December 2018 to delineate the LULC. Using the maximum likelihood algorithm, hybrid classification was conducted in ERDAS IMAGINE, as it gives better results in comparison to unsupervised or supervised classification. A total of nine major LULC classes were derived, namely (i) built-up, (ii) agriculture, (iii) plantation, (iv) forest, (v) scrub, (vi) grassland, (vii) barren land, (viii) water, and (ix) snow cover. Ground control points (GCP) were collected during the field visit to the study area in November 2019. The outcome of the LULC assessment was used to select the seven apple orchard control sites. An NDVI time series analysis was conducted specifically for these sites. Therefore, the plantation was considered as a separate class for the LULC classification. The accuracy assessment was conducted using the confusion matrix.

3.3. Time Series Analysis of the MODIS NDVI Data

The use of the MODIS NDVI time series for monitoring vegetation phenology was described by Zhang et al. [34]. It has been used by several studies to detect phenological changes and inter-annual variabilities for different crops [35,36,37,38]. This study also used MODIS onboard the Terra satellite’s MOD13Q1 NDVI to detect seasonality variations. A set of 345 (23 composites per year for 18 years) MODIS NDVI images with 250 m spatial and 16-days temporal resolution covering the entire Kinnaur region were collected from the Land Processes Distributed Active Archive Center (LP DAAC) website for the period January 2004–December 2018. The NDVI data were analyzed to create a pixel-based time series for the seven apple orchard control sites. The MODIS 16-day MOD13Q1 product was computed using a constrained view angle maximum NDVI value (CV-MVC) compositing technique [39] to minimize the atmospheric and cloud effects and the constrained view angles.

Time Series and Extraction of Phenological Matrix

The study used TIMESAT software to process NDVI time series data, which were derived from satellite spectral measurements, while the data gaps were replaced by the 15-year mean values. TIMESAT is considered as one of the best software programs for such studies and is therefore widely used in time series studies and for assessing seasonal phenological matrices [40,41,42]. To remove any residual irregularities in the NDVI values in the composite images, the NDVI time series was smoothed using a Savitsky–Golay (S–G) filter in the TIMESAT software [43]. The S–G filter retains details of the NDVI and smooths the curve, which is beneficial for the high precision information extraction of vegetation phenology [44]. For the SOS and EOS, seasonal-trend decomposition using locally estimated scatterplot smoothing (LOESS STL) was conducted, as it is based on the locally weighted regression smoother. TIMESAT calculated time for the seasonality parameters: SOS, i.e., greening date; EOS, i.e., harvesting date; POS, i.e. booting stage; and LOS, i.e, number of days in the season. The spatial images for SOS, EOS, POS, and LOS for the different altitudes of the study area were also prepared to understand the seasonal variations in apple orchards in the entire district.

3.4. MODIS Normalized Difference Snow Index (NDSI) and Rainfall

Snowfall is one of the major seasonal characteristics of the study area, which is essential for apple production and productivity, as apples require a certain number of chilling hours for growth. Therefore, the study also calculated the NDSI for the entire study area as well as for the seven apple orchard control sites. NDSI was calculated using MODIS MOD09A1.006 Terra Surface Reflectance 8-Day Global with 500 m spatial resolution, and the reflectance of band 4 and band 6 were used for computation purposes using the Google Earth Engine. The NDSI values were then averaged for the snowy season (January to the first week of May). For rainfall, IMD’s gridded rainfall 0.25 × 0.25 degrees daily data were used, from which the values were extracted for the seven apple orchard control sites. Pearson’s correlation analysis was conducted to assess the relationship between the phenological indices, NDSI, and rainfall..

4. Results and Discussion

4.1. Farmers’ Perceptions

The perceptions of the local farmers on landscape change and its impacts are presented in Table 1, with the percentage of farmers who agreed with or noticed those specific changes in the agricultural and overall landscape of the region.
This broad set of perceptions cannot possibly be tested by a single scientific analysis. However, the seasonality changes and the presence of apples at higher altitudes were tested under this study and are presented in Section 4.2 and 4.3. As seen from the farmer perceptions, lower altitudes seem to be at a higher risk for the loss of apple production. Farmers are already planning to shift their farms to higher elevations. In contrast, farmers at higher elevations are growing new orchards due to more stability and less seasonal variability. This is one indicator of climate change. The increased intensity of floods in the apple dominated regions has led to the loss of hundreds of trees in KR2. The farmers also reported that floods that used to come once every 10–15 years now come almost every year, washing away their apple orchards. The rise in scab disease was another concern, which could tarnish the market image of their high-quality apples, popularly known as the ‘Royal Kinnauri apple’. They were concerned about phenological changes that were already visible. People here were reluctant to grow new cultivars, as the current cultivar fetches a higher price. However, in the same region, large farmers preferred to try a new cultivar called the ‘root stock apple’, as it requires less chilling hours but, unfortunately, requires more water for irrigation.
The farmers reported a loss of 25% income as a result of floods in KR3. Farmers from a higher altitude region, KR5, reported an increase in the number of apple orchards and greenery, which had not been seen before. Snowfall was extremely variable for KR1, KR2, and KR3. A similar observation was reported for the region where farmers reported that the onset of early snow in December and January has occurred more infrequently over time [28]. Farmers also reported a change in the type of precipitation, for example, snowfall is being replaced by hail or rain, which actually damages crop production and also leads to an early SOS.

4.2. LULC Assessment

The outcome of the LULC classification of the 2018 data (Table 2 and Figure 3) revealed that grasslands was the major land use class (30%), followed by barren land (29%), and snow cover (24%), while only 9.9% of land was covered by forest and 2.4% by plantations. Water covered 1% of the land area, and agriculture only accounted for 0.29% of land use. Surprisingly, built-up (0.27%) was the smallest land use class in Kinnaur, although there are several ongoing dam-related construction activities in the region. The majority of the settlements were found near the low valleys of the Satluj and Baspa rivers. The results indicated an overall accuracy (OA) and kappa coefficient of 83.20% and Kappa = 0.806, respectively. The confusion matrix is presented in Appendix A (Table A1).
The Digital Elevation Model (DEM) of an Advanced Spaceborne Thermal Emission and Reflection Radiometer (ASTER) with a 30 m resolution was analyzed, which showed that the total area occupied by the plantations, including apple orchards, lies between 1500 and 3500 m amsl. Although these plantations mainly consisted of apple orchards, other fruit crops like apricot, chestnut, and pear were also grown at a few places. Plantation in the region was dominant in the lower elevations, while the higher elevations were either barren or covered with snow. The occurrence of apples at very high altitudes is limited due to extreme climate and harsh living conditions, although local people have reported plantations at higher altitudes due to changes in temperature.

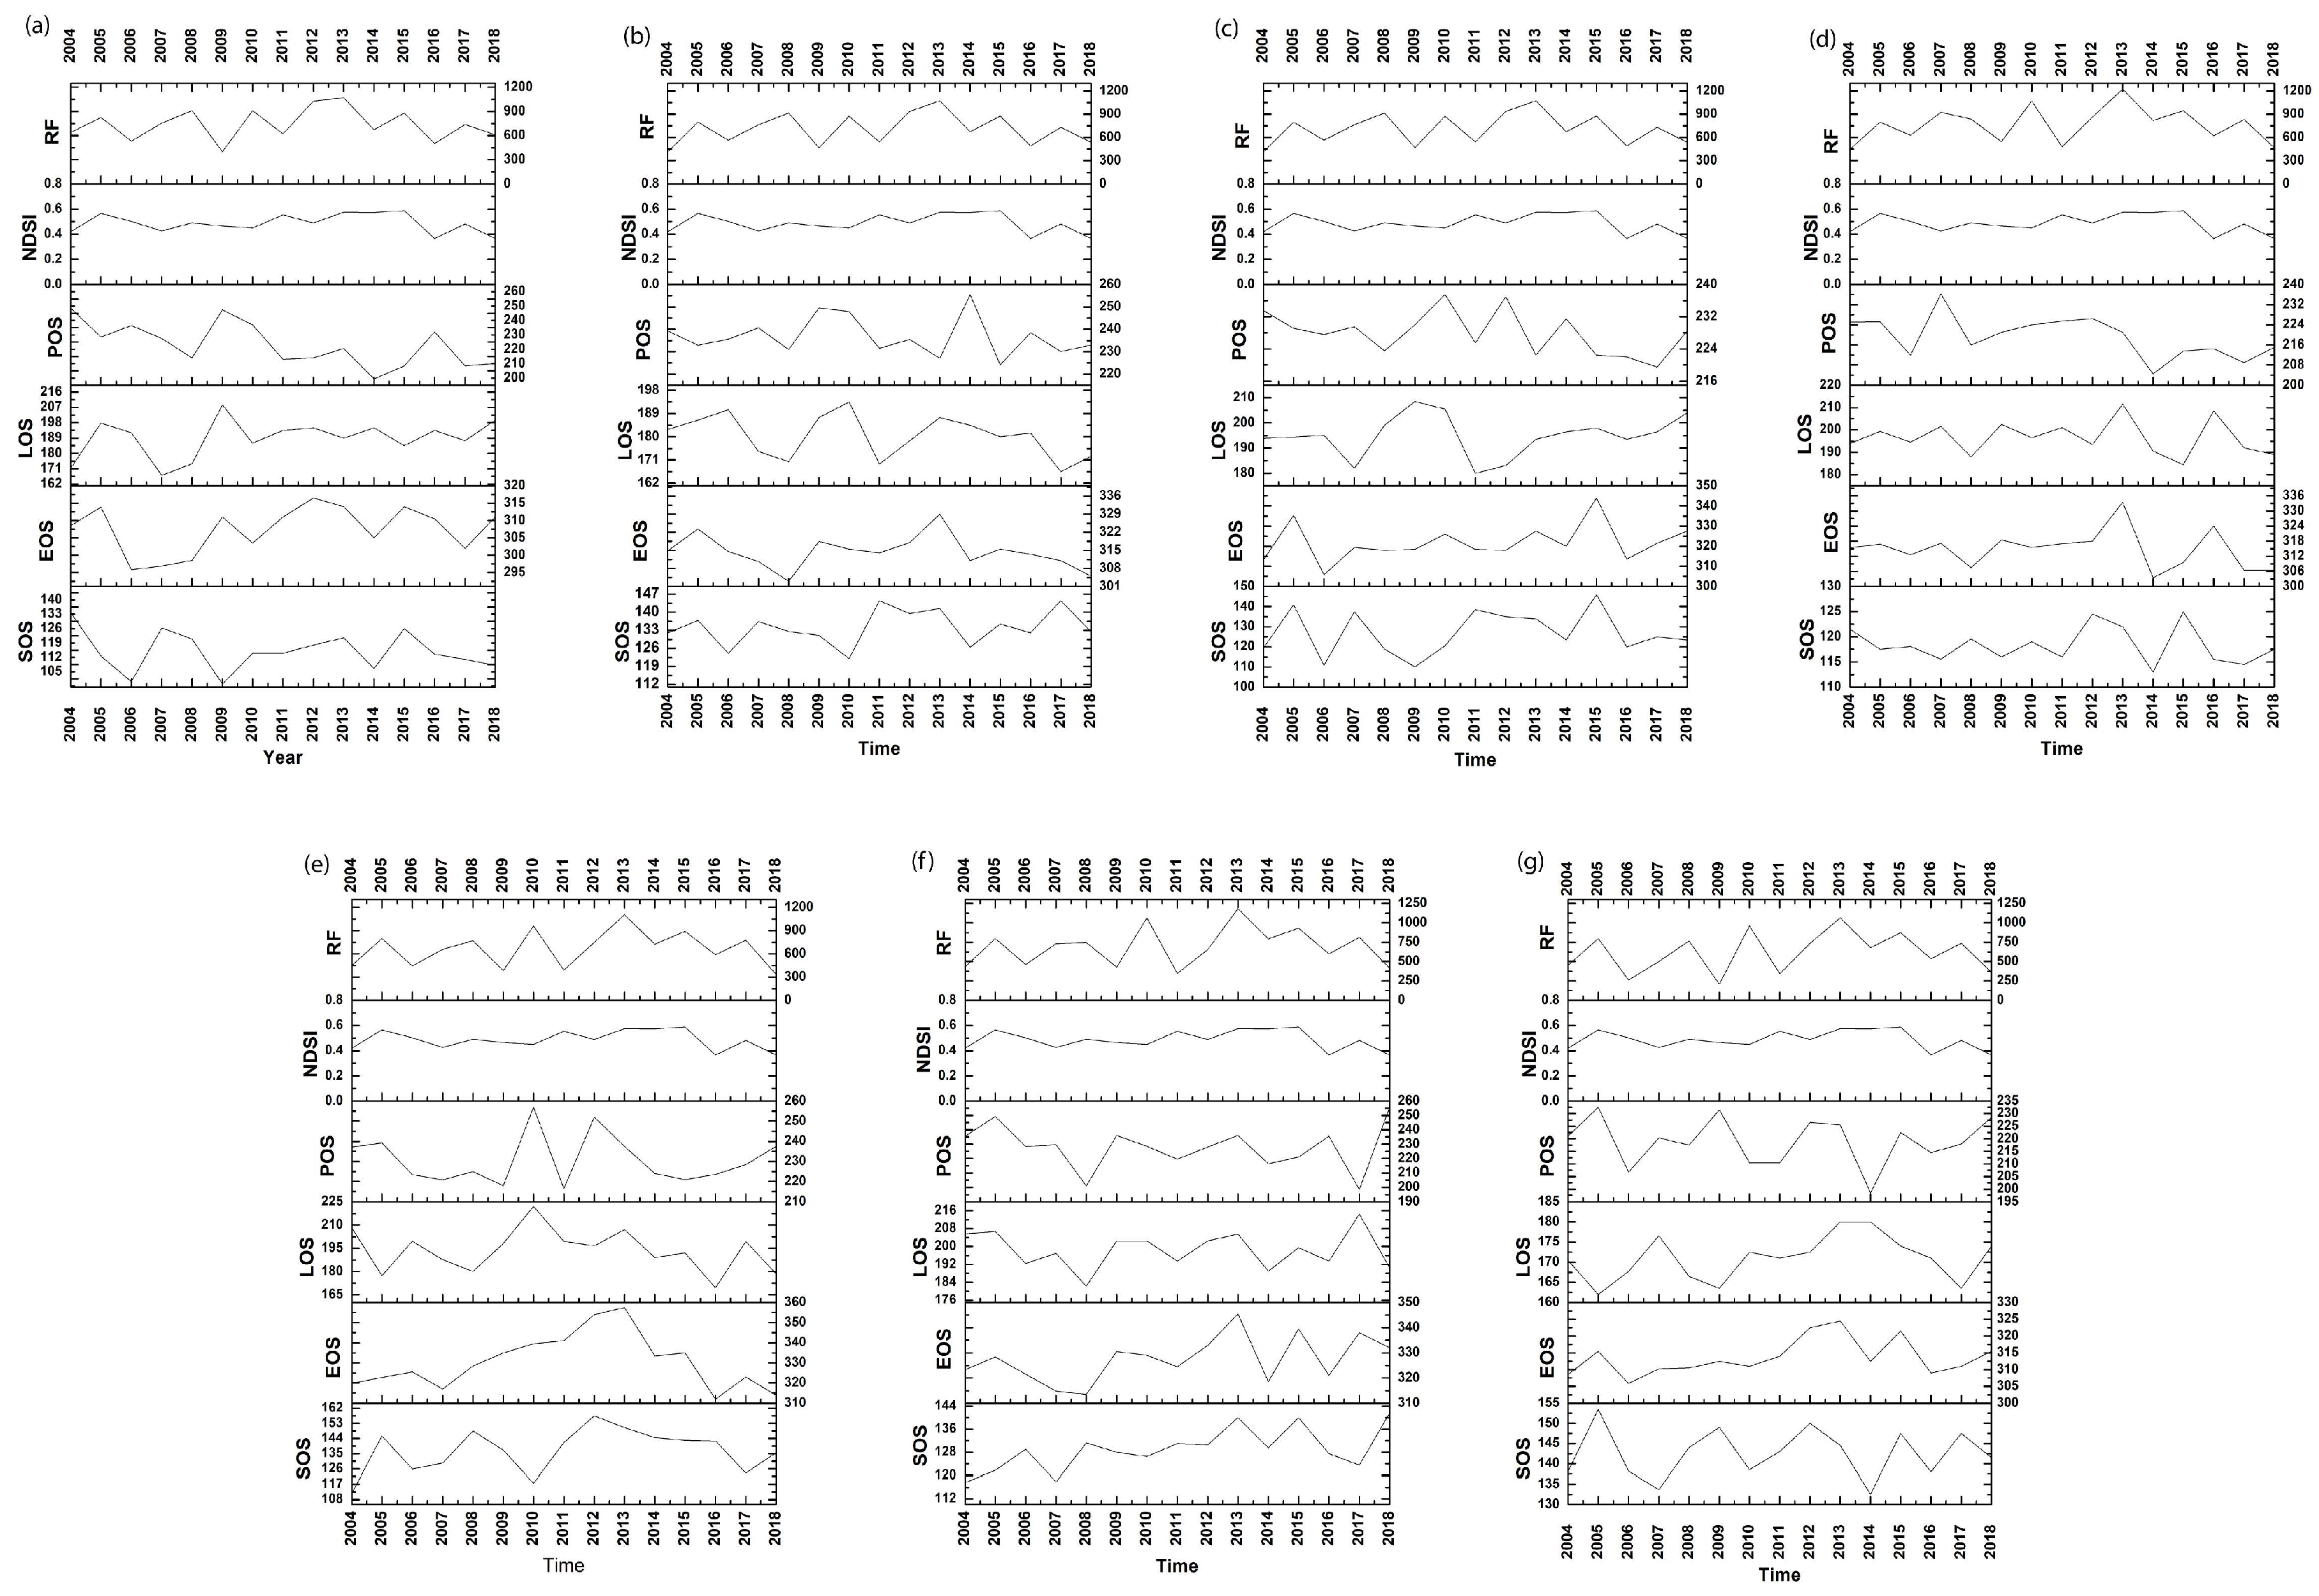
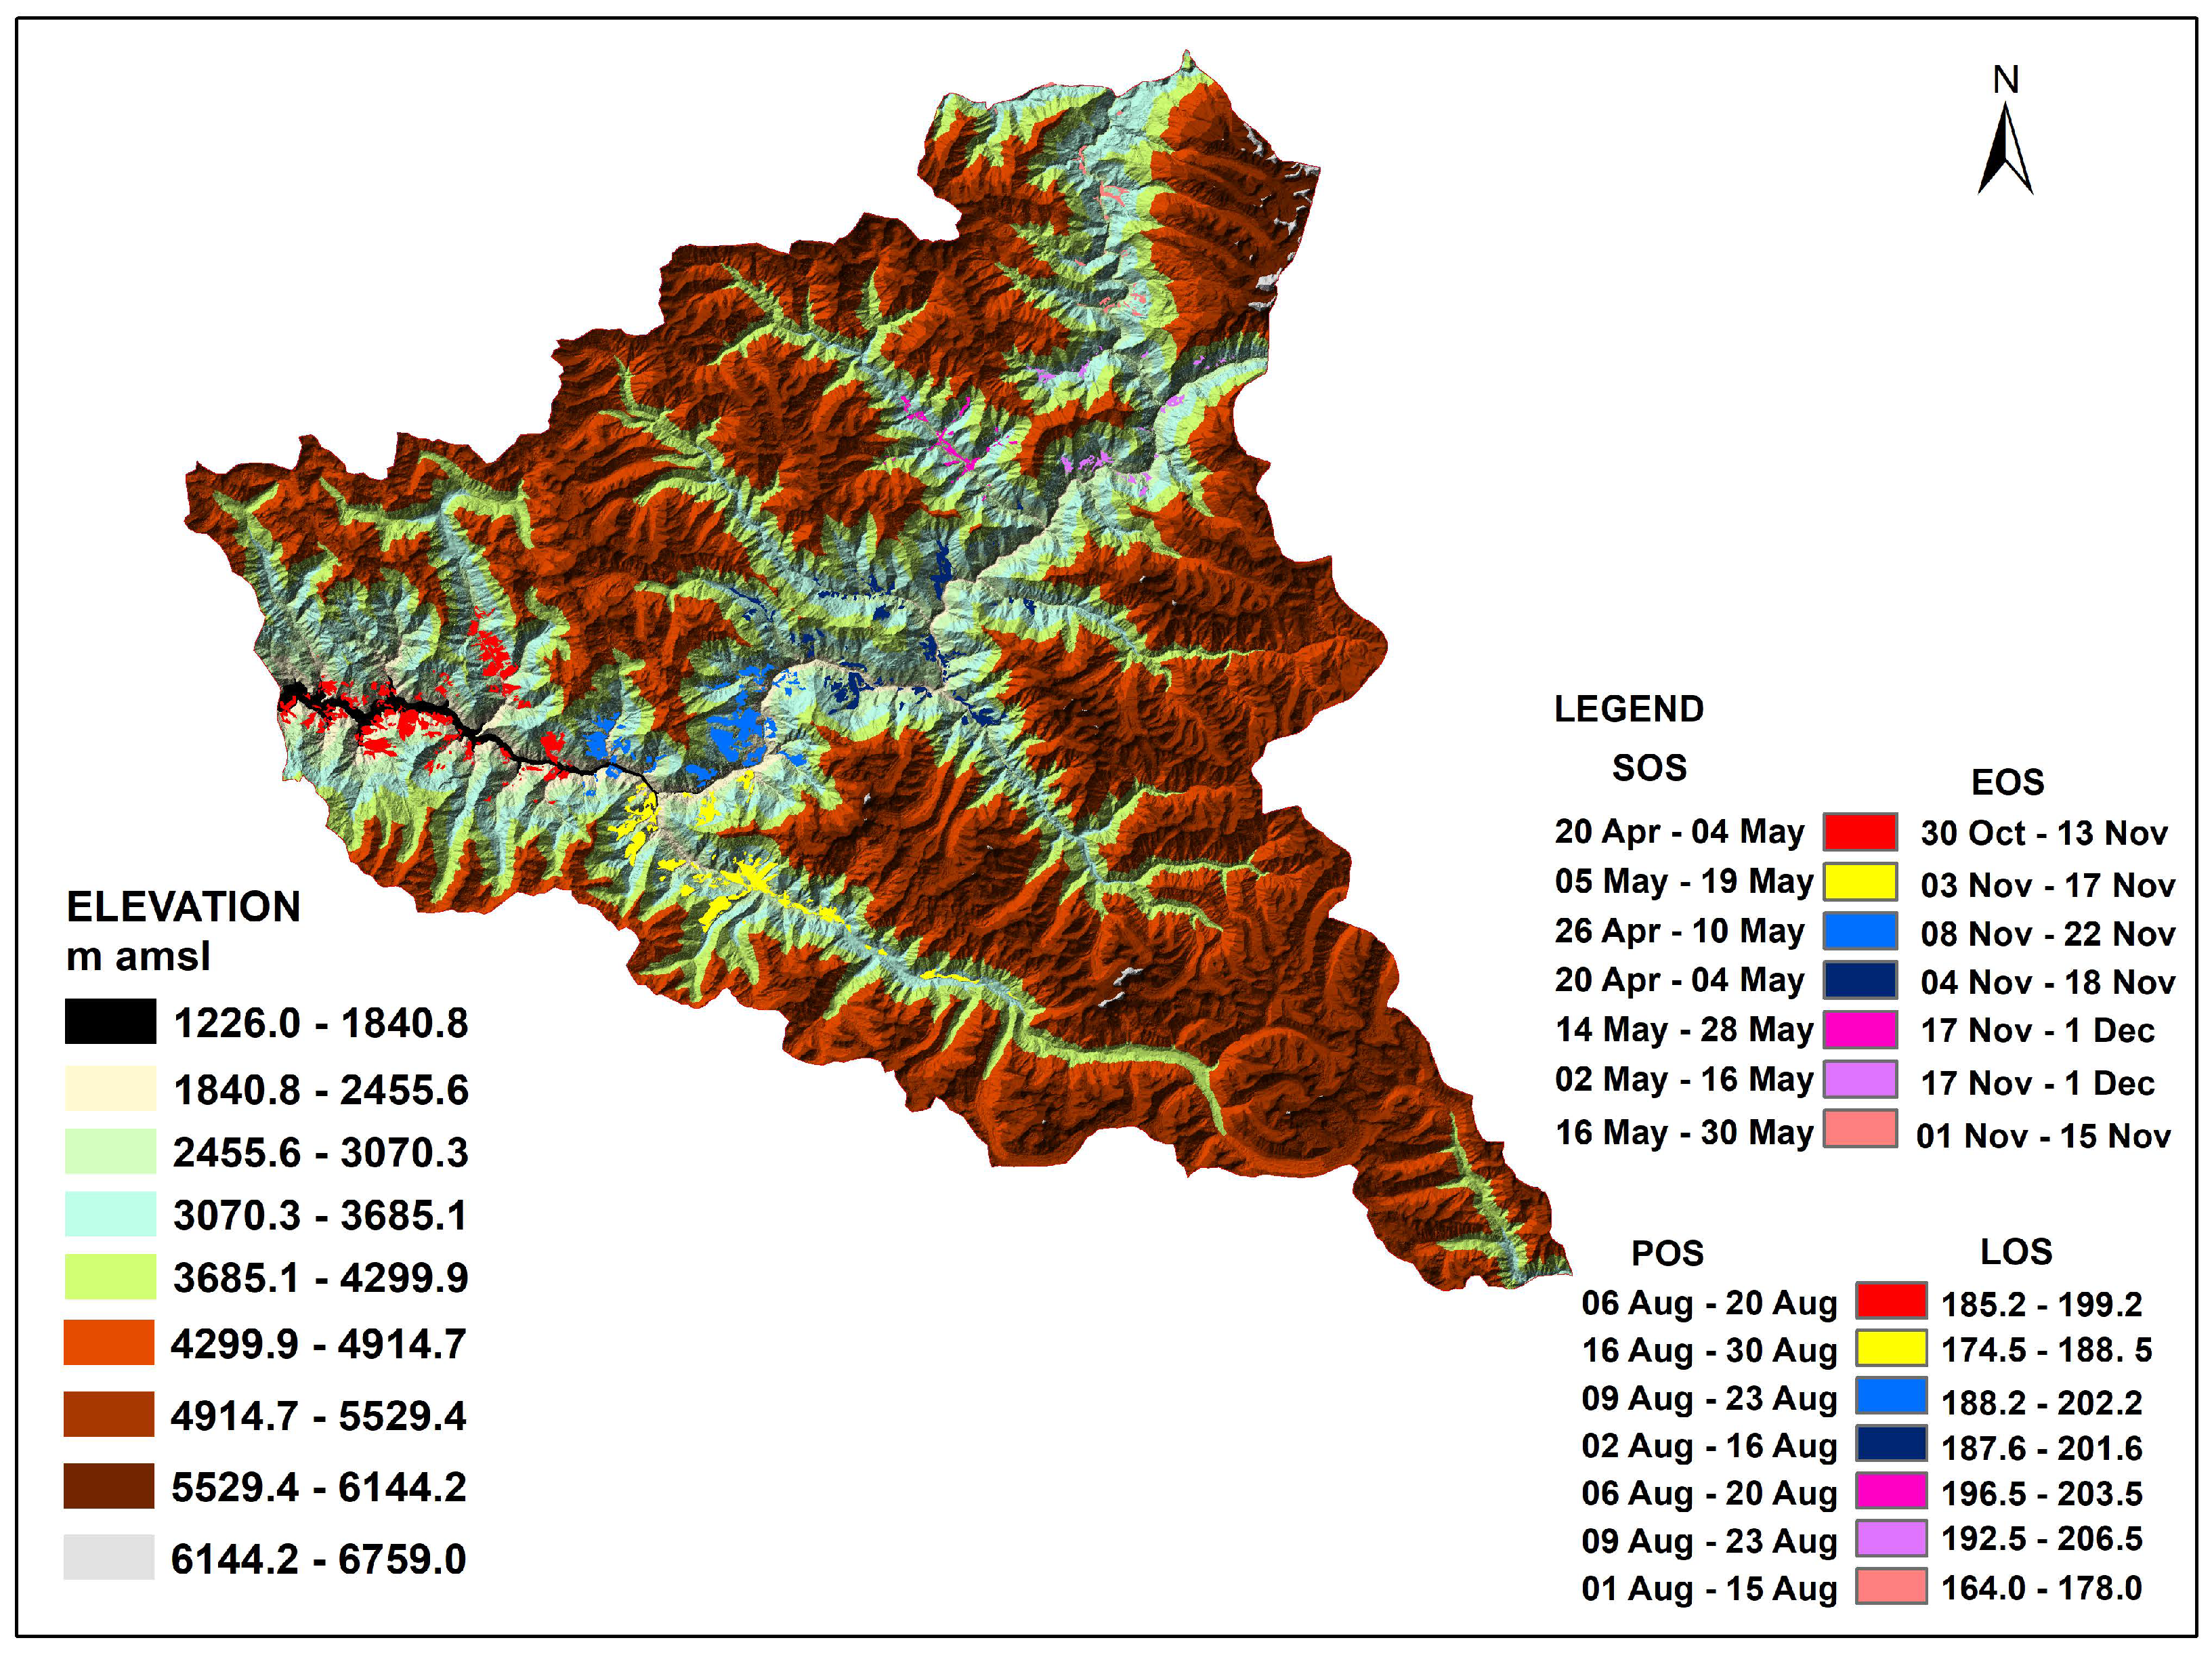
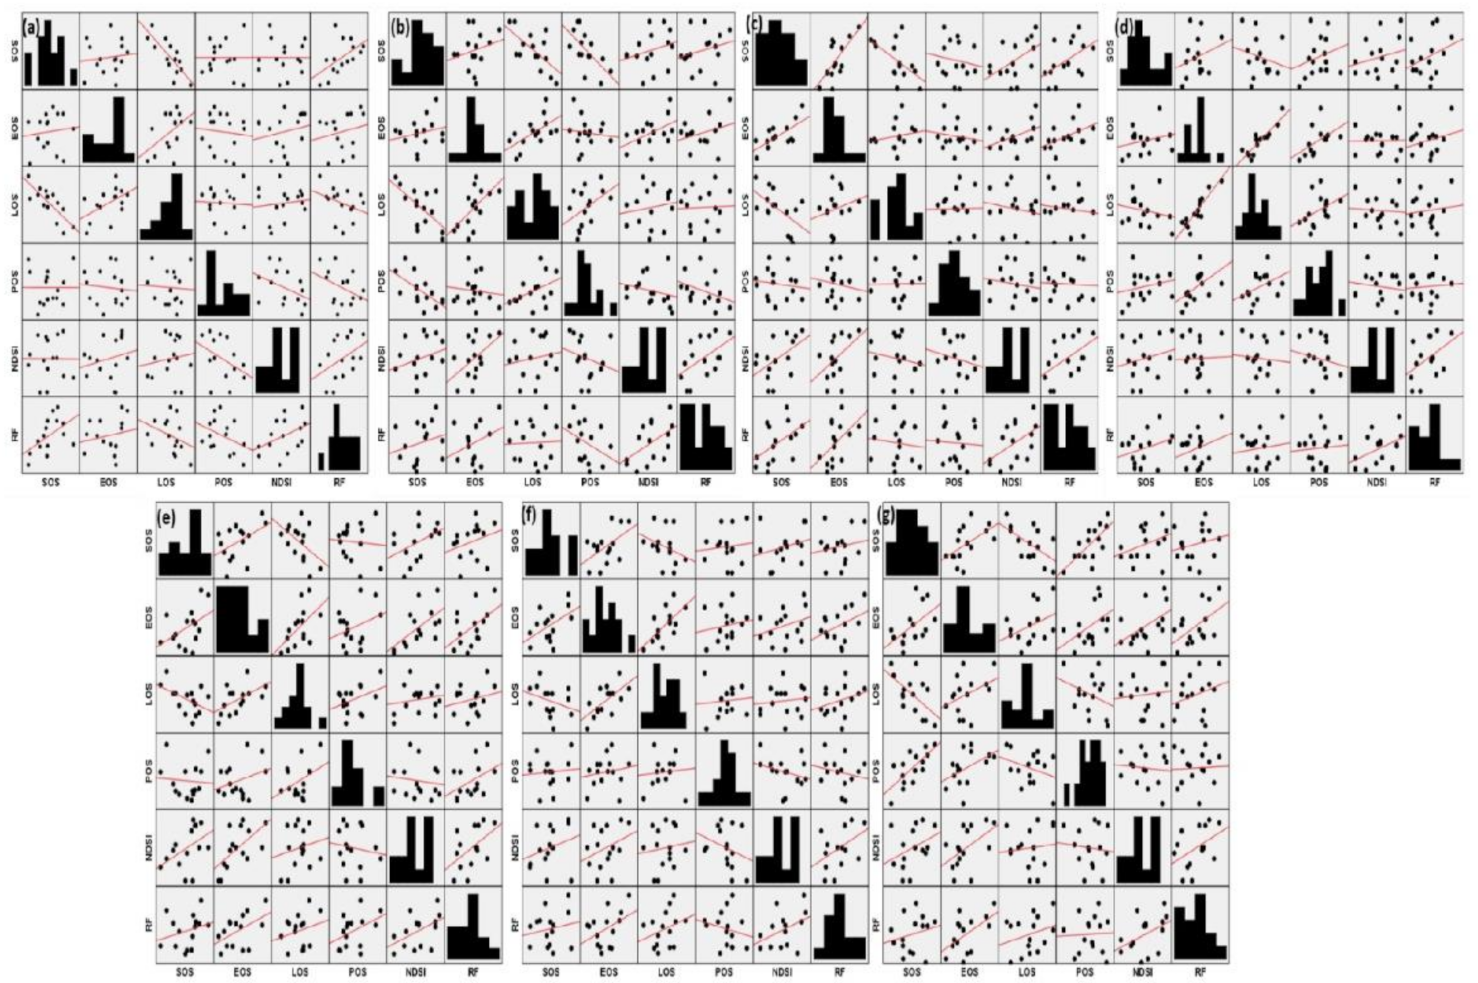
4.3. Variability in Apple Phenology and Seasonality Based on MODIS NDVI Time Series Analysis

Figure 4 presents the temporal variation of the NDVI values from 2004 to 2018 in the seven apple orchard control sites. The blue line represents the actual NDVI value, while the brown line represents the fitted/smoothened NDVI values. Each NDVI cycle shows one apple season, specifically marking the SOS and the EOS (represented by two brown dots for each cycle, respectively) from 2004 to 2018. Most selected locations show near zero NDVI values at the end of December and at the start of the year. An exception from 2015 onwards, where the NDVI values show a rise during the winter period all occurring in the lower elevations and particularly in KR1, KR2, and KR3, thus, indicating marked seasonal variation in the lower altitudes of these districts, is noted. The SOS and EOS points show a slightly increasing trend for KR2, KR3, KR4, KR5, and KR7. High values of NDVI at the SOS may also indicate the thinning of flowering in apple orchards during the blooming period, as the blooming orchards almost gave NDVI values <0.4.
When looking closely at the seasonality matrix, along with the NDSI and rainfall in the same locations (Figure 5a–g), the POS, the LOS, the EOS, and the SOS significantly varied for each location, which shows that both the NDSI and rainfall conditions have a major impact on the apple growth season. The SOS for the KR1 site, which is located at the lowest elevation, ranged from 13 May (in 2004) to 19 April (in 2018) (Figure 5a), while for KR7 (highest elevation), the SOS ranged from 18 May (in 2004) to 23 May (in 2018) (Figure 5g). For all of the high elevation zones (KR5, KR6, and KR7), the SOS was delayed from 2004, while for all low and medium elevation zones, the SOS has either remained stable or has advanced since 2004. An advancement in SOS indicates the warming of the lower elevation zones. Although there were seasonal variations throughout the study period, a comparison of the extremes (Table 3) shows the intensity of the seasonal variations, making it difficult to predict the SOS and EOS.
KR1, KR3, and KR4 share nearly similar LOS despite variations in altitude, while the earliest SOS and EOS is observed in KR1 (lowest altitude). KR2 and KR3 are at nearly the same altitude, but KR2 had a bit of a shorter LOS that could be attributed to a delayed SOS. KR5 and KR7 (both high elevations) also have the latest observed SOS on 6 June and 2 June, respectively. Although the LOS remains the shortest for KR7, the longest season was observed at KR1, 3, 4, 5, and 6, nearly irrespective of the SOS. Early SOS occurred at KR1 and KR4, while late SOS (June) was witnessed at KR7 and KR5, which may be attributed to the elevation differences. KR1, 2, 4, and 7 reflected an early harvesting season, while KR5 and 6 indicated late harvest times. Table 3 shows that based on variance, the highest seasonality variations exist for KR1 and KR6 for the POS, and for KR5 for SOS, EOS, and LOS (the lowest and the highest altitudes, respectively). The variation was low for other locations such as Kalpa (KR3) and Sangla (KR4), which are also popular apple orchard locations.
Figure 6 represents the seasonality variations for the entire plantation region in the district, extrapolated based on the selected apple orchard control sites. This was done to gain a broader idea of the SOS, POS, LOS, and EOS based on altitude with a range of ±7 days from the median of the seasonal matrices. However, this is a generalization of the districts, which depicts early apple blooming in KR1 and KR4 occurring between the end of April and the first week of May and harvested in early to mid-November.
The KR5 and KR7 regions show a later SOS and EOS compared to KR6, pertaining to altitudinal difference. A peculiar finding from these maps (Figure 6) is that although the SOS, EOS, and POS are different for different regions, the LOS remains nearly same for all of the regions irrespective of the altitude, except in the uppermost region, KR7 (Chango).

4.4. Correlation between Seasonality, NDSI and Rainfall

The Pearson correlation was used to understand the correlation between the seasonality parameters, the seasonal NDSI, and the annual rainfall in the seven apple orchard control sites (Figure 7).
The SOS and LOS of the KR1 site indicated a high negative (−0.800 **) (** Correlation is significant at the 0.01 level; * Correlation is significant at the 0.05 level) correlation, thus implying that LOS decreases as the SOS becomes delayed. The SOS of KR2 exhibited a moderate negative correlation with LOS (−0.648 **) and POS (−0.634 *) and a positive correlation with EOS (0.598 *), thus implying that as the SOS shifts towards a longer duration, the EOS also is delayed, but the total LOS reduces significantly. The SOS of KR3 displayed a moderate positive correlation (0.684 **) with the EOS and a moderate negative correlation (−0.567 *) with LOS. The SOS of KR4 also reflected a slightly positive correlation with the EOS and a slight negative correlation with the LOS, a mostly showed characteristics that were identical to the KR-1, 2 and 3 sites. The EOS of this location reflected very a high positive correlation (0.89 **) with the LOS. The SOS at KR5 exhibited a moderate positive correlation (0.461) with the EOS and a moderate negative correlation (−0.485) with the LOS; its EOS indicated a moderate positive correlation (0.552 *) with the LOS. The SOS of KR6 reflected a positive correlation with the EOS 0.509 and a negative correlation (−0.320) with the LOS, while the SOS of KR7 did not indicate a significant relationship with the EOS, but it also indicated a negative correlation (−0.648 **) with the LOS and the correlation (−0.634 *) with the POS. The EOS and the LOS of KR6 and KR7 also exhibited moderate positive correlation values of 0.653 ** and 0.598 *, respectively. Thus, it is incidental that with the delay in SOS or apple blooming, the harvest season also becomes delayed, but surprisingly, the LOS still becomes reduced. However, the SOS of the apple season has not indicated any significant delay from the years from 2004 to 2018, but the early onset of apple blooming in KR1 and KR4 in most of those years hints at the implications of climate change and the reduction of snowfall in the region.
The start of apple season in all of the selected locations, except for in KR-1, indicated a positive correlation with the NDSI. It is clear that snowfall significantly influences the onset of the apple blooming season in these regions. Being at the lowest elevation, KR1 receives less snowfall and is thus less correlated with NDSI. Most importantly, the NDSI and the POS of all of the selected locations reflected a negative correlation thus implying that more snowfall in the area helps in the better growth of apples. Rainfall in these regions indicated a positive correlation with the EOS. Therefore, it can be inferred that the occurrence of more rainfall shifts the EOS towards a longer time or towards the end of the year.

4.5. Main Observations, Policy Recommendations and Limitations

The findings show that seasonal variations in apple growth are already visible, although some regions show higher variability than others, especially those at lower altitudes. Snowfall is reducing in the lower elevation zones and is shown by slightly increasing NDVI in the winter months. These findings are synonymous with farmer perceptions about these altitudes. The land use for the year 2018 and the farmer’s perceptions both point towards apple orchard growth at higher altitudes. Seasonal variations are less at higher altitude regions, and the possibility of the availability of more chilling hours makes apple a favorable crop at higher altitudes. Based on scientific analysis and farmer perceptions, KR1 and 5 seem to be the most vulnerable to seasonality variations. As per farmer perceptions, the temperature rise is further supporting apple orchards at higher altitudes and thus may actually be a boon for this region, while the lower altitudes may become more vulnerable in future. It was also pointed out that Chango (KR7), being a sunny location, had an early EOS in comparison to Ropa (KR5) even though they are both at nearly similar altitudes. This shows that topographic factors, including rain-shadow and sunlight hours also impact the seasonality.
The indication of flower thinning shown by a higher NDVI during SOS is also a matter of concern that was pointed out by the farmers. These changes, which may not seem grave as of yet, actually call for a long-term strategy to empower the local population to protect their livelihoods and a major source of the State’s GDP on a sustainable basis. Therefore, this study recommends (i) making efforts to enhance preparedness towards climatic changes through available meteorological predictions on seasonal variability in the region; (ii) introducing alternate livelihoods or new apple cultivars that require less chilling hours, especially at the lower elevations; and (iii) making provisions for weather-based risk insurance, not only for crop produce, but also for the apple trees to make farmers resilient to climatic vagaries.
While this is a pioneering study on seasonality variations in this district based on the current dataset for only 15 years, it cannot be predicted whether the variations are only caused by climatic changes. Additionally, the exact data for the altitudinal shift of orchards during these past 15 years is unavailable and solely rely on the perceptions of local farmers. This can be accomplished with the help of more precise and more high-resolution cloud-free satellite data for this region. Therefore, even though we claim that higher altitudes are beginning to support apple orchards while the seasonal variation is high, it is difficult to say at which altitude the apple growth will be best. For future studies, the study of climatic variability with both temperature and precipitation data in line with seasonality changes is suggested. A modelling study to predict the condition 20–30 years from now will enhance preparedness efforts in this region.

5. Conclusions

This paper examines the seasonality variations in apple plantations across the district at different elevations. The major findings of this study are (i) high variations in the seasonality of apple plantations for all of the selected locations, with maximum variations at KR1 and KR5, the regions at the lowest and highest altitudes; (ii) indications of reduced snowfall in the lower elevation zones shown by the slightly increasing NDVI in the winter months; (iii) indications of flower thinning shown by a higher NDVI, especially at the SOS, pointing towards reduced output per tree; (iv) a high correlation of both NDSI and rainfall to the growth and seasonality of apple, which shows high dependence on climatic variables; and (v) a high convergence of these findings with farmer perceptions. There is evidence in the academic literature that the apple belt is continuously shifting upward in this State. There is a high chance that this region may see a boon of apple production as the temperature rises and higher altitudes become more suitable for apple orchards. However, lower altitude regions are already facing reduced chilling hours and increased precipitation in the form of rain or hail instead of snow. However, this study does not indicate a complete eradication of apple cultivation from the low altitude regions but rather shows possibilities for the stability of apple cultivation at higher elevations. Low-altitude regions can survive with good adaptation mechanisms, early warning systems, and capacity support. The farmers in these regions already point out seasonal variations, a loss of output per tree, and a lack of adaptation mechanisms to deal with future challenges. Therefore, the key to reducing the vulnerability of these regions is the improvement of the adaptive capacity of the farmers, considering that both exposure and risk are high in this region.

Author Contributions

Conceptualization, H.G. and L.K.; methodology and software, L.K., H.G., M.A. and C.S.R.; formal analysis, H.G. and L.K.; investigation, H.G., L.K. and M.A.; resources, H.G. and C.S.R.; data curation, H.G., L.K., C.S.R. and R.A.; writing—original draft preparation, H.G. and L.K.; writing—review and editing, H.G. and R.A. All authors have read and agreed to the published version of the manuscript.

Funding

This research was funded by Japan Society for the Promotion of Science (JSPS), Kakenhi grant number JP 19F19795. The APC was also funded by the JSPS.

Data Availability Statement

The data that support the findings of this study are openly available at https://earthexplorer.usgs.gov/ for the satellite (LANDSAT 8) data (accessed on 2 December 2019), at https://lpdaac.usgs.gov/ for the MODIS data (accessed on 9 December 2020), and at https://www.imdpune.gov.in/Clim_Pred_LRF_New/Grided_Data_Download.html for the precipitation data (accessed on 21 January 2021).

Acknowledgments

We acknowledge the support of Raj Kumar Gupta and Nayanika Singh for providing valuable comments on the draft. H.G. acknowledges the financial support of JSPS, which was instrumental for the completion of this work.

Conflicts of Interest

The authors declare no conflict of interest.

Appendix A

Table A1. The confusion matrix used for the accuracy assessment.
ClassBuilt Up AreaAgriculturePlantationForestScrubGrasslandBarren LandWaterSnow CoverTotalUser’s Accuracy (%)
Built up area728341205542510092278.95
Agriculture4283958230682700105779.38
Plantation18431415970554000166884.83
Forest018104174674913300206684.51
Scrub63006870961880098971.68
Grassland50514876782665198420320883.07
Barren land572242378322424365638299581.34
Water00000524394078111384.46
Snow cover000007856622078227491.38
Total958100716792047999333629721100219416,292
Producer’s accuracy (%)75.9983.3284.2885.3070.9779.8881.9685.4594.71

References

  1. Negi, G.; Samal, P.; Kuniyal, J.C.; Sharma, R.; Dhyani, P. Impacts of Climate Change on Western Himalayan Mountain Ecosystems: An Overview. Trop. Ecol. 2012, 53, 345–356. [Google Scholar]
  2. Negi, V.S.; Maikhuri, R.K.; Pharswan, D.; Thakur, S.; Dhyani, P.P. Climate Change Impact in the Western Himalaya: People’s Perception and Adaptive Strategies. J. Mt. Sci. 2017, 14, 403–416. [Google Scholar] [CrossRef]
  3. Upgupta, S.; Sharma, J.; Jayaraman, M.; Kumar, V.; Ravindranath, N.H. Climate Change Impact and Vulnerability Assessment of Forests in the Indian Western Himalayan Region: A Case Study of Himachal Pradesh, India. Clim. Risk Manag. 2015, 10, 63–76. [Google Scholar] [CrossRef] [Green Version]
  4. Tewari, V.P.; Verma, R.K.; von Gadow, K. Climate Change Effects in the Western Himalayan Ecosystems of India: Evidence and Strategies. For. Ecosyst. 2017, 4, 13. [Google Scholar] [CrossRef] [Green Version]
  5. Krishnan, R.; Shrestha, A.B.; Ren, G.; Rajbhandari, R.; Saeed, S.; Sanjay, J.; Syed, M.A.; Vellore, R.; Xu, Y.; You, Q.; et al. Unravelling Climate Change in the Hindu Kush Himalaya: Rapid Warming in the Mountains and Increasing Extremes. In The Hindu Kush Himalaya Assessment; Wester, P., Mishra, A., Mukherji, A., Shrestha, A.B., Eds.; Springer International Publishing: Cham, Switzerland, 2019; pp. 57–97. ISBN 978-3-319-92287-4. [Google Scholar]
  6. Wang, Y.; Wu, N.; Kunze, C.; Long, R.; Perlik, M. Drivers of Change to Mountain Sustainability in the Hindu Kush Himalaya. In The Hindu Kush Himalaya Assessment: Mountains, Climate Change, Sustainability and People; Wester, P., Mishra, A., Mukherji, A., Shrestha, A.B., Eds.; Springer International Publishing: Cham, Switzerland, 2019; pp. 17–56. ISBN 978-3-319-92288-1. [Google Scholar]
  7. Dadhwal, V.; Kushwaha, S.; Nandy, S. Monitoring Forests for Sustainability: Remote Sensing Studies in India. Available online: https://www.academia.edu/24647263/Monitoring_Forests_for_Sustainability_Remote_Sensing_studies_in_India (accessed on 12 January 2021).
  8. Wester, P.; Mishra, A.; Mukherji, A.; Shrestha, A.B. The Hindu Kush Himalaya Assessment: Mountains, Climate Change, Sustainability and People; Springer: Cham, Switzerland, 2018; ISBN 978-3-319-92288-1. [Google Scholar]
  9. Negi, C.M. Dynamics of Apple Production in Himachal Pradesh. Agric. Situat. India 2020, 77, 20–30. [Google Scholar]
  10. Sahu, N.; Saini, A.; Behera, S.K.; Sayama, T.; Sahu, L.; Nguyen, V.-T.-V.; Takara, K. Why Apple Orchards Are Shifting to the Higher Altitudes of the Himalayas? PLoS ONE 2020, 15, e0235041. [Google Scholar] [CrossRef] [PubMed]
  11. GoHP. Government of Himachal Pradesh—Economic Survey 2020–2021; Economic and Statistics Department, Himachal Pradesh, India: Kinnaur, India, 2021. [Google Scholar]
  12. Negi, K.; Singh, H.P.; Batish, D.R. Most Prominent Ethno-Medicinal Plants Used by the Tribals of Chhitkul, Sangla Valley. Ann. Plant. Sci. 2015, 4, 943–946. [Google Scholar]
  13. Radha; Puri, S. Phytochemical Screening of Selected Medicinal Plants Used by Migratory Shepherds in Sangla Valley of District Kinnaur, Himachal Pradesh. Ann. Agri Bio Res. 2019, 24, 29–32. [Google Scholar]
  14. Singh, J.; Rajasekaran, A.; Negi, A.K.; Negi, S.P. Utilization of Edible Wild Plants as Supplementary Source of Nutrition by Indigenous Communities in Kinnaur District, Himachal Pradesh, India. Indian For. 2019, 145, 561–577. [Google Scholar]
  15. Bhardwaj, M.; Kandari, L.S.; Negi, T. Survey of Major Ethnomedicinal Plants of District Kinnaur, Himachal Pradesh. Indian J. Plant. Genet. Resour. 2020, 33, 43–51. [Google Scholar] [CrossRef]
  16. DST; IIT Guwahati; IIT Mandi IHCAP. Climate Vulnerability Assessment for the Indian Himalayan Region Using a Common Framework 2019. Available online: https://dst.gov.in/document/reports/climate-vulnerability-assessment-indian-himalayan-region-using-common-framework (accessed on 12 January 2021).
  17. Jamwal, A.; Kanwar, N.; Kuniyal, J.C. Use of Geographic Information System for the Vulnerability Assessment of Landscape in Upper Satluj Basin of District Kinnaur, Himachal Pradesh, India. Geol. Ecol. Landsc. 2019, 1–16. [Google Scholar] [CrossRef] [Green Version]
  18. Maurya, R.; Negi, V.S.; Pandey, B.W. Spatio-Temporal Analysis of Land Use/Land Cover Change through Overlay Technique in Kinnaur District of Himachal Pradesh, Western Himalaya. Sustain. Agri Food Environ. Res. 2020, 9. [Google Scholar] [CrossRef]
  19. Kumar, N.; Yadav, D.N. Coda Q Estimation for Kinnaur Region and Surrounding Part of NW Himalaya. J. Seismol. 2019, 23, 271–285. [Google Scholar] [CrossRef]
  20. Kumar, V.; Gupta, V.; Jamir, I.; Chattoraj, S.L. Evaluation of Potential Landslide Damming: Case Study of Urni Landslide, Kinnaur, Satluj Valley, India. Geosci. Front. 2019, 10, 753–767. [Google Scholar] [CrossRef]
  21. Negi, B.B.; Bhattacharya, S. Environmental and Social Impact of Karcham-Wangtoo Hydropower Project in the Kinnaur District of Himachal Pradesh: A Retrospective Analysis; Jawaharlal Nehru University (JNU): Delhi, India, 2014. [Google Scholar]
  22. Singh, L.; Kumar, H. Large Scale Hydroelectric Projects and Development on the Satluj Basin in Kinnaur District of Himachal Pradesh. Soc. ION 2014, 3, 103–111. [Google Scholar]
  23. Raj, M.; Singh, C.P. Social Implications of Hydro Power Projects for Tribal Communities of Kinnaur in Himalayan Region: Need for Social Work Intervention. Stud. Indian Place Names 2020, 40, 357–370. [Google Scholar]
  24. Vaidya, N.; Kuniyal, J.C.; Chauhan, R. Morphometric Analysis Using Geographic Information System (GIS) for Sustainable Development of Hydropower Projects in the Lower Satluj River Catchment in Himachal Pradesh, India. Int. J. Geomat. Geosci. 2013, 3, 464–473. [Google Scholar]
  25. Chawla, A.; Kumar, A.; Lal, B.; Singh, R.D.; Thukral, A.K. Ecological Characterization of High Altitude Himalayan Landscapes in the Upper Satluj River Watershed, Kinnaur, Himachal Pradesh, India. J. Indian Soc. Remote Sens. 2012, 40, 519–539. [Google Scholar] [CrossRef]
  26. Kulkarni, A.V.; Alex, S. Estimation of Recent Glacial Variations in Baspa Basin Using Remote Sensing Technique. J. Indian Soc. Remote Sens. 2003, 31, 81. [Google Scholar] [CrossRef]
  27. Kumar, A.; Singh, K.N.; Lal, B.; Singh, R.D. Mapping of Apple Orchards Using Remote Sensing Techniques in Cold Desert of Himachal Pradesh, India. J. Indian Soc. Remote Sens. 2008, 36, 387–392. [Google Scholar] [CrossRef]
  28. Rana, R.S.; Bhagat, R.M.; Kalia, V.; Lal, H. The Impact of Climate Change on a Shift of the Apple Belt in Himachal Pradesh; Routledge Handbooks Online: Abingdon, UK; New York, NY, USA, 2011; ISBN 978-1-84971-358-0. [Google Scholar]
  29. Sen, V.; Rana, R.S.; Chauhan, R.C. Aditya Impact of Climate Variability on Apple Production and Diversity in Kullu Valley, Himachal Pradesh. Indian J. Hortic. 2015, 72, 14. [Google Scholar] [CrossRef]
  30. Jamwal, N. Climate Change Hits Himachal’s Famous Apples, Causes the of Frequent Floods. 2019. Available online: https://en.gaonconnection.com/climate-change-hits-himachals-famous-apples-causes-the-of-frequent-floods/ (accessed on 30 January 2021).
  31. Singh, I.J. Impact of Climate Change on the Apple Economy of Himachal Pradesh: A Case Study of Kotgarh Village. 2013. Available online: https://www.semanticscholar.org/paper/Impact-of-Climate-Change-on-the-Apple-Economy-of-A-Singh/02444c17f4cfc7e85c3eee0dee82b97093b4c02f (accessed on 5 February 2021).
  32. Bhat, M.S.; Lone, F.A.; Shafiq, M.u.; Rather, J.A. Evaluation of Long Term Trends in Apple Cultivation and Its Productivity in Jammu and Kashmir from 1975 to 2015. GeoJournal 2019. [Google Scholar] [CrossRef]
  33. Census. Census of India; Office of the Registrar General & Census Commissioner, Ministry of Home Affairs, Government of India: Delhi, India, 2011. [Google Scholar]
  34. Zhang, X.; Friedl, M.A.; Schaaf, C.B.; Strahler, A.H.; Hodges, J.C.F.; Gao, F.; Reed, B.C.; Huete, A. Monitoring Vegetation Phenology Using MODIS. Remote Sens. Environ. 2003, 84, 471475. [Google Scholar] [CrossRef]
  35. Atzberger, C.; Klisch, A.; Mattiuzzi, M.; Vuolo, F. Phenological Metrics Derived over the European Continent from NDVI3g Data and MODIS Time Series. Remote Sens. 2014, 6, 257–284. [Google Scholar] [CrossRef] [Green Version]
  36. Palacios-Orueta, A.; Huesca, M.; Whiting, M.L.; Litago, J.; Khanna, S.; Garcia, M.; Ustin, S.L. Derivation of Phenological Metrics by Function Fitting to Time-Series of Spectral Shape Indexes AS1 and AS2: Mapping Cotton Phenological Stages Using MODIS Time Series. Remote Sens. Environ. 2012, 126, 148–159. [Google Scholar] [CrossRef]
  37. Forkel, M.; Carvalhais, N.; Verbesselt, J.; Mahecha, M.D.; Neigh, C.S.R.; Reichstein, M. Trend Change Detection in NDVI Time Series: Effects of Inter-Annual Variability and Methodology. Remote Sens. 2013, 5, 2113–2144. [Google Scholar] [CrossRef] [Green Version]
  38. Gumma, M.K.; Thenkabail, P.S.; Teluguntla, P.; Rao, M.N.; Mohammed, I.A.; Whitbread, A.M. Mapping Rice-Fallow Cropland Areas for Short-Season Grain Legumes Intensification in South Asia Using MODIS 250 m Time-Series Data. Int. J. Digit. Earth 2016, 9, 981–1003. [Google Scholar] [CrossRef] [Green Version]
  39. Huete, A.; Didan, K.; Miura, T.; Rodriguez, E.P.; Gao, X.; Ferreira, L.G. Overview of the Radiometric and Biophysical Performance of the MODIS Vegetation Indices. Remote Sens. Environ. 2002, 83, 195–213. [Google Scholar] [CrossRef]
  40. Chen, Y.; Lu, D.; Moran, E.; Batistella, M.; Dutra, L.V.; Sanches, I.D.; da Silva, R.F.B.; Huang, J.; Luiz, A.J.B.; de Oliveira, M.A.F. Mapping Croplands, Cropping Patterns, and Crop Types Using MODIS Time-Series Data. Int. J. Appl. Earth Obs. Geoinf. 2018, 69, 133–147. [Google Scholar] [CrossRef]
  41. De Castro, A.I.; Six, J.; Plant, R.E.; Peña, J.M. Mapping Crop Calendar Events and Phenology-Related Metrics at the Parcel Level by Object-Based Image Analysis (OBIA) of MODIS-NDVI Time-Series: A Case Study in Central California. Remote Sens. 2018, 10, 1745. [Google Scholar] [CrossRef] [Green Version]
  42. Hutchinson, J.M.S.; Jacquin, A.; Hutchinson, S.L.; Verbesselt, J. Monitoring Vegetation Change and Dynamics on U.S. Army Training Lands Using Satellite Image Time Series Analysis. J. Environ. Manag. 2015, 150, 355–366. [Google Scholar] [CrossRef] [PubMed]
  43. Jönsson, P.; Eklundh, L. Seasonality Extraction by Function Fitting to Time-Series of Satellite Sensor Data. IEEE Trans. Geosci. Remote Sens. 2002, 40, 1824–1832. [Google Scholar] [CrossRef]
  44. Deng, G.; Zhang, H.; Yang, L.; Zhao, J.; Guo, X.; Ying, H.; Rihan, W.; Guo, D. Estimating Frost during Growing Season and Its Impact on the Velocity of Vegetation Greenup and Withering in Northeast China. Remote Sens. 2020, 12, 1355. [Google Scholar] [CrossRef]
Figure 1. Location Map of the Study area.
Agriculture 11 00724 g001
Figure 2. Data and methods used for the analysis.
Agriculture 11 00724 g002
Figure 3. LULC for 2018.
Agriculture 11 00724 g003
Figure 4. Seasonality time series of the selected apple orchard sites (a) KR1, (b) KR2, (c) KR3, (d) KR4, (e) KR-5, (f) KR6, and (g) KR7.
Agriculture 11 00724 g004
Figure 5. Graphs showing the variability of seasonality parameters, seasonal NDSI, and Rainfall in the selected apple orchard sites from 2004–2018: (a) KR1, (b) KR2, (c) KR3, (d) KR4, I KR-5, (f) KR6, and (g) KR7.
Agriculture 11 00724 g005
Figure 6. Seasonality variations in plantation land use in the district.
Agriculture 11 00724 g006
Figure 7. Correlation between seasonality parameters, seasonal NDSI, and Rainfall in the selected apple orchard sites: (a) KR1, (b) KR2, (c) KR3, (d) KR4, I KR-5, (f) KR6, and (g) KR7.
Agriculture 11 00724 g007
Table 1. Farmers’ perceptions.
Agriscape Change/ImpactFarmer Perceptions% Age of Farmers
Winter chill reduction for the apple cropDecrease in chilling hours, especially in locations KR-1, 2, and 3. Overall yield impacted for years when snowfall is less.70
Seasonal variationsSeasonal variations are much higher than a decade back at nearly all altitudes, with the maximum at lower altitudes.100
Loss of water resource for irrigationDecrease of water resources in almost all locations, especially at lower altitudes where large and small hydro have taken over irrigation channels.80
Apple yield reductionFarmers from KR1 and 2 reported loss of production due to landslides and floods. Others reported an increase.40
Apple production per treeApple production per tree has gone down, thinning of flowers during SOS, blasting for construction affected recent yields.90
Apple qualityKR2 reported scab disease (caused by the fungus Cladosporium cucumerinum) lowering its market value, attributed to seasonal change and water availability.15
Presence of apple orchards at high altitudes.There is emergence of apple orchards at higher altitudes, which was originally a cold desert. Climatic changes are shifting apple orchards to higher zones, and people living at those altitudes seemed to be happy with this change.100
Reduced snowfall in the lower elevation zonesDecrease and variation in snowfall in the KR1 region. More acceptability in this region for the new cultivar called ‘root stock apple,’ which needs comparatively less chilling hours.90
Variability in the type of precipitationThere is increased variability in the type of precipitation (hail/snow). Loss of apple production when snowfall was less or was replaced by hail (KR1, 2, and 3).70
Changes in climate and extreme eventsThere are increased landslides and extreme events, especially floods. Changes in snowfall pattern.100
Linkages of SOS with snowfall.Snowfall in the later months of spring delays the flowering, thus delaying SOS. Heavy snowfall is needed for good apple produce. Low altitude regions are increasingly facing difficulties during some seasons due to a lack of and variability in snowfall.100
Financial loss due to loss of yieldKR2 and 3 reported financial losses as a result of developmental activities, floods, and landslides.20
Preference for new cultivarKR1, 2, and 3 were keen to accept newer cultivars requiring less chilling hours.50
Table 2. LULC classes and their percentage of the geographical area in 2018.
Class No.LULC Class TypeArea in km2%
1Built up area17.130.27
2Agriculture18.490.29
3Plantation154.462.40
4Forest6386.89.90
5Scrub187.112.90
6Grassland1941.3630.11
7Barren land1886.6429.26
8Water64.711.00
9Snow cover1540.0023.88
Total6448.58100
Table 3. Extremes of seasonal variations in the selected locations.
SiteElevation (m amsl)SOS RangeVar.POS RangeVar.LOS RangeVar.EOS RangeVar.
LowHighLowHighLowHighLowHigh
KR1 (Nichar)201412 Apr17 May93.4623 Jul10 Sep226.53167208124.0722 Oct12 Nov45.30
KR2 (Sangla)27232 May24 May45.8811 Aug12 Sep75.8116619367.8830 Oct25 Nov41.48
KR3 (Kalpa)277520 Apr26 May121.617 Aug25 Aug29.8318020867.771 Nov10 Dec86.47
KR4 (Moorang)250323 Apr5 May12.8123 Jul24 Aug67.1918421157.7430 Oct29 Nov58.94
KR5 (Ropa)316321 Apr6 Jun167.444 Aug14 Sep149.45169222189.618 Nov23 Dec184.20
KR6 (Namgia Khas)280027 Apr21 May54.0917 Jul12 Sep236.3218221469.939 Nov11 Dec84.69
KR7 (Chango)306612 May2 Jun37.7317 Jul20 Aug91.8216218031.451 Nov20 Nov29.32
Publisher’s Note: MDPI stays neutral with regard to jurisdictional claims in published maps and institutional affiliations.

