
Optimization of Structure Parameters of the Grouser Shoes for Adhesion Reduction under Black Soil


1
Key Laboratory of Bionic Engineering, Ministry of Education, Jilin University, Changchun 130025, China
2
College of Biological and Agricultural Engineering, Jilin University, Changchun 130025, China
3
Agricultural Experimental Base, Jilin University, Changchun 130062, China
4
Chinese Academy of Agricultural Mechanization Sciences, Beijing 100083, China
*
Author to whom correspondence should be addressed.
Agriculture 2021, 11(8), 795; https://0-doi-org.brum.beds.ac.uk/10.3390/agriculture11080795
Submission received: 8 August 2021
/
Accepted: 18 August 2021
/
Published: 20 August 2021
(This article belongs to the Special Issue Agricultural Structures and Mechanization)
Abstract
:The black soil of Northeast China has a strong adhesion ability because of its unique physical properties, and the soil often adheres to the surface of the grouser shoes of tracked vehicles during the operation. The adhesion performance depends largely on structure parameters of the grouser shoes. The grouser height, the grouser thickness, and the grouser splayed angle were selected as structure parameters. The adhesion force and adhesive soil mass were selected as indicators of adhesion performance. Therefore, the mathematical model between structure parameters and response indicators was established by the response surface method (RSM). The optimal parameters combination was that the grouser height was 20 mm, grouser thickness was 6.34 mm, and grouser splayed angle was 40.45°. The average data of verification experiments occurred when the adhesion force reached 1.11 kPa and adhesive soil mass reached 22.68 g. Compared with the average value of un-optimized experiment results, the adhesion force and adhesive soil mass reduced by 12.84% and 4.63%, respectively. The relative error of the predicted values and measured values was less than 5%, proving the reliability of the regression models. This study could provide a reference method for parameters optimization, and a new structure of the grouser shoes of tracked vehicles will be designed to reduce adhesion.
1. Introduction
Black soil is mainly distributed in the Northeast China, with high moisture content, low soil porosity, stickiness, and easy agglomeration [1,2]. After the rainy season, the moisture content often exceeds 20% which is close to rheological properties, therefore, the adhesion performance is very prominent [3,4]. Because of the strong adhesion, the phenomenon of soil adhesion frequently occurs between the soil and the grouser shoes of tracked vehicles, which significantly increases the energy consumption and the working resistance and has greatly affected the production efficiency [5,6,7].
In order to reduce the undesirable influence of the soil adhesion, various studies have been carried out in the past few years. Massah et al. [8] designed a bionic electro-osmotic soil-engaging plate to investigate the effect of several design and functional parameters on soil adhesion reduction during a simulated tillage operation. The results showed that using the bionic electro-osmosis technology, plates’ soil adhesion reduced by 29.8%. Barzegar et al. [9] applied the ultra-high molecular weight polyethylene (UHMW-PE) to the surface of tine compared with the uncoated tine in the heavy clay soil to evaluate the soil-tool adhesion of the UHMW-PE-coated tine. The soil did not adhere to the UHMW-PE plastic tine while moving through the heavy clay soil. The results presented the self-scouring ability and low adhesion characteristics of UHMW-PE. Marani et al. [10] studied the effect of Nano-coating materials on reduction of soil adhesion and external friction and developed a precise measuring system to measure the adhesion and friction coefficient of soil and metal. Nano-coated plates exhibited a much lower friction angle and less adhesion than steel due to hydrophobic surfaces and roughness in the nanoscale. Ucgul et al. [11] accounted for the soil adhesion and cohesion by using the hysteretic spring contact model to establish the three-dimensional discrete element modelling (DEM) of tillage. Results of modelling the direct shear test showed that the DEM could predict tillage draft and vertical tillage forces in a range of soil and operating conditions. Zenkov et al. [12,13] analyzed the temperature–time characteristics of three self-regulating heating elements and presented the thermal effect as a method to combat ground-and-machine part adhesion. For reducing the adhesion of soils to working bodies of machines, an intermediate layer at the interface between the phases of the system was created, similar to a screen for intermolecular interaction forces of phases, which has a lubricating effect. Ren et al. [14,15,16], based on the principles of bionics, used the electro-osmosis method to reduce adhesion of soil against loading shovel and designed and tested the pole plates of the non-smooth surfaces with different dimensions. The results showed that the adhesion of soil to a shovel was substantially reduced at a low electro-osmosis voltage. Meanwhile, theoretical analysis was carried out to reveal the mechanism of resistance reduction/anti-adhesion. Tong et al. [17] studied the geometrical features and wettability of dung beetles and discovered that the head was similar to bulldozing blades, and the forelegs have a tooth-like structure with strong burrowing ability. Wang et al. [18] used the mild steel plate as a model to study on the use of vibration to reduce soil adhesion. The vibration was produced by blowing compressed air, and the frequencies between 60 Hz and 100 Hz were significantly effective in removing soil from the blade during operation. The study explored a new mechanism to prevent soil adhesion to machines. Jia et al. [19] analyzed the characteristic of earthworm motion and designed the anti-adhesion structure of a press roller, which revealed the anti-adhesion mechanism of the rubber bulge structure. Field experiments showed that the press roller with rubber bulge structure had a lower adhesive soil mass than the conventional press roller. Sun et al. [20] extracted and analyzed the features of the bear claws and designed a new soil plowing device for resistance reduction/anti-adhesion using the discrete element method (DEM) simulation of the bear-claw bionic ditcher to verify the accuracy of the model and obtained the motion characteristics. Zhang et al. [21] and Sun et al. [22] summarized the biological structures of some soil-burrowing animals by designing and developing the biomimetic disc furrow opener and other tillage implements, which presented the application of biomimetic for designing soil-engaging tillage implements in Northeast China. From the present research, it could be concluded that the methods of the biomimetic of bionic electro-osmotic, the UHMW-PE/Nano coating, the DEM simulation, the self-regulating heating effect, the mechanical vibration, and the biomimetic of soil-burrowing animals are commonly used to reduce the soil adhesion.
However, almost all researchers focused on the tractive performance of the grouser shoes of tracked vehicles [23,24,25,26]. Additionally, the soil types were mainly paddy soil, clay soil, and red soil that were distributed in the south. Therefore, there is a paucity of theory and method to estimate the effect of structure parameters of the grouser shoes of tracked vehicles on the adhesion performance under black soil in Northeast China. To address the above problem, the theoretical analysis based on the Bekker’s sinkage model needs to be built to explore the impact factors of structure parameters of the grouser shoes on the adhesion force. Furthermore, the appropriate structure parameters (i.e., the grouser height, the grouser thickness, and the grouser splayed angle) and the response indicators of adhesion performance (i.e., the adhesion force and adhesive soil mass) also should be optimized synchronously.
The objectives of this study were to: (a) evaluate the adhesion performance of the grouser shoes with different structure parameters; (b) utilize the RSM to optimize the structure parameters of the grouser shoes of tracked vehicles for minimum soil adhesion; (c) establish the verification experiment in the soil bin to verify the performance of the optimal structure parameters on soil adhesion reduction.
2. Materials and Methods
2.1. Soil Sampling
The soil samples were collected from the Agricultural Experimental Base of Jilin University (N43°56′45.99″, E125°14′52.44″) in Changchun, Jilin province, Northeast China. In order to simulate the real subsidence amount of tracked vehicles working in the field, considering the previous crop of the test field was mainly wheat, the depth of the plow layer was between 250 mm and 300 mm. Therefore, we selected the characterization of the soil samples up to 300 mm from the surface for the adhesion test. The soil stress distribution was uniform under the compaction of the crawler walking mechanism [27]. The black soil physical properties of each sample are listed in Table 1. The test was repeated three times on the same condition to obtain the precise results. The average hardness of the black soil was 854 kPa, measured by a SC-900 soil hardness tester (Spectrum Technologies Inc., Aurora, IL, USA). The average bulk density of the black soil was a 1269 kg/m3, measured by a TJSD-750-IV soil bulk density determination detector. The results showed that the bulk density was positively correlated with the hardness.
The soil moisture content has an important effect on the adhesion force, and the mechanical properties of soil samples vary greatly under different moisture contents. The study mainly optimized different structure parameters of the grouser shoes for adhesion reduction. In order to minimize the influence of other variables on the study, we performed the experiments at only one soil moisture content. Additionally, we tested the plastic limit and liquid limit of soil samples by using the LP-100D digital display soil liquid-plastic limit combined tester (Kedaluqiao Electric Equipment Co., Ltd., Cangzhou, China). The plastic limit and the liquid limit of soil samples were 15.83% and 32.25%, respectively. The average moisture content of each layer of soil samples was dried in a DZF-6050 thermostatic drying oven (Rongshida Electric Equipment Co., Ltd., Kunshan, China) at 105 ± 5 °C for 6 h.
The soil moisture content for all the soil samples was in the range of 19.87–24.31%, and the average moisture content was 21.82% (d.b.) (i.e., dry basis). The results showed that the soil samples were higher than the plastic limit and lower than the liquid limit. Overall, the average moisture content of all the soil samples were within the plastic state, which had a strong adhesion to the grouser shoes of tracked vehicles. This critically restricted the efficiency of the tracked vehicles during the operation.
2.2. Vertical Stress Analysis of the Grouser Shoes
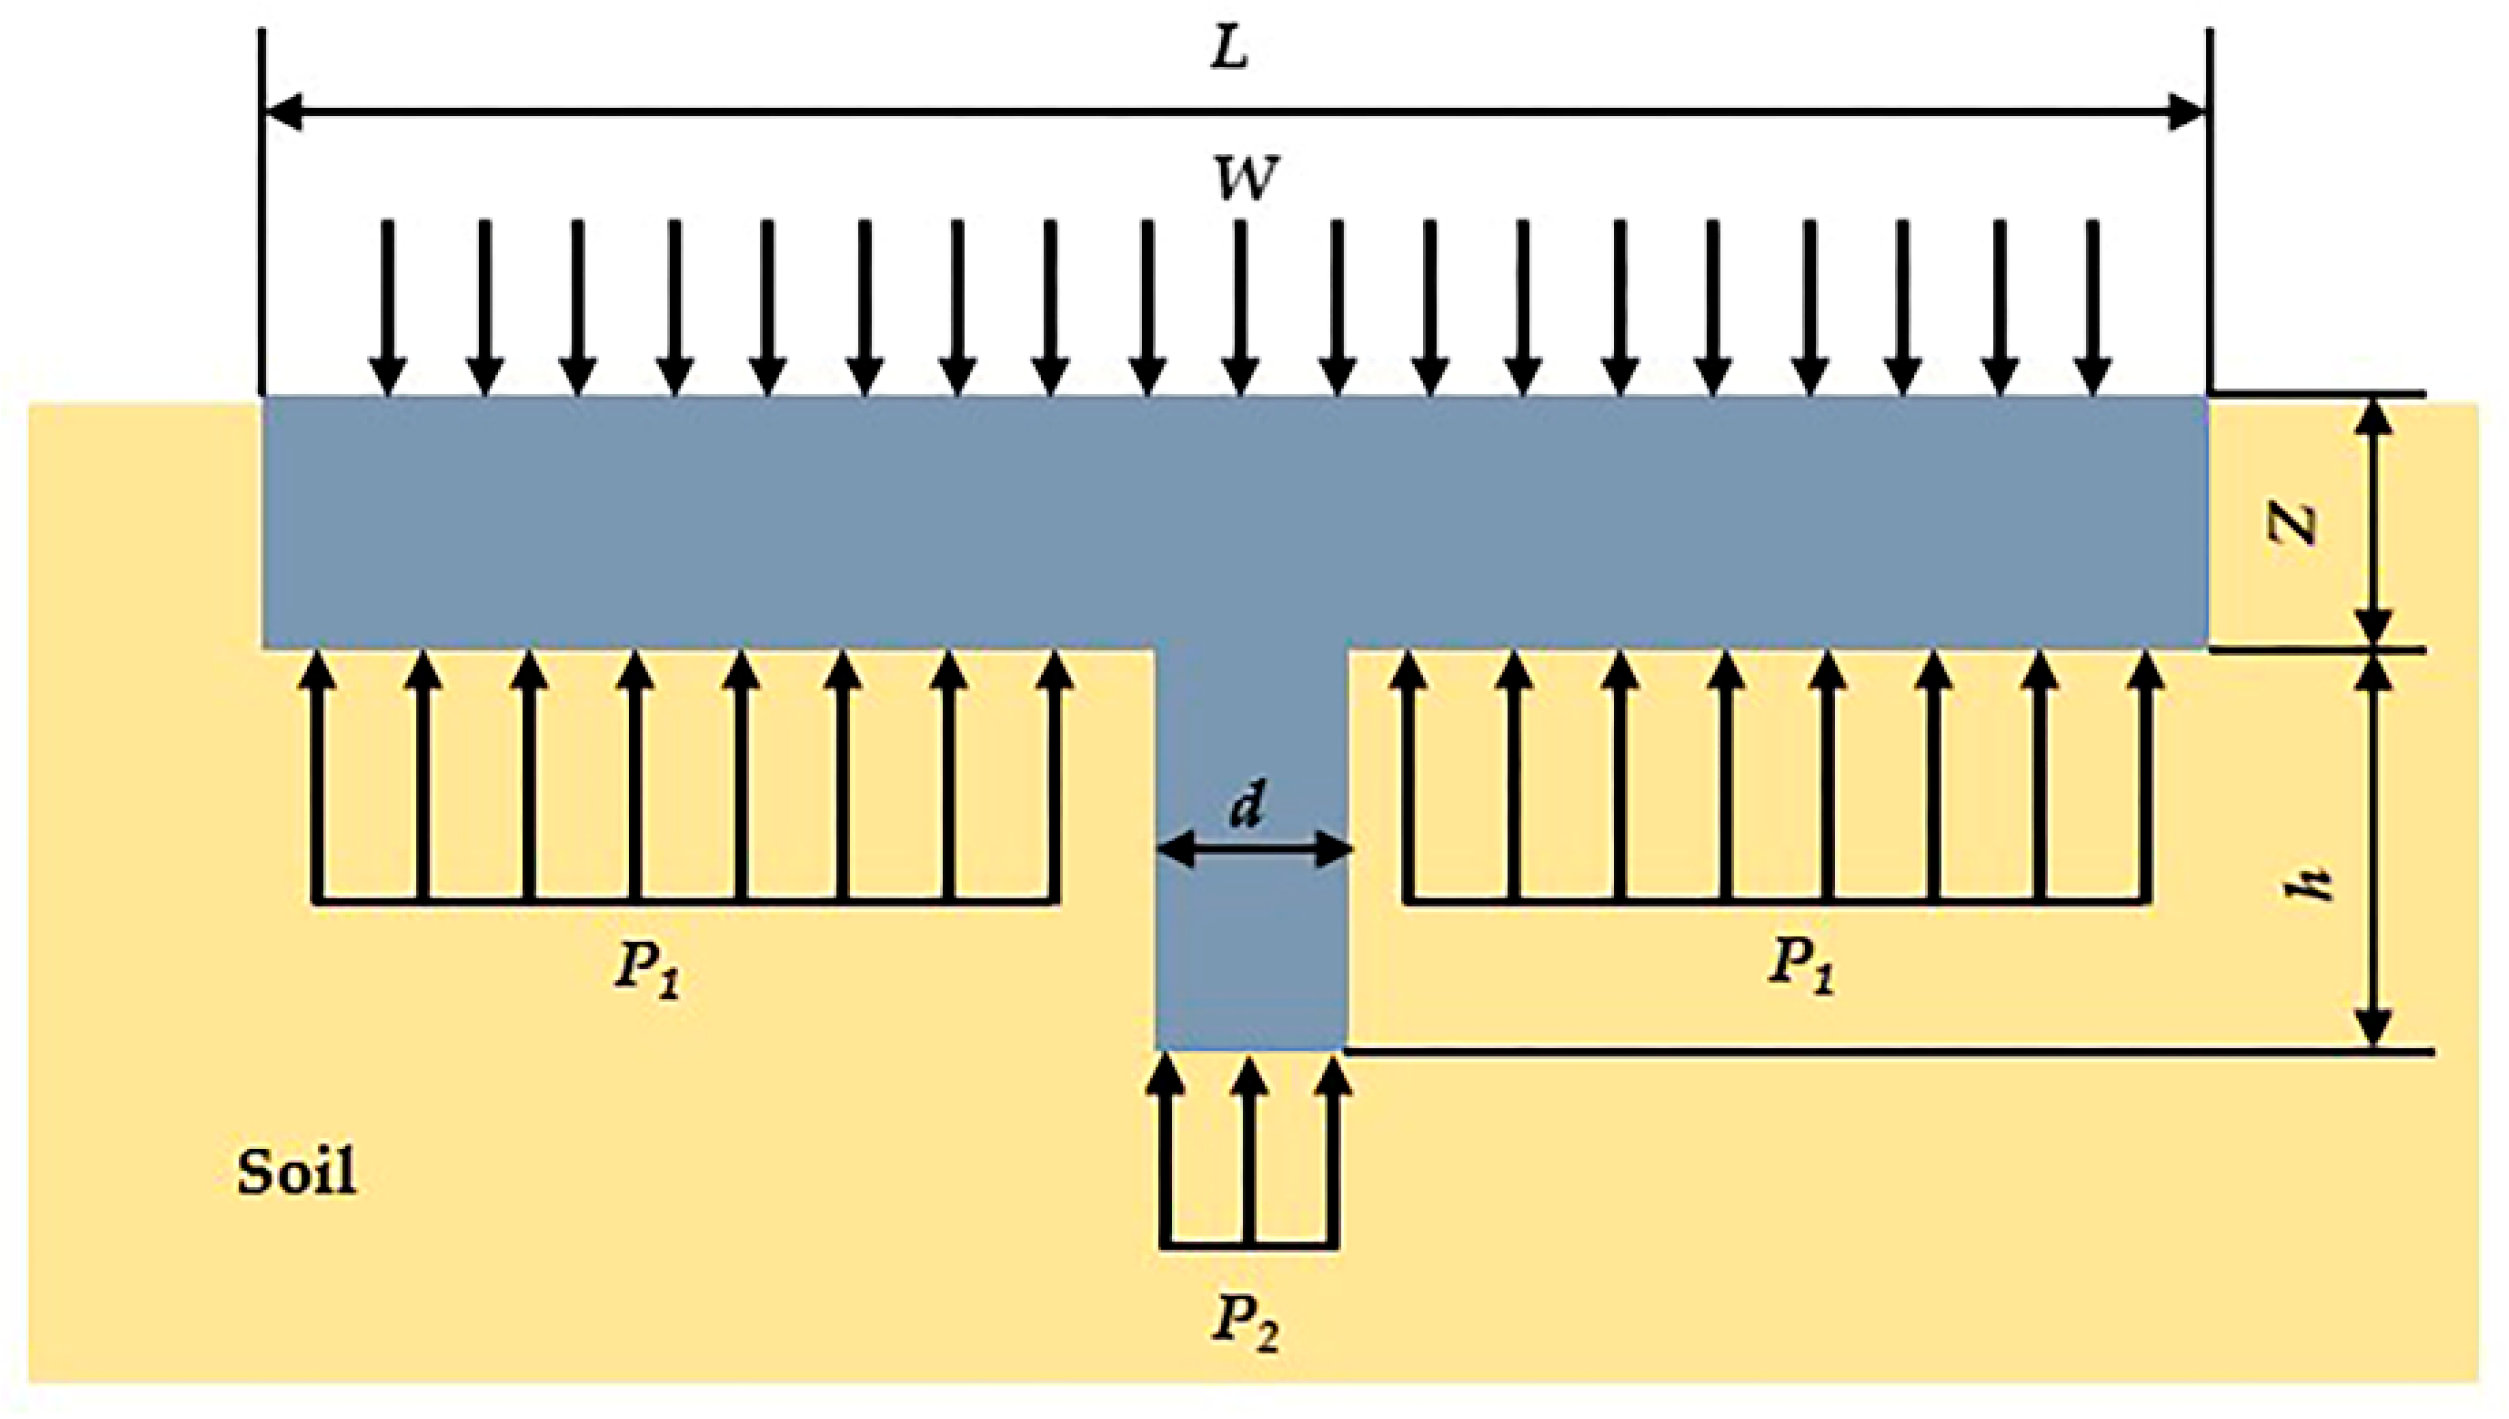
When the vertical load was applied on the grouser shoes, the entire grouser shoes sank in the black soil. The vertical stress analysis of grouser shoes is shown in Figure 1.
As is presented in Figure 1, the vertical forces of the grouser shoes were expressed by Equation (1):
where W is vertical load, L is the length of grouser shoe, d is grouser thickness. is the contact stress of the top surface of the grouser, and is the stress at the bottom surface of the grouser shoe. According to the Beeker’s sinkage formula [28,29], the stress was expressed as follows:
where is soil cohesive modulus, is soil frictional modulus, Z is sinkage depth, n is sinkage exponent, is the grouser height, and b is the width of grouser shoe. Apart from the fixed value b, these parameters are only depended on the soil properties, and tested by the penetration test.
Therefore, the vertical load equation could make the following Equation (4):
2.3. Experimental Equipment
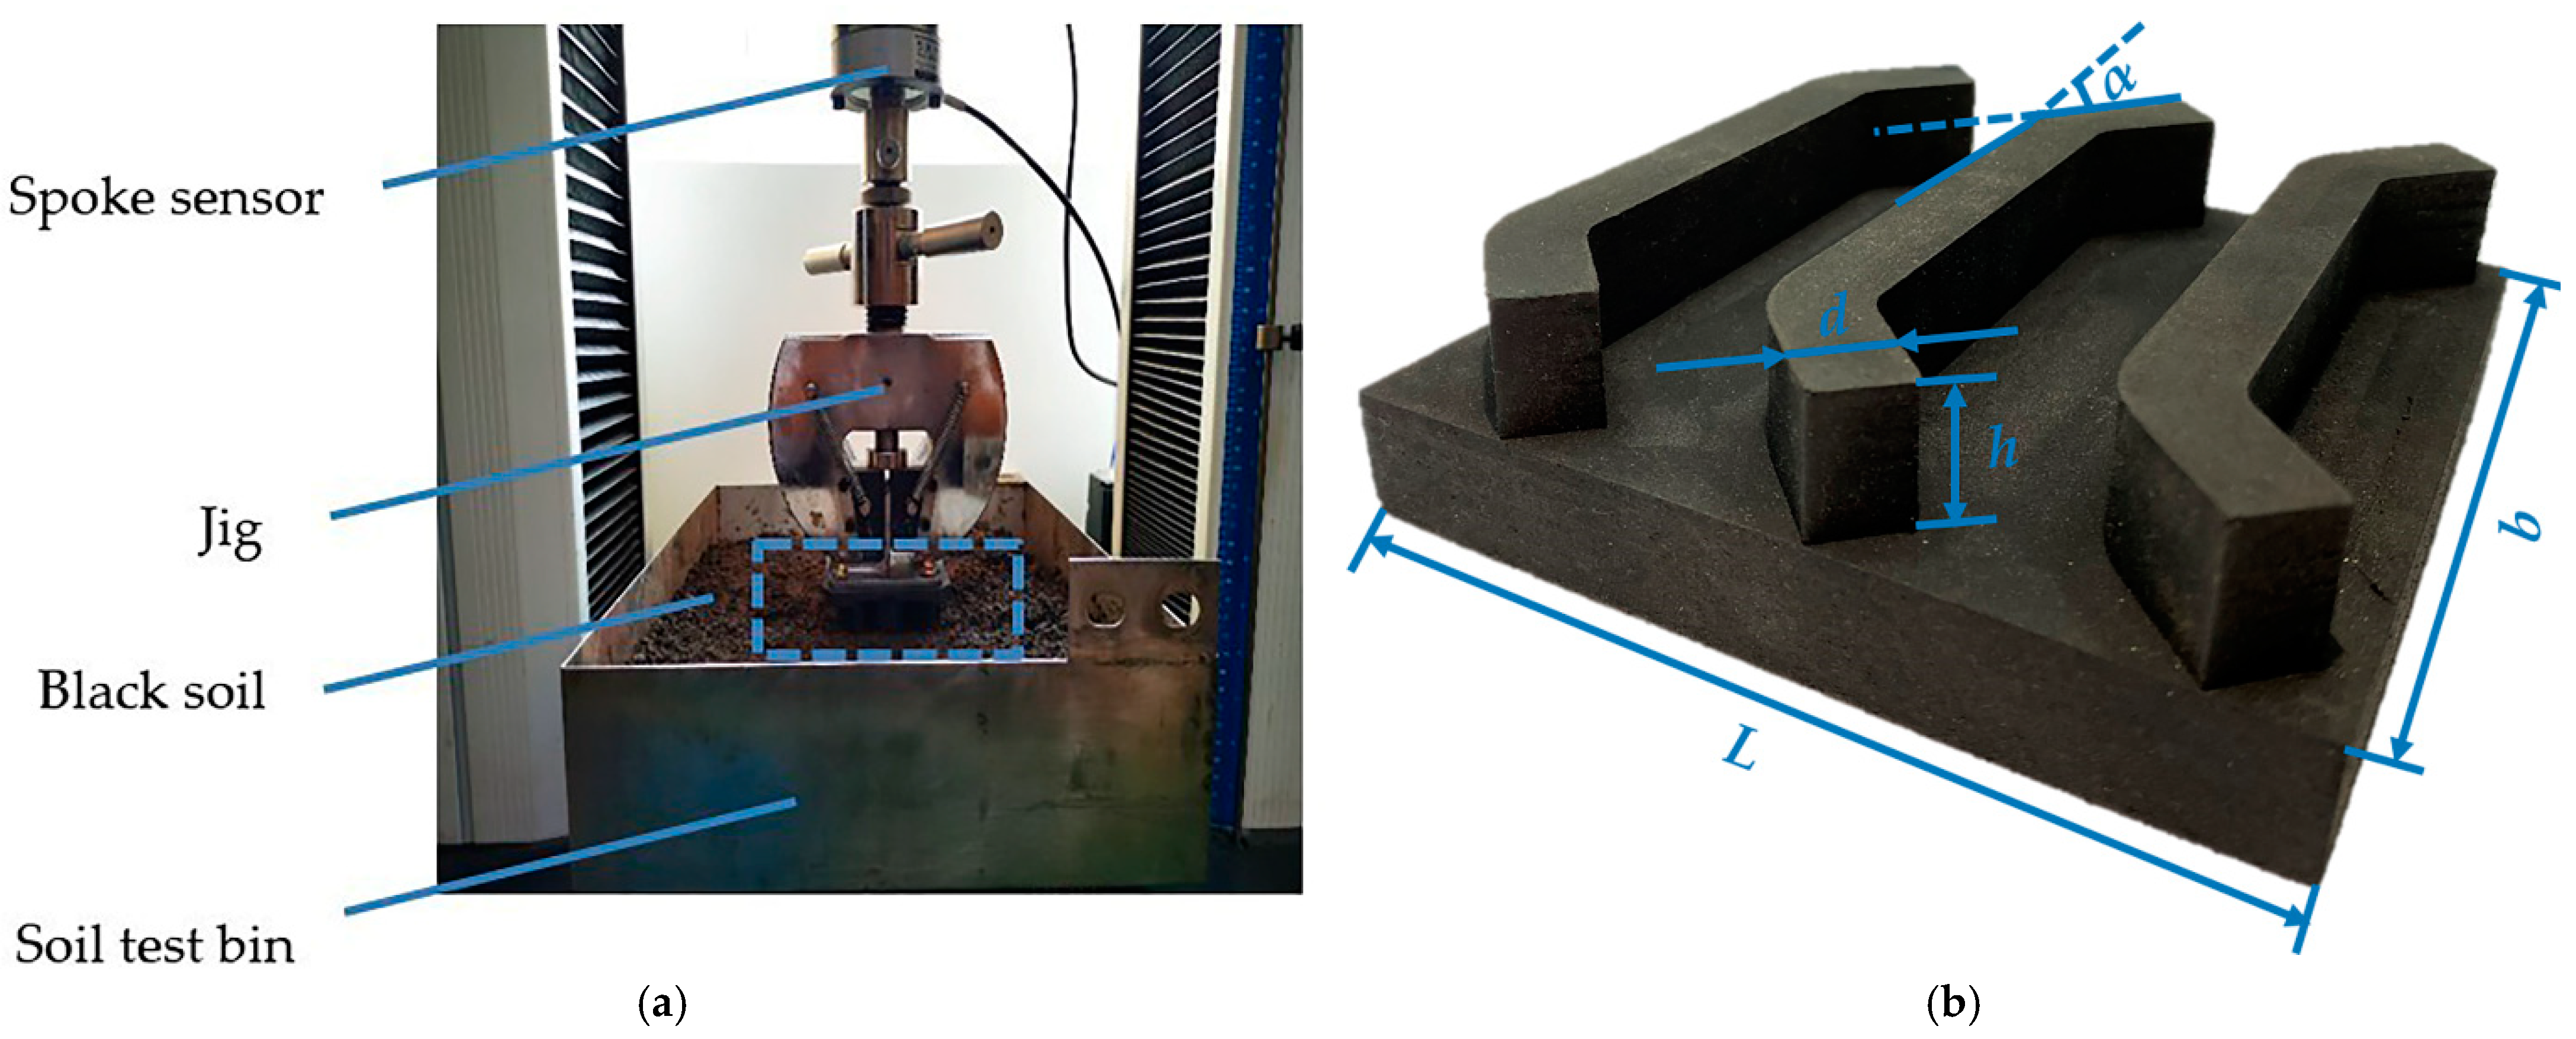
In this experiment, the soil bin was 500 mm (length) × 350 mm (width) × 200 mm (height) and filled with black soil. Electronic universal material testing machine was custom developed and used for the adhesion force tests, which was multi-functional and had high precision. The overall structure of the test platform is shown in Figure 2. The test platform is composed of computer system, TMC digital measurement, and control system. The ZLF-D 1093 spoke sensor (Zhenhai Electric Equipment Co., Ltd., Ningbo, China), which is equipped with 500 N force range, has a precision class of 0.02% and the output sensitivity range is 1.5–2 mV/V.
This paper mainly considered the static normal adhesion performance of the grouser shoes. When the normal loading speed of the equipment was 5 mm/min, the relative displacement of soil samples along the tangential direction of the contact surface of the grouser shoes was less than 1 mm, and the effect of tractor traction forces on the adhesive force between the belt and the ground may be ignored in this study.
During the test, when the cross beam started moving upward at a speed of 5 mm/min, the pressure on the grouser shoes also started decreasing from the maximum until the moment of separation of black soil and the grouser shoes. At that moment, the adhesion force appeared and the test platform had to apply a force (P) more than the weight of the grouser shoes (G) to separate the grouser shoes from the black soil. The difference between the force applied by the test platform and the grouser shoes’ weight divided by the contact area of the grouser shoes (A) was defined as the adhesion force (). The methodology for measuring the adhesion force was consistent with the related papers studied by Massah, Ren, and Zhang et al. [8,14,30,31]. The adhesion force could be established by utilizing Equation (5). Additionally, the adhesive soil mass to the grouser shoes was measured by LQ-A 30002 electronic scales (Ante Weighing Electric Equipment Co., Ltd., Ruian, China), and the level of accuracy was 1% (i.e., reading of 0.01).
where m is the mass of the grouser shoes, g is the acceleration of gravity (g = 9.8 kg/s), d is the grouser thickness, h is the grouser height, α is the grouser splayed angle, and the other variables are fixed values. Equation (5) showed that the adhesion force is mainly dependent on the three structure parameters of the grouser shoes, such as the grouser height (h), the grouser thickness (d), and the grouser splayed angle (α). Thus, these parameters were selected as the experimental factors to be optimized.
2.4. Experiment Scheme
In order to determine the optimal level interval of the factors, pre-experiments were carried out. The results presented the reasonable range of the level value of the factors: the grouser height was 20–30 mm, the grouser thickness was 5–7 mm, and the grouser splayed angle was 35°–45°. The grouser height (h), the grouser thickness (d), and the grouser splayed angle (α) were considered as the independent variables, the adhesion force (Fa) and adhesive soil mass (Ma) were determined as the response indicators. The functional relationship between the independent variables and the response indicators was established by the RSM, and a Box-Behnken Design (BBD) was adopted to optimize structure parameters of the grouser shoes [32,33]. According to the BBD, it took five center points per block and three levels of each factor and took rotatable alpha, which the factor level encodes (−1, 0, 1). There was a total of 17 sets of coded conditions for the modeling of the experiment results, and each group of tests was repeated at least 3 times to obtain the real average value. The coded levels of the independent variables are shown in Table 2. The experimental scheme and results are presented in Table 3.
2.5. Data Analysis
The data of the experiment were analyzed by using the analysis of variance (ANOVA) and least-significant difference (LSD) at the significance levels of 0.01 and 0.05 in Origin 8.0 software [34,35]. The Design-Expert software was employed to generate response surfaces and conduct multi-objective optimization. The quadratic polynomial equation of the independent variables and the response indicators could be established by Equation (6):
where is the response indicators, is the independent variables, is the fixed value, is the first order term of coefficient, is the interaction term coefficient, is the second order term of coefficient, is the error value.
3. Results and Discussion
3.1. ANOVA Analysis
ANOVA analysis and the determination coefficient are usually used to evaluate the fitting quality of a model [36,37]. According to the experiment result of BBD, the results of analysis of variance for the response indicators are presented in Table 4.
The p values of the two models were less than 0.001, indicating that the grouser height, the grouser splayed angle, and the grouser thickness were all very significant. The lack of fit was greater than 0.05, which was not significant. Hence, the model reflects the experimental data more realistically, which could predict and analyze the influence of various factors on the response indicators. Within the level range of the selected factors, according to the F-value of each factor, the weight of the factors affecting the adhesion force and the adhesive soil mass were both the grouser height > the grouser splayed angle > the grouser thickness. Based on the orthogonal test results, eliminating non-significant factors (p > 0.05), experimental data were analyzed and fitted with the quadratic polynomials that were obtained using the regression model. Equation (7) showed the regression models of the adhesion force, and Equation (8) represented adhesive soil mass regression response surface models.
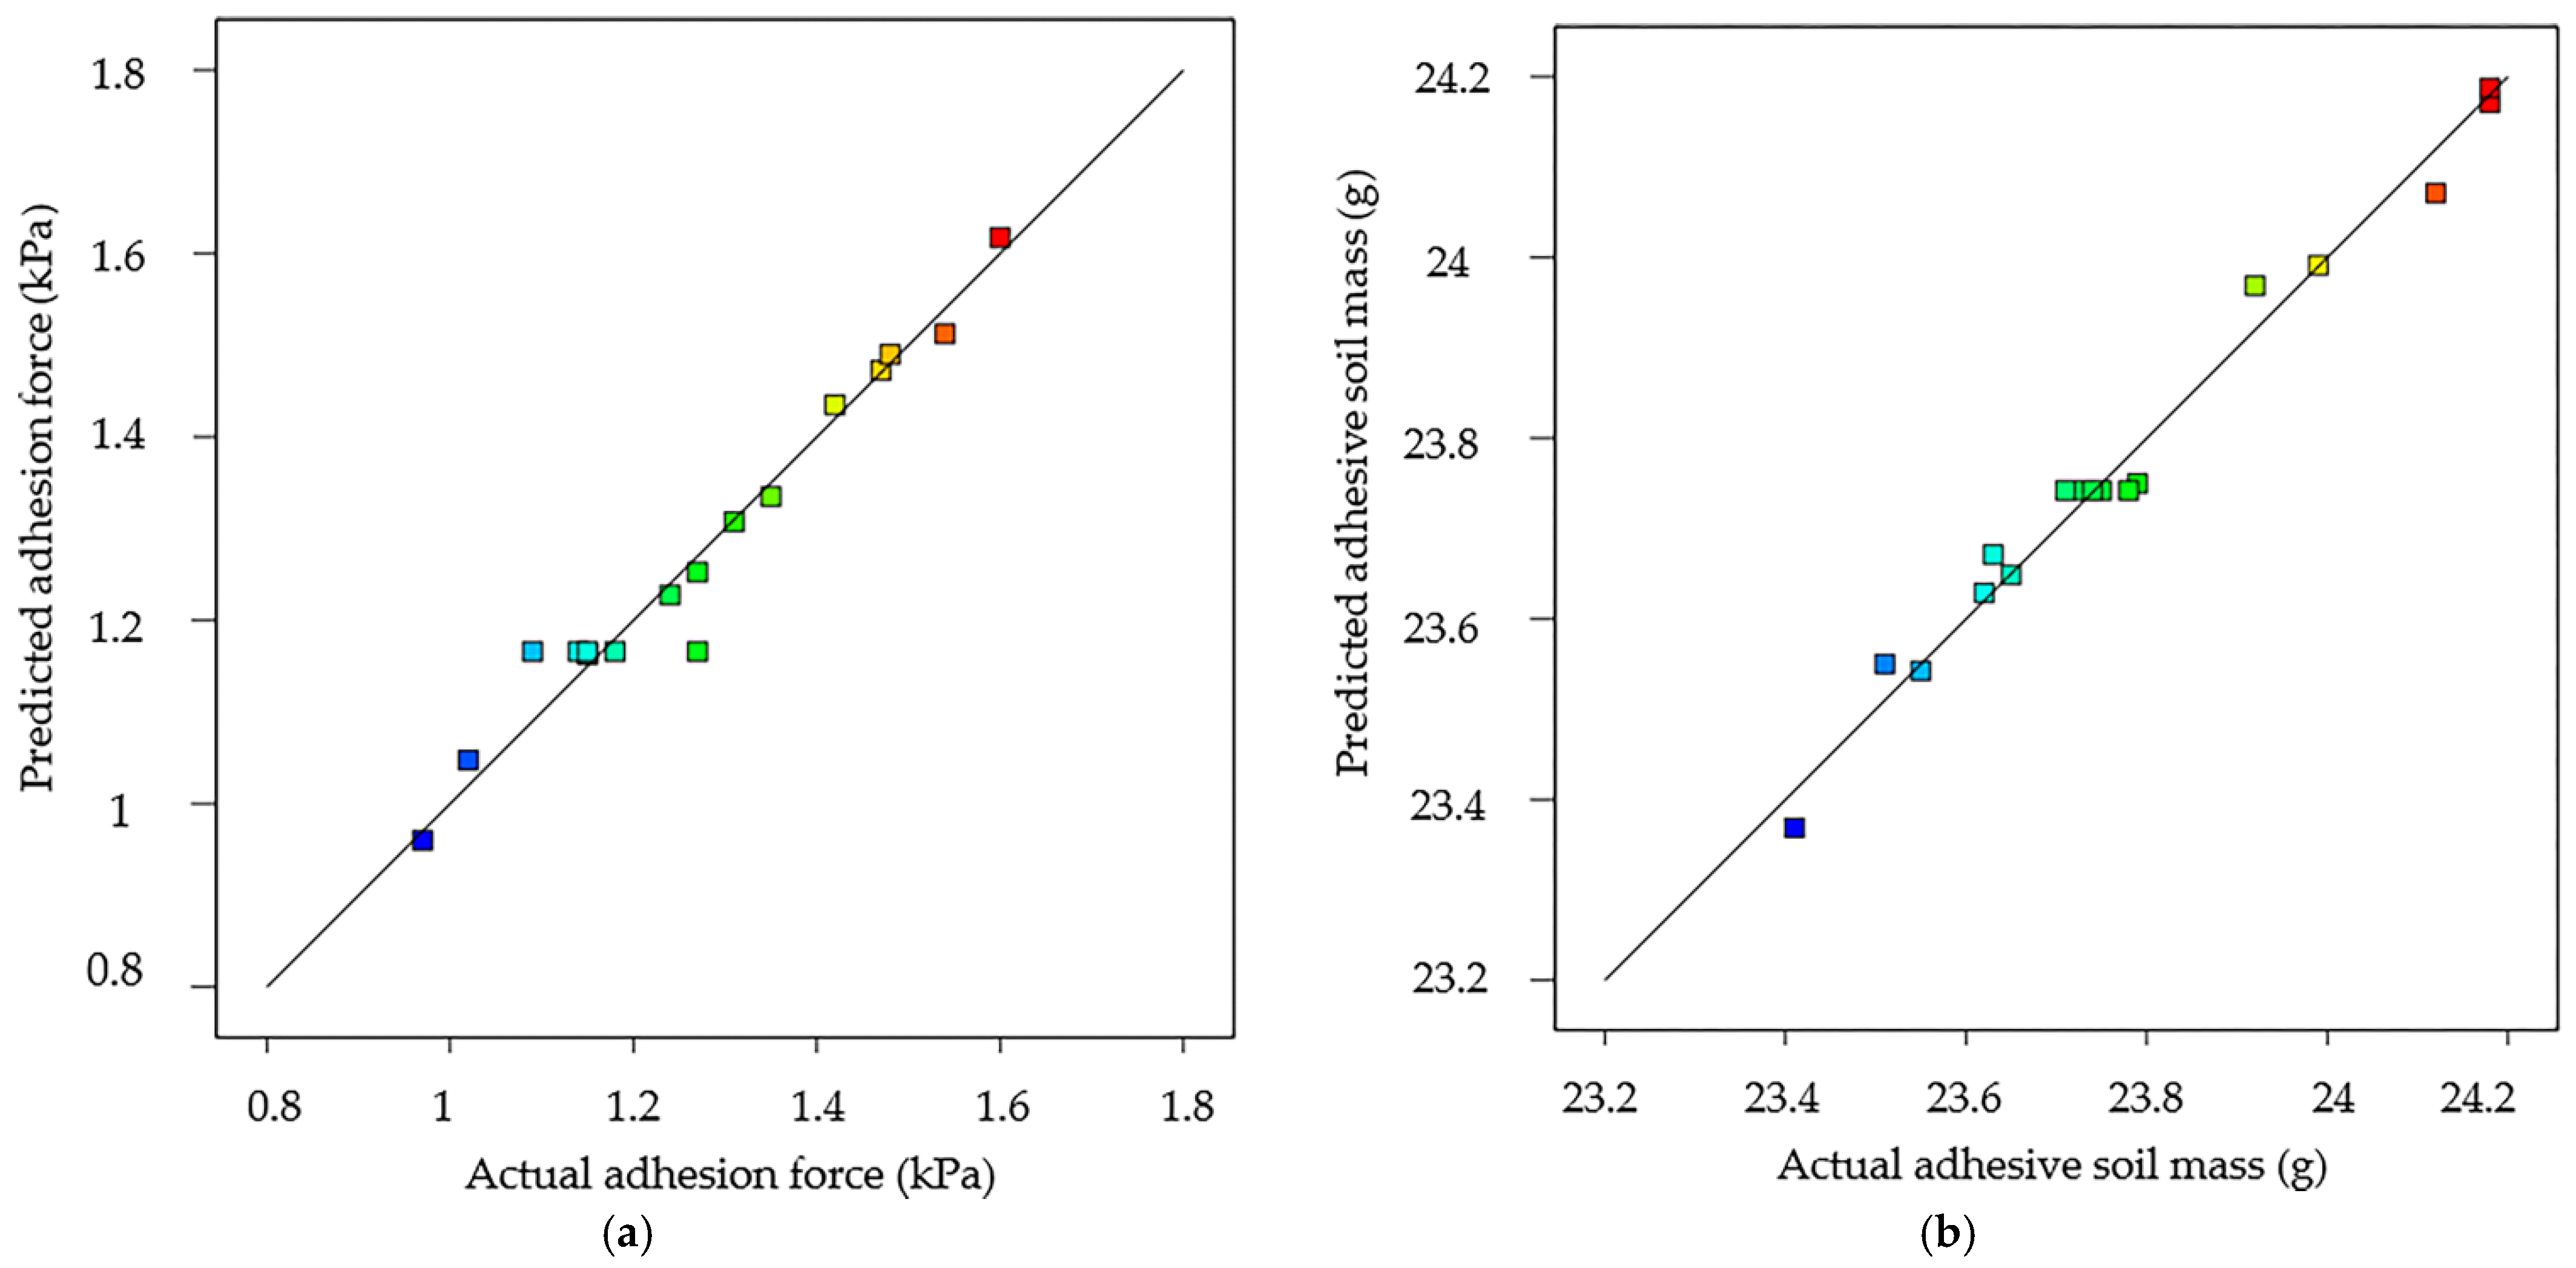
To ensure the adaptability and accuracy of the model, it was necessary to evaluate the predictive ability by analyzing the determination coefficient. The response model fit summary output for indicators is illustrated in Table 5. The coefficients of determination (R2) of the adhesion force and the adhesive soil mass were all larger than 0.95, suggesting that more than 95% of variations in the indices could be explained by the models. Moreover, both of the models’ difference between predicted R2 and adjusted R2 less than 0.2 indicates that the response surfaces of the two models established had good consistency and predictability for the experimental results [20]. The predicted vs. actual values for the response indicators are shown in Figure 3. It could be seen from the scatter plot that the actual values were basically distributed on the predicted curve, consistent with the trend of the predicted values, and linearly distributed. The predicted precision of the models was 15.72 and 23.61, which was far larger than four, suggesting the models were precise [35].
3.2. Analysis of Interactive Factors
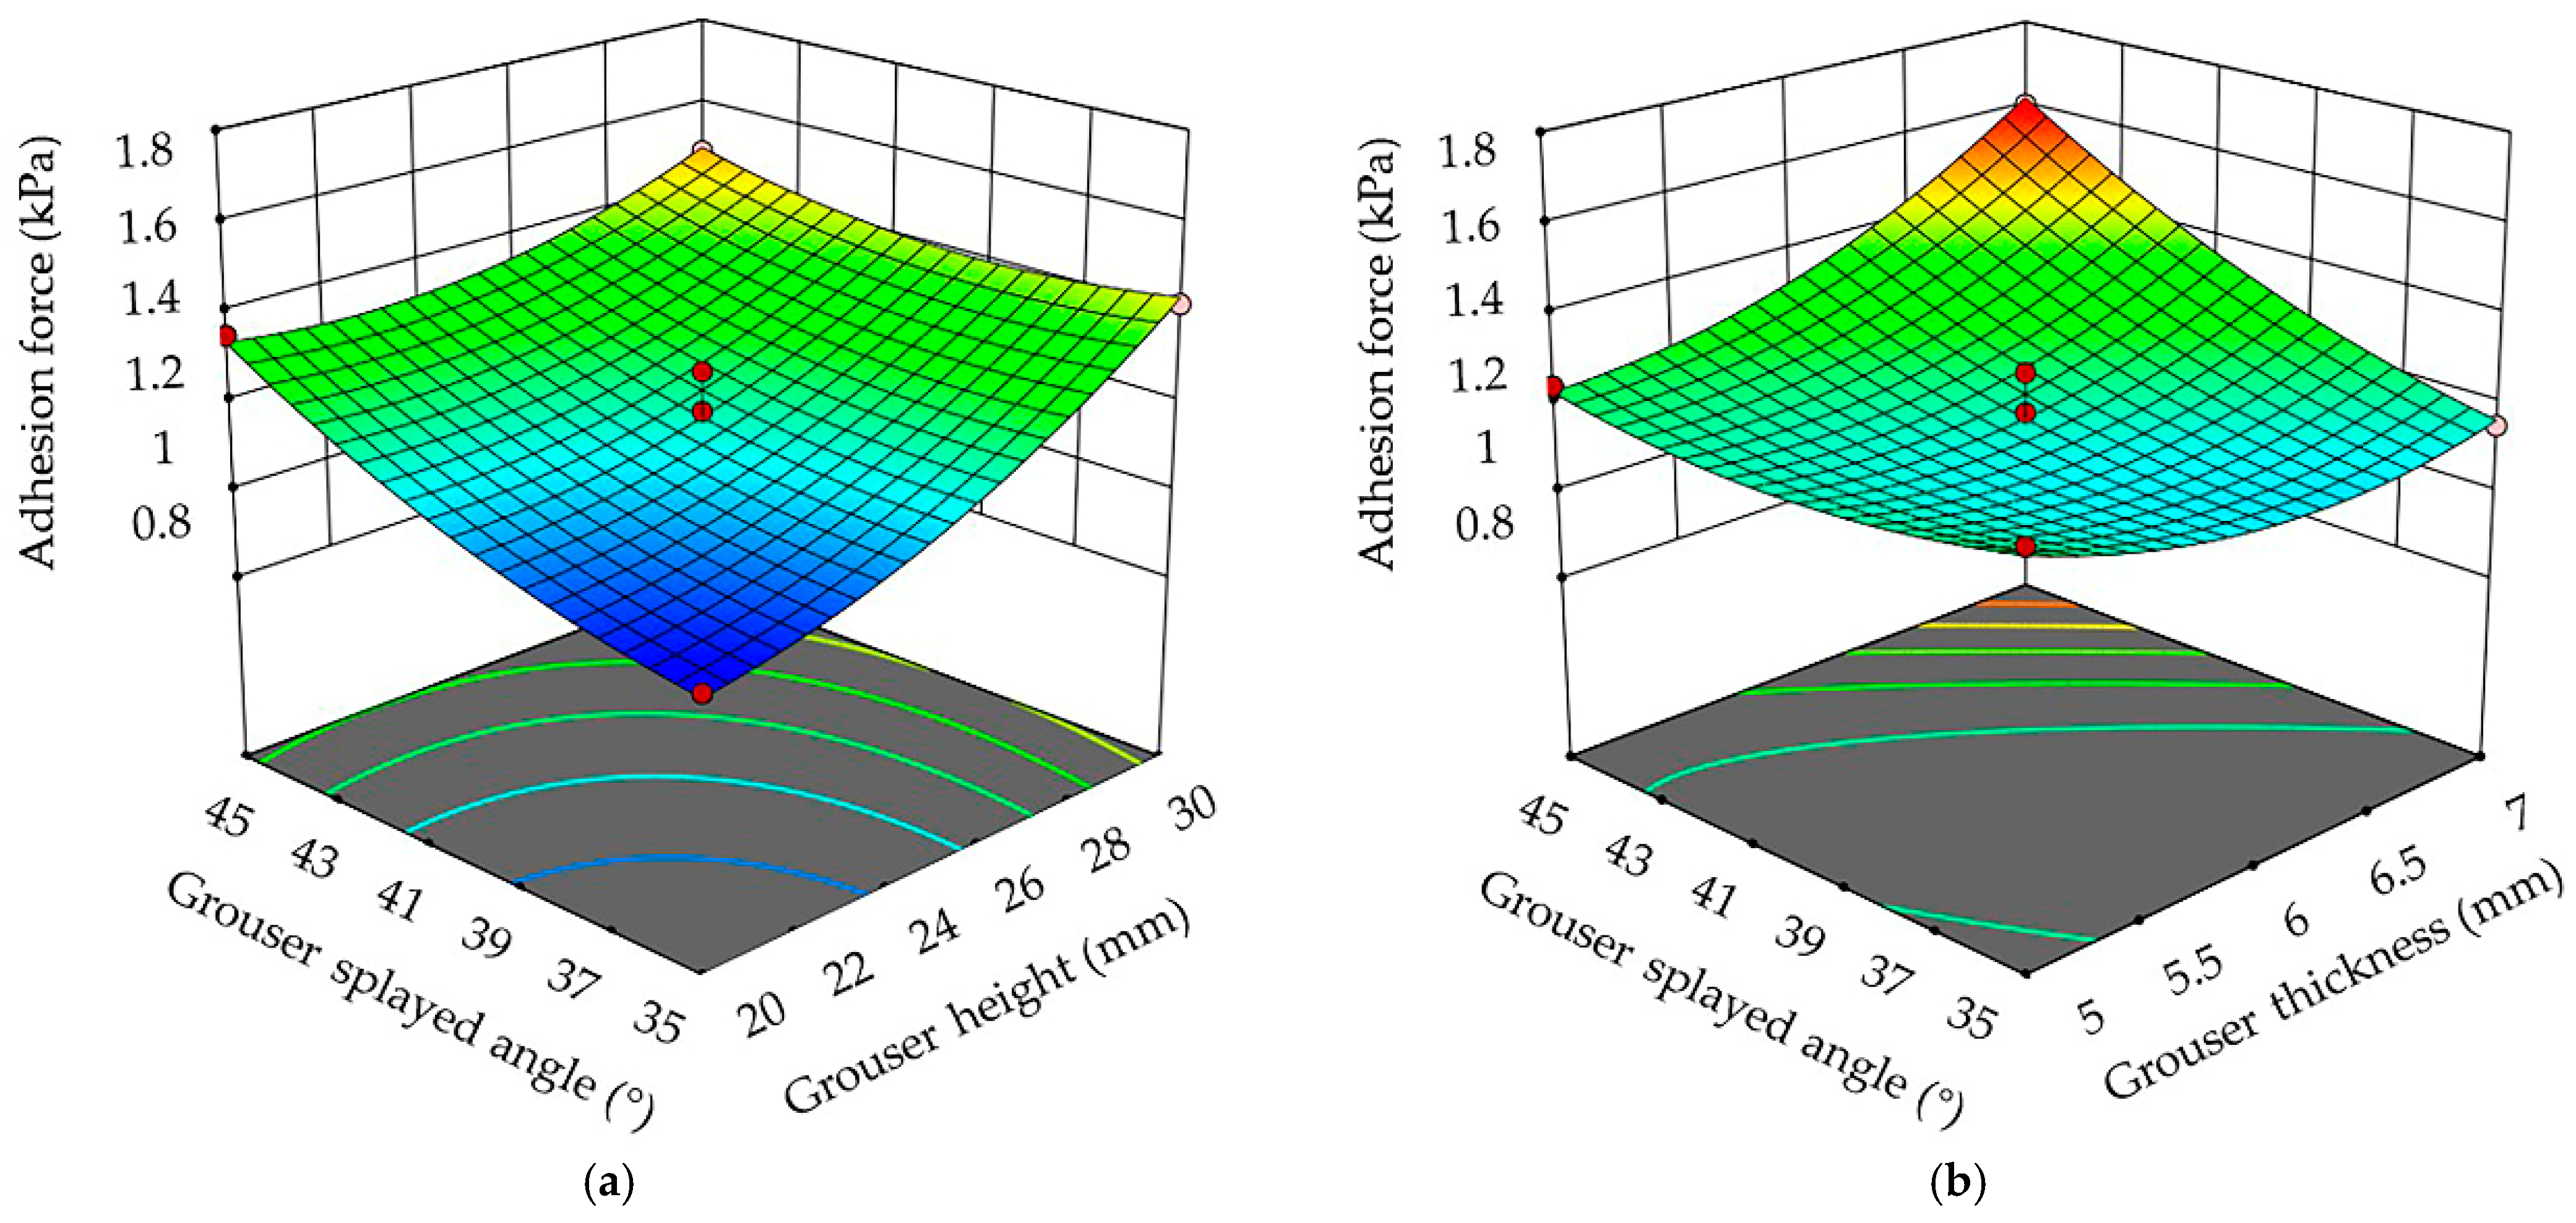
According to the established quadratic Equations (7) and (8), a 3D response surface diagram was drawn to assess the interactive effects of the variables on the adhesion force and the adhesive soil mass. The interactive impact of two factors on the response indicators were analyzed by maintaining one factor as constant. The 3D response surface diagram of pairwise interaction of the grouser height, the grouser thickness, and the grouser splayed angle on adhesion force is shown in Figure 4. The 3D response surface diagram of pairwise interaction of the grouser height, the grouser thickness, and the grouser splayed angle on adhesive soil mass is shown in Figure 5.
3.2.1. Analysis of Interactive Factors on Adhesion Force
From the results of Table 4, the p-value of the grouser height and grouser thickness was 0.0835, which did not reach a significant level (p < 0.05). Therefore, the analysis of interaction of grouser height and grouser thickness on adhesion force does not need to be discussed. It could be seen from Figure 4a,b that when the one factor was fixed, another two factors were considered as interactive factors on adhesion force and the adhesion force exhibited an increasing trend, which ranged from 0.97 kPa to 1.6 kPa. Figure 4a showed that when the grouser thickness was maintained at 6 mm, the grouser splayed angle was fixed and the adhesion force increased with the growth of the grouser height. The grouser splayed angle was 35°; when the grouser height increased from 20 mm to 30 mm, the adhesion force increased from 0.97 kPa to 1.42 kPa, which was an increase of 46.39%. The grouser splayed angle was 45°; when the grouser height increased from 20 mm to 30 mm, the adhesion force increased from 1.35 kPa to 1.48 kPa, which was an increase of 9.63%. The results showed that the grouser splayed angle and the grouser height had an interactive effect on soil adhesion force, and the effect of the grouser splayed angle on soil adhesion force exceeded that of the grouser height. Figure 4b showed that when the grouser height was maintained at 25 mm, the grouser splayed angle was fixed and the adhesion force decreased with the growth of the grouser thickness. The grouser splayed angle was 35°; when the grouser thickness increased from 5 mm to 7 mm, the adhesion force decreased from 1.27 kPa to 1.15 kPa, which decreased by 9.45%. The grouser splayed angle was 45°; when the grouser height thickness increased from 5 mm to 7 mm, the adhesion force increased from 1.24 kPa to 1.6 kPa, which was an increase of 29.03%. The results showed that the grouser splayed angle and the grouser thickness had an interactive effect on soil adhesion force, and the effect of grouser splayed angle on soil adhesion force exceeded that of the grouser thickness. In summary, the interactive impact of combined factors on adhesion force was ranked as .
3.2.2. Analysis of Interactive Factors on Adhesive Soil Mass
As was presented in Figure 5a–c, when one factor was fixed, another two factors were considered as interactive factors on adhesive soil mass. Figure 5a,b showed that the adhesive soil mass appeared to be a declining trend, which ranged from 24.18 g to 23.41 g, and Figure 5c showed that adhesive soil mass initially appeared as a declining trend and subsequently an increasing trend. Figure 5a showed that when the grouser splayed angle was maintained at 40°, the adhesive soil mass declined slowly with increases in the grouser height and the grouser thickness. The maximum adhesive soil mass was obtained when the grouser height was 20 mm and the grouser thickness was 5 mm. When the grouser height was 30 mm and the grouser thickness was 5 mm, the adhesive soil mass reached the minimum. The grouser thickness and the grouser height had an interactive effect on adhesive soil mass, and the effect of the grouser height on adhesive soil mass exceeded that of the grouser thickness. Figure 5b showed that when the grouser thickness was maintained at 6 mm, the adhesive soil mass declined with increases in the grouser height and the grouser splayed angle. The maximum adhesive soil mass was obtained when the grouser height was 20 mm and the grouser splayed angle was 35°. When the grouser height was 30 mm and the grouser splayed angle was 35°, the adhesive soil mass reached the minimum. The grouser height and the grouser splayed angle had an interactive effect on adhesive soil mass, and the effect of grouser height on adhesive soil mass exceeded that of the grouser splayed angle. Figure 5c showed that when the grouser height was maintained at 25 mm, the adhesive soil mass initially declined and subsequently increased with increases in the grouser height and the grouser splayed angle. The maximum adhesive soil mass was obtained when the grouser thickness was 7 mm and the grouser splayed angle was 35°. When the grouser thickness was 5 mm and the grouser splayed angle was 35°, the adhesive soil mass reached the minimum. The grouser thickness and the grouser splayed angle had an interactive effect on adhesive soil mass, and the effect of the grouser splayed angle on adhesive soil mass exceeded that of the grouser thickness. In a word, the interactive impact of combined factors on adhesive mass was ranked as .
3.3. Multi-Objective Optimization Model
We used the multi-objective optimization method of the Design-Expert 12.0 software (Stat-Ease Inc., Minneapolis, MN, USA) to predict the optimal parameters combination, the minimum value for the adhesion force, and the adhesive soil mass in this study. The grouser height (h), the grouser thickness (d), and the grouser splayed angle (α) were selected as parameters to be optimized. The constraint condition of the multi-objective optimization model was as followed:
Under the constraints given in Equation (9), the Design-Expert 12.0 software (Minneapolis, MN, USA) presented the optimal parameters combination when the grouser height was 20 mm, grouser thickness was 6.34 mm, and grouser splayed angle was 40.45°. The predicted value for the adhesion force and the adhesive soil mass were 1.16 kPa and 23.76 g, respectively.
3.4. Verification Experiment
Although the results from the ANOVA analysis indicated that the established mathematical models had a good accuracy of predicting the adhesion force and the adhesive soil mass in this study, the verification experiment was still needed to verify the model performance. Each experiment was repeated at least three times to obtain the average data. The results of the verification experiment are presented in Table 6. The average data of the measured adhesion force reached 1.11 kPa, and adhesive soil mass reached 22.68 g. The relative error of the predicted values and measured values was less than 5%, proving the reliability of the regression models. Compared with the average value of the un-optimized experiment results in Table 3, the adhesion force and adhesive soil mass reduced by 12.84% and 4.63%, respectively. The results showed that the mathematical models were reliable, and the optimized structure parameters of the grouser shoes by the RSM could reduce soil adhesion.
4. Conclusions
Theoretical analysis was carried out to explore the impact factors of structure parameters of the grouser shoes on the adhesion performance. The structure parameters were optimized by the RSM. The optimal parameter combination occurred when the grouser height was 20 mm, grouser thickness was 6.34 mm, and grouser splayed angle was 40.45°. The average data of verification experiments occurred when the adhesion force reached 1.11 kPa and adhesive soil mass reached 22.68 g. Compared with the average value of un-optimized experiment results, the adhesion force and adhesive soil mass reduced by 12.84% and 4.63, respectively. The relative error of the predicted values and measured values was less than 5%, proving the reliability of the regression models. This study can provide a reference method for parameters optimization, and a new structure of the grouser shoes of tracked vehicles will be designed to reduce adhesion.
Even though the established mathematical model has a good accuracy in predicting structure parameters of the grouser shoes on the adhesion force and adhesive soil mass in this study, it is worth noting that there are some limitations. Firstly, the optimal structure parameters combination may reduce the adhesion but may also affect the traction, and the effect of traction on the adhesive force between the belt and the ground were not analyzed. Secondly, there are many parameters that could cause adhesion to vary, including not only the structure parameters, but other parameters (e.g., materials, geometry, or surface porosity). In this study, we mainly analyzed the effect of structure parameters of the grouser shoes on the adhesion, and the other parameters were not explored. Thirdly, the adhesion-related parameters (i.e., soil cohesive and friction modulus, soil cohesion, or internal friction angle) under different soil moisture content were not studied.
Therefore, further study needs to be carried out to address the limitations. We propose to establish a multi-objective evaluation system based on adhesion and traction, and the effect of traction on the adhesive force between the belt and the ground also need to be analyzed. The impact of other parameters (e.g., materials, geometry, or surface porosity) on the soil adhesion should be explored and compared with the structure parameters of the grouser shoes. Additionally, the adhesion-related parameters under different soil moisture contents by penetration test will be carried out in a following study.
Author Contributions
Conceptualization, J.F.; methodology, J.F.; validation, J.L.; investigation, J.L.; resources, X.T.; writing—original draft preparation J.L.; writing—review and editing, J.F. and J.L.; supervision, Z.C. and R.W.; project administration, J.F.; funding acquisition, J.F. All authors have read and agreed to the published version of the manuscript.
Funding
This research was funded by the International Science and Technology Cooperation Project of Science and Technology Development Program of Jilin Province (No. 20190701055GH).
Institutional Review Board Statement
Not applicable.
Informed Consent Statement
Not applicable.
Data Availability Statement
The datasets in this study are available within this article. The data that were derived from the original datasets but not included herein are available upon request.
Acknowledgments
The authors would like to thank the soil samples provided by the Experimental Base of Agriculture of Jilin University.
Conflicts of Interest
The authors declare no conflict of interest.
References
- Zhang, Y.; Wu, Y.; Liu, B.; Zheng, Q.; Yin, J. Characteristics and factors controlling the development of ephemeral gullies in cultivated catchments of black soil region, Northeast China. Soil Tillage Res. 2007, 96, 28–41. [Google Scholar] [CrossRef]
- Liu, D.; Wang, Z.; Zhang, B.; Song, K.; Duan, H. Spatial distribution of soil organic carbon and analysis of related factors in croplands of the black soil region, Northeast China. Agric. Ecosyst. Environ. 2006, 113, 73–81. [Google Scholar] [CrossRef]
- Li, J.; Tong, J.; Hu, B. Calibration of parameters of interaction between clayey black soil with different moisture content and soil-engaging component in northeast China. Trans. Chin. Soc. Agric. Eng. 2019, 35, 130–140. [Google Scholar]
- Jiang, Q.; Cao, M.; Wang, Y. Quantification of the soil stiffness constants using physical properties of paddy soils in Yangtze Delta Plain, China. Biosyst. Eng. 2020, 200, 89–100. [Google Scholar] [CrossRef]
- Jia, X.; Ren, L. Theoretical Analysis of Adhesion Force of Soil to Solid Materials. Trans. Chin. Soc. Agric. Eng. 1995, 87, 489–493. [Google Scholar] [CrossRef]
- Ren, L.; Tong, J.; Li, J.; Chen, B.C. Soil Adhesion and Biomimetics of Soil-engaging Components: A Review. J. Agric. Eng. Res. 2001, 79, 239–263. [Google Scholar] [CrossRef] [Green Version]
- Baek, S.H.; Shin, G.B.; Lee, S.H. Evaluation of the Slip Sinkage and its Effect on the Compaction Resistance of an Off-Road Tracked Vehicle. Appl. Sci. 2020, 10, 3175. [Google Scholar] [CrossRef]
- Massah, J.; Fard, M.R.; Aghel, H. An optimized bionic electro-osmotic soil-engaging implement for soil adhesion reduction. J. Terramechanics 2021, 95, 1–6. [Google Scholar] [CrossRef]
- Barzegar, M.; Karimi, R.; Hashemi, S.J.; Nazokdast, H. Evaluating the draft force and soil-tool adhesion of a UHMW-PE coated furrower. Soil Tillage Res. 2016, 163, 160–167. [Google Scholar] [CrossRef]
- Marani, S.M.; Shahgholi, G.; Moinfar, A. Effect of nano coating materials on reduction of soil adhesion and external friction. Soil Tillage Res. 2019, 193, 42–49. [Google Scholar] [CrossRef]
- Ucgul, M.; Fielke, J.M.; Saunders, C. Three-dimensional discrete element modelling (DEM) of tillage: Accounting for soil cohesion and adhesion. Biosyst. Eng. 2015, 129, 298–306. [Google Scholar] [CrossRef]
- Zenkov, S.A. Application of thermal effect as a means to combat ground-and-machine part adhesion. Mater. Sci. Eng. 2020, 862, 32–60. [Google Scholar] [CrossRef]
- Zenkov, S.A.; Lkhanag, D. Use of repair-recovery compositions for reducing the adhesion of soils to working bodies of machines. Mater. Sci. Eng. 2020, 971, 52–55. [Google Scholar]
- Ren, L.; Han, Z.; Li, J. Experimental investigation of bionic rough curved soil cutting blade surface to reduce soil adhesion and friction. Soil Tillage Res. 2006, 85, 1–12. [Google Scholar] [CrossRef]
- Ren, L.; Deng, S.Q.; Wang, J.C. Design Principles of the Non-smooth Surface of Bionic Plow Moldboard. J. Bionic Eng. 2004, 1, 9–19. [Google Scholar] [CrossRef]
- Ren, L. Progress in the bionic study on anti-adhesion and resistance reduction of terrain machines. Sci. China 2009, 52, 273–284. [Google Scholar] [CrossRef]
- Tong, J.; Sun, J.; Chen, D. Geometrical features and wettability of dung beetles and potential biomimetic engineering appli cations in tillage implements. Soil Tillage Res. 2005, 80, 1–12. [Google Scholar] [CrossRef]
- Wang, X. Study on use of vibration to reduce soil adhesion. J. Terramech. 1998, 35, 87–101. [Google Scholar] [CrossRef]
- Jia, H.; Wang, W. Application of anti-adhesion structure based on earthworm motion characteristics. Soil Tillage Res. 2018, 178, 159–166. [Google Scholar] [CrossRef]
- Sun, J.; Chen, H.; Wang, Z. Study on plowing performance of EDEM low-resistance animal bionic device based on red soil. Soil Tillage Res. 2020, 196, 104336. [Google Scholar] [CrossRef]
- Zhang, Z.; Jia, H.; Sun, J. Review of application of biomimetics for designing soil-engaging tillage implements in Northeast China. Int. J. Agric. Biol. Eng. 2016, 9, 12–21. [Google Scholar]
- Sun, J.; Wang, Y.; Zhang, S. The mechanism of resistance-reducing/anti-adhesion and its application on biomimetic disc furrow opener. Math. Biosci. Eng. 2020, 17, 4657–4677. [Google Scholar] [CrossRef] [PubMed]
- Shaikh, S.A.; Li, Y.; Zheng, M. Effect of grouser height on the tractive performance of single grouser shoe under different soil moisture contents in clay loam terrain. Sustainability 2021, 13, 1156. [Google Scholar] [CrossRef]
- Ge, J.; Wang, X.; Kito, K. Comparing tractive performance of steel and rubber single grouser shoe under different soil moisture contents. Int. J. Agric. Biol. Eng. 2016, 9, 11–20. [Google Scholar]
- Grisso, R.; Perumpral, J.; Zoz, F. An empirical model for tractive performance of rubber-tracks in agricultural soils. J. Terramechanics 2006, 43, 225–236. [Google Scholar] [CrossRef]
- Park, W.; Chang, Y.; Lee, S.S. Prediction of the tractive performance of a flexible tracked vehicle. J. Terramech. 2008, 45, 13–23. [Google Scholar] [CrossRef]
- Ding, Z.; Li, Y.; Ren, L.; Tang, Z. Distribution uniformity of soil stress under compaction of tracked undercarriage. Trans. Chin. Soc. Agric. Eng. 2020, 36, 52–58. [Google Scholar]
- Bekker, M. Introduction of Terrain Vehicle Systems; University of Michigan Press: Ann Arbor, MI, USA, 1969. [Google Scholar]
- Wong, J. Theory of Ground Vehicles, 3rd ed.; John Wiley & Sons: New York, NY, USA, 2001. [Google Scholar]
- Ren, L. Soil Adhesion Mechanics, 1st ed.; Machinery Industry Press: Beijing, China, 2011; pp. 4–7, 214–215. [Google Scholar]
- Zhang, L.; Yang, Z.; Xu, S. Application of electronic universal testing machine in soil adhesion testing. Test. Technol. Test. Mach. 2005, 45, 27–29. (In Chinese) [Google Scholar]
- Mosayebi, A. Methanol steam reforming over Co-Cu-Zn/γ-Al2O3 catalyst: Kinetic and RSM-BBD modeling approaches. Int. J. Energy Res. 2021, 45, 3288–3304. [Google Scholar] [CrossRef]
- Alipour, M.; Vosoughi, M.; Mokhtari, S.A. Optimizing the basic violet 16 adsorption from aqueous solutions by magnetic graphene oxide using the response surface model based on the Box–Behnken design. Int. J. Environ. Anal. Chem. 2019, 101, 758–777. [Google Scholar] [CrossRef]
- Fu, J.; Yuan, H.; Zhang, D. Multi-Objective Optimization of Process Parameters of Longitudinal Axial Threshing Cylinder for Frozen Corn Using RSM and NSGA-II. Appl. Sci. 2020, 10, 1646. [Google Scholar] [CrossRef] [Green Version]
- Chen, T.; Jia, H.; Zhang, S. Optimization of cold pressing process parameters of chopped corn straws for fuel. Energies 2020, 13, 652. [Google Scholar] [CrossRef] [Green Version]
- Armstrong, R.A.; Eperjesi, F.; Gilmartin, B. The application of analysis of variance (ANOVA) to different experimental designs in optometry. Ophthalmic Physiol. Opt. 2002, 22, 248–256. [Google Scholar] [CrossRef] [PubMed] [Green Version]
- Nagelkerke, N. A note on a general definition of the coefficient of determination. Biometrika 1991, 78, 691–692. [Google Scholar] [CrossRef]
Figure 1.
Vertical stress analysis of the grouser shoes. L is the length of grouser shoe, W is vertical load, Z is sinkage depth, h is the grouser height, d is the grouser thickness. is the contact stress of the top surface of the grouser, and is the stress at the bottom surface of the grouser shoe.

Figure 2.
Overall structure of the test platform. (a) A soil bin test; (b) structure of the grouser shoes. L is the length of grouser shoe, b is the width of grouser shoe, is the grouser height, d is the grouser thickness, and α is the grouser splayed angle.
Figure 2.
Overall structure of the test platform. (a) A soil bin test; (b) structure of the grouser shoes. L is the length of grouser shoe, b is the width of grouser shoe, is the grouser height, d is the grouser thickness, and α is the grouser splayed angle.

Figure 3.
Predicted vs. actual values of the response indicators. (a) Predicted vs. actual values of adhesion force; (b) predicted vs. actual values of adhesive soil mass.
Figure 3.
Predicted vs. actual values of the response indicators. (a) Predicted vs. actual values of adhesion force; (b) predicted vs. actual values of adhesive soil mass.

Figure 4.
3D response surface diagram of pairwise interaction of the grouser height, grouser thickness, and grouser splayed angle on adhesion force. (a) Interaction of grouser height and grouser splayed angle; (b) interaction of grouser thickness and grouser splayed angle.
Figure 4.
3D response surface diagram of pairwise interaction of the grouser height, grouser thickness, and grouser splayed angle on adhesion force. (a) Interaction of grouser height and grouser splayed angle; (b) interaction of grouser thickness and grouser splayed angle.

Figure 5.
3D response surface diagram of pairwise interaction of the grouser height, grouser thickness, and grouser splayed angle on adhesive soil mass. (a) Interaction of grouse height and grouser thickness; (b) interaction of grouser height and grouser splayed angle; (c) interaction of grouser thickness and grouser splayed angle.


Table 1.
Measured black soil physical properties.
| Sample Depth (mm) | Bulk Density (kg·m−3) | Hardness (kPa) | Moisture Content (%) |
|---|---|---|---|
| 0–100 | 1130 | 42 | 24.31 |
| 100–200 | 1352 | 972 | 21.28 |
| 200–300 | 1326 | 1165 | 19.87 |
Table 2.
Coded levels of independent variables.
| Coded Levels | Grouser Height (mm) | Grouser Thickness (mm) | Grouser Splayed Angle (°) |
|---|---|---|---|
| −1 | 20 | 5 | 35 |
| 0 | 25 | 6 | 40 |
| 1 | 30 | 7 | 45 |
Table 3.
The experimental scheme and results.
| Factors | Evaluation Indexes | ||||
|---|---|---|---|---|---|
| Numbers | Grouser Height (mm) | Grouser Thickness (mm) | Grouser Splayed Angle (°) | Adhesion Force (kPa) | Adhesive Soil Mass (g) |
| 1 | 1 | 0 | 1 | 1.48 | 23.55 |
| 2 | 1 | 1 | 0 | 1.54 | 23.62 |
| 3 | −1 | 0 | −1 | 0.97 | 24.18 |
| 4 | −1 | 1 | 0 | 1.31 | 23.63 |
| 5 | 1 | −1 | 0 | 1.47 | 23.41 |
| 6 | −1 | 0 | 1 | 1.35 | 23.79 |
| 7 | 0 | 1 | −1 | 1.15 | 24.12 |
| 8 | 0 | 1 | 1 | 1.60 | 23.65 |
| 9 | −1 | −1 | 0 | 1.02 | 24.18 |
| 10 | 0 | −1 | 1 | 1.24 | 23.92 |
| 11 | 0 | −1 | −1 | 1.27 | 23.99 |
| 12 | 1 | 0 | −1 | 1.42 | 23.51 |
| 13 | 0 | 0 | 0 | 1.27 | 23.71 |
| 14 | 0 | 0 | 0 | 1.09 | 23.74 |
| 15 | 0 | 0 | 0 | 1.18 | 23.78 |
| 16 | 0 | 0 | 0 | 1.15 | 23.75 |
| 17 | 0 | 0 | 0 | 1.14 | 23.73 |
Table 4.
Analysis of variance for the response indicators.
| Source | Adhesion Force (kPa) | Adhesive Soil Mass (g) | ||||||
|---|---|---|---|---|---|---|---|---|
| Sum of Squares | Degrees of Freedom | F-Value | p Value | Sum of Squares | Degrees of Freedom | F-Value | p-Value | |
| Model | 0.5150 | 9 | 19.24 | 0.0004 *** | 0.8227 | 9 | 44.73 | <0.0001 *** |
| h | 0.1985 | 1 | 66.72 | <0.0001 *** | 0.3570 | 1 | 174.70 | <0.0001 *** |
| d | 0.0450 | 1 | 15.13 | 0.0060 ** | 0.0288 | 1 | 14.09 | 0.0071 * |
| α | 0.0925 | 1 | 31.08 | 0.0008 *** | 0.0990 | 1 | 48.45 | 0.0002 *** |
| h-d | 0.0121 | 1 | 4.07 | 0.0835 | 0.1444 | 1 | 70.66 | <0.0001 *** |
| h-α | 0.0256 | 1 | 8.61 | 0.0219 * | 0.0462 | 1 | 22.62 | 0.0021 ** |
| d-α | 0.0576 | 1 | 19.37 | 0.0032 ** | 0.0400 | 1 | 19.57 | 0.0031 ** |
| h2 | 0.0266 | 1 | 8.95 | 0.0202 * | 0.0398 | 1 | 19.49 | 0.0031 * |
| d2 | 0.0337 | 1 | 11.34 | 0.0120 * | 0.0179 | 1 | 8.77 | 0.0211 * |
| α2 | 0.0149 | 1 | 5.01 | 0.0602 | 0.0535 | 1 | 26.19 | 0.0014 ** |
| Residual | 0.0208 | 7 | 0.0143 | 7 | ||||
| Lack of Fit | 0.0031 | 3 | 0.2333 | 0.8692 | 0.0116 | 3 | 5.78 | 0.0615 |
| Pure Error | 0.0177 | 4 | 0.0027 | 4 | ||||
| Cor Total | 0.5358 | 16 | 0.8370 | 16 | ||||
F-value = Fischer’s variance ratio; p value = probability value. *** Extremely significant level (p < 0.001); ** Very Significant level (p < 0.01); * Significant level (p < 0.05).
Table 5.
Fit statistics for the response indicators.
| Response Indicators | R2 | Adjusted R2 | Predicted R2 | Predicted Precision |
|---|---|---|---|---|
| Adhesion force (kPa) | 0.96 | 0.91 | 0.86 | 15.72 |
| Adhesive soil mass (g) | 0.98 | 0.96 | 0.77 | 23.61 |
Table 6.
Results of the verification experiment.
| Indicators | Adhesion Force (kPa) | Adhesive Soil Mass (g) |
|---|---|---|
| Predicted value | 1.16 | 23.76 |
| Measured value | 1.11 | 22.68 |
| Relative error value | 0.045 | 0.0476 |
Publisher’s Note: MDPI stays neutral with regard to jurisdictional claims in published maps and institutional affiliations. |
© 2021 by the authors. Licensee MDPI, Basel, Switzerland. This article is an open access article distributed under the terms and conditions of the Creative Commons Attribution (CC BY) license (https://creativecommons.org/licenses/by/4.0/).
Share and Cite
MDPI and ACS Style
Fu, J.; Li, J.; Tang, X.; Wang, R.; Chen, Z. Optimization of Structure Parameters of the Grouser Shoes for Adhesion Reduction under Black Soil. Agriculture 2021, 11, 795. https://0-doi-org.brum.beds.ac.uk/10.3390/agriculture11080795
AMA Style
Fu J, Li J, Tang X, Wang R, Chen Z. Optimization of Structure Parameters of the Grouser Shoes for Adhesion Reduction under Black Soil. Agriculture. 2021; 11(8):795. https://0-doi-org.brum.beds.ac.uk/10.3390/agriculture11080795
Chicago/Turabian StyleFu, Jun, Jian Li, Xinlong Tang, Ruixue Wang, and Zhi Chen. 2021. "Optimization of Structure Parameters of the Grouser Shoes for Adhesion Reduction under Black Soil" Agriculture 11, no. 8: 795. https://0-doi-org.brum.beds.ac.uk/10.3390/agriculture11080795
Note that from the first issue of 2016, this journal uses article numbers instead of page numbers. See further details here.