
Producing Higher Value Wool through a Transition from Romney to Merino Crossbred: Constraining Sheep Feed Demand

Abstract
:1. Introduction
2. Materials and Methods
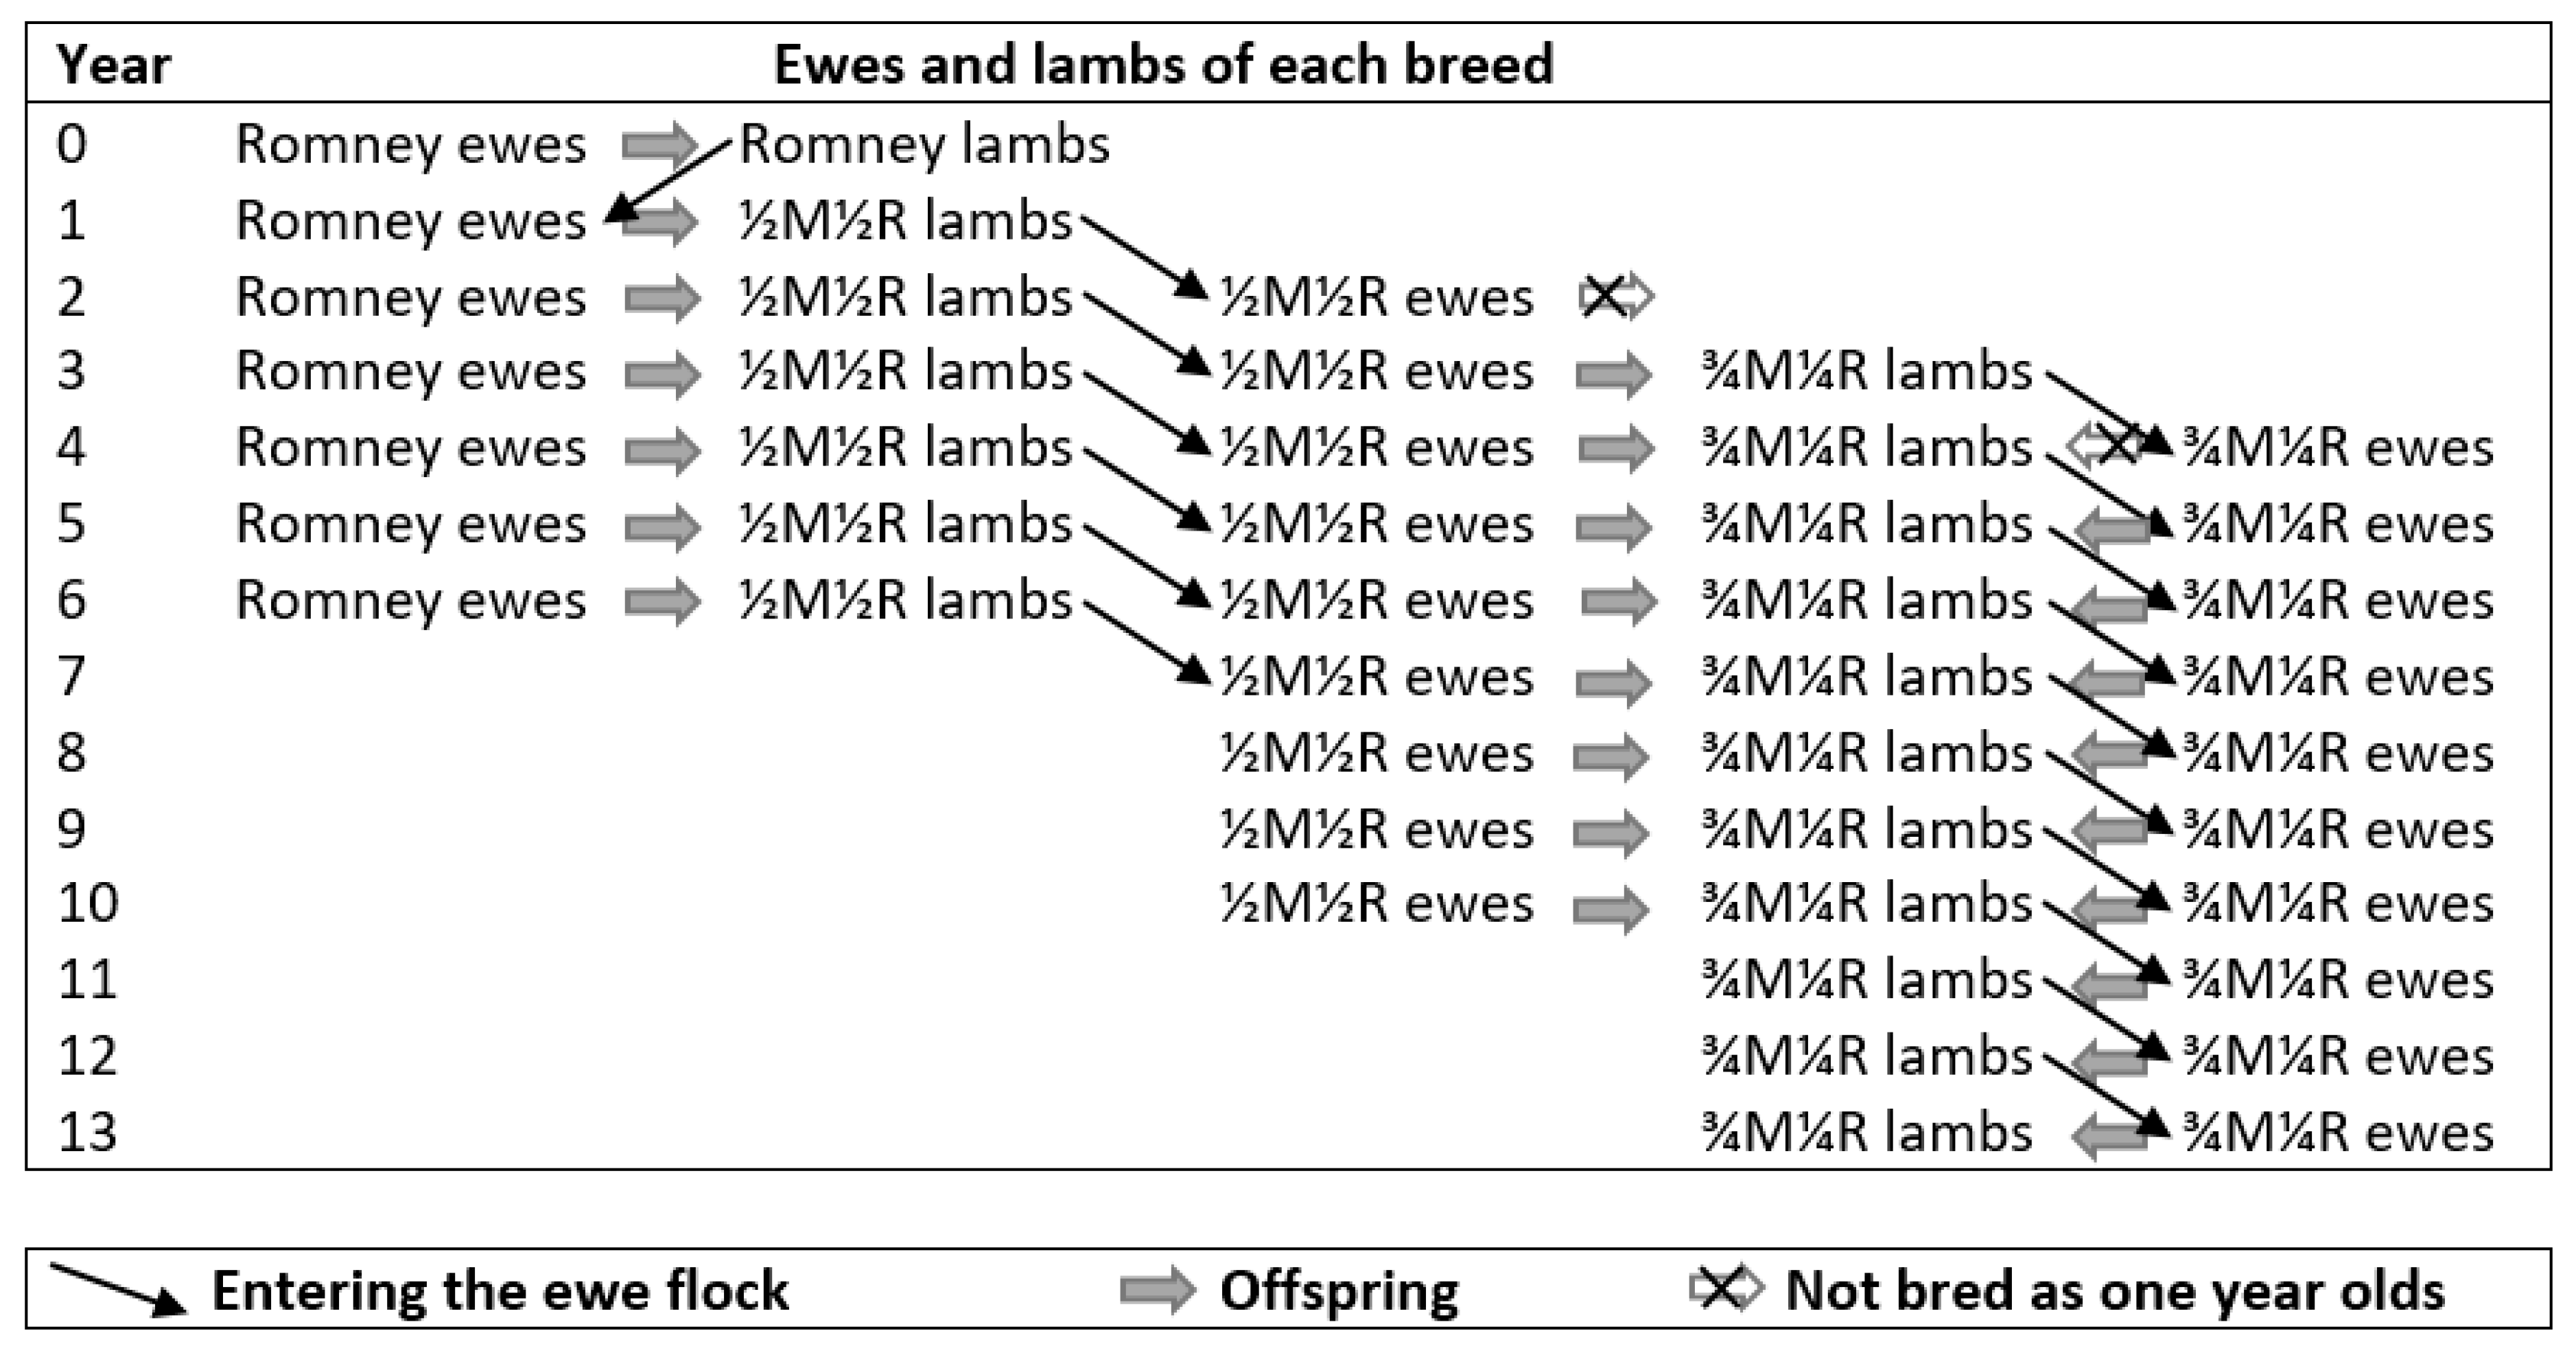
2.1. Ewe Flocks
2.1.1. Selection Intensity Applied to Crossbred Ewe Lambs during Transition
2.1.2. Ewe Culling Rates
2.2. Feed Demand
2.3. Wool
2.4. Economics
2.4.1. Income from Sheep Sales
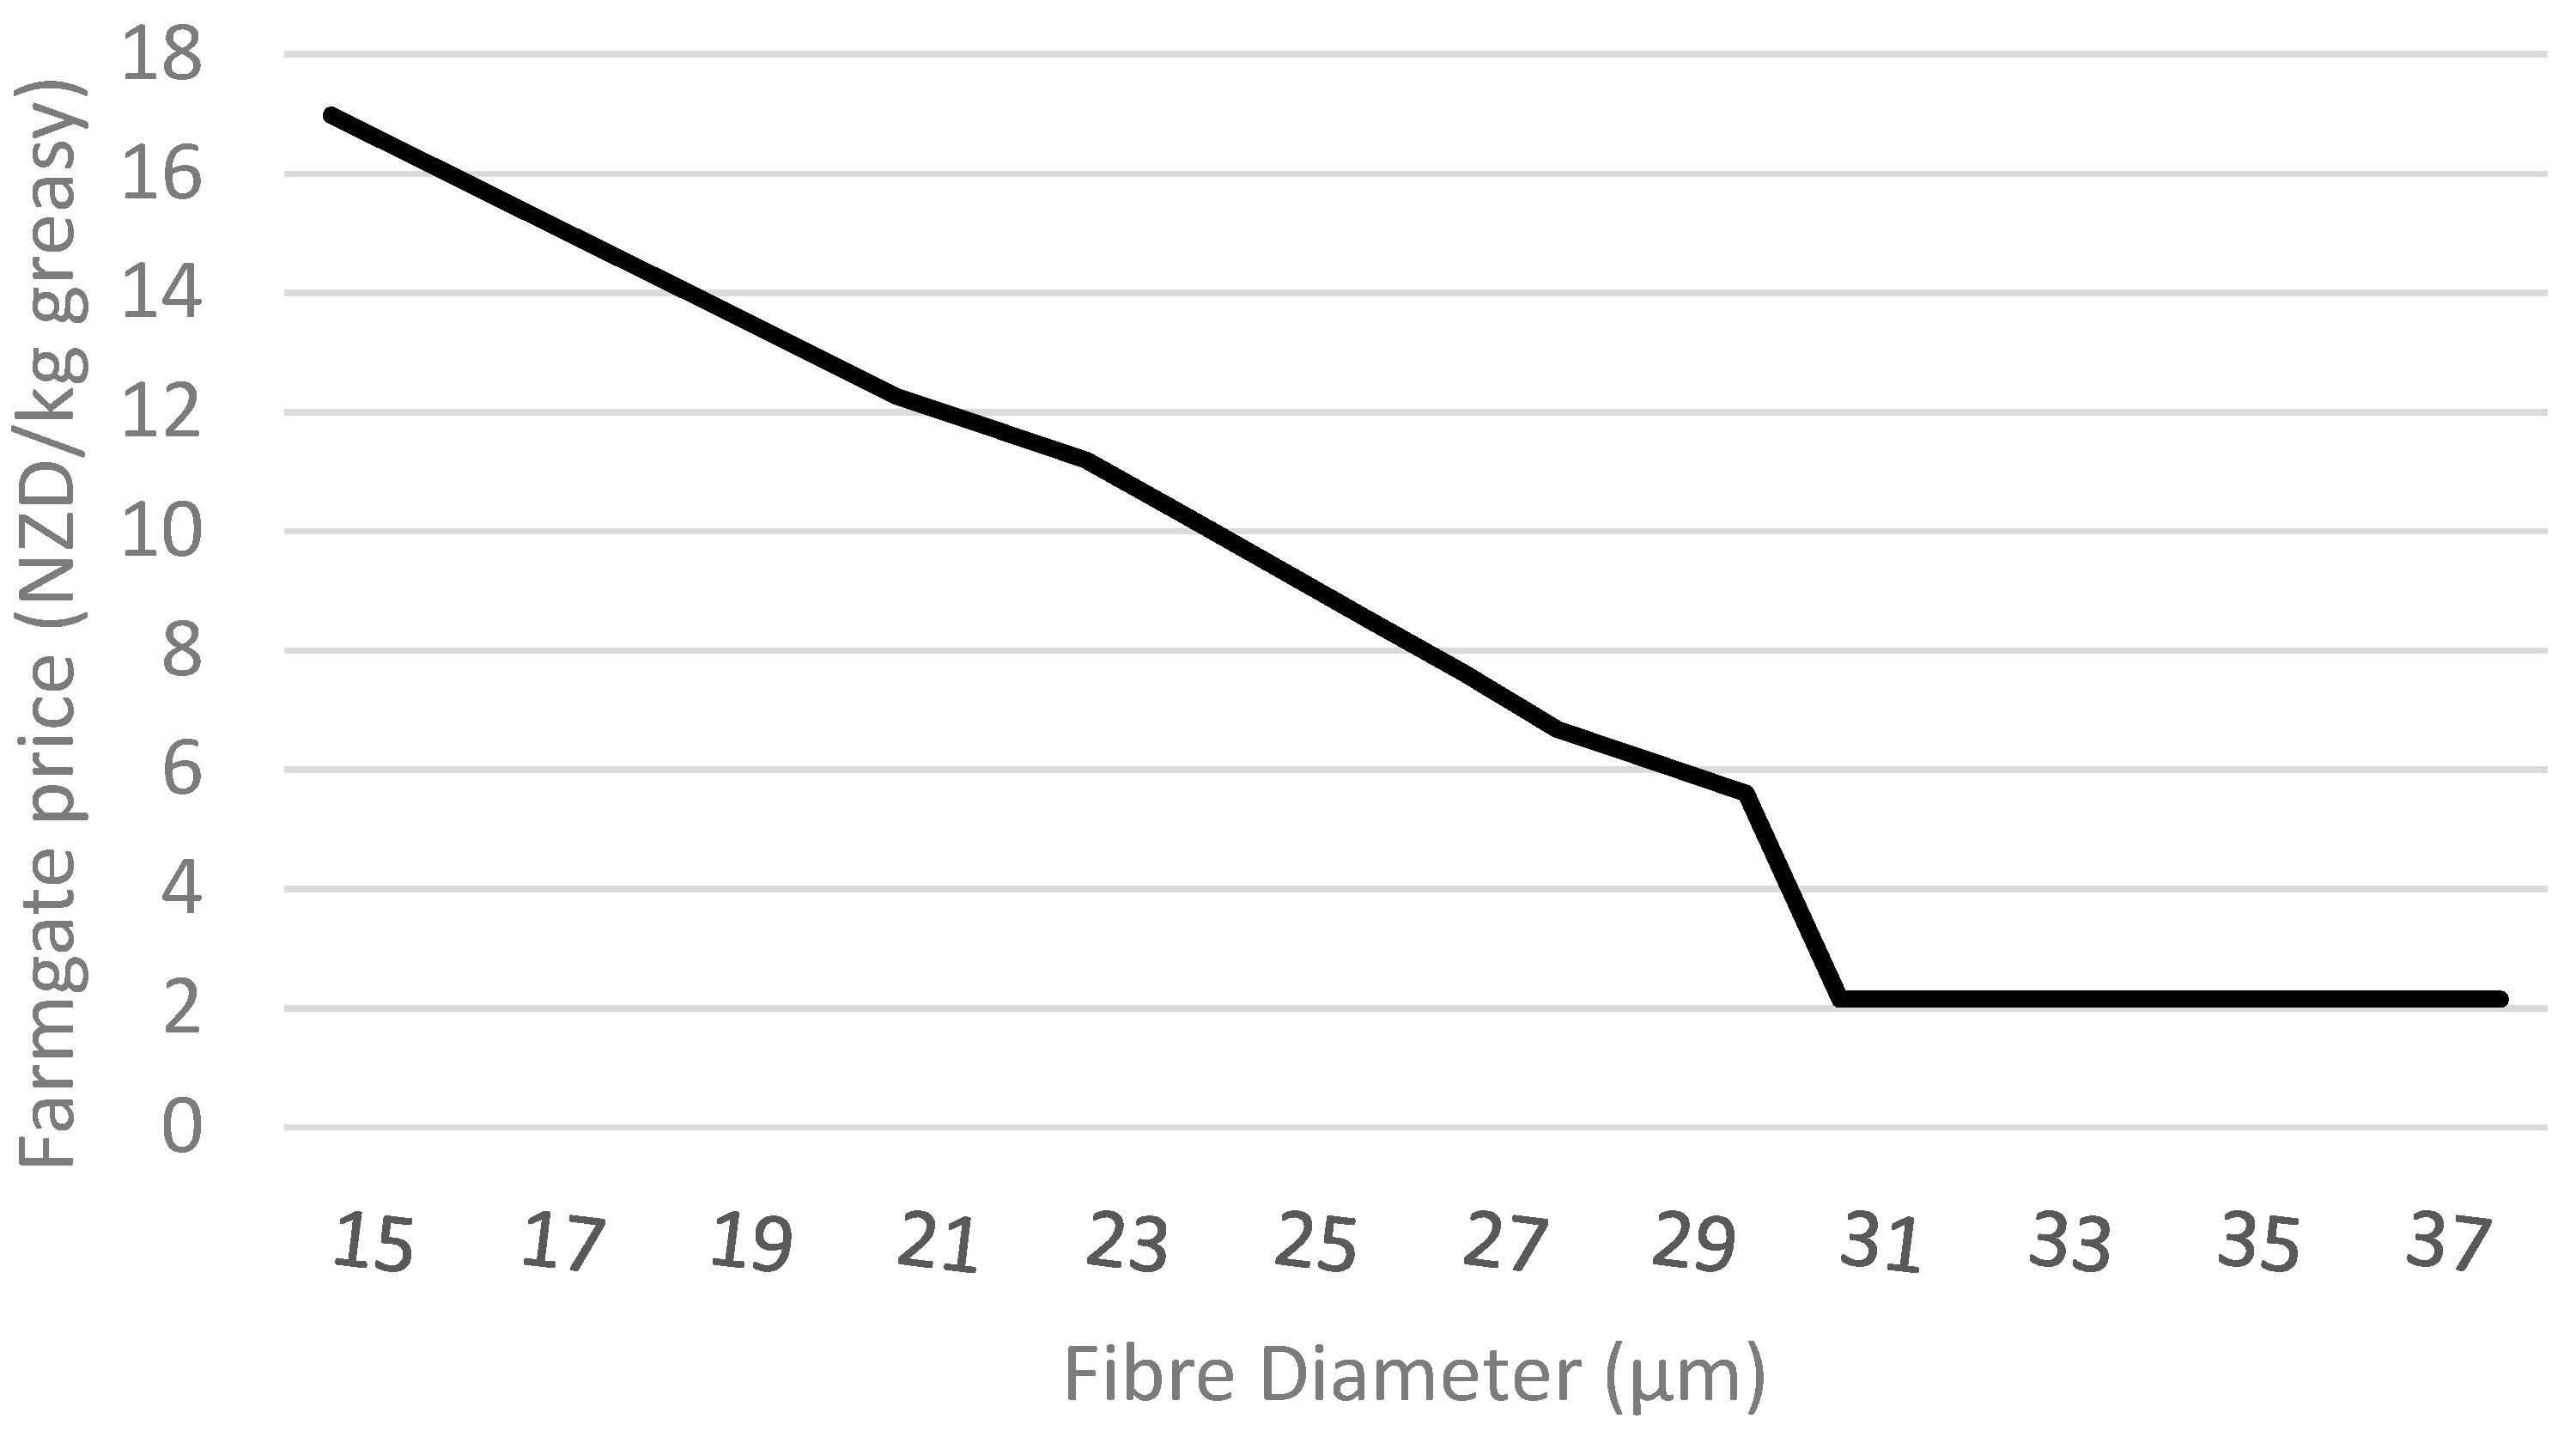
2.4.2. Wool Prices
2.4.3. Expenses
2.4.4. Net Present Value
2.5. The Post-Transition ¾Merino¼Romney Flock
3. Results
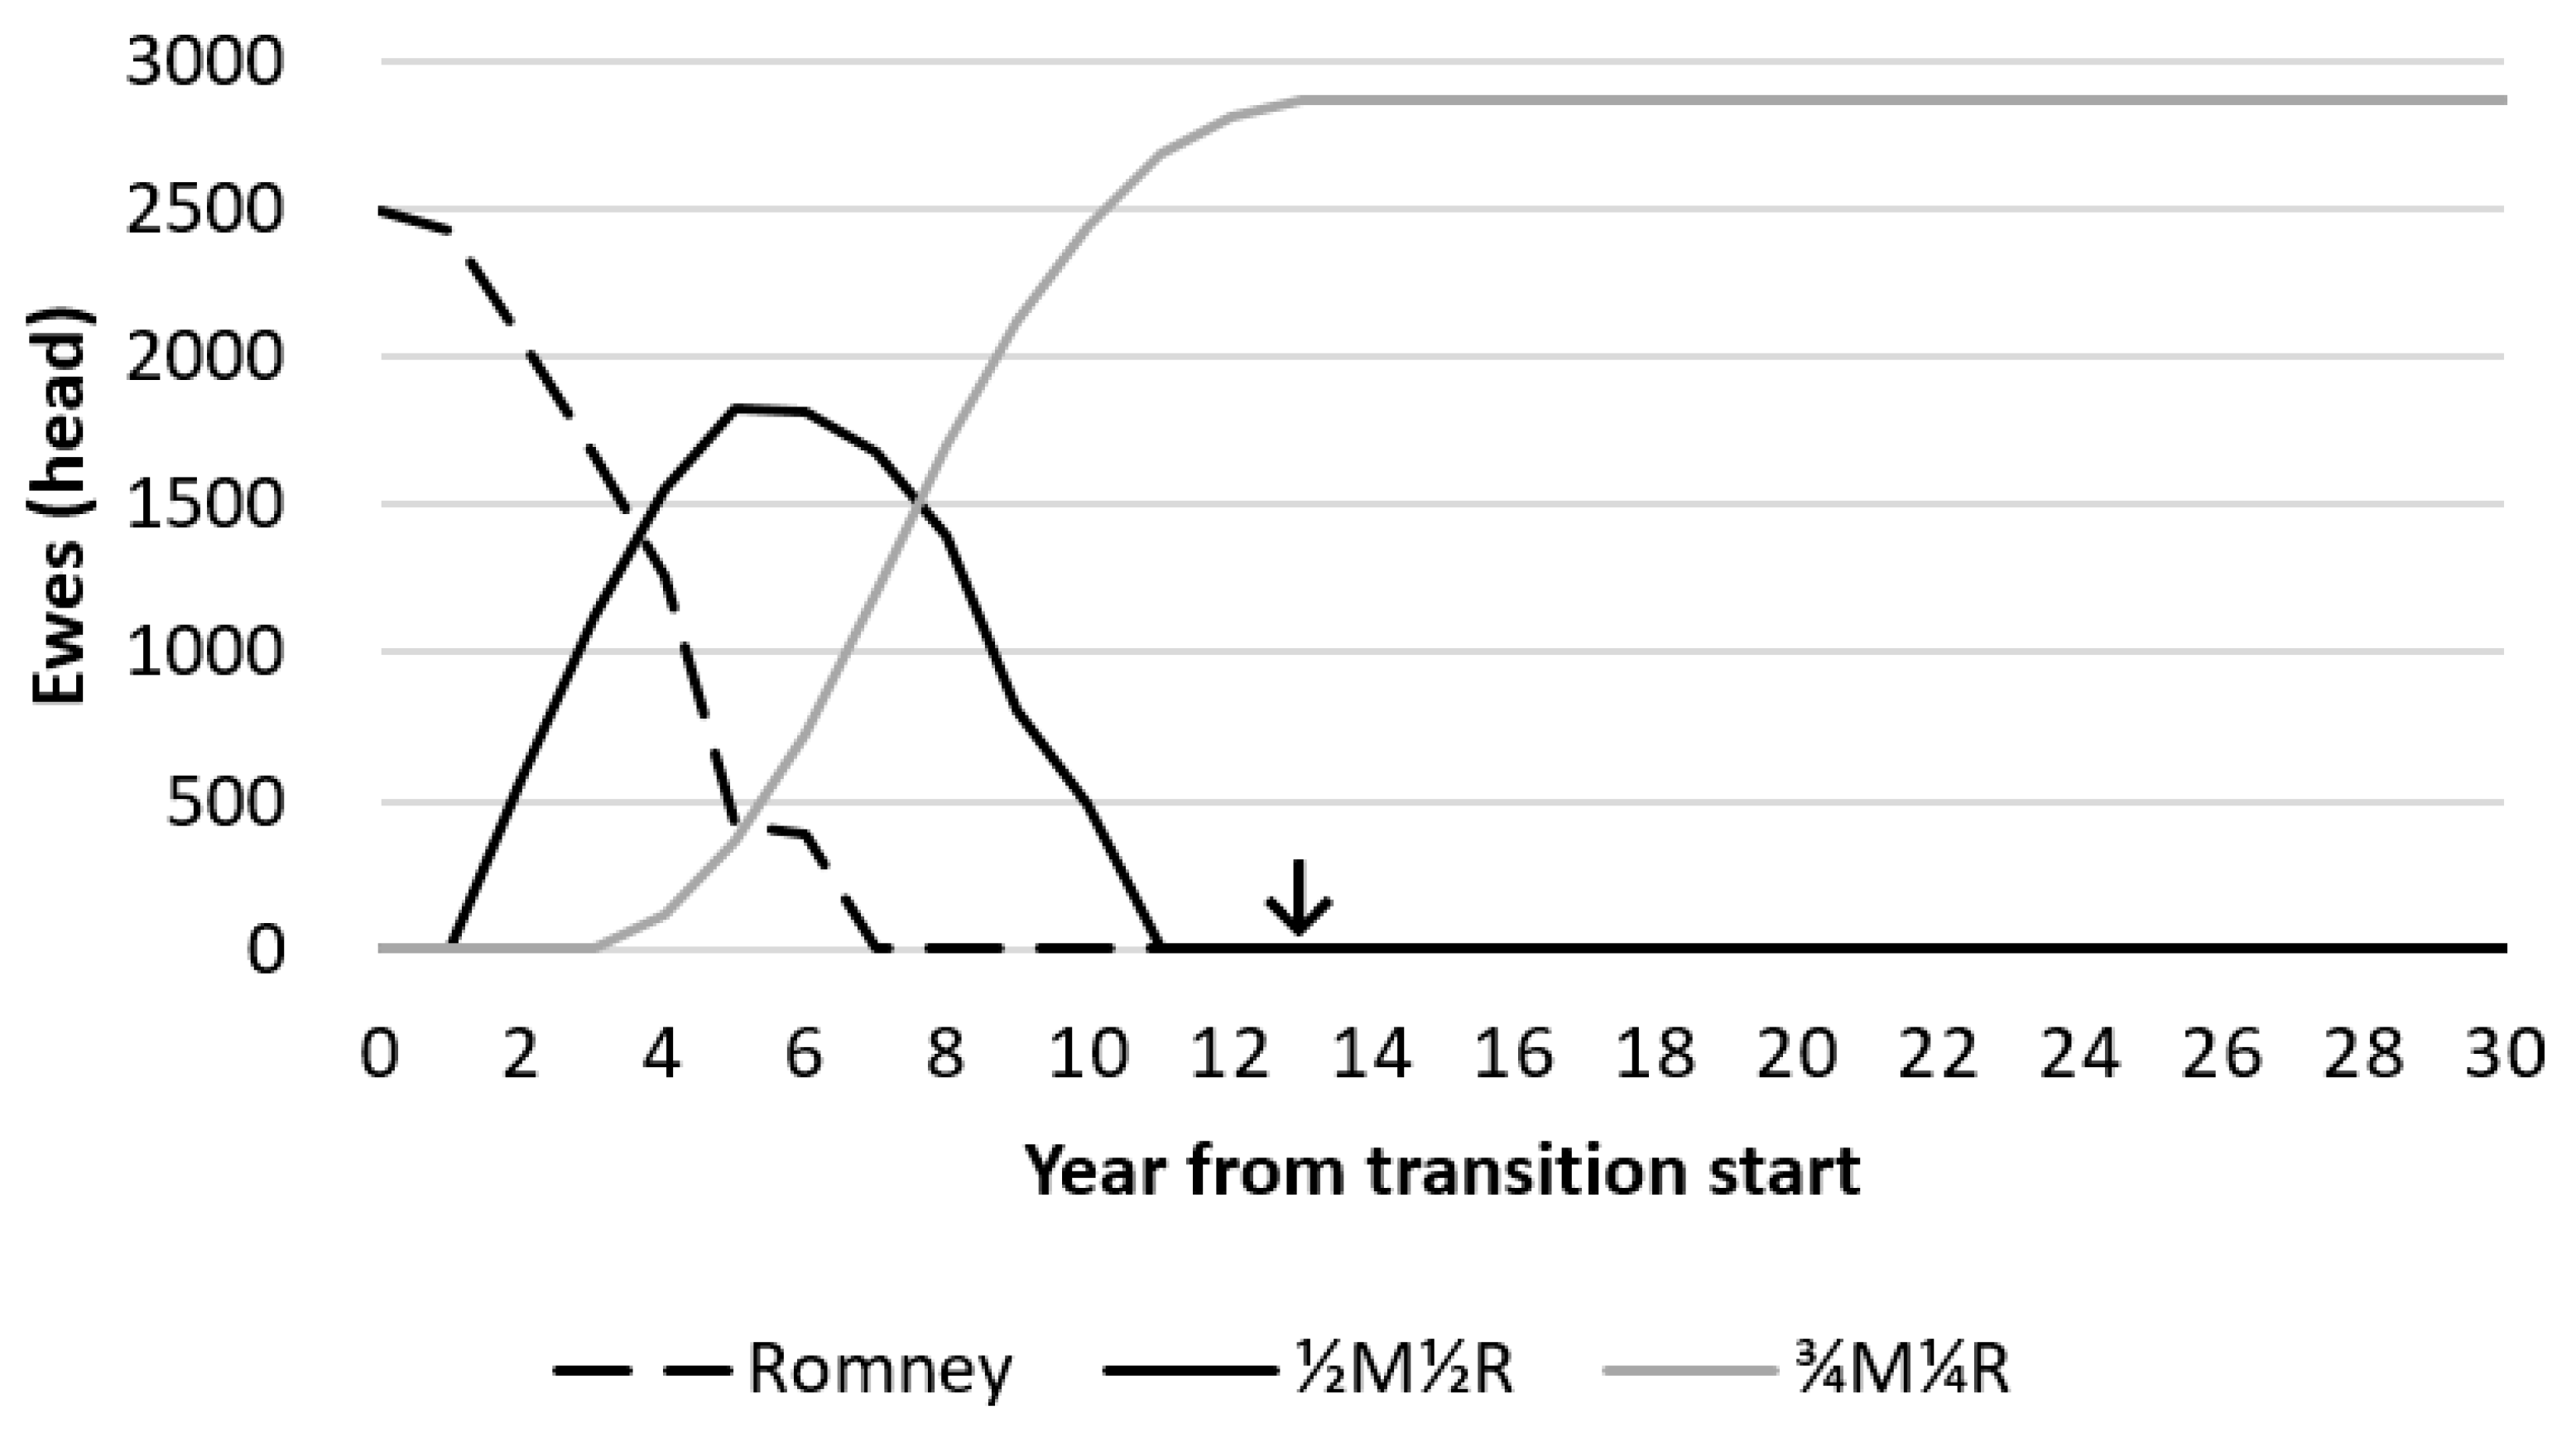
3.1. Ewe Numbers
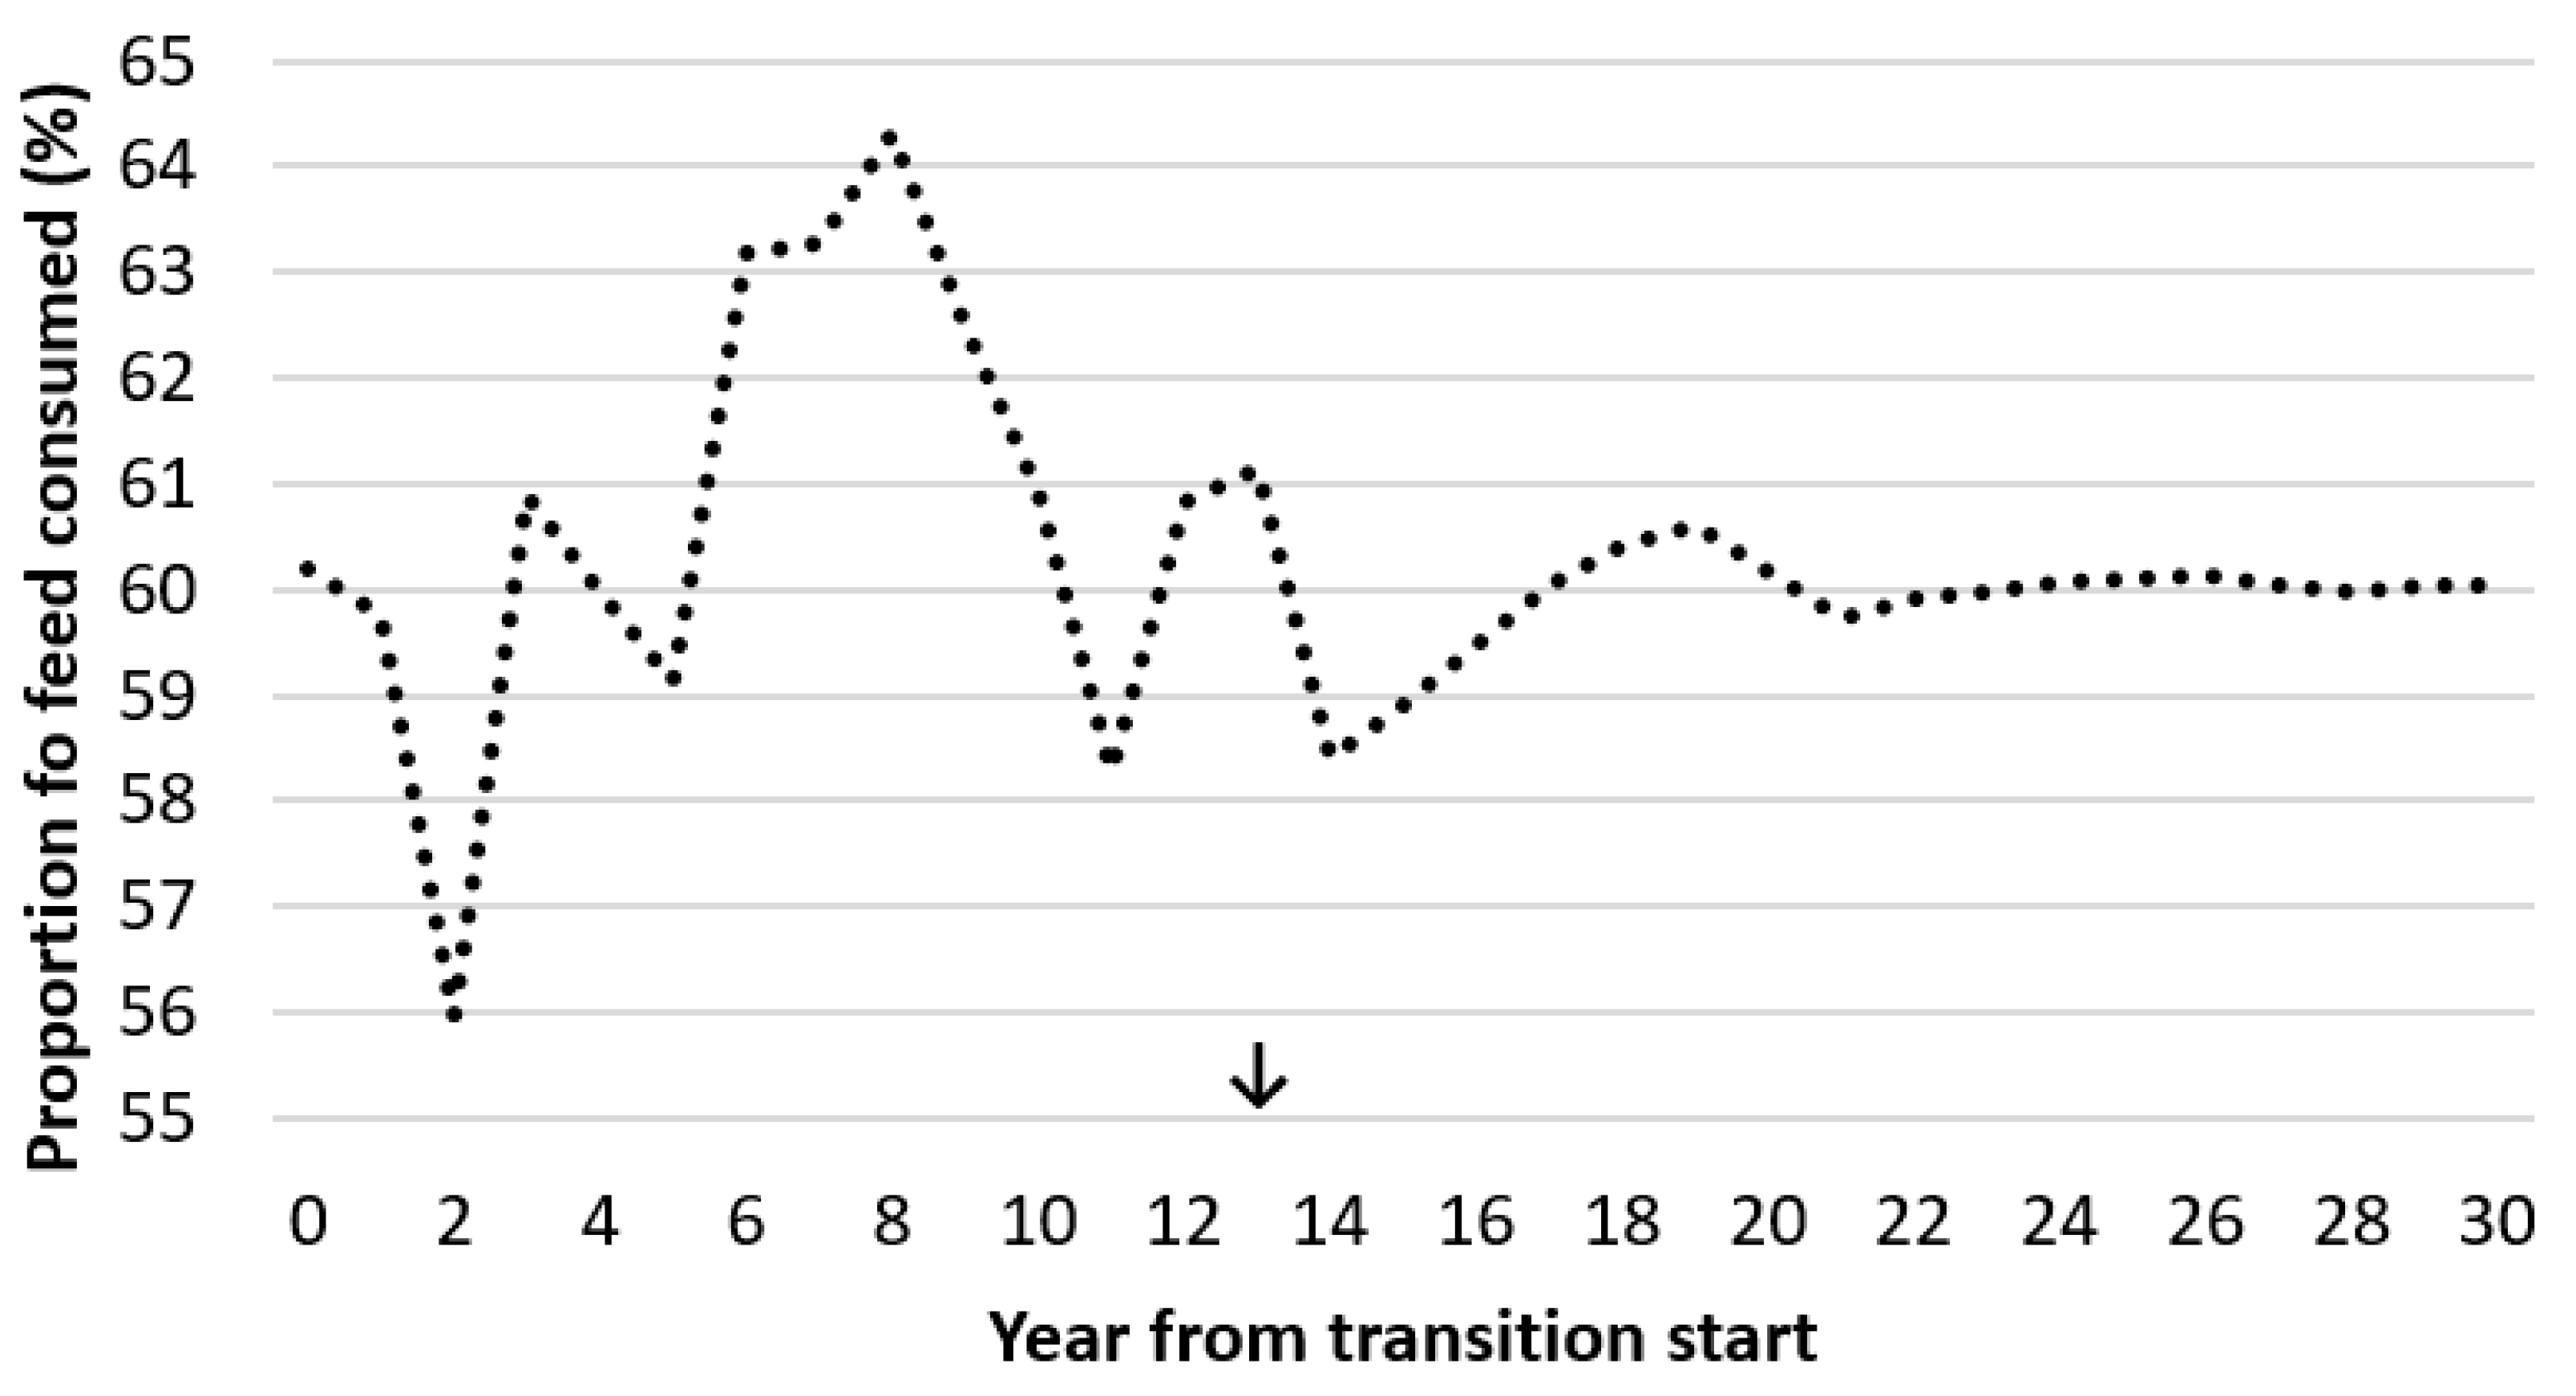
3.2. Feed Demand
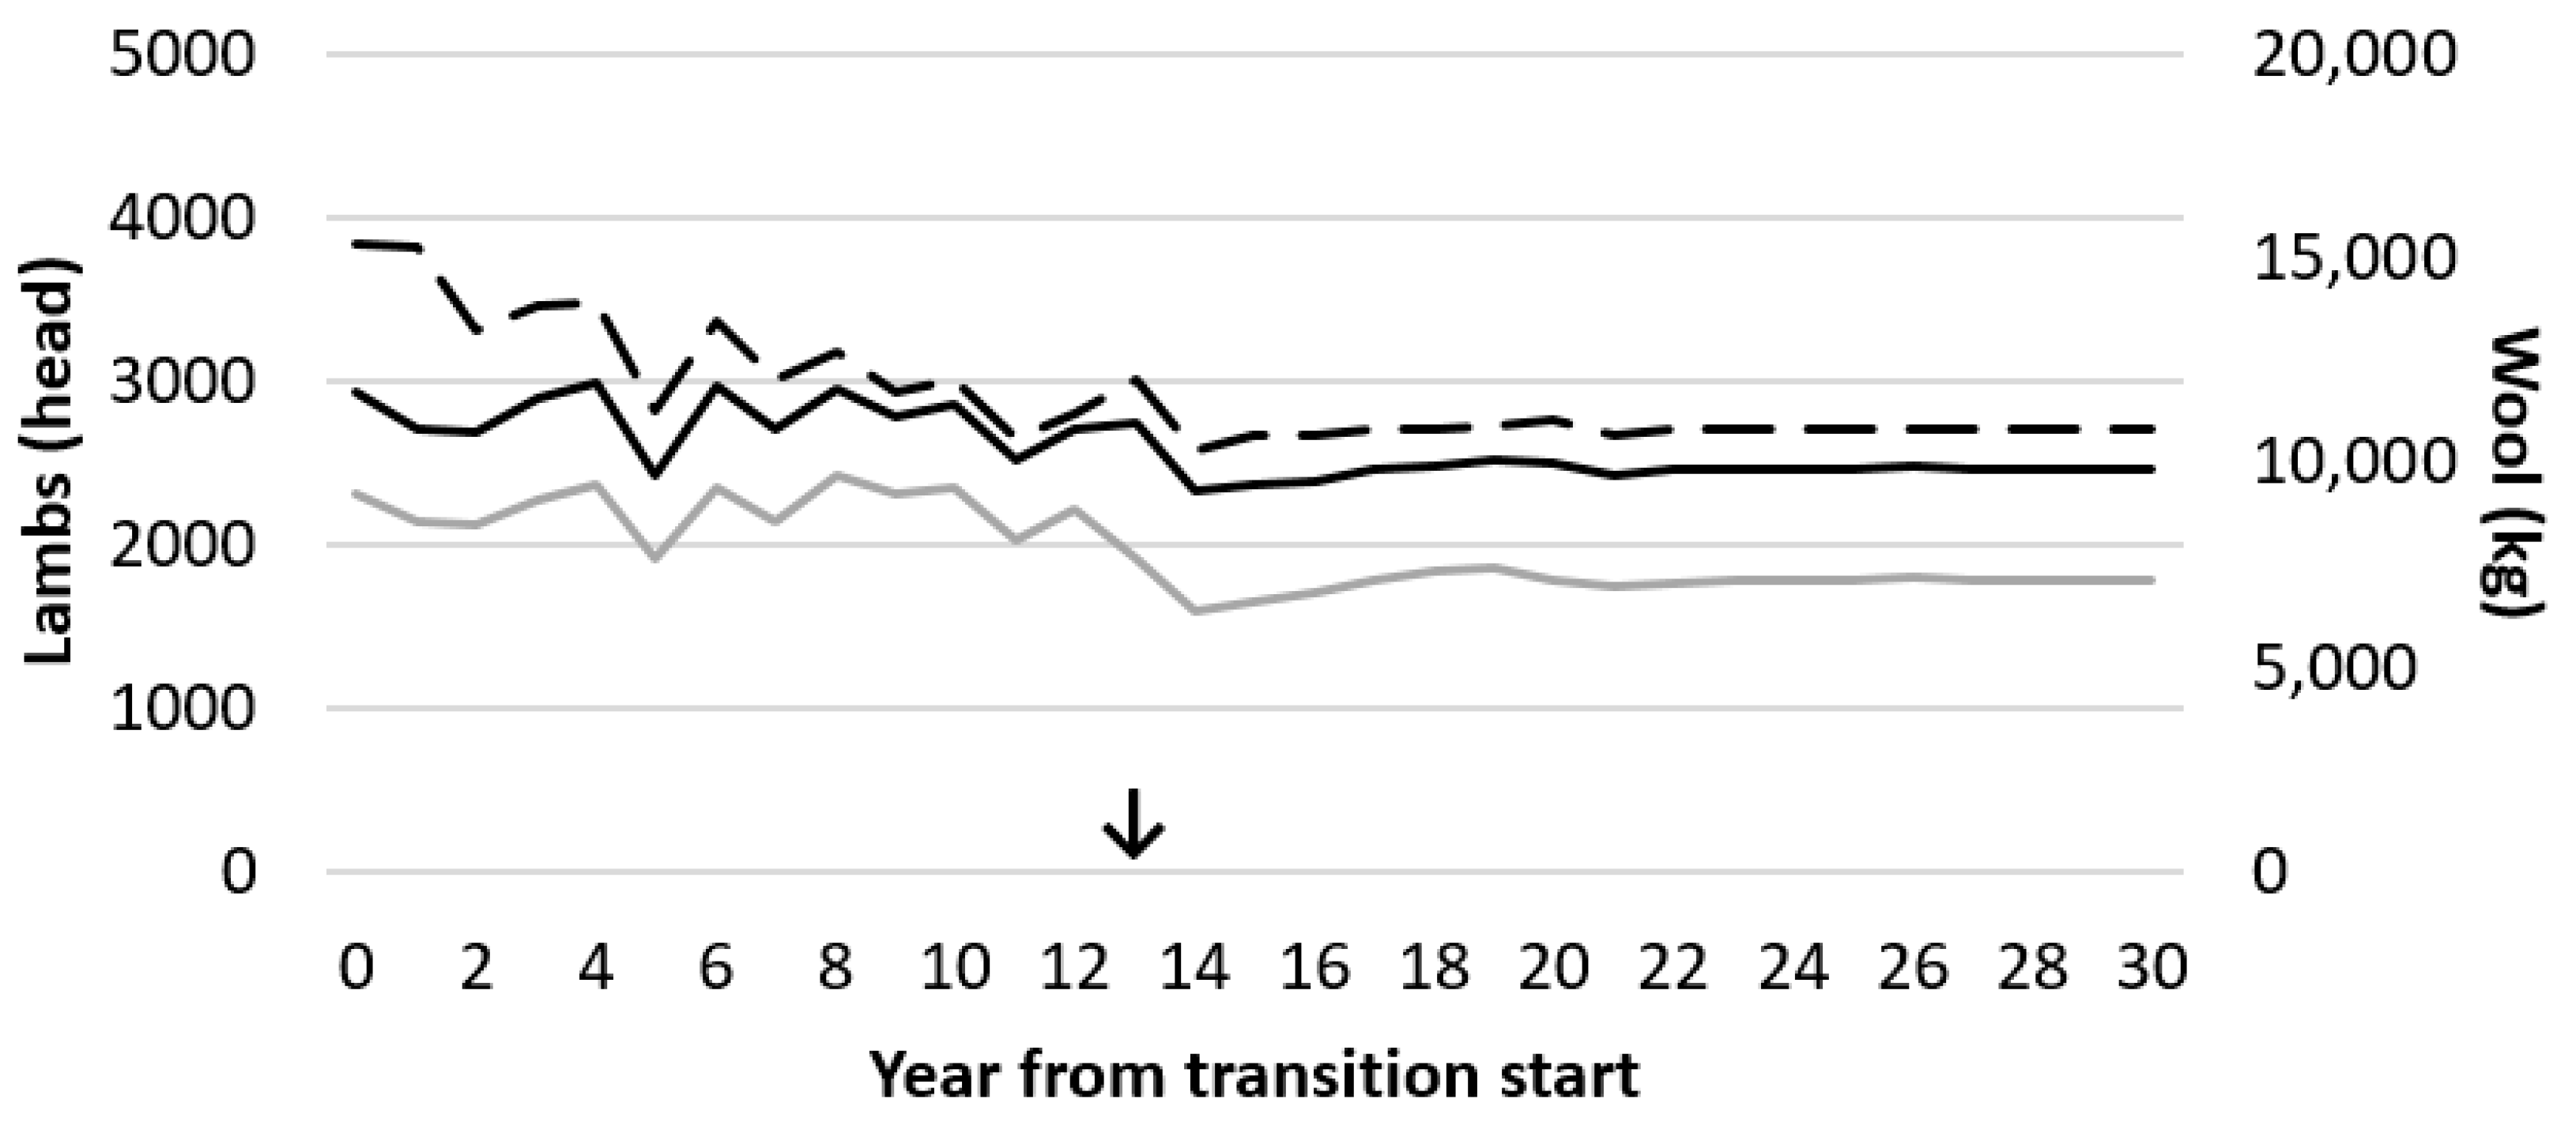
3.3. Production
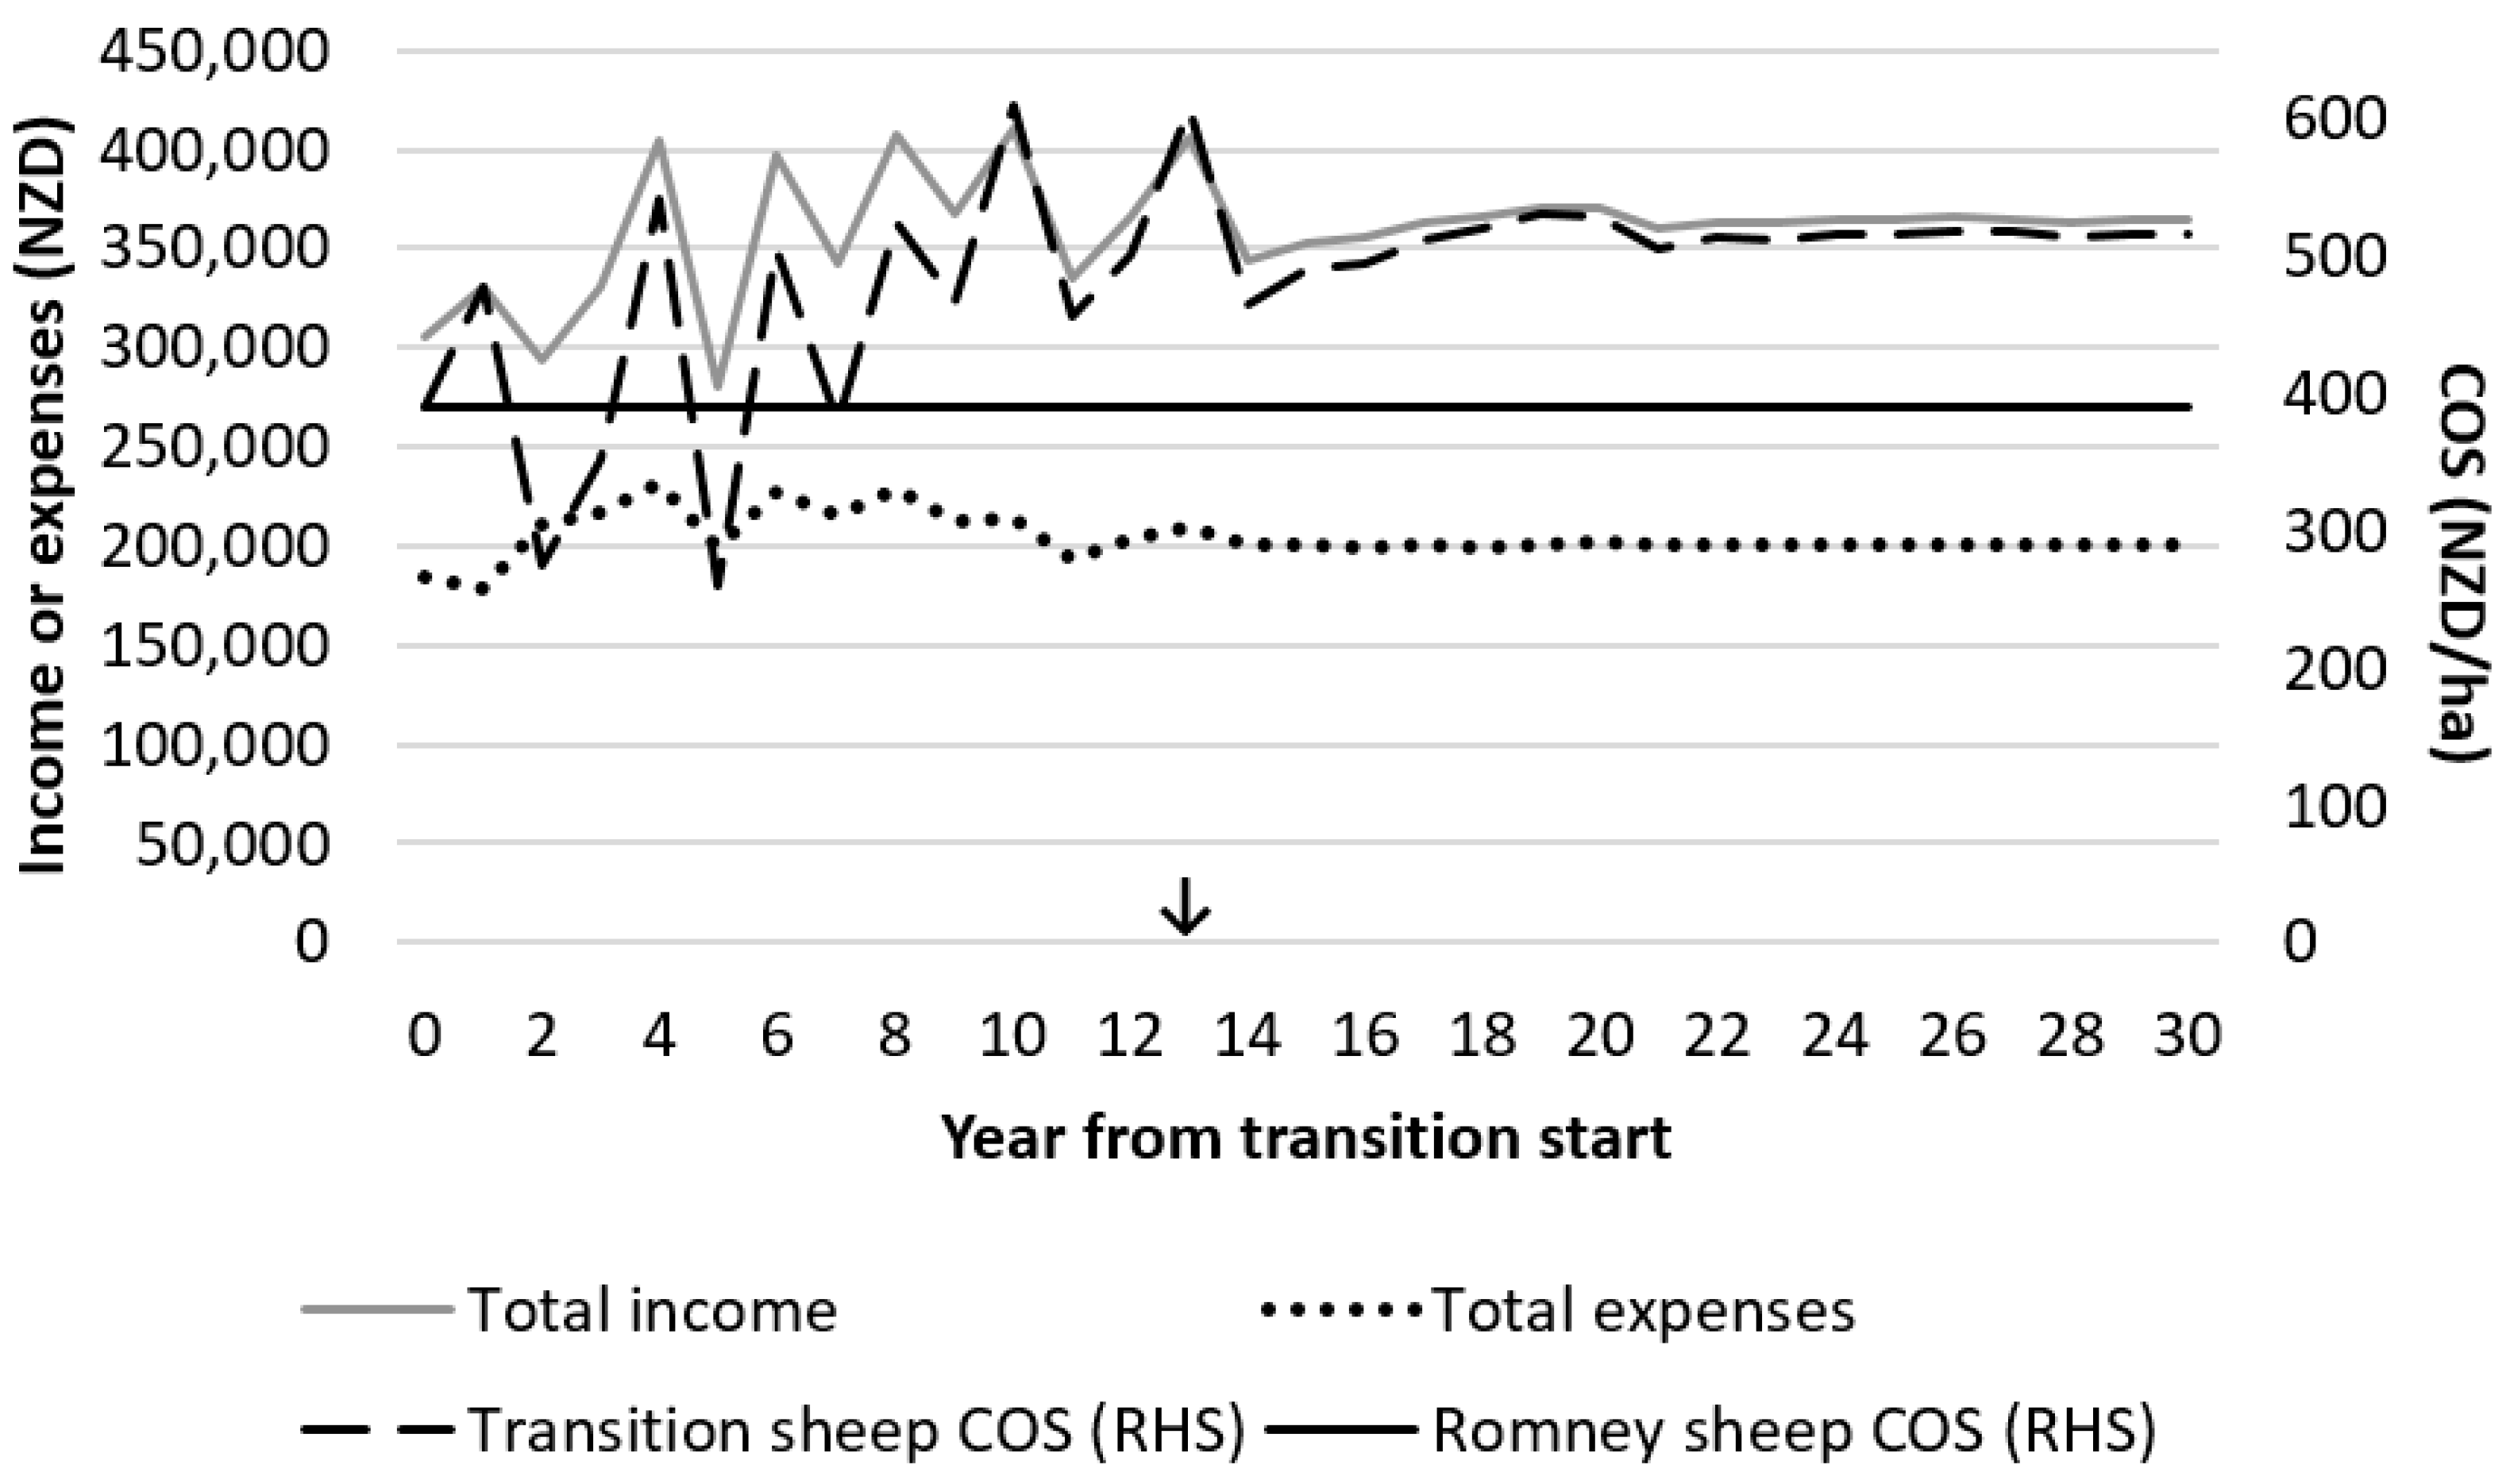
3.4. Economics
Net Present Value
4. Discussion
Economics
5. Conclusions
Author Contributions
Funding
Conflicts of Interest
References
- Farm Facts. Available online: http://www.beeflambnz.com/sites/default/files/data/files/nz-farm-facts-451compendium-2017.pdf. (accessed on 5 February 2020).
- Benchmark Your Farm. Available online: https://beeflambnz.com/data-tools/benchmark-your-farm (accessed on 5 February 2020).
- Rae, A. What can the sheep farmer do to meet changing wool market conditions? Sheep Farm. Ann. 1967, 89–95. [Google Scholar]
- Farrell, L.J.; Tozer, P.R.; Kenyon, P.R.; Cranston, L.M.; Ramilan, T. Producing higher value wool through 435 a transition from Romney to Merino crossbred i: Flock dynamics, feed demand, and production of lambs 436 and wool. Small Rumin. Res. 2020, 192, 106212. [Google Scholar] [CrossRef]
- Farrell, L.J.; Tozer, P.R.; Kenyon, P.R.; Cranston, L.M.; Ramilan, T. Producing higher value wool through 435 a transition from Romney to Merino crossbred i: Cashflow and profit 436 and wool. Small Rumin. Res. 2020, 192, 106236. [Google Scholar] [CrossRef]
- STELLA Architect. Available online: https://www.iseesystems.com/store/products/stella-architect.aspx442 (accessed on 14 September 2020).
- Ford, A. Modelling the Environment, 2nd ed.; Bibliovault OAI Repository, the University of Chicago Press: Chicago, IL, USA, 2010. [Google Scholar]
- Farrell, L.J.; Morris, S.T.; Kenyon, P.R.; Tozer, P.R. Modelling a Transition from Purebred Romney to Fully Shedding Wiltshire-Romney Crossbred. Animals 2020, 10, 2066. [Google Scholar] [CrossRef] [PubMed]
- Cranston, L.; Ridler, A.; Greer, A.; Kenyon, P. Sheep Production. In Livestock Production in New Zealand; Stafford, K., Ed.; Massey University Press: Auckland, New Zealand, 2017; pp. 84–122. [Google Scholar]
- Thomson, B.; Muir, P.; Smith, N. Litter Size, Lamb Survival, Birth and Twelve Week Weight in Lambs Born to 469 Cross-Bred Ewes. In Proceedings of the New Zealand Grassland Association, Ashburton, New Zealand; 2004; Volume 66, pp. 233–237. Available online: https://0-doi-org.brum.beds.ac.uk/10.33584/jnzg.2004.66.2532 (accessed on 23 September 2021).
- Dobbie, J.; Hickey, S.; Smart, S. Farming for fine wools. Ruakura Farmer’s Conf. 1985, 37, 16–20. [Google Scholar]
- Quirke, J.; Meyer, H.; Lahlou-Kassi, A.; Hanrahan, J.; Bradfords, G.; Stabenfeldt, G. Natural and induced ovulation rate in prolific and non-prolific breeds of sheep in Ireland, Morocco and New Zealand. Reproduction 1987, 81, 309–316. [Google Scholar] [CrossRef] [PubMed] [Green Version]
- Smith, J.; McGowan, L.; Dobbie, J.; Smart, S. Seasonal Pattern of Ovulation in Merino Romney and Merino X Romney Ewes. In Proceedings of the New Zealand Society of Animal Production; 1989; pp. 249–254. Available online: http://www.nzsap.org/proceedings/1989/seasonal-pattern-ovulation-merino-romney-and-merino-x-romney-ewes (accessed on 23 September 2021).
- Hinch, G. The sucking behaviour of triplet, twin and single lambs at pasture. Applied Anim. Behav. Sci. 1989, 22, 39–48. [Google Scholar] [CrossRef]
- Montgomery, G.; Scott, I.; Littlejohn, R.; Davis, G.; Peterson, A. Concentrations of FSH are elevated in new-born ewe lambs carrying the Booroola F gene but not in lambs from a prolific Romney strain. Reprod. Fertil. Devel. 1989, 1, 299–307. [Google Scholar] [CrossRef] [PubMed]
- Everett-Hincks, J.; Wickham, G.; Blair, H. Performance of Romney and 1/4 Merino × 3/4 Romney Sheep on Wanganui Hill Country. In Proceedings of the New Zealand Society of Animal Production; 1998; pp. 266–269. [Google Scholar]
- Scobie, D.; Young, S.; O’Connell, D.; Gurteen, S. Skin wrinkles affect wool characteristics and the time taken to harvest wool from Merino and halfbred sheep. N. Z. J. Agric. Res. 2005, 48, 177–185. [Google Scholar] [CrossRef]
- Kelly, R.W. Components of reproductive wastage in sheep. Sheep Beef Cattle Vet. N.Z. Vet. Assoc. 1980, 10, 78–93. [Google Scholar]
- Meikle, H.; Wickham, G.; Rae, A.; Dobbie, J.; Hickey, S. Follicle and fleece characteristics of Merinos, Romneys and Merino-Romney crossbreds. In Proceedings of the New Zealand Society of Animal Production, New Zealand; 1988; Volume 48, pp. 195–200. [Google Scholar]
- Andrews, R.; Dodds, K.; Wuliji, T. Dark fibre and skin pigmentation in New Zealand wool selection flocks. Aust. Assoc. Anim. Breed. Genet. 1995, 11, 658–661. [Google Scholar]
- Andrews, R.; Beattie, A.; Dodds, K.; Wuliji, T.; Montgomery, G. Wool follicle traits of half Merino half Romney F1, and backcross three-quarters Merino quarter Romney gene mapping flocks. In Proceedings of the New Zealand Society of Animal Production, New Zealand; 1998; Volume 58, pp. 262–265. Available online: http://www.nzsap.org/proceedings/1998/wool-follicle-traits-half-merino-half-romney-f1-and-backcross-three-quarters-merino (accessed on 23 September 2021).
- Wuliji, T.; Montgomery, G.; Dodds, K.; Andrews, R.; Beattie, A.; Turner, P.; Rogers, J. Establishing a flock for gene mapping in wool traits. In Proceedings of the New Zealand Society of Animal Production, New Zealand; 1995; Volume 55, pp. 285–288. Available online: https://www.nzsap.org/proceedings/1995/establishing-flock-gene-mapping-wool-traits (accessed on 23 September 2021).
- Evaluating Halfbreeds in the North Island. Available online: https://static1.squarespace.com/static/57479299e32140c00f38405e/t/5750bf3a3c44d896fc854888/1464909633610/Halfbreds-at-Poukawa.pdf (accessed on 17 October 2019).
- Inventas Media Newsletter; AgBrief: Wellington, New Zealand, 2018.
- Price List. Available online: https://nzwta.co.nz/assets/Docs/Fees-List-July-2019-Updated.pdf (accessed on 13 January 2020).
- Shadbolt, N.; Martin, S. Farm Management in New Zealand; Oxford University Press: Melbourne, Australia, 2005. [Google Scholar]
- Trafford, G.; Trafford, S. Farm Technical Manual; Lincoln University: Christchurch, New Zealand, 2011. [Google Scholar]
- Schwass, M.; (The New Zealand Merino Company, Christchurch, New Zealand); Farrell, L.J.; (Massey University, Palmerston North, New Zealand). Personal communication, 2019.
- South Island Sale. Available online: http://cpwool.co.nz/wp-content/uploads/2019/10/Market-Report-C15.pdf (accessed on 10 October 2019).
- Cottle, D.J. Wool Preparation, Testing and Marketing. In International Sheep and Wool Handbook; Cottle, D., Ed.; Nottingham University Press: Nottingham, UK, 2010. [Google Scholar]
- Robison, L.J.; Barry, P.J. Present Value Models and Investment Analysis; Academic Page: Northport, AL, USA, 1996. [Google Scholar]
- Business and Rural Loan Interest Rates and Fees. Available online: https://www.asb.co.nz/business-loans/interest-rates-fees.html (accessed on 26 February 2020).
- Retail Interest Rates on Lending and Deposits—B3. Available online: https://www.rbnz.govt.nz/statistics/b3 (accessed on 10 February 2020).
- Kenyon, P.; Webby, R. Pastures and Supplements in Sheep Production Systems. In Pasture and Supplements for Grazing Animals; Rattray, P.V., Brookes, I.M., Nicol, A.M., Eds.; New Zealand Society of Animal Production Occasional Publication: Hamilton, New Zealand, 2007; pp. 255–274. [Google Scholar]
- Wright, D.F.; Rhodes, A.P.; Hamilton, G.J. Merinos—A profitable diversification option for most North Island hill country. In Proceedings of the New Zealand Grassland Association, New Zealand; 1990; pp. 177–180. Available online: https://0-doi-org.brum.beds.ac.uk/10.33584/jnzg.1990.51.1903 (accessed on 23 September 2021).


| Age Class | Adjustment Parameter | ||
|---|---|---|---|
| Lambs Weaned | Fleece Weight | Wool Fibre Diameter | |
| Lamb | - | 0.50 | 1.02 |
| One year old | 0.22 | 0.95 | 1.02 |
| Two year old | 0.88 | 1.01 | 1.10 |
| Three year old | 1.00 | 1.08 | 1.12 |
| Four year old | 1.08 | 1.05 | 1.13 |
| Five year old | 1.13 | 1.01 | 1.12 |
| Six year old | 1.10 | 0.97 | 1.11 |
| Seven year old | 1.00 | 0.96 | 1.10 |
| Parameter | Romney | ½M½R | ¾M¼R |
|---|---|---|---|
| One year old death rate (%) | 1.9 | 1.9 | 1.9 |
| Two- to seven-year-old death rate (%) | 5.2 | 5.2 | 5.2 |
| Lambing rate (%) 1 | 132 | 120 | 114 |
| Mature liveweight (kg) | 65 | 60 | 55 |
| Mature ewe greasy fleece weight (kg) | 4.57 | 4.16 | 3.75 |
| Fleece yield (%) | 75.3 | 75.3 | 75.3 |
| Lamb survival (%) 2 | 84 | 84 | 84 |
| Birth weight of single-born lambs (kg) | 5.5 | 5.5 | 5.5 |
| Birth weight of multiple-born lambs (kg) | 4.5 | 4.5 | 4.5 |
| Weaning age (weeks) | 12 | 12 | 12 |
| Weaning weight of single-born lambs (kg) | 28 | 25 | 24 |
| Weaning weight of multiple-born lambs (kg) | 26 | 23 | 23 |
| Post-weaning growth of single-born lambs (g/day) | 130 | 120 | 109 |
| Post-weaning growth of multiple-born lambs (g/day) | 100 | 92 | 84 |
| Carcass weight of prime lambs (kg) | 17.9 | 17.9 | 17.9 |
| Carcass dressing out rate of prime lambs (%) | 41 | 41 | 41 |
| Year | Romney | ½ Merino½Romney | ¾Merino¼Romney | ||||||||
|---|---|---|---|---|---|---|---|---|---|---|---|
| Y2 to 3 | Y4 | Y5 | Y6 | Y2 to 3 | Y4 | Y5 | Y6 | Y7 | Y2 to 6 | Y7 | |
| 0 | 20 | 20 | 20 | 100 | |||||||
| 1 | 4 | 4 | 4 | 100 | |||||||
| 2 | 4 | 4 | 4 | 100 | |||||||
| 3 | 4 | 4 | 4 | 100 | |||||||
| 4 | 4 | 4 | 100 | 4 | |||||||
| 5 | 100 | 100 | 4 | ||||||||
| 6 | 100 | 4 | 4 | 4 | |||||||
| 7 | 4 | 25 | 4 | 4 | 4 | ||||||
| 8 | 40 | 4 | 4 | 4 | |||||||
| 9 | 4 | 4 | 100 | 4 | |||||||
| 10 | 100 | 100 | 4 | ||||||||
| 11 | 4 | 100 | |||||||||
| 12 | 4 | 100 | |||||||||
| 13 | 20 | 100 | |||||||||
| Sheep Sale Prices | ||||
|---|---|---|---|---|
| Breed | Sheep Type | Timing | Price (NZD/Head) 1 | Source |
| Romney | Prime lambs | Late-December | 5.70/kg | [24] |
| Prime lambs | Early February | 6.00/kg | ||
| Store lambs | Early May | 99.44 | [2] | |
| Cull ewes < 3 years old | December | 134.64 | ||
| Mature cull ewes | 113.73 | |||
| ½M½R | Prime lambs | Mid-January | 6.06/kg | [24] |
| Prime lambs | Mid-March | 6.13/kg | ||
| Cull ewes < 3 years old | December | 125.22 | [2] | |
| Mature cull ewes | 105.77 | |||
| ¾M¼R | Prime lambs | Mid-February | 6.00/kg | [24] |
| Prime lambs | Start of May | 6.31/kg | ||
| Cull ewes < 3 years old | December | 116.45 | [2] | |
| Mature cull ewes | 98.37 | |||
| Sheep Enterprise Expenses | ||||
| Breed | Item | Cost (NZD) | Source | |
| All | Operating 2 | 47.79 /SU 3 | [2] | |
| Animal health | 9.00/SU | |||
| Shearing | 6.00/SU | |||
| ½M½R and ¾M¼R | Wool testing 4 | 2.25/fleece | [25] | |
| Sheep Prices | Wool Prices | Scenario | 6% Discount Rate | 10% Discount Rate | ||
|---|---|---|---|---|---|---|
| 14 Years | 30 Years | 14 Years | 30 Years | |||
| Base | Base | Romney | 2,151,176 | 3,085,167 | 1,748,251 | 2,178,743 |
| Transition | 9.60 | 12.86 | 8.38 | 10.72 | ||
| +10% | Base | Romney | 2,326,748 | 3,486,771 | 1,913,638 | 2,462,355 |
| Transition | 8.39 | 11.05 | 7.35 | 9.27 | ||
| −10% | Base | Romney | 1,790,762 | 2,683,564 | 1,472,816 | 1,895,131 |
| Transition | 11.17 | 15.21 | 9.72 | 12.61 | ||
| Base | +10% | Romney | 2,091,151 | 3,133,714 | 1,719,871 | 2,213,027 |
| Transition | 11.65 | 15.31 | 10.24 | 12.88 | ||
| Base | −10% | Romney | 2,026,360 | 3,036,620 | 1,666,583 | 2,144,459 |
| Transition | 7.48 | 10.33 | 6.46 | 8.49 | ||
| +10% | +10% | Romney | 2,359,144 | 3,535,317 | 1,940,282 | 2,496,639 |
| Transition | 10.23 | 13.25 | 9.02 | 11.02 | ||
| −10% | −10% | Romney | 1,758,367 | 2,635,017 | 1,446,172 | 1,860,847 |
| Transition | 8.76 | 12.34 | 7.53 | 10.08 | ||
| −10% | +10% | Romney | 1,823,158 | 2,732,111 | 1,499,459 | 1,929,415 |
| Transition | 13.50 | 17.97 | 11.83 | 15.05 | ||
| +10% | −10% | Romney | 2,294,353 | 3,438,224 | 1,886,994 | 2,428,072 |
| Transition | 3.89 | 6.62 | 3.18 | 5.08 | ||
Publisher’s Note: MDPI stays neutral with regard to jurisdictional claims in published maps and institutional affiliations. |
© 2021 by the authors. Licensee MDPI, Basel, Switzerland. This article is an open access article distributed under the terms and conditions of the Creative Commons Attribution (CC BY) license (https://creativecommons.org/licenses/by/4.0/).
Share and Cite
Farrell, L.J.; Tozer, P.R.; Kenyon, P.R.; Cranston, L.M.; Ramilan, T. Producing Higher Value Wool through a Transition from Romney to Merino Crossbred: Constraining Sheep Feed Demand. Agriculture 2021, 11, 920. https://0-doi-org.brum.beds.ac.uk/10.3390/agriculture11100920
Farrell LJ, Tozer PR, Kenyon PR, Cranston LM, Ramilan T. Producing Higher Value Wool through a Transition from Romney to Merino Crossbred: Constraining Sheep Feed Demand. Agriculture. 2021; 11(10):920. https://0-doi-org.brum.beds.ac.uk/10.3390/agriculture11100920
Chicago/Turabian StyleFarrell, Lydia J., Peter R. Tozer, Paul R. Kenyon, Lydia M. Cranston, and Thiagarajah Ramilan. 2021. "Producing Higher Value Wool through a Transition from Romney to Merino Crossbred: Constraining Sheep Feed Demand" Agriculture 11, no. 10: 920. https://0-doi-org.brum.beds.ac.uk/10.3390/agriculture11100920