
Seed Production of Red Clover (Trifolium pratense L.) under Danish Field Conditions


Department of Agroecology, Aarhus University, Forsøgsvej 1, 4200 Slagelse, Denmark
*
Author to whom correspondence should be addressed.
Agriculture 2021, 11(12), 1289; https://0-doi-org.brum.beds.ac.uk/10.3390/agriculture11121289
Submission received: 1 December 2021
/
Revised: 15 December 2021
/
Accepted: 15 December 2021
/
Published: 18 December 2021
(This article belongs to the Special Issue Advances in Genetics, Breeding and Quality Traits in Forage and Clover Crops)
Abstract
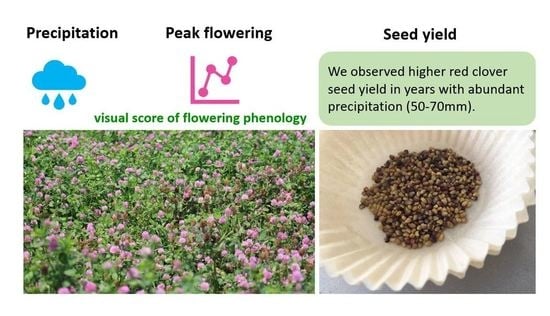
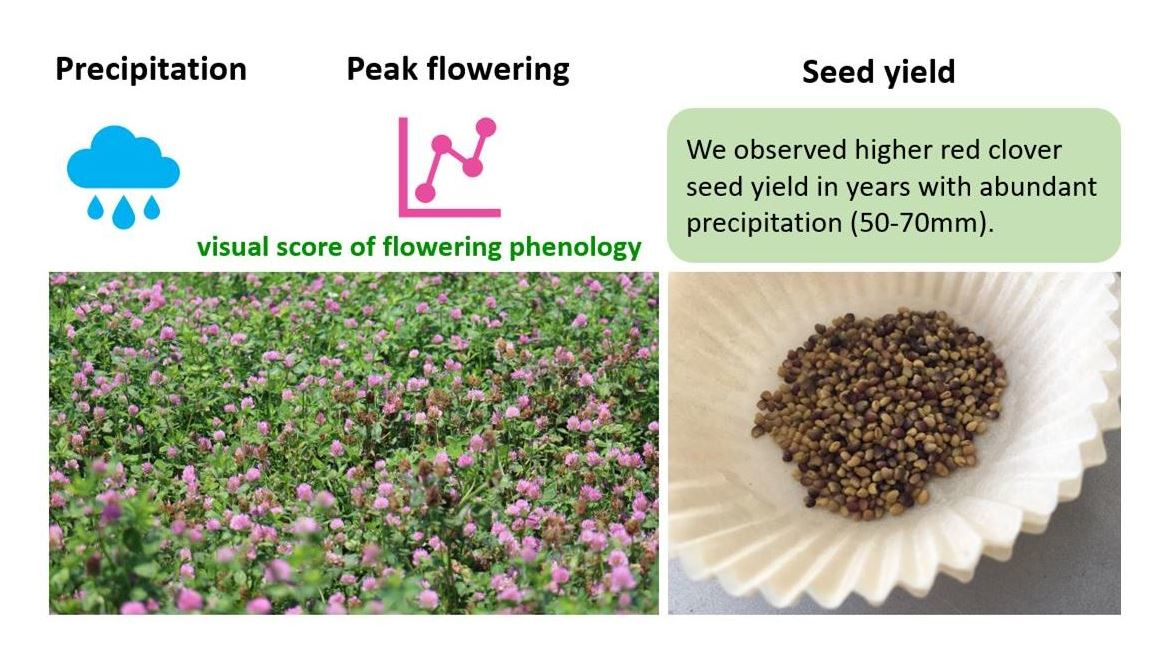
:High and stable seed yield is critical for red clover (Trifolium pratense L.) seed production and the commercial exploitation of the crop. A three-year experiment was conducted from 2013 to 2015 under Danish field conditions to explore the influence of precipitation during peak flowering on the seed yield of three red clover cultivars. We investigated the flowering duration and intensity based on a visual scale assessment, seed yield, and thousand seed weight in all three experimental years. In 2014 and 2015 we measured the seed yield components of floret number per flower head, seed number per flower head, and seed set. During the experimental period, high seed yields of more than 1000 kg ha−1 were obtained for the diploid cultivars ‘Rajah’ and ‘Suez’. Although a relatively high seed yield of 500 kg ha−1 was obtained in the tetraploid cultivar ‘Amos’, this was only around half of the seed yield and seed set of the diploid cultivars. Precipitation during peak flowering positively influenced the seed yield and thousand seed weight for the three cultivars. We conclude that observations of flowering phenology are required to determine the impact of environmental conditions on seed yield in red clover cultivars. Further, adequate water supply during peak flowering is important to obtain the high seed yield of red clover.
1. Introduction
As an important forage legume, red clover (Trifolium pratense L.) is widely grown in the temperate climate zone [1]. Red clover has previously been used in rotation with cereals as an excellent nitrogen (N) source [2]. To achieve higher forage yield, persistence and improved adaptability are the primary breeding goals as well as better resistance to insects and diseases [3,4]. Both diploid (2n = 2x = 14) and tetraploid (2n = 4x = 28) red clover cultivars are widely available. Compared with the diploid form, tetraploid red clover is more productive with larger leaves, larger flower heads, thicker stems, and bigger seeds [5,6]. Tetraploid red clover cultivars also have higher resistance to diseases and higher persistence [4]. Despite the superior advantages in meeting the primary breeding goals, the seed yield of tetraploid red clover is lower compared with diploid red clover [1,4,6]. Low yield increases the cost of seed production, leading to higher prices, which limits the commercial use of tetraploid red clover [1].
According to Boller [4], seed yield of 400 to 600 kg ha−1 can be expected. Low seed yield may limit the commercial seed production and seed growers’ interests in red clover for seed production [3,7]. For example, in Serbia the red clover seed yield is between 150 and 300 kg ha−1 [7,8]. In Denmark, the 10-year average (2011–2020) of seed production area was 275 ha and the average seed yield was 235 kg ha−1 [9]. Seed production in red clover varies considerably between years and locations. An increase of between-year seed yield variability (a doubling of the coefficient of variation) has been observed in red clover seed production in Sweden, which was suggested to be related to changes in bumble bee abundance [10]. Globally, climate variation accounts for nearly one-third of year-to-year crop yield variability [11].
Both abiotic environmental factors (e.g., temperature and precipitation) and biotic factors (e.g., pollinators and pests) as well as management practices influence seed yield. Low precipitation may limit the forage production of red clover [12,13,14], while abundant precipitation during peak flowering and seed development stage may decrease the seed yield in red clover [7,15], due to a negative impact on pollination conditions, adverse seed harvest conditions, etc. Previous studies demonstrated the importance of irrigation in improving the seed yield. In western Oregon in the United States, red clover seed yield was increased with irrigation treatments [16,17]. However, irrigation is getting more and more restricted in the Nordic countries and currently irrigation is not included in the standard cultivation practice although it might hold a potential to improve the commercial availability of red clover seed.
For the flowering phenology, both early- and late-flowering types are available in Europe, and late-flowering red clover cultivars are usually grown in northern latitudes [18]. Flowering, pollination, and the interaction between plant and pollinator is highly influenced by environmental conditions [19], and therefore information regarding the flowering time and intensity is required in order to compare the seed yield components among cultivars. However, only few studies [6,16] provide information about the flowering intensity and peak flowering time of red clover under field conditions.
This study aimed to investigate the flowering phenology and seed yield of the three most common red clover cultivars grown under Danish field conditions in three consecutive years and to explore the potential influence of the precipitation on the seed yield. Specifically, we made the first hypothesis that abundant precipitation during peak flowering time may positively influence red clover seed yield. To determine the peak flowering time of different red clover cultivars during three years, we recorded the flowering intensity based on a visual scale, and we made our second hypothesis that flowering phenology differ among three red clover cultivars in different years. To further compare the seed production among cultivars, we made the third hypothesis that seed yield and seed yield components varied among three cultivars.
2. Materials and Methods
2.1. Plant Material
We used three red clover cultivars ‘Rajah’ (diploid or 2x), cultivar ‘Suez’ (2x), and cultivar ‘Amos’ (tetraploid or 4x) in the field experiment. ‘Rajah’ and ‘Amos’ are the two most commonly grown diploid and tetraploid red clover cultivars for seed production in Denmark. To compare cultivars with similar flowering patterns, ‘Suez’ was included since, like ‘Amos’, it is an early/intermediate-flowering type, while ‘Rajah’ is an intermediate/late-flowering type. ‘Rajah’ was released in Denmark in 1983. ‘Suez’ and ‘Amos’ were released in the Czech Republic in 2001 and 1998, respectively. Further information on the cultivars can be found in the European plant variety database v.3.2.1 [20].
2.2. Experimental Set-Up
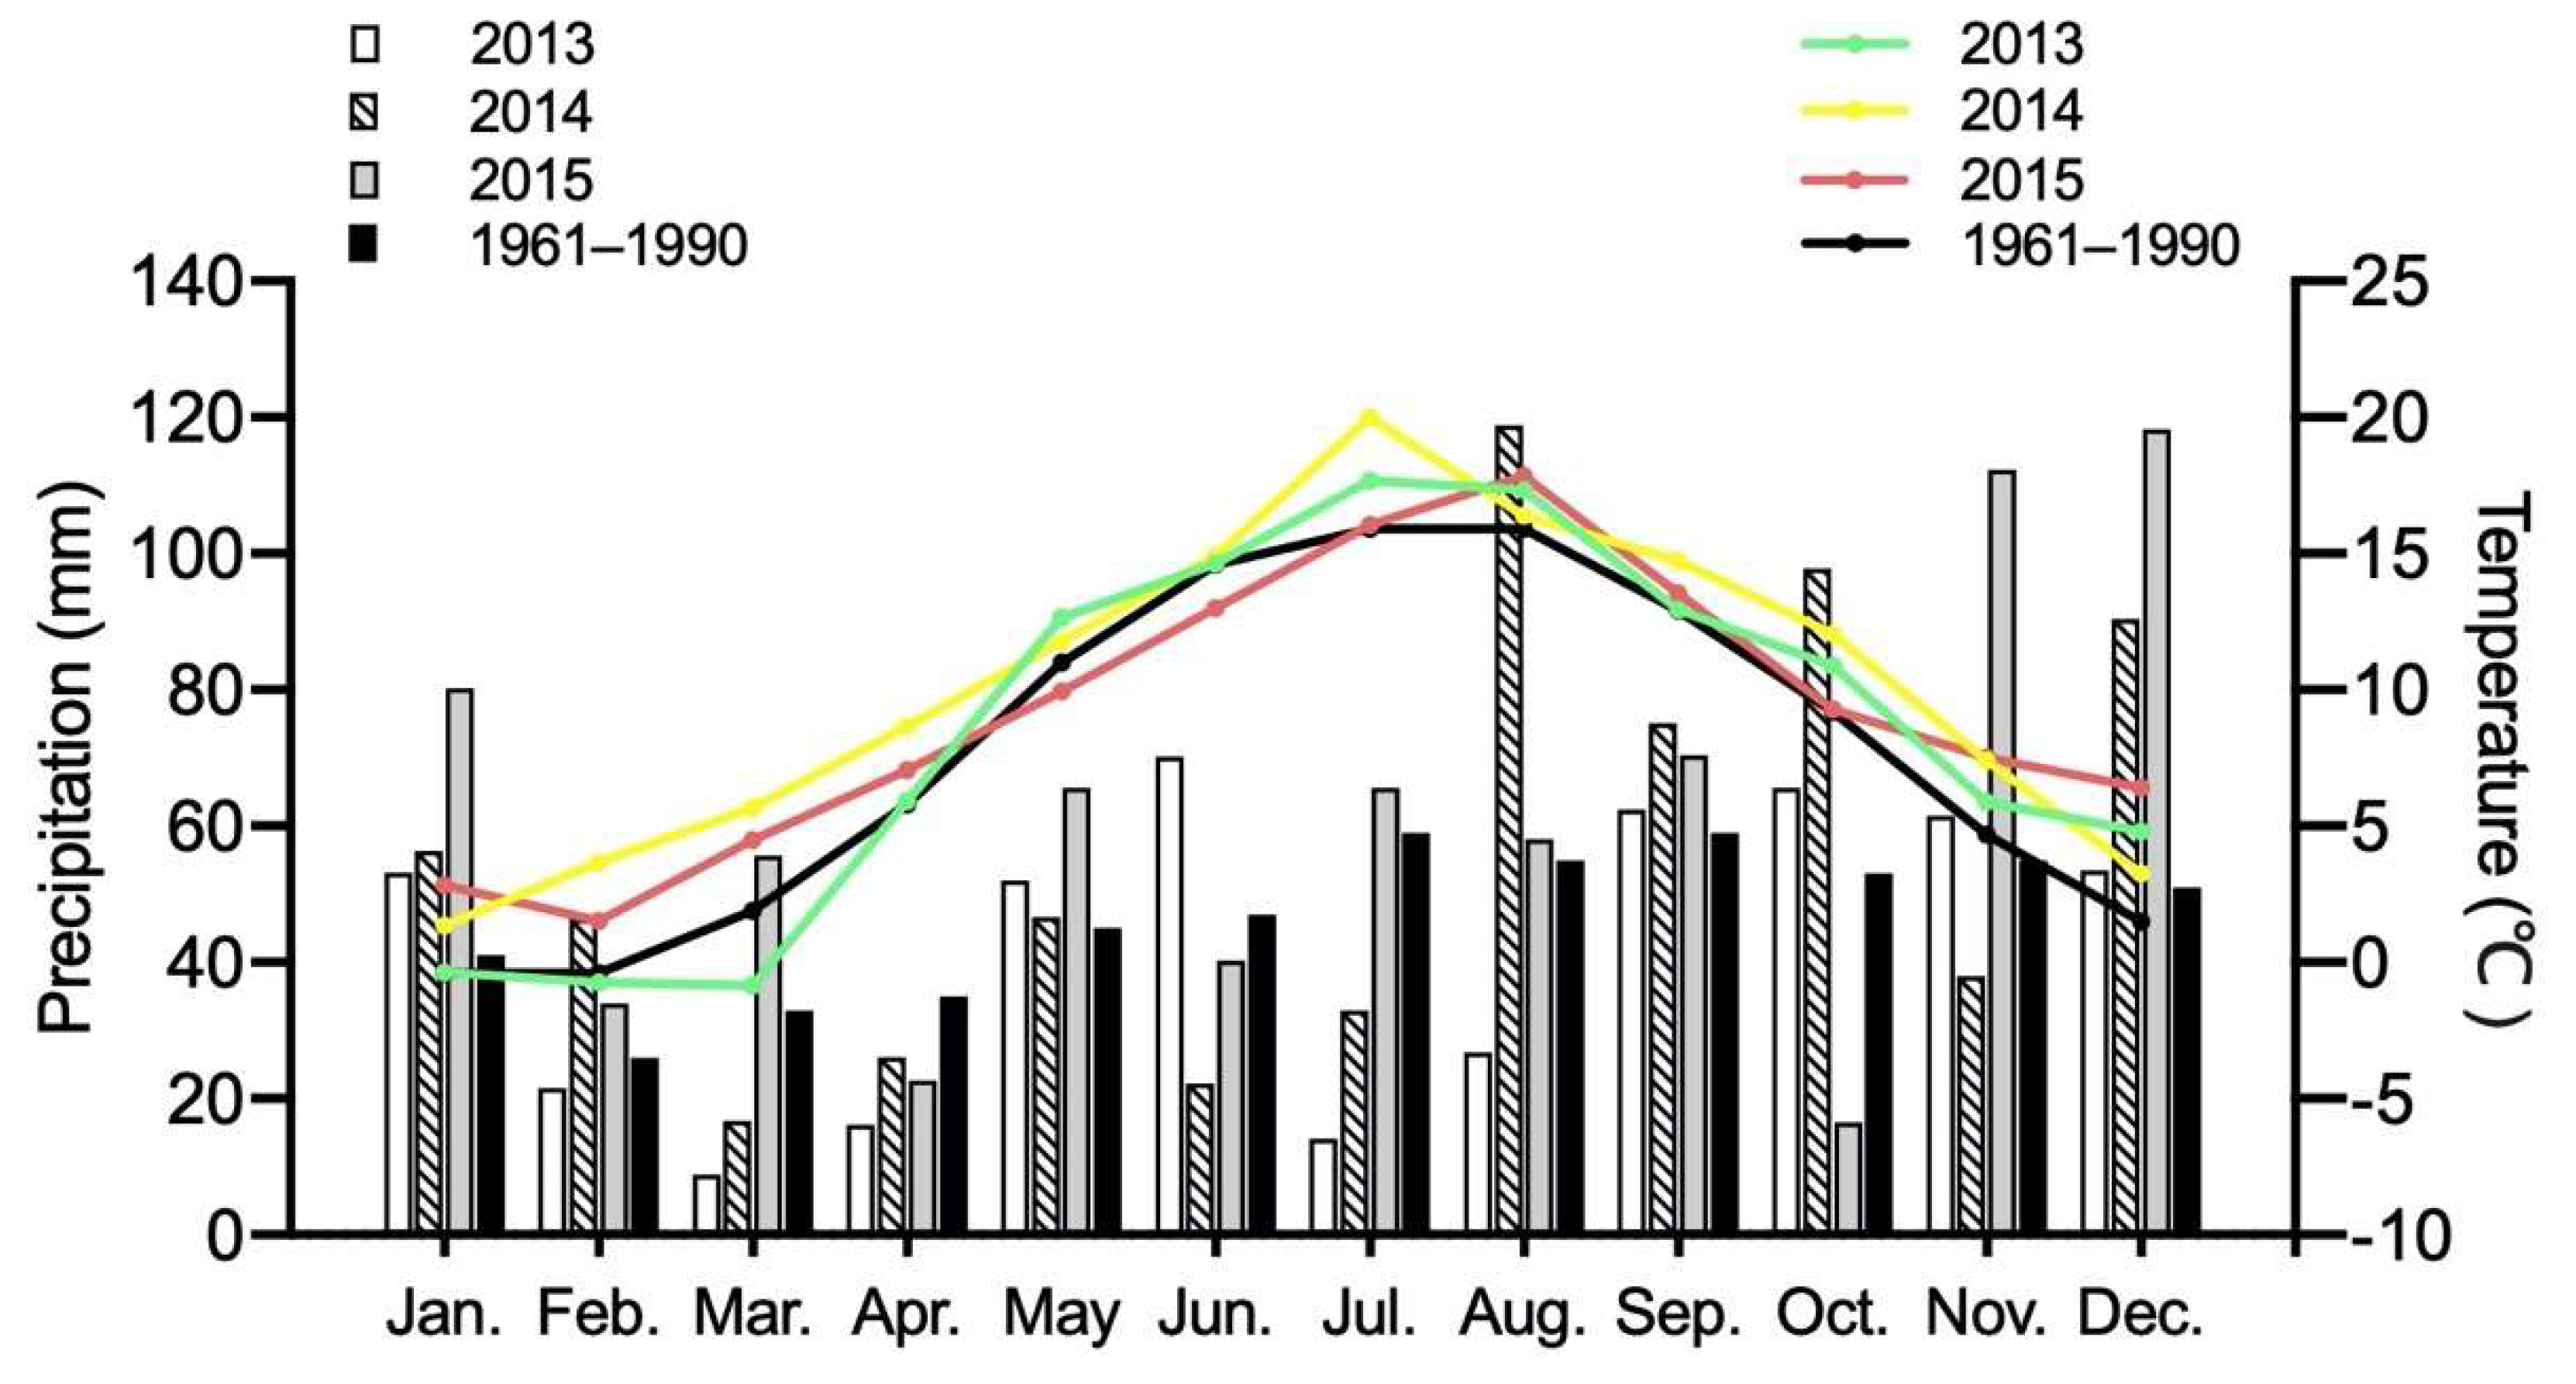
The field experiment was performed at Aarhus University (AU)-Flakkebjerg, Denmark, located at 55°19′00′′ N and 11°24′00′′ E, on a sandy loam soil, which contains ≈ 17.5% clay (<2 μm), 25.2% silt (2–63 μm), 55% sand (>63 μm), and 2.3% organic matter. Red clover cultivars were undersown in a lodging-resistant spring barley in the spring of 2012, 2013, and 2014, in a completely randomised experimental design. For each cultivar, there were four plots as replicates (each plot size: 8 × 2.5 m), that is, 12 plots in total. The clover and the cover crop were drilled in alternating rows using a Nordsteen sowing machine (Kongskilde, Denmark) with two separate seeding boxes. The distance between rows was 12 cm for the cover crop and 12 cm for the clover seeds. Seeds of red clover cultivars were sown at 1.5 kg ha−1 regardless of the cultivar. Weeds and insects were controlled chemically, when necessary, in accordance with suitable experimental practice. No irrigation treatment was applied in the experiment. Mean daily temperature (°C) and monthly precipitation (mm) during the seed production years 2013–2015 were collected at the weather station located at AU-Flakkebjerg, compared with the mean values of 30 years of meteorological data (Figure 1).
The cover crop was harvested with a trial combine, and the straw was removed immediately after harvest. The stubble was cut to 8–10 cm. The plant density of the under-sown red clover was recorded in the autumn of the establishment year and the following spring of the seed production year using a visual score-based judgment where 0 equals ‘no plants in the row’ and 100 equals ‘full ground cover in the row’. Flowering intensity was recorded during the flowering period using a visual score-based judgment where 0 equals ‘no florets open’ and 100 equals ‘one or more florets open on any flower head’. One honey bee (Apis mellifera L.) hive was placed in the vicinity of the experimental plot, and wild bumble bees (Bombus spp.), such as Bombus pascuorum Scopoli, Bombus muscorum L., and Bombus hortorum L., were observed during the flowering period. The crop from each plot was swathed and left for drying before combine-harvested according to the maturity of each cultivar (Table 1).
2.3. Determination of Seed Yield
Seeds were air-dried and cleaned before determining the yield (kg ha−1). Seed yield components of 2014 and 2015 were determined. The number of seeds per flower head were registered in 15 flower heads per plot and the number of florets per flower head were registered in four flower heads per plot. The seed set was calculated using the following equation:
The seed set in the equation was presented as the percentage of ovules developed to seeds, and we multiplied the number of florets per flower head by two because each red clover ovary produces two ovules [21,22]. Seed purity analysis was performed according to International Rules for Seed Testing [23] and seed yield was adjusted to 100% pure seed. Thousand seed weight (TSW) was measured as an average of 8 × 100 seeds, and seed germination was determined on 4 × 100 seeds [23].
In order to explore the influences of precipitation during peak flowering and seed development stages on the seed yield, we used a grid to determine the days for peak flowering stage (i.e., from flower intensity exceeding 50 until final decline below 50) of each cultivar (Figure S1). In order to show the water status prior to peak flowering, we determined the precipitation of 14 days prior to peak flowering. For the precipitation after the flowering, we determined the total precipitation of 25 days, counting from the end of flowering (i.e., the date of flowering intensity ≤10 (Figure S1)). Red clover requires approximately 2.5 weeks for seed maturity and one week for the optimal seed moisture for harvesting [18]. Total precipitation during different stages of flowering was determined for each cultivar (Table 2).
2.4. Statistical Analysis
We performed the statistical analysis using R version 4.0.3 [24]. Because we used subjective assessment of the plant density, the comparison was conducted within each year. We fitted generalised linear models (GLMs) to plant density by using fixed effects of cultivar (‘Rajah’, ‘Suez’, and ‘Amos’), time (‘Autumn’ and ‘Spring’), and their interactions. Seed yield over three years was analysed using a linear model including fixed effects of cultivar (‘Rajah’, ‘Suez’, and ‘Amos’), year (2013, 2014, and 2015), and their interactions. To further correlate the seed yield and thousand seed weight with precipitations during peak flowering, we fitted simple linear regression models to each cultivar separately, using R package ‘stats’ [24]. Assumptions of normality (Shapiro–Wilk test) and the homogeneity of variance (Bartlett’s test) were examined. Generalised linear mixed models (GLMMs) were used to compare seed yield components by using R package ‘lme4′ [25]. For comparing seed number per flower head among cultivars, we fitted GLMM (Poisson distribution with a log link) with fixed effects, which were cultivar (‘Rajah’, ‘Suez’, and ‘Amos’), year (2014 and 2015), and their interactions. The random effects of flower head (N = 360) nested in plot (N = 24). For floret number per flower head, we fitted GLMM (Poisson distribution with a log link) with fixed effects of cultivar (‘Rajah’, ‘Suez’, and ‘Amos’), year (2014 and 2015), and their interactions. The random effects were flower head (N = 96) nested in plot (N = 24). For the calculated seed set, we fitted GLMM (binomial distribution) with fixed effects of cultivar (‘Rajah’, ‘Suez’, and ‘Amos’), year (2014 and 2015), and their interactions. We analysed the variance by using ANOVA in ‘car’ package [26]. Post-hoc analyses were conducted by using packages of ‘multcompView’ [27] and ‘emmeans’ [28].
3. Results
3.1. Flowering Intensity
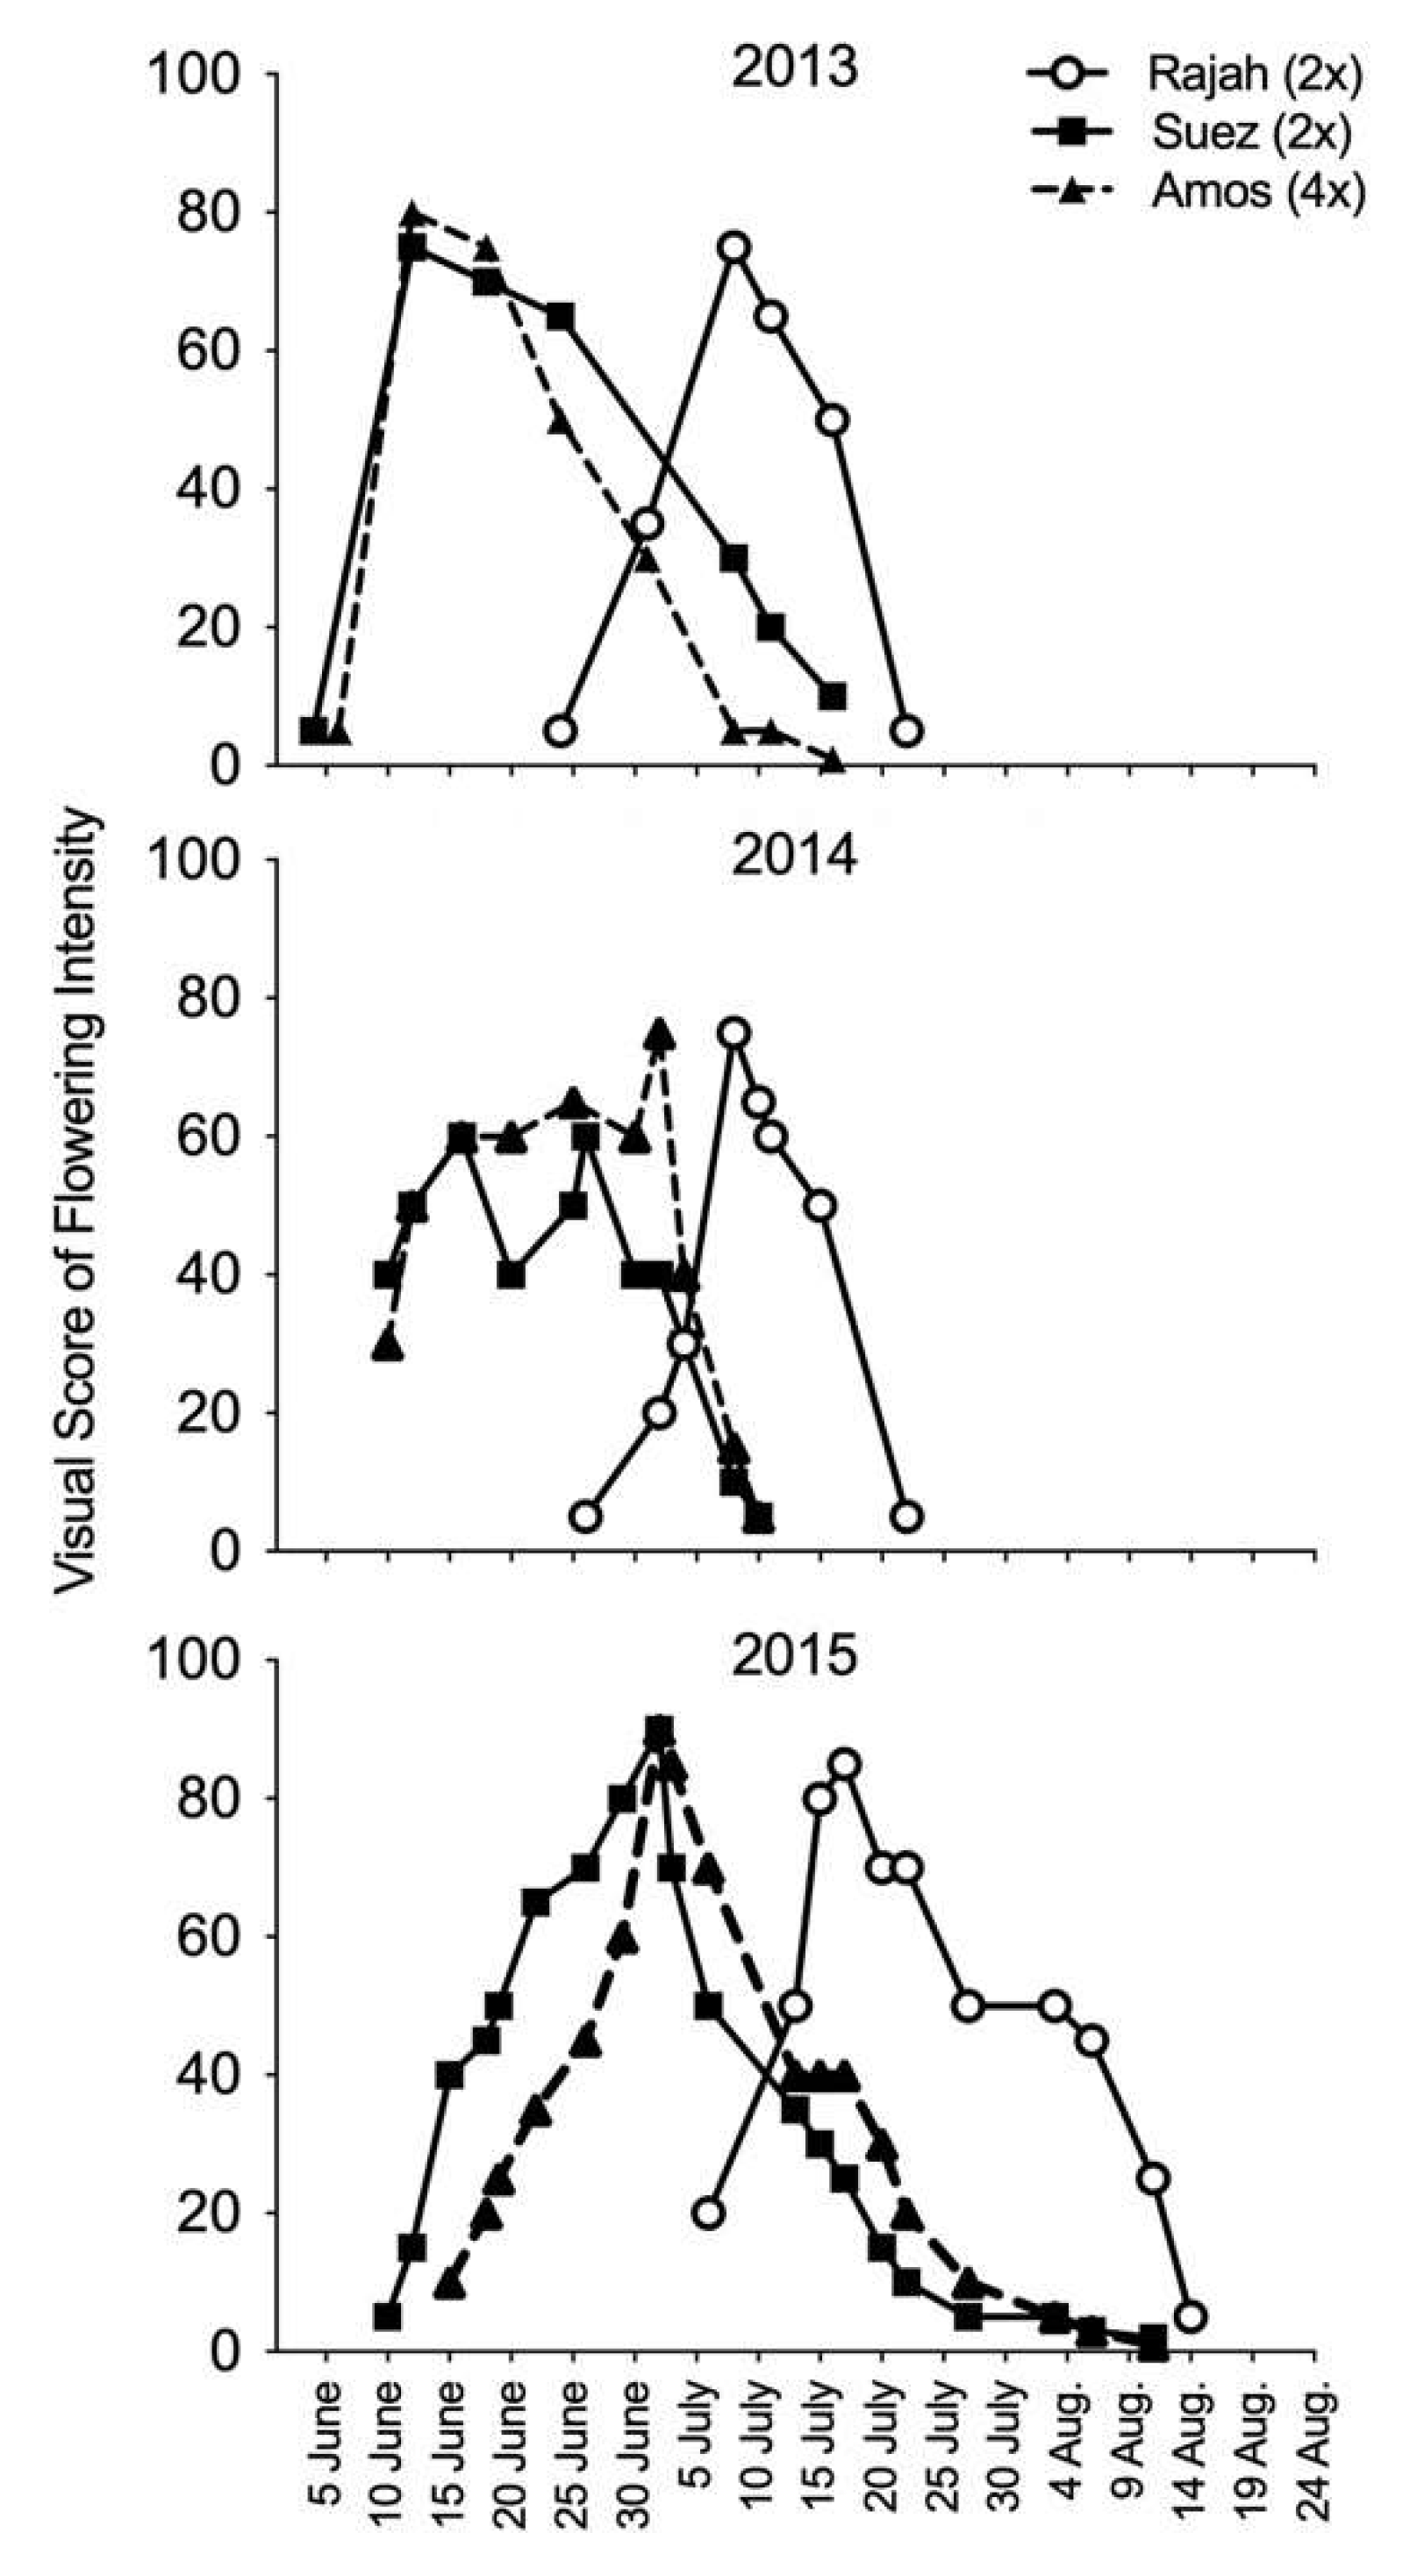
The flowering patterns between the two early-flowering cultivars ‘Suez’ and ‘Amos’ were similar in each year over the three-year experimental period (Figure 2). The peak flowering with the highest flowering intensity of ‘Suez’ and ‘Amos’ was reached early-June 2013 but was delayed to early-July in 2014 and 2015. During the three years, the peak flowering of ‘Rajah’ was in mid-July, which was approximately two weeks later than ‘Suez’ and ‘Amos’. The flowering intensity hardly reached 80% in 2014, and in ‘Suez’ the flowering intensity had a slight drop during the main flowering season. The flowering durations of all three cultivars were longer in 2015 compared with 2013 and 2014.
3.2. Plant Density
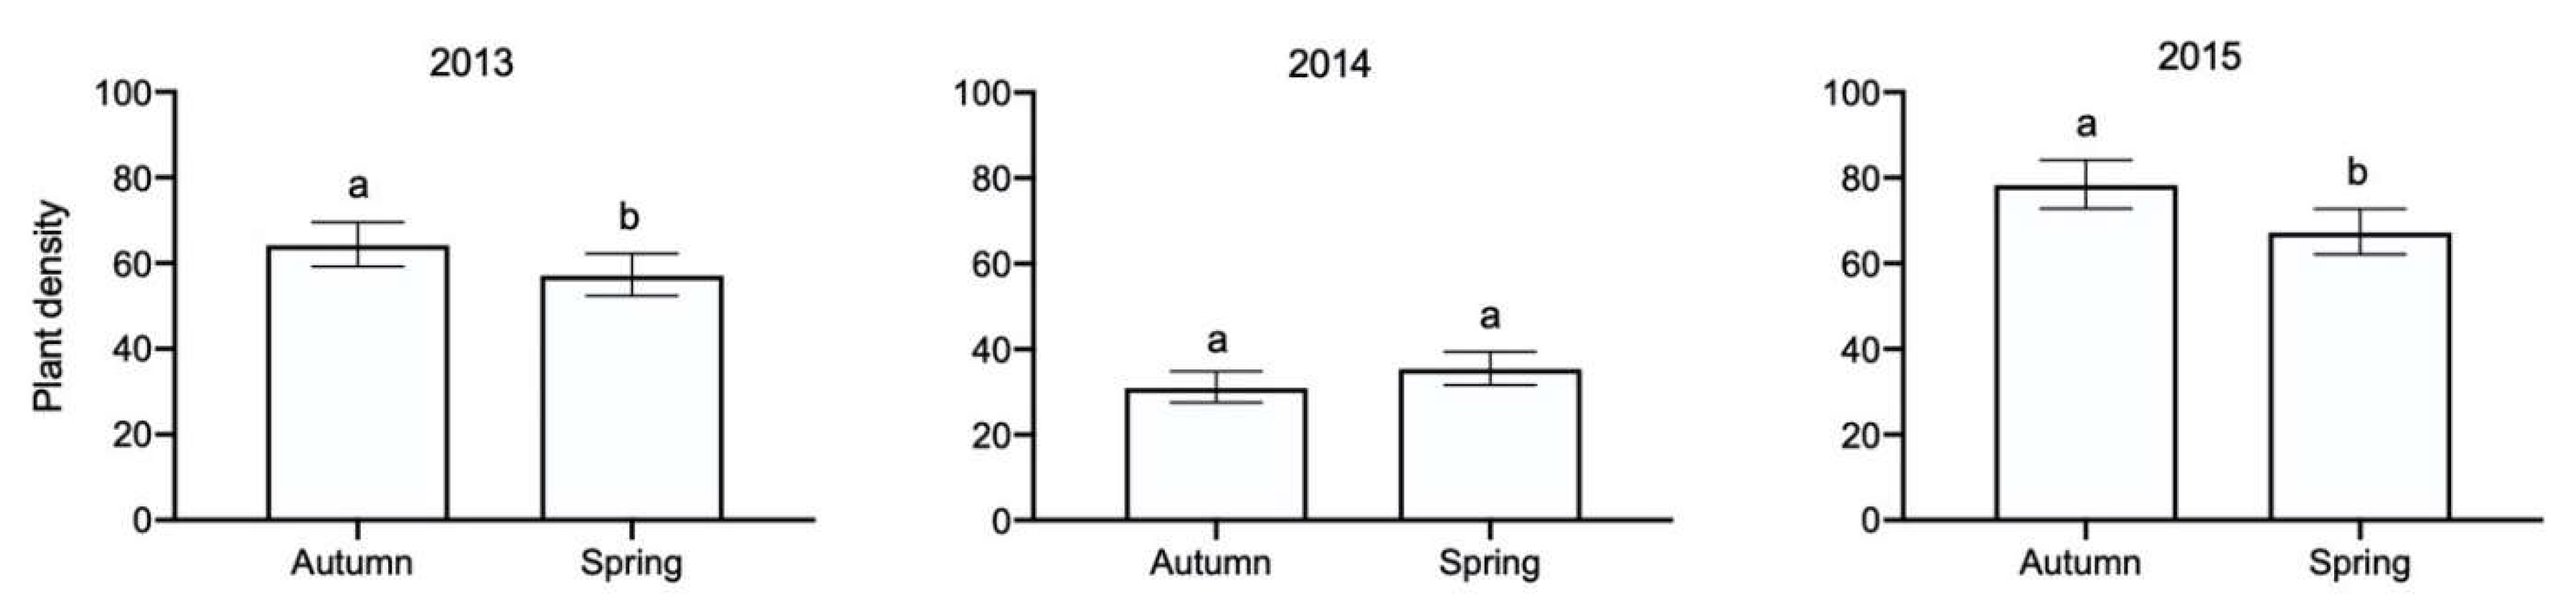
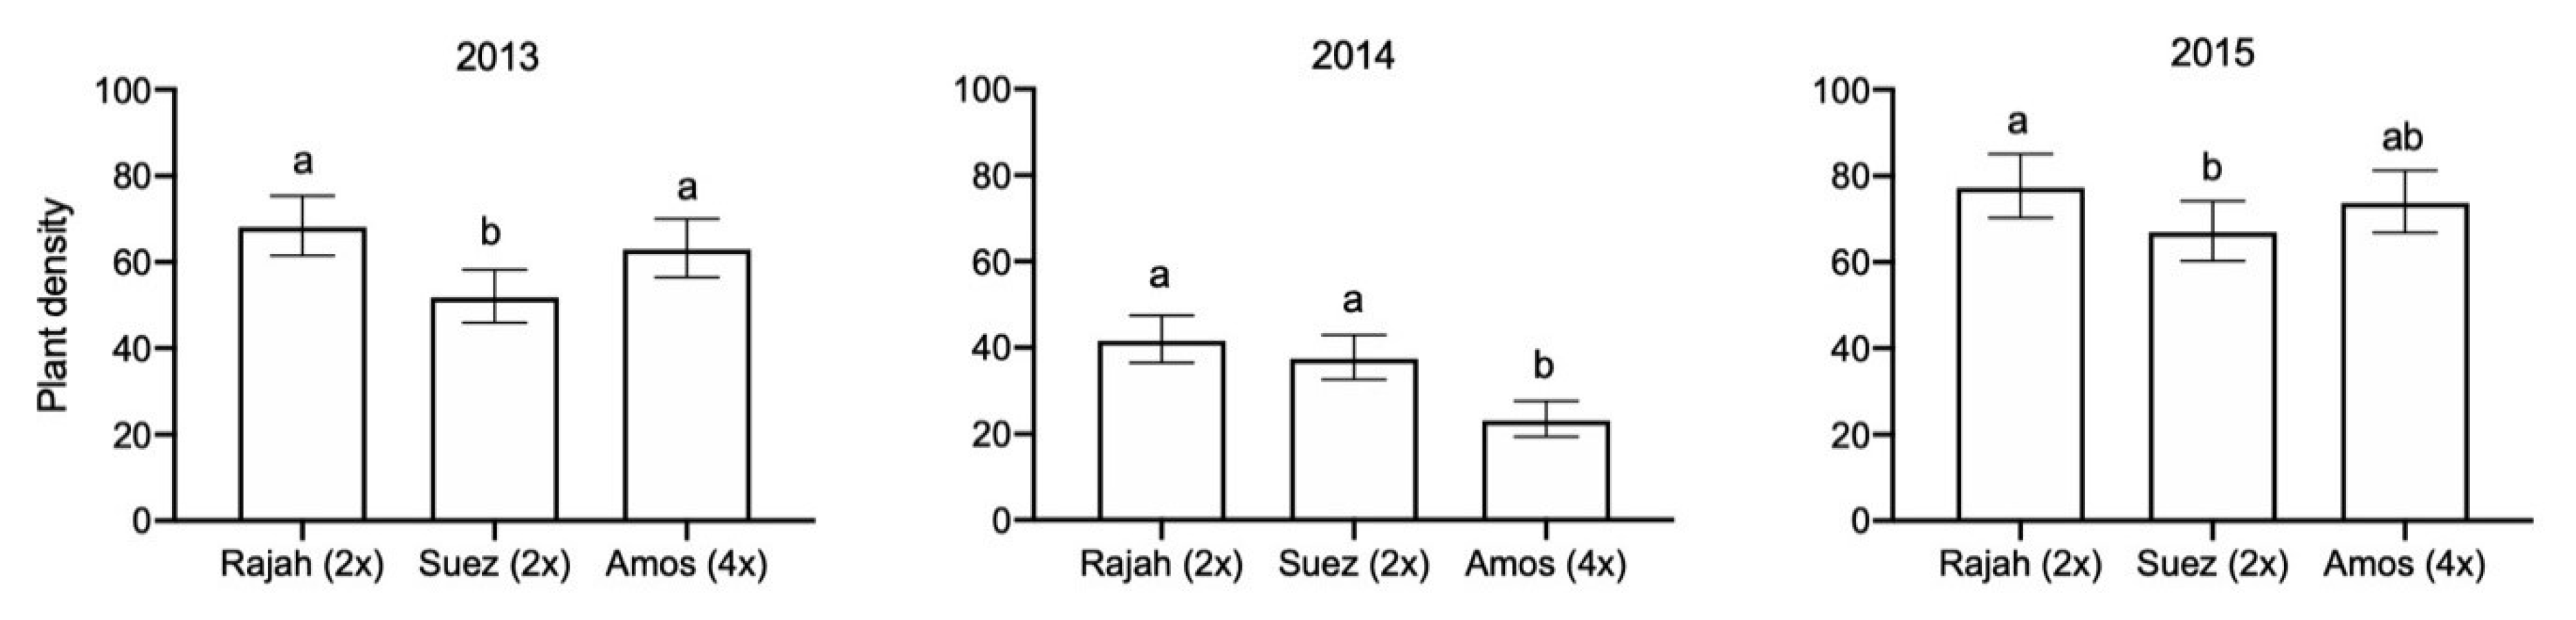
No interaction effects of cultivar and time were detected in any year of 2013–2015. Plant density differed among cultivars in 2013 and 2014, but not in 2015. Time had significant influence on the plant density (Table 3). In 2013 and 2015, plant density in the autumn in the establishment year was higher than in the spring of the seed production year (Figure 3). However, plant density showed no difference between autumn and spring in 2014. Comparing three cultivars within each year, ‘Suez’ had relatively lower plant density compared to other two cultivars in 2013 and 2015, whereas ‘Amos’ had relatively lower plant density compared to the other cultivars in 2014 (Figure 4).
3.3. Seed Yield
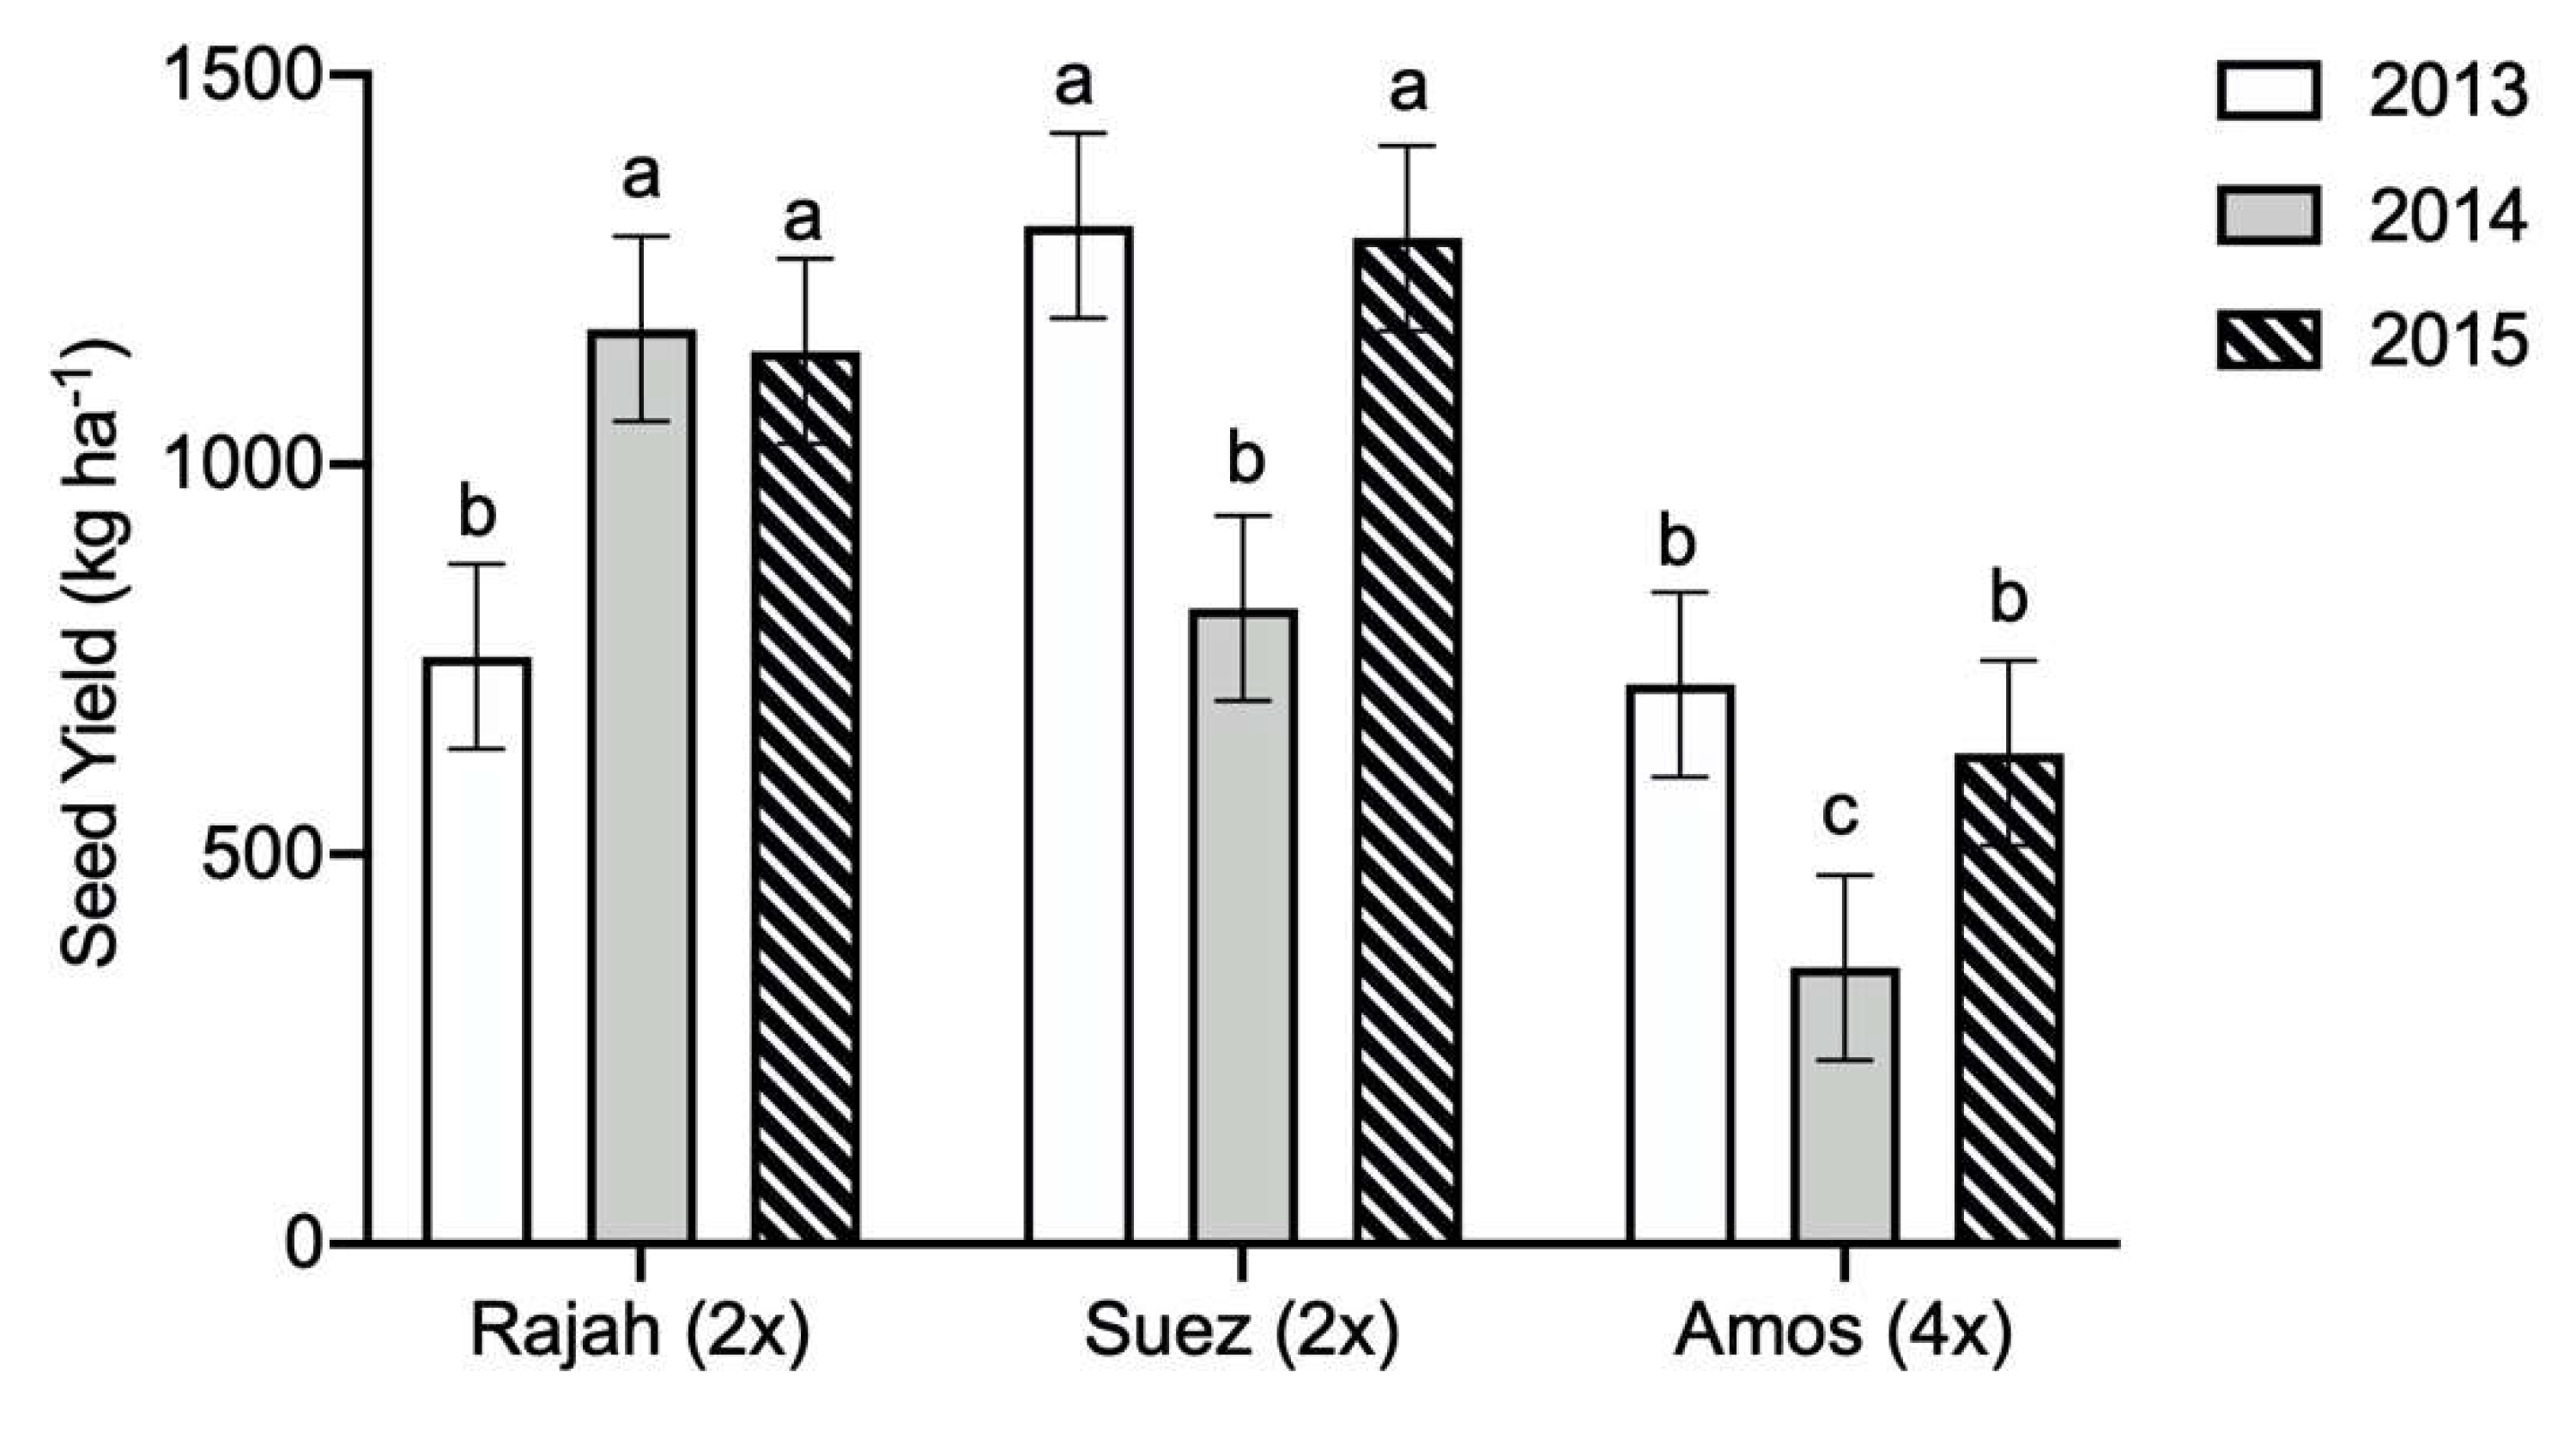
Seed yield varied among the three cultivars over the seed production years 2013–2015 (Figure 5), and a significant interaction effect of ‘Cultivar × Year’ was found (LM, Cultivar × Year χ2 = 997862, p < 0.0001, Table 4). Seed yield in ‘Rajah’ was lowest in 2013, while ‘Suez’ and ‘Amos’ had the lowest seed yield in 2014. Comparing the mean seed yields over three years, ‘Suez’ (EMMs 1137 with 95% CI (1079, 1195)) and ‘Rajah’ (EMMs 1024 with 95% CI (966, 1082)) had the highest seed yield. ‘Amos’ had the lowest seed yield (EMMs 567 with 95% CI (509, 625)), which was only half of the seed yield in the two diploid cultivars. In two out of three years, the diploid cultivars had seed yields > 1000 kg ha−1. Seed germination was 97–98% with no significant difference between cultivars (data not shown).
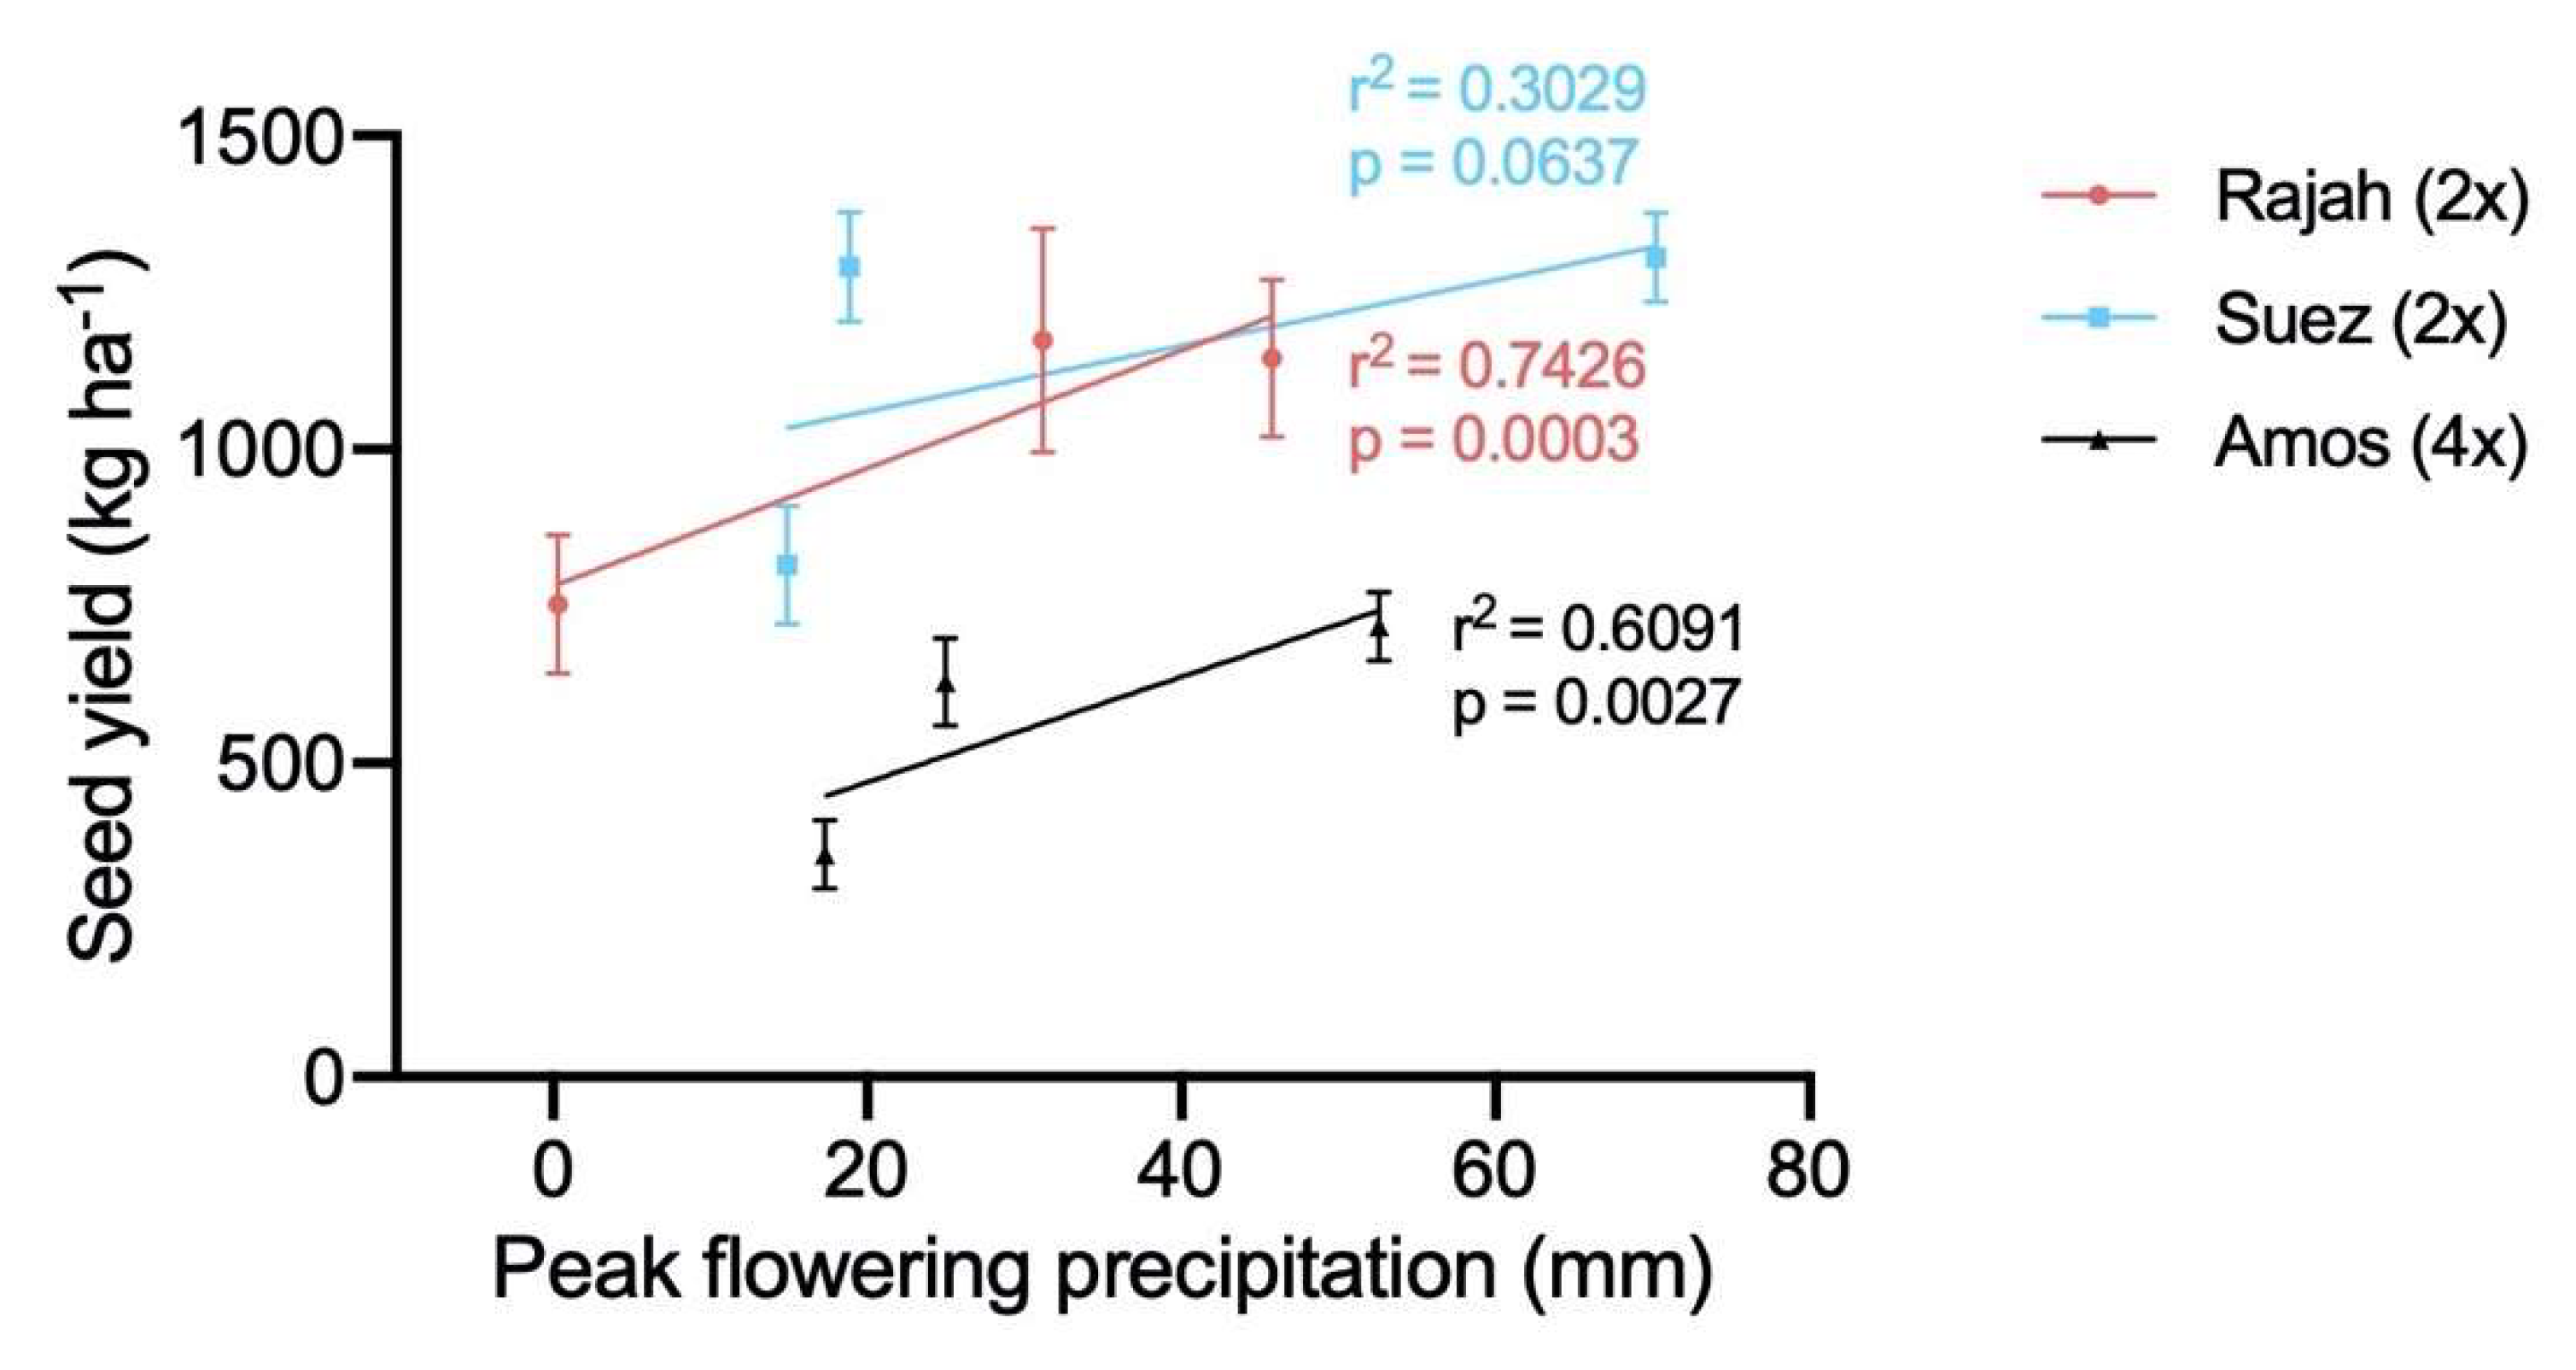
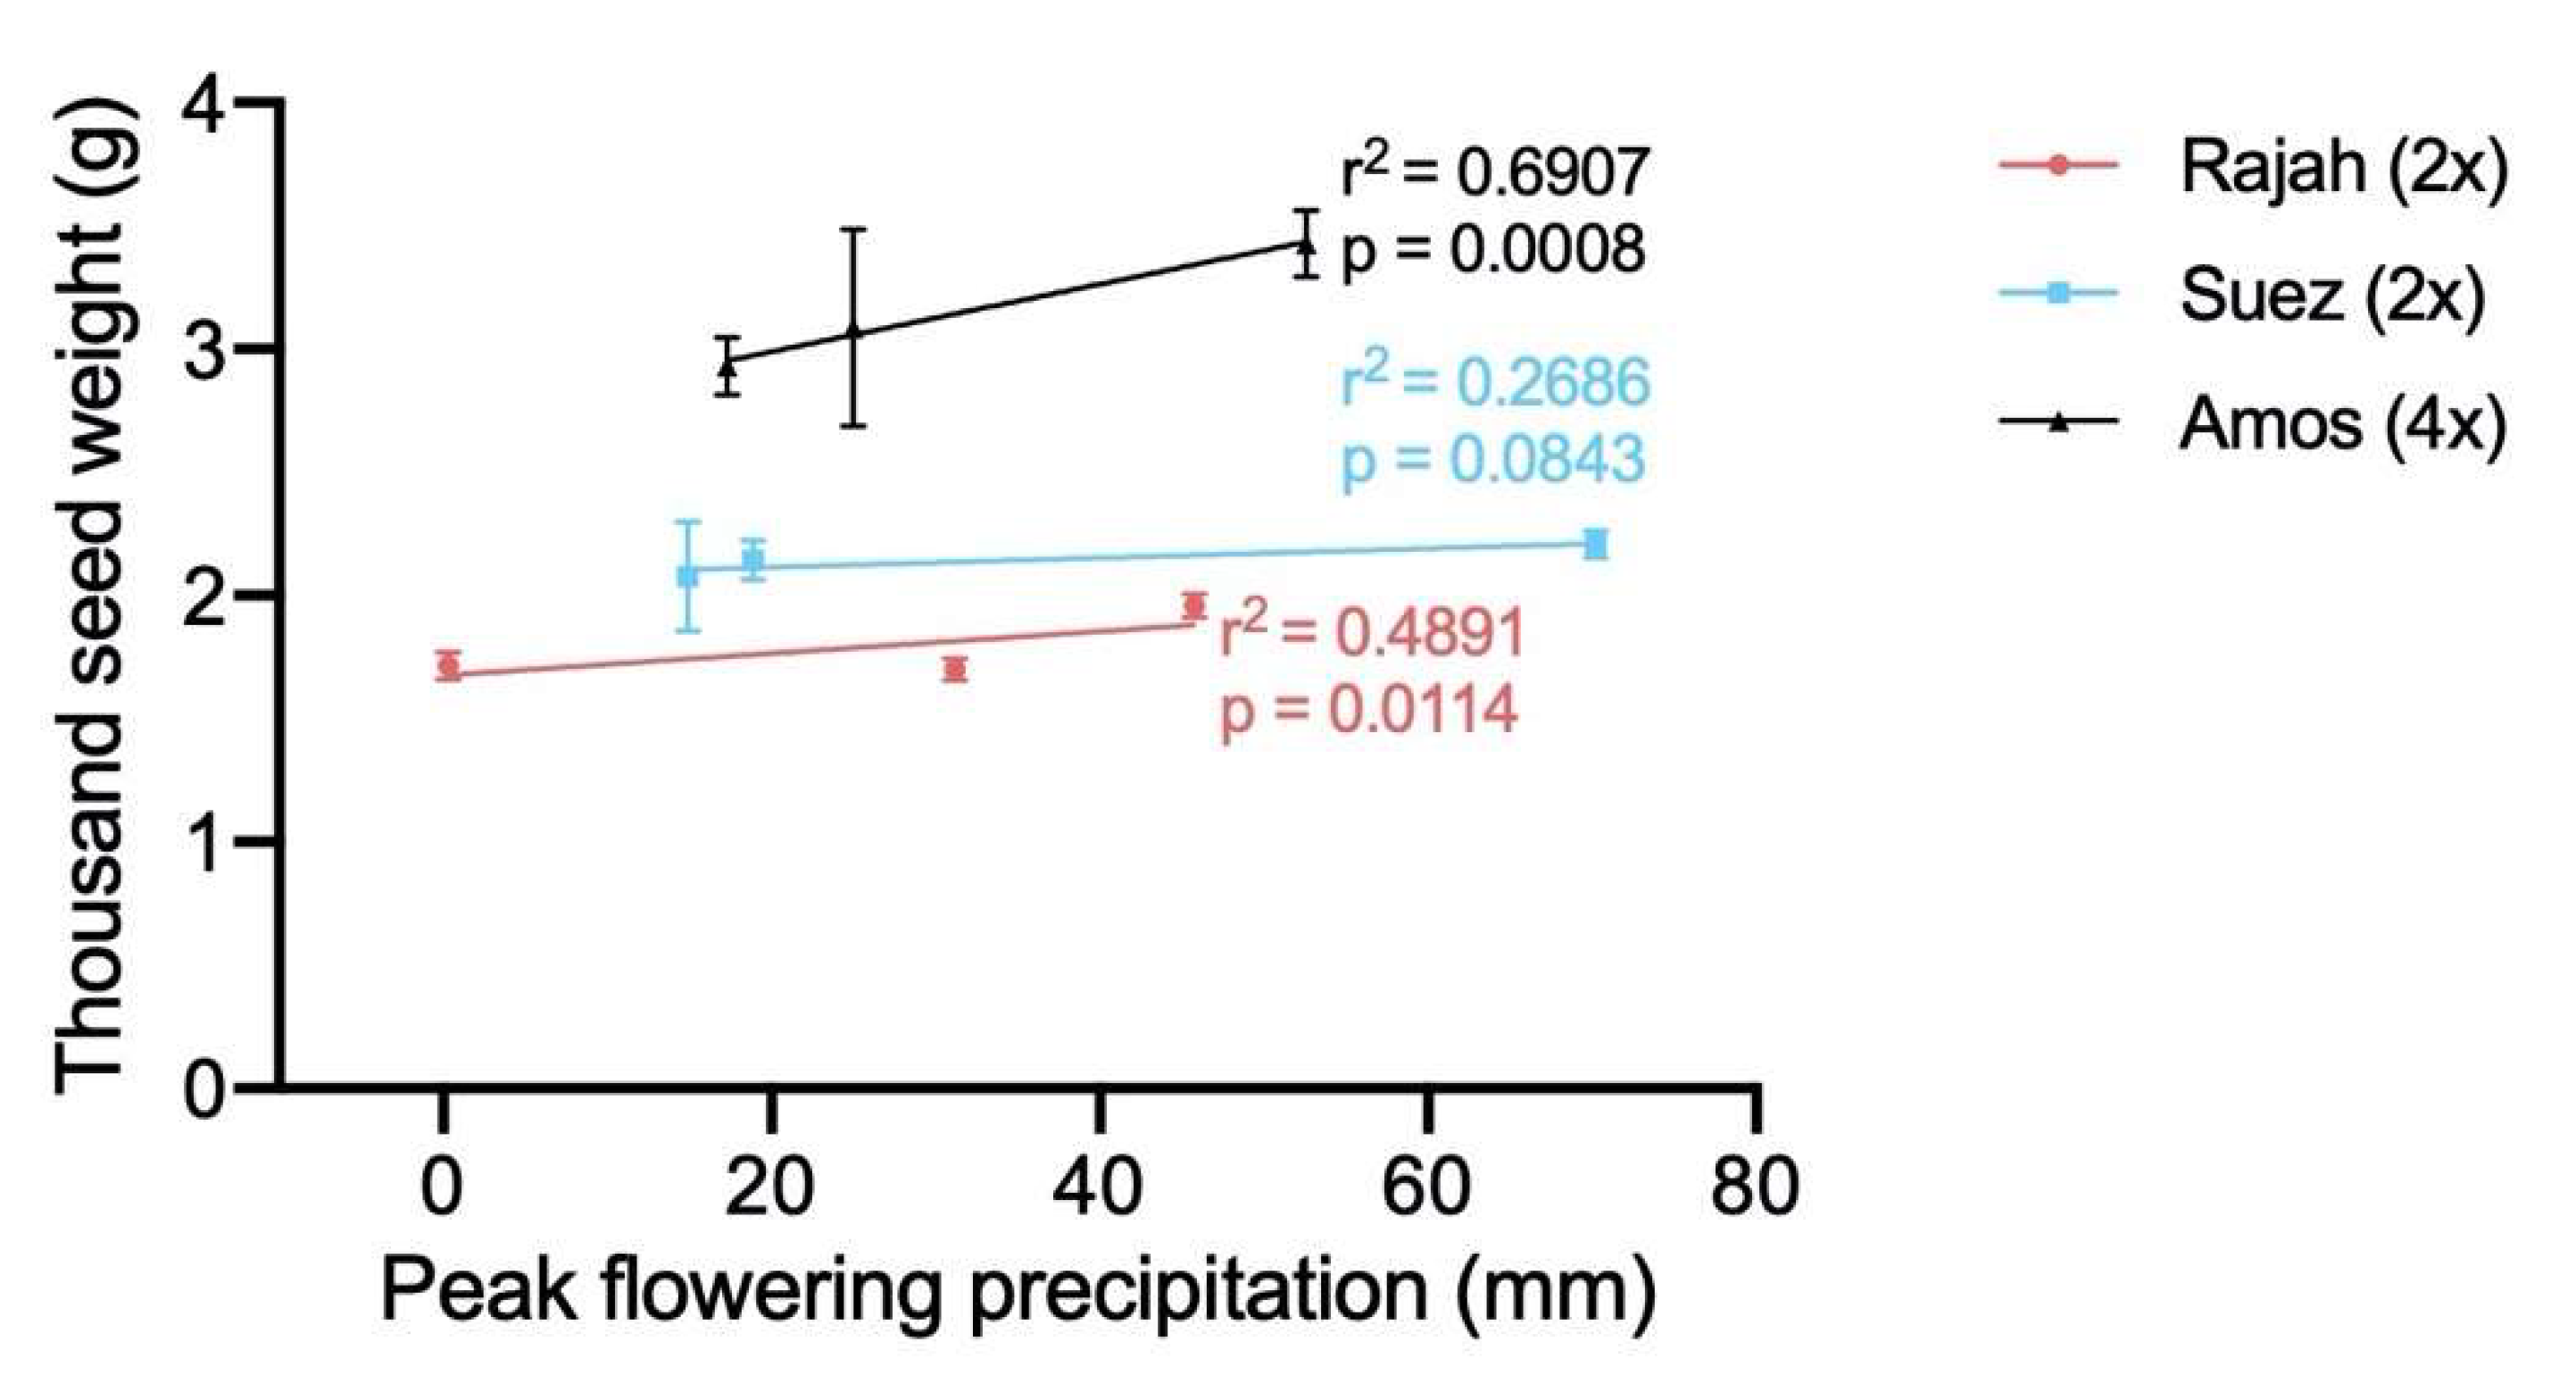
Seed yield was positively correlated to the total precipitation during the peak flowering time, especially in cultivar ‘Rajah’ and ‘Amos’ (Figure 6). The thousand seed weight in ‘Amos’ was increased significantly with precipitation (Figure 7). For the other two cultivars that in a similar trend was found but was not statistically significant.
3.4. Seed Yield Components
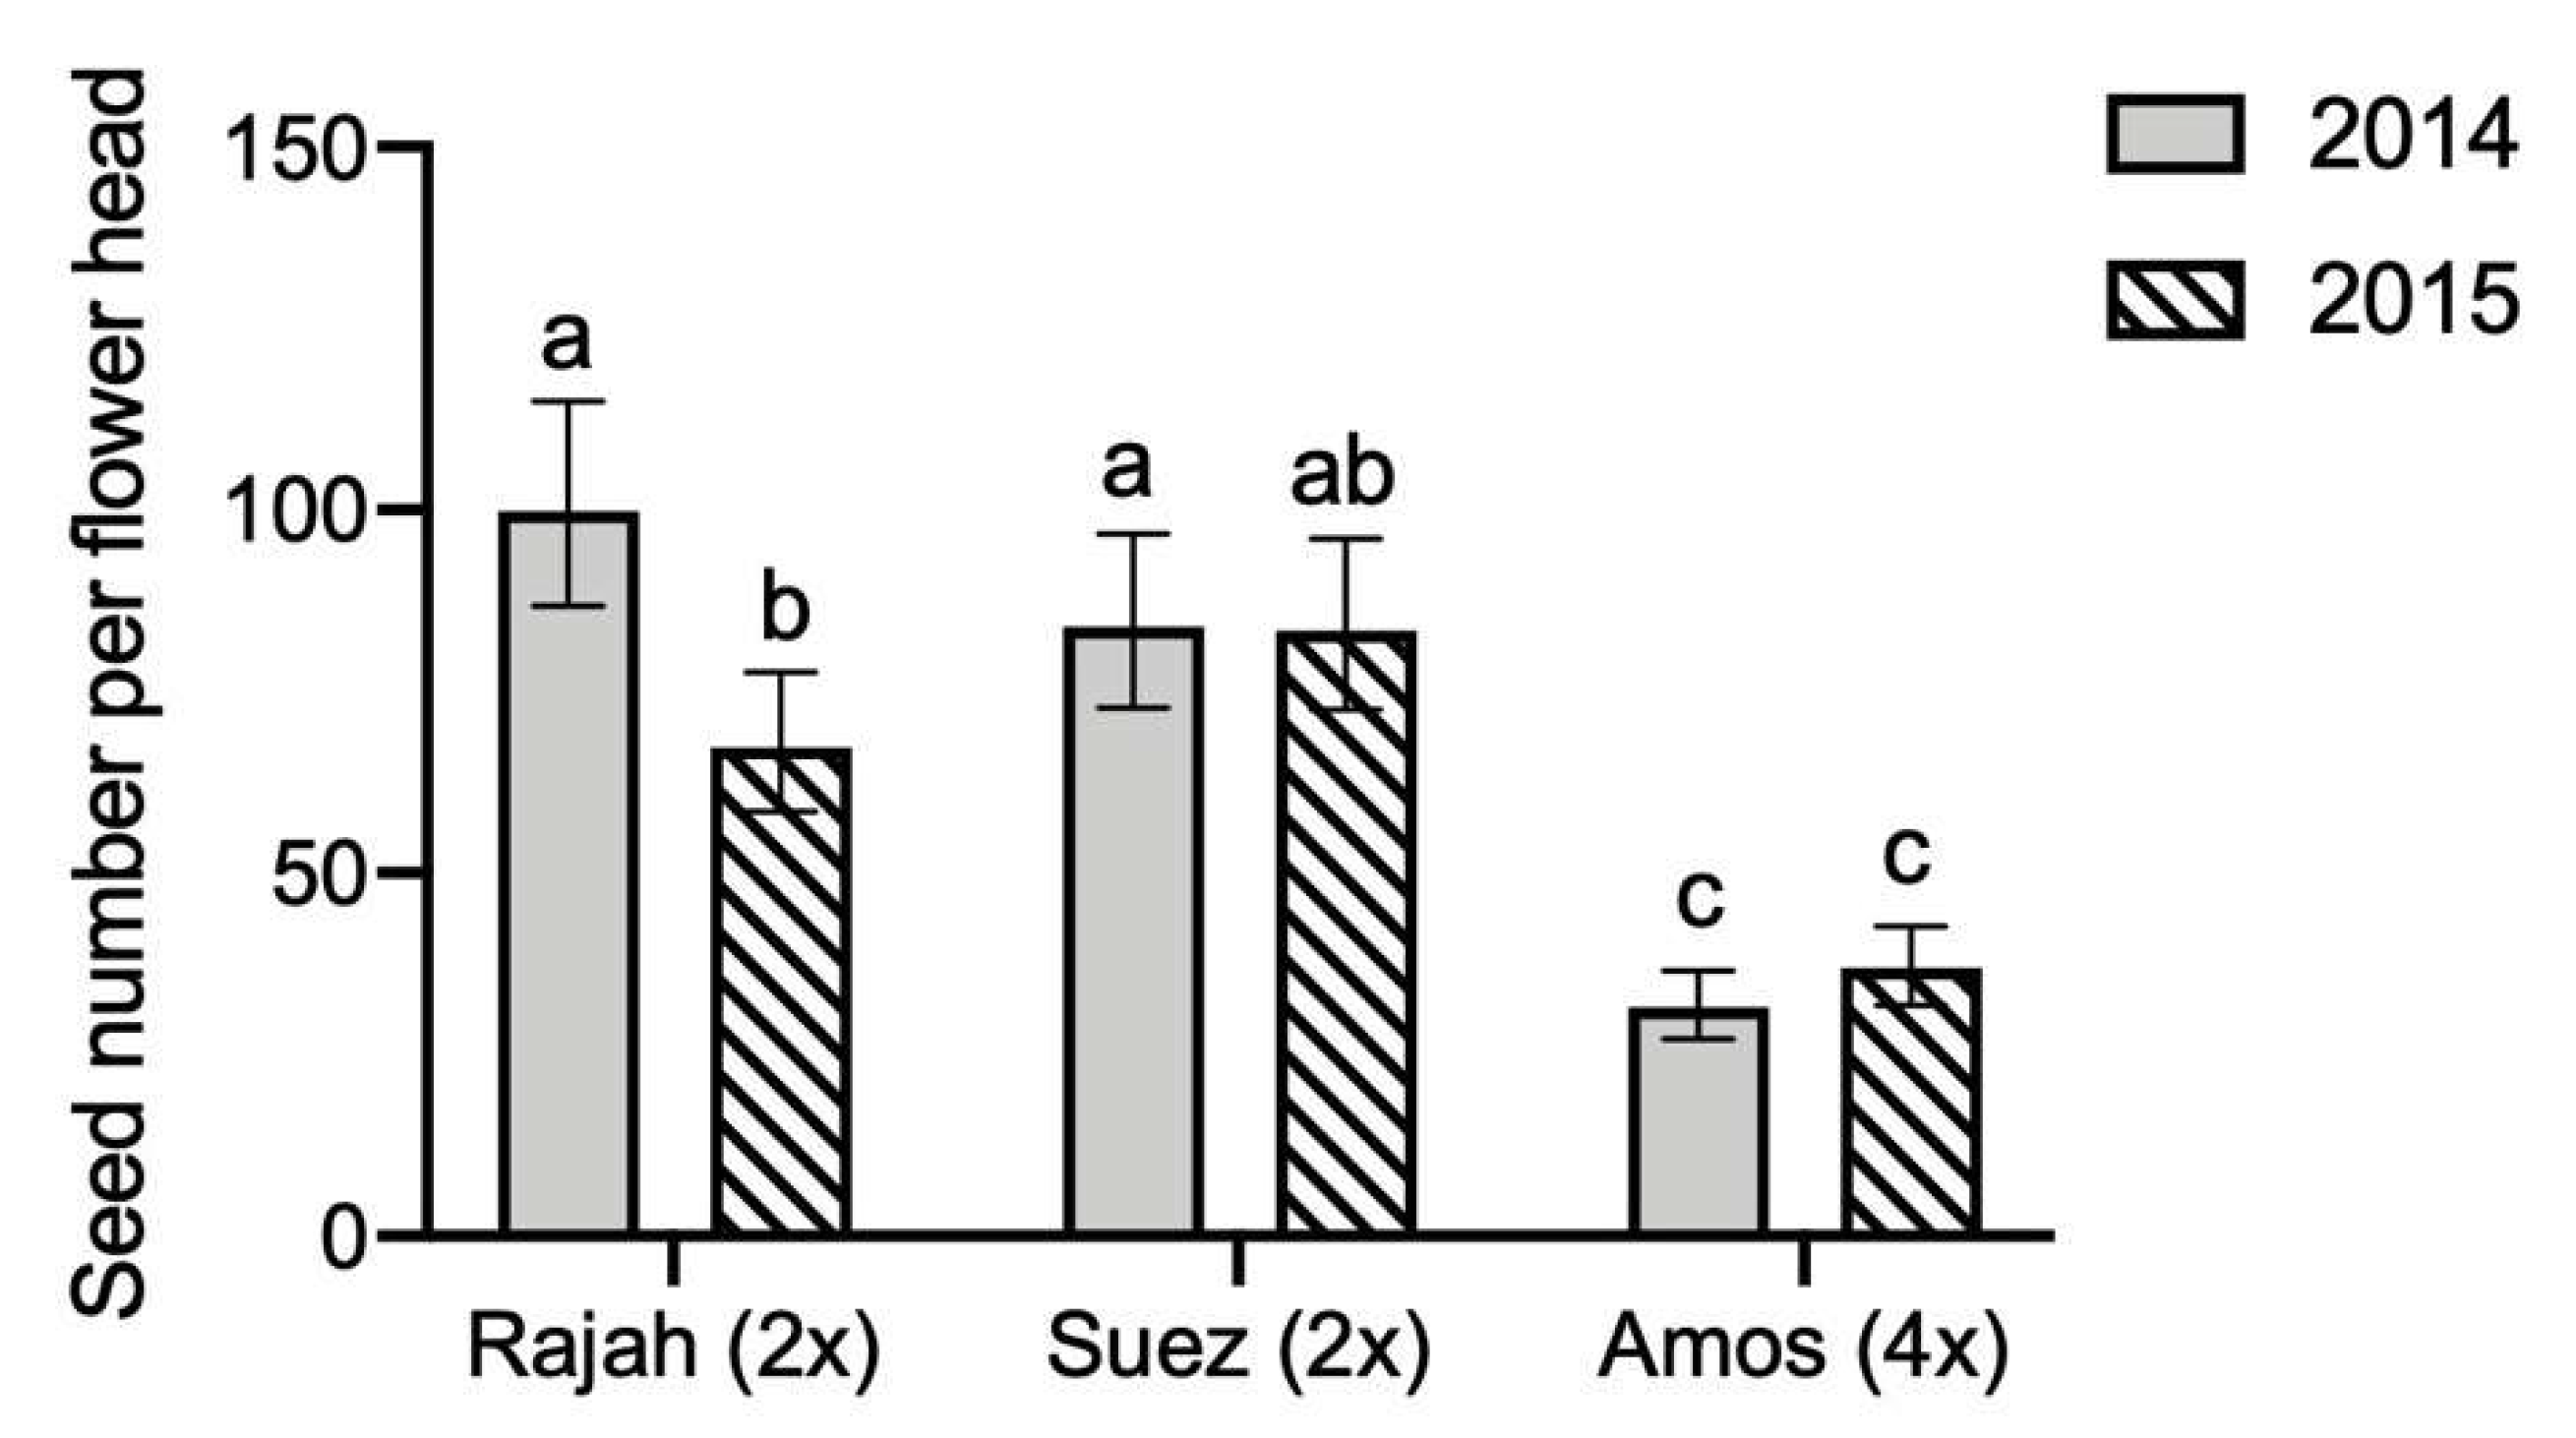
There was a significant interaction effect of ‘Cultivar × Year’ in seed number per flower head (GLMM, Cultivar × Year χ2 = 26.7654, p < 0.0001, Table 5). In both 2014 and 2015, diploid cultivars had higher seed number per flower head compared to tetraploid red clover (Figure 8). The seed number per flower head in ‘Rajah’ was significantly higher (adjusted p-value < 0.0001) in 2014 than in 2015, whereas ‘Suez’ and ‘Amos’ showed no difference in the seed number per flower head between the two years.
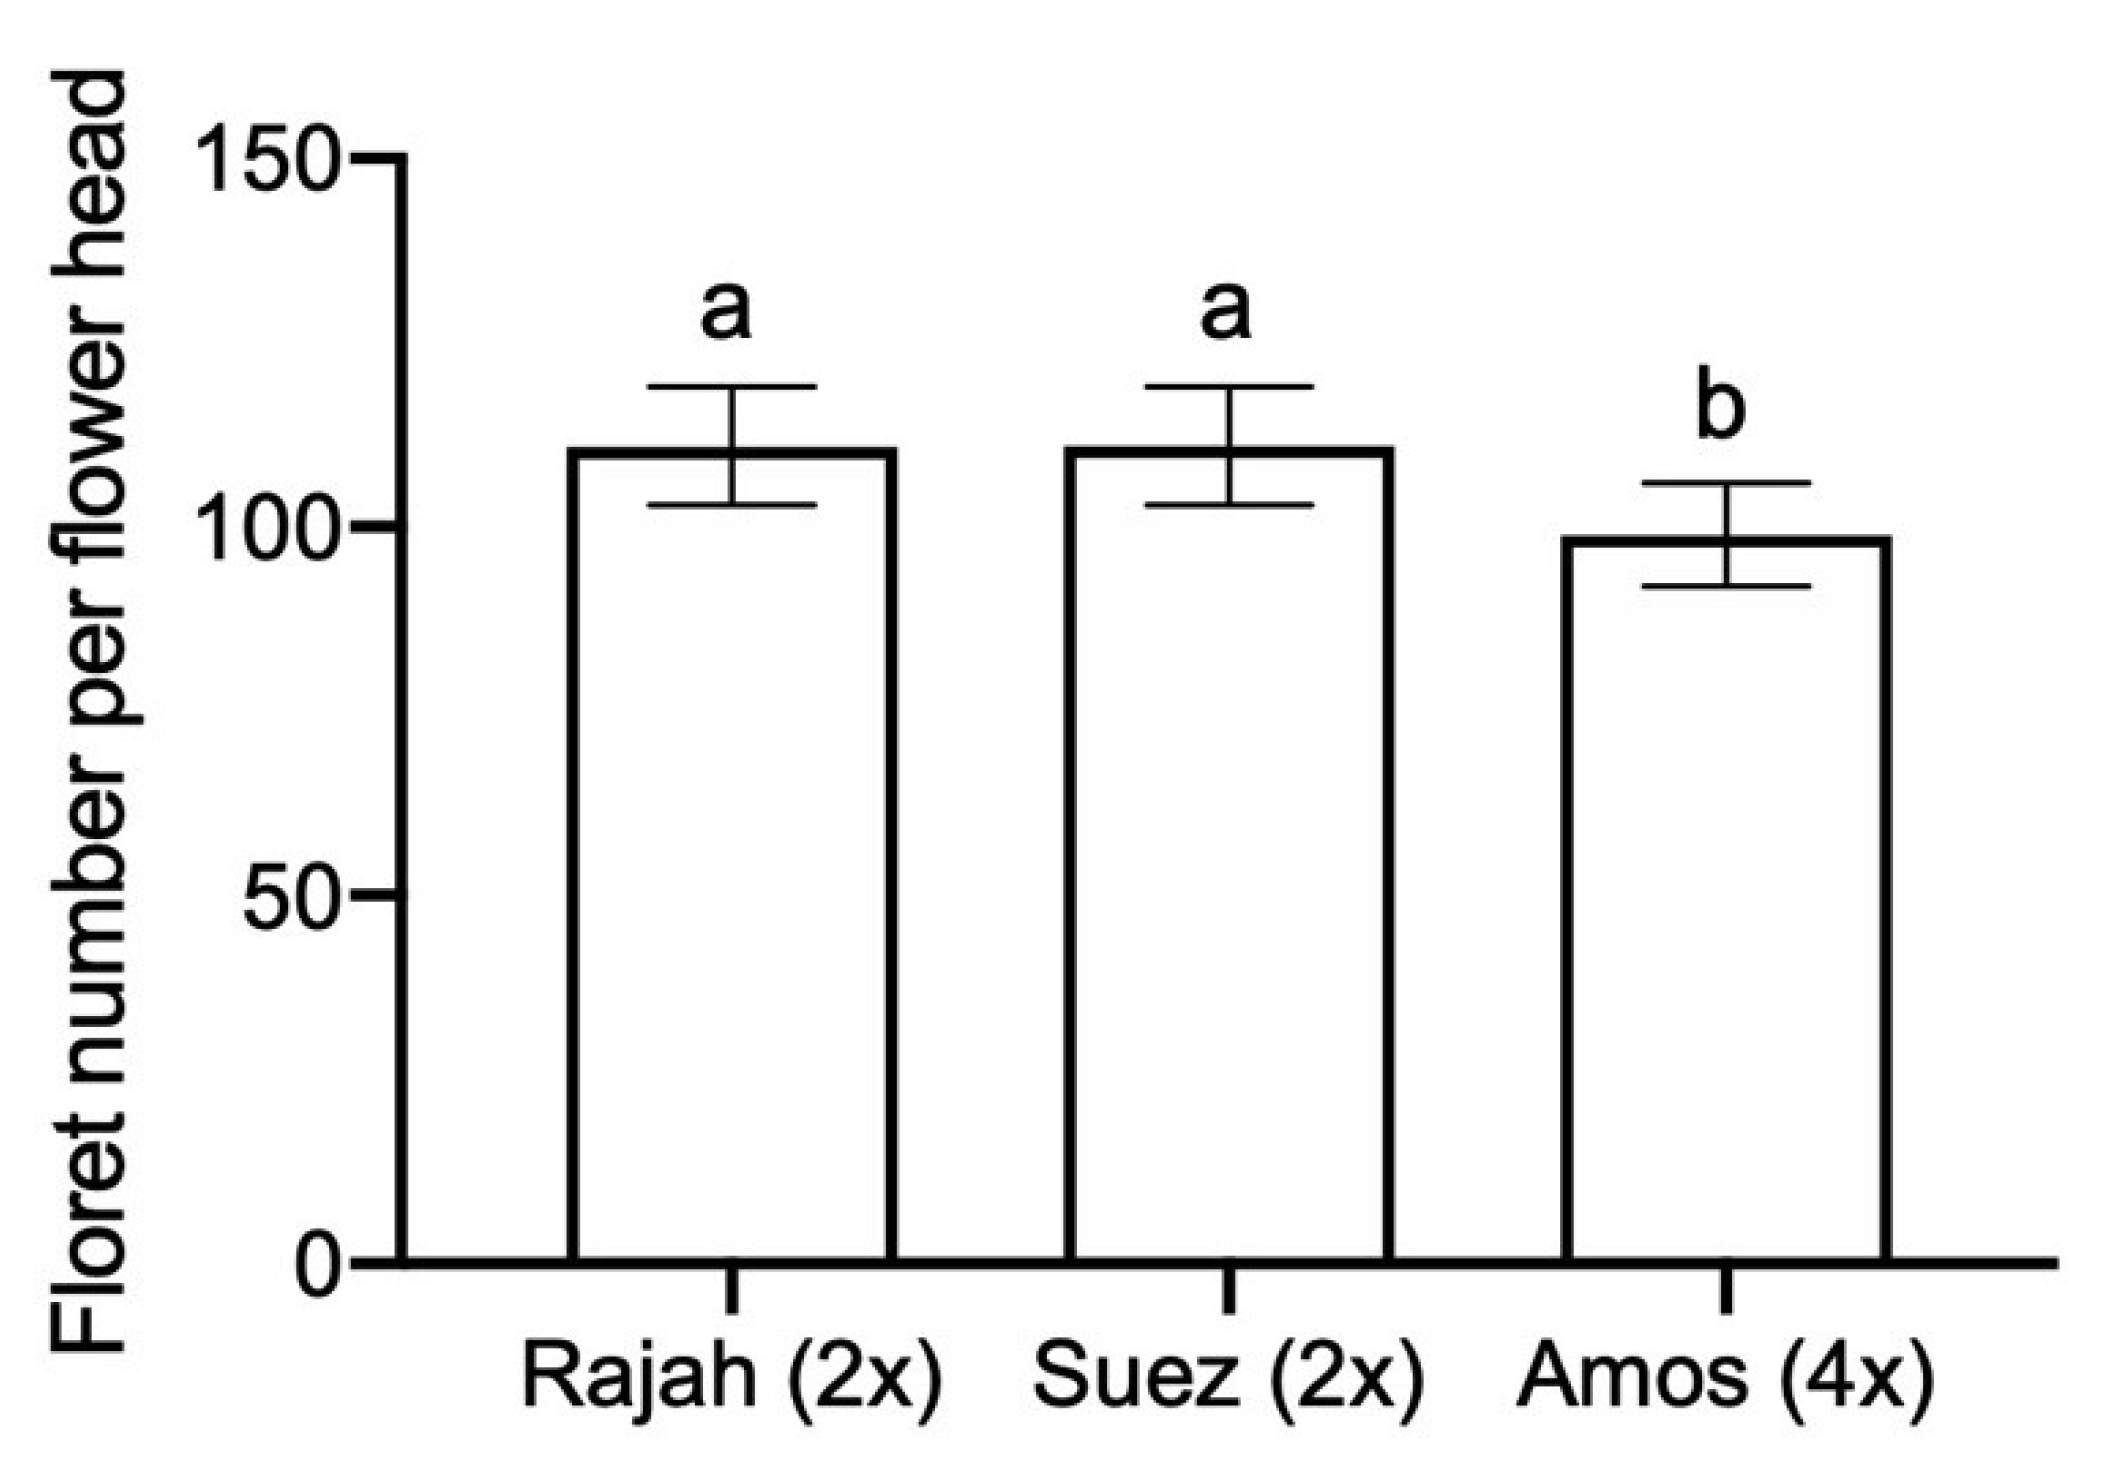
There were significant effects of cultivar and year on the floret number per flower head (Table 6). Comparing three cultivars with two years’ mean values, floret number per flower head in ‘Rajah’ (EMMs 110.9) and ‘Suez’ (EMMs 111) was higher than that of ‘Amos’ (EMMs 98.9) (Figure 9). Comparing 2014 and 2015, the mean values of the three cultivars in 2014 (EMMs 94.6 with 95% CI [89.4, 100]) were significantly lower (adjusted p-value <0.0001) than the values in 2015 (EMMs 120.6 with 95% CI [114.2, 127]).
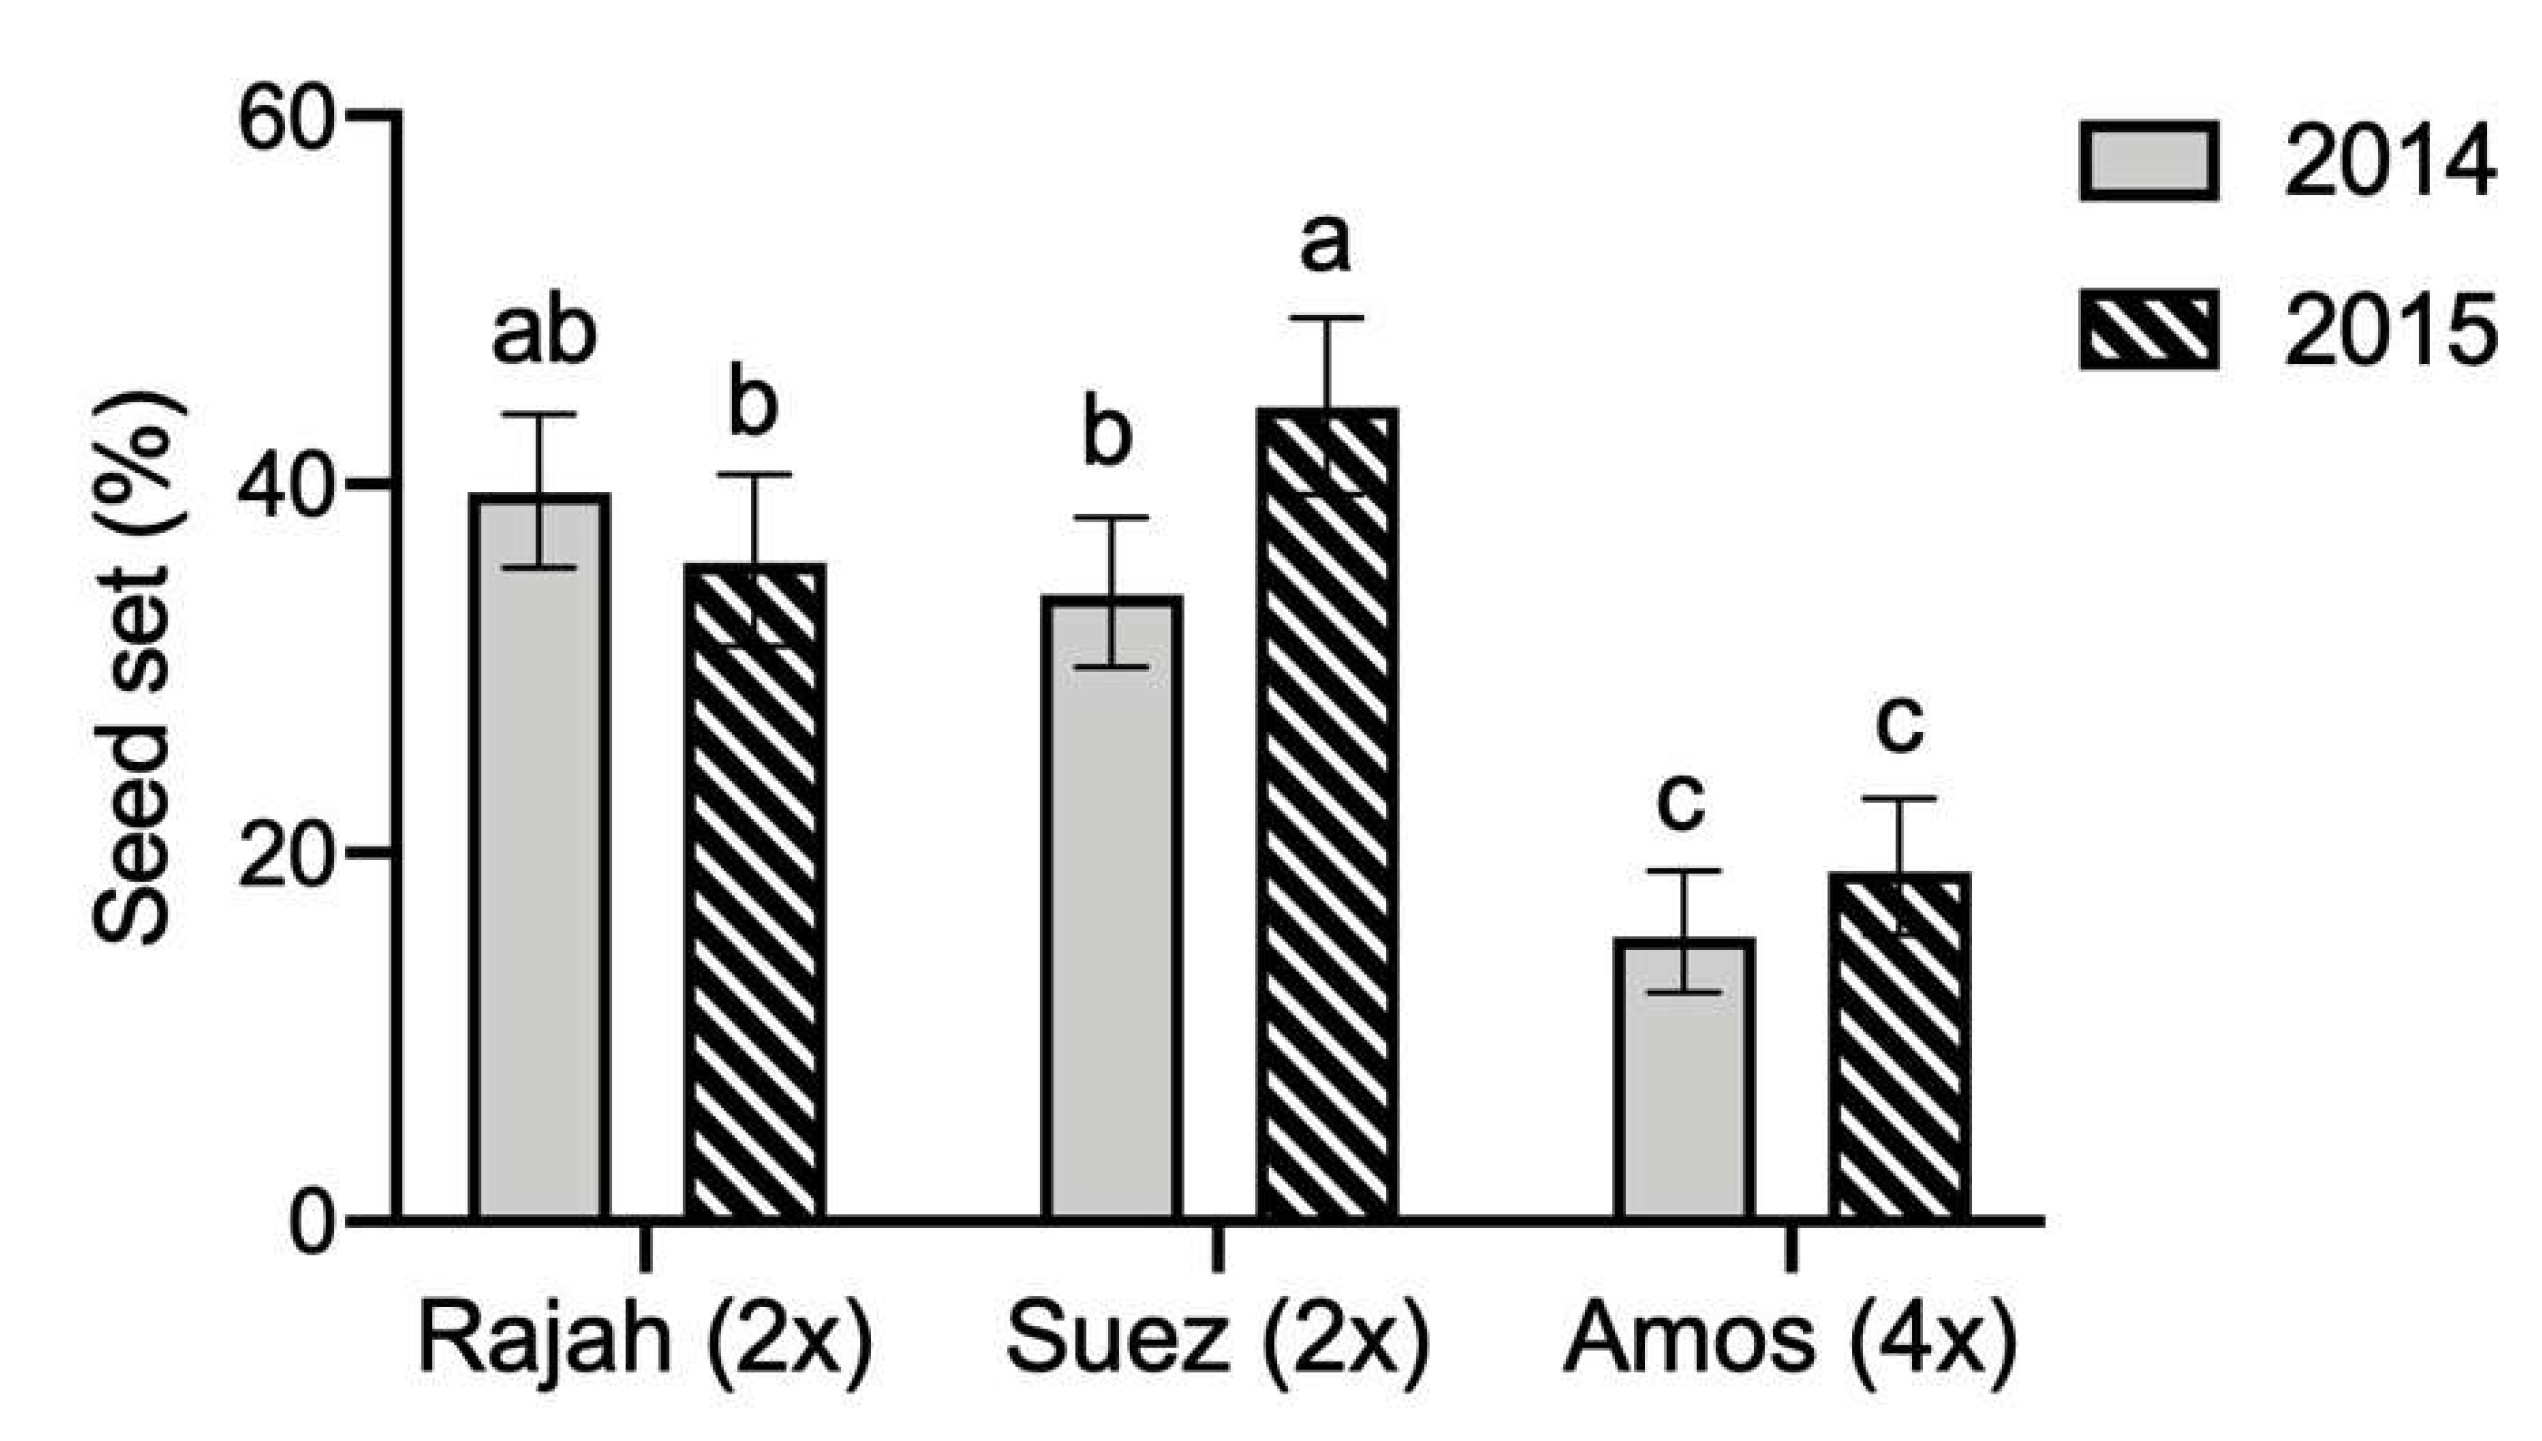
We found a significant interaction effect of cultivar and year on seed set (GLMM, Cultivar × Year χ2 = 18.923, p < 0.0001, Table 7). Seed set in ‘Amos’ was around half of ‘Rajah’ and ‘Suez’ in both years (Figure 10). ‘Rajah’ and ‘Amos’ had no differences between 2014 and 2015, while ‘Suez’ in 2015 had higher seed set compared to 2014.
4. Discussion
In the current study, the three cultivars obtained high seed yields compared with the general seed yield of 400–500 kg ha−1 for diploid red clover [1,29,30]. The seed yield of red clover in Denmark from 2013 to 2015 were 347, 308, and 165 kg ha−1 in average of conventional and organic production, diploid and tetraploid varieties [9]. In two of the three years, seed yields in ‘Rajah’ and ‘Suez’ were higher than 1000 kg ha−1 and seed yield in ‘Amos’ was around 500 kg ha−1 in 2014. These findings are in line with seed production from western Oregon in the United States, where the typical red clover seed yields can reach 600 kg ha−1 and where over 1000 kg ha−1 were reported for some seed growers [31,32]. Remarkable is that the tetraploid cultivar ‘Amos’ obtained only around half of the seed yield of the two diploid cultivars in 2014 and 2015 (Figure 5), which is in agreement with previous studies [1,33,34,35,36]. In agreement with our third hypothesis, the seed yield difference corresponds to a lower seed number per flower head and calculated seed set in ‘Amos’ (Figure 8, Figure 9 and Figure 10).
Water during the peak flowering time is critical for red clover seed yield [7,17,37]. The current results verify the importance of precipitation during peak flowering, which support our hypothesis that precipitation during peak flowering time may increase the seed yield. We found that abundant precipitation (50 to 70 mm) during the peak flowering increased seed yield and thousand seed weight for both early and late flowering cultivars (Figure 6). In this study we identified the peak flowering period by using the visual scale of the flowering intensity (Figure S1), and we verified the hypothesis that the flowering phenology differ among three cultivars in different years (Figure 2). Results also revealed that the intermediate/late variety flowered approximately two weeks later than the two early-flowering cultivars (Figure 2; Figure S1). These detailed observations made it possible to evaluate the impact of precipitation on each cultivar during peak flowering. ‘Rajah’ had significantly lower seed yield in 2013 than in 2014 and 2015, whereas ‘Suez’ and ‘Amos’ had the lowest seed yield in 2014. In 2013, ‘Rajah’ received only 0.3 mm rain during peak flowering in July, and the monthly precipitation was lower than the 2014, 2015, and 30-years’ average (Figure 1). In June of 2013, ‘Suez’ and ‘Amos’ received 70.2 and 52.6 mm, respectively (Table 2). In 2014, ‘Suez’ and ‘Amos’ received only 14.9 and 17.3 mm, respectively. Comparing to the precipitation of 30-years’ average, both cultivars obtained higher monthly precipitation in June of 2013, while much lower monthly precipitation in 2014.
Precipitation prior to the peak flowering may indirectly influence the seed production by influencing vegetative stage and flower development. Relatively high humidity during the vegetative stage was favourable for the forage and seed production of red clover [38]. The influence of water on the flower development and seed yield has been investigated in many other crops. For example, water stress had great impact on the seed yield of canola (Brassica napus L.) by influencing the flowering development because canola developed 75% of the pods from the 14 days of flowering [39]. In 2014, the two early cultivars received low amounts of precipitation and further the two weeks prior to peak flowering had in total only 6.1 mm precipitation (Table 2), which may influence the flower development. All the cultivars had quite low plant densities in the spring of 2014 and in particular ‘Amos’ had a plant density of 27.6, which under the prevailing dry conditions may have resulted in a critical low number of flower heads. A number of studies have identified the number of flower heads per unit area as an important seed yield component [16,40,41,42,43]. Management practices such as high seeding rates, irrigation, and no or early forage removal provide seed producers with tools to obtain high flower head numbers [16,44]. We did not quantify the number of flower heads, which may limit the comparisons between different years. Amdahl [6] quantified the number of flower heads during the flowering season of red clover, which provided detailed comparison among the cultivars. Currently, the estimation of flowering based on image analysis is used widely in different plant species such as apple (Malus domestica Borkh.) and lesquerella (Lesquerella fendleri (Gray) Wats) [45,46], but these estimations are not yet used in red clover. The plant reproductive traits of pollen viability and reproductive success during different flowering stages were studied previously at the floret or flower head levels [36,47], but not yet at the field scale. Our flowering phenology assessment may provide a basis for future studies. It should also be mentioned that although we registered seed yield components in detail, we only analysed 15 flower heads per plot. This may be too low a number to represent the whole plot/crop. Oliva [16] found that irrigation may lead to excessive vegetative growth without promoting seed yield, whereas no irrigation decreased seed yield by reducing the floral fertility (i.e., seed number per floret). The calculated seed set from 2014 and 2015 showed a lower seed set in ‘Suez’ in 2014, whereas no difference was found in ‘Amos’ (Figure 10). The specific mechanisms underlying the reduced floral fertility are yet to be studied. Recent studies urged the importance of improving the fertility of red clover [30,48]. Studying meiotic aberrations and embryo abortion [30,49], and investigating the pollination process that directly linked to the seed setting process [36,47] may improve our understanding for future breeding activities.
Lack of water may influence the embryo development and then further reduce the number of florets that successfully set seeds [1]. The embryo of red clover usually starts to develop three days after pollination and further requires less than 17 days to reach the full size [1,50]. In our study, peak flowering time ranged from 11 to 22 days (Table 2), this means that the earliest pollinated embryos developed into seeds during peak flowering, while the latest pollinated embryos developed through to maturity. We attempted to correlate seed yield and thousand seed weight with the precipitation during seed development stage (data not shown), but did not manage to obtain statistically significance findings. We speculate that the influence of precipitation on the seed development is a dynamic factor and hence difficult to determine in the current study. More factors such as specific harvesting time and methods should be considered in future studies.
The current red clover experiment was placed in an area, which frequently has been used for clover and alfalfa seed production, providing a stable flowering resource for pollinators, and thus the pollination conditions were favourable for seed production. Further, we speculate that the relatively small size of the experimental plots in the current study allowed for sufficient to optimal pollination services as one honey bee hive was put out for pollination and in addition, there was a relatively high abundance of wild bumble bee species (B. pascuorum, B. muscorum, and B. hortorum). Therefore, favourable pollination conditions may explain why we obtained higher seed yields compared to the national average. However, high amounts of rain may have a negative impact on pollination and seed maturation and harvest [7]. We did not monitor the precipitation events with bee activities, and therefore, we could not quantify the negative influences of precipitation on pollinator performance. Future studies may correlate the bee abundance with flowering phenology at the field scale by using the visual assessment of flowering intensity. Obtaining flowering phenology in different red clover cultivars also provides information for the bee management because varied phenology of different bee species most likely influences the availability of pollinators during the flowering time.
5. Conclusions
To explore the influence of precipitation during flowering on red clover seed yield, we conducted a three-year field experiment with three red clover cultivars. We found that: (1) in general high seed yields were obtained in both diploid (over 1000 kg ha−1) and tetraploid (around 500 kg ha−1) cultivars compared to national average seed yields, which can be due to the favourable pollination conditions; (2) lower seed yield, seed number per flower head, and seed set were observed in tetraploid cultivar ‘Amos’ compared to diploid cultivars ‘Rajah’ and ‘Suez’, showing the potential of improving the fertility of tetraploid red clover; (3) higher seed yield and thousand seed weight were obtained in years with abundant precipitation during peak flowering, emphasizing the importance of precipitation during the peak flowering time; (4) by using visual assessment of flowering intensity, different flowering phenology patterns of red clover cultivars were shown. This method provides a basis for analysing the flowering patterns under field scales. Future studies may focus more on the influences of precipitation during the seed development stage, and matching the flowering phenology with irrigation management and pollination management.
Supplementary Materials
The following are available online at https://0-www-mdpi-com.brum.beds.ac.uk/article/10.3390/agriculture11121289/s1, Figure S1: Grid used for determining the peak flowering time.
Author Contributions
Conceptualization, B.B.; methodology, B.B.; validation, B.B. and S.J.; formal analysis, B.B. and S.J.; investigation, B.B.; resources, B.B.; data curation, B.B. and S.J.; writing—original draft preparation, S.J.; writing—review and editing, B.B.; visualization, B.B. and S.J.; supervision, B.B.; project administration, B.B.; funding acquisition, B.B. All authors have read and agreed to the published version of the manuscript.
Funding
The work was funded by GUDP (Grønt Udviklings- og Demonstrations Program) project J.nr.: 34009-13-0726, the Danish Agricultural Agency under the Ministry of Environment and Food of Denmark.
Acknowledgments
We would like to thank DLF Seeds for providing basic seed of the red clover cultivars used in the experiment. For research assistance in the field and laboratory, the authors thank Ulla Andersen, Betina Hansen and Palle Kristiansen Ahm and Per Kryger for providing honey bee hives.
Conflicts of Interest
The authors declare no conflict of interest.
References
- Taylor, N.L.; Quesenberry, K.H. Red Clover Science; Kluwer Academic Publishers: Dordrecht, The Netherlands, 1996. [Google Scholar]
- Kjærgaard, T. A plant that changed the world: The rise and fall of clover 1000–2000. Landsc. Res. 2003, 28, 41–49. [Google Scholar] [CrossRef]
- Taylor, N.L. A century of clover breeding developments in the United States. Crop Sci. 2008, 48, 1–13. [Google Scholar] [CrossRef]
- Boller, B.; Schubiger, F.X.; Kölliker, R. Red clover. In Handbook of Plant Breeding; Boller, B., Ed.; Springer: Dordrecht, The Netherlands, 2010; pp. 439–455. [Google Scholar]
- Muntean, L. A comparative study of the variability of some morphological traits in a collection of diploid and tetraploid cultivars of red clover. In Genetics, Plant Breeding and Seed Production, Proceedings of the 43rd Croatian and 3rd International Symposium on Agriculture, Opatija, Croatia, 18–21 February 2008; Pospišil, M., Ed.; University of Zagreb: Zagreb, Croatia, 2008; pp. 317–321. [Google Scholar]
- Amdahl, H.; Aamlid, T.S.; Marum, P.; Ergon, A.; Alsheikh, M.; Rognli, O.A. Seed yield components in single plants of diverse Scandinavian tetraploid red clover populations (Trifolium pratense L.). Crop Sci. 2017, 57, 108–117. [Google Scholar] [CrossRef]
- Petkovic, B.; Przulj, N.; Radic, V.; Mirosavljevic, M. Comparative study of seed yield and seed quality of advanced lines and commercial varieties of red clover (Trifolium Pratense L.). Legum. Res. 2017, 40, 1066–1071. [Google Scholar] [CrossRef] [Green Version]
- Lugic, Z.; Radovic, J.; Terzic, D.; Tomic, Z.; Spasic, R. Seed production of perennial legumes in the Center of forage crops Kruševac. Plant Breed. Seed Prod. 1999, 6, 27–32. [Google Scholar]
- The Danish Seed Council. Årsrapport 2020. Available online: https://lf.dk/om-os/om-landbrug-og-foedevarer/aarsrapport/aarsrapport-2020 (accessed on 27 September 2021).
- Bommarco, R.; Lundin, O.; Smith, H.G.; Rundlöf, M. Drastic historic shifts in bumble-bee community composition in Sweden. Proc. R. Soc. B 2012, 279, 309–315. [Google Scholar] [CrossRef] [Green Version]
- Ray, D.K.; Gerber, J.S.; MacDonald, G.K.; West, P.C. Climate variation explains a third of global crop yield variability. Nat. Commun. 2015, 6, 1–9. [Google Scholar] [CrossRef] [PubMed] [Green Version]
- Singer, J.W.; Casler, M.D.; Kohler, K.A. Wheat effect on frost-seeded red clover cultivar establishment and yield. Agron. J. 2006, 98, 265–269. [Google Scholar] [CrossRef]
- Queen, A.; Earl, H.; Deen, W. Light and moisture competition effects on biomass of red clover underseeded to winter wheat. Agron. J. 2009, 101, 1511–1521. [Google Scholar] [CrossRef] [Green Version]
- Loucks, C.E.S.; Deen, W.; Gaudin, A.C.M.; Earl, H.J.; Bowley, S.R.; Martin, R.C. Genotypic differences in red clover (Trifolium Pratense L.) response under severe water deficit. Plant Soil 2018, 425, 401–414. [Google Scholar] [CrossRef] [Green Version]
- Gataric, Ð.; Kovaèevic, Z.; Ðuric, B.; Radic, V.; Lakic, Ž. Genetic resources of forage legumes and grasses in Republic of Srpska (Bosnia and Herzegovina). J. Improv. Anim. Husb. 2010, 26, 1–7. [Google Scholar]
- Oliva, R.N.; Steiner, J.J.; Young, W.C. Red clover seed production: II. Plant water status on yield and yield components. Crop Sci. 1994, 34, 184–192. [Google Scholar] [CrossRef]
- Anderson, N.P.; Chastain, T.G.; Garbacik, C.J. Irrigation and trinexapac-ethyl effects on seed yield in first-and second-year red clover stands. Agron. J. 2016, 108, 1116–1123. [Google Scholar] [CrossRef]
- Boelt, B.; Julier, B.; Karagic, D.; Hampton, J. Legume seed production meeting market requirements and economic impacts. Crit. Rev. Plant Sci. 2015, 34, 412–427. [Google Scholar] [CrossRef]
- Hegland, S.J.; Nielsen, A.; Lázaro, A.; Bjerknes, A.; Totland, Ø. How does climate warming affect plant-pollinator interactions? Ecol. Lett. 2009, 12, 184–195. [Google Scholar] [CrossRef] [PubMed]
- Plant Variety Database-European Commission. European Commission Website. Available online: https://ec.europa.eu/food/plant/plant_propagation_material/plant_variety_catalogues_databases/search//public/index.cfm?event=SearchForm&ctl_type=A (accessed on 27 September 2021).
- Dijkstra, J. The importance of two-seeded pods in red clover (Trifolium pratense L.). Euphytica 1969, 18, 340–351. [Google Scholar] [CrossRef]
- Lorenzetti, F. Achieving potential herbage seed yields in species of temperate regions. In Proceedings of the XVII International Grassland Congress, Palmerston North, New Zealand, 8–21 February 1993; Kelly and Mundy Ltd.: Palmerston North, New Zealand, 1993; pp. 1621–1628. [Google Scholar]
- ISTA. International Rules for Seed Testing; International Seed Testing Association: Bassersdorf, Switzerland, 2021. [Google Scholar]
- R Core Team. R: A Language and Environment for Statistical Computing; R Foundation for Statistical Computing: Vienna, Austria, 2020. [Google Scholar]
- Bates, D.; Maechler, M.; Bolker, B.; Walker, S. Fitting linear mixed-effects models using lme4. J. Stat. Softw. 2015, 67, 1–48. [Google Scholar] [CrossRef]
- Fox, J.; Weisberg, S. An {R} Companion to Applied Regression, 3rd ed.; Sage: Thousand Oaks, CA, USA, 2019. [Google Scholar]
- Graves, S.; Piepho, H.P.; Selzer, L.; Dorai-Raj, S. MultcompView: Visualizations of Paired Comparisons. R Package Version 0.1-8. 2019. Available online: https://CRAN.R-project.org/package=multcompView (accessed on 27 September 2021).
- Lenth, R. Emmeans: Estimated Marginal Means, aka Least-Squares Means. R Package Version 1.5.1. 2020. Available online: https://CRAN.R-project.org/package=emmeans (accessed on 27 September 2021).
- Karagić, Đ.; Jevtić, G.; Terzić, D. Forage legumes seed production in Serbia. Biotechnol. Anim. Husb. 2010, 26, 133–148. [Google Scholar]
- Vleugels, T.; Amdahl, H.; Roldán-Ruiz, I.; Cnops, G. Factors underlying seed yield in red clover: Review of current knowledge and perspectives. Agronomy 2019, 9, 829. [Google Scholar] [CrossRef] [Green Version]
- Stephen, W.P. Apis sets record red clover seed: A climatic aberration. J. Apic. Res. 2015, 54, 137–143. [Google Scholar] [CrossRef]
- Anderson, N.P.; Garbacik, C.J.; Chastain, T.G.; Ellias, S. Boron effects on red clover seed production and quality. Seed Prod. Res. 2018, 9, 9–11. [Google Scholar]
- Levan, A. The present state of plant breeding by induction of polyploidy. Sveriges Utsädes-förenings Tidskrift 1945, 55, 109–143. [Google Scholar]
- Liatukas, Ž.; Bukauskaitė, J. Differences in yield of diploid and tetraploid red clover in Lithuania. Proc. Latv. Acad. Sci. B Nat. Exact Appl. Sci. 2012, 66, 163–167. [Google Scholar] [CrossRef] [Green Version]
- Amdahl, H.; Aamlid, T.S.; Ergon, A.; Kovi, M.R.; Marum, P.; Alsheikh, M.; Rognli, O.A. Seed yield of Norwegian and Swedish tetraploid red clover (Trifolium pratense L.) populations. Crop Sci. 2016, 56, 603–612. [Google Scholar] [CrossRef]
- Jing, S.; Kryger, P.; Boelt, B. Different pollination approaches to compare the seed set of diploid and tetraploid red clover Trifolium pratense L. Nord. J. Bot. 2021, 39, 03006. [Google Scholar] [CrossRef]
- Morrison, K.J.; Foeppel, W.G.; Rincker, C.M. Red Clover Seed Production; Cooperative Extension, College of Agriculture & Home Economics, Washington State University: Pullman, WA, USA, 1984. [Google Scholar]
- Tucak, M.; Popović, S.; Čupić, T.; Krizmanić, G.; Španić, V.; Maglič, V.; Radović, J. Assessment of red clover (Trifolium pratense L.) productivity in environmental stress. Poljoprivreda 2016, 22, 3–9. [Google Scholar] [CrossRef]
- Kutcher, H.R.; Warland, J.S.; Brandt, S.A. Temperature and precipitation effects on canola yields in Saskatchewan, Canada. Agric. For. Meteorol. 2010, 150, 161–165. [Google Scholar] [CrossRef]
- Steiner, J.J.; Smith, R.R.; Alderman, S.C. Red clover seed production: IV. Root rot resistance under forage and seed production systems. Crop Sci. 1997, 37, 1278–1282. [Google Scholar] [CrossRef]
- Herrmann, D.; Boller, B.; Studer, B.; Widmer, F.; Kölliker, R. QTL analysis of seed yield components in red clover (Trifolium pratense L.). Theor. Appl. Genet. 2006, 112, 536–545. [Google Scholar] [CrossRef]
- Vleugels, T.; Roldán-Ruiz, I.; Cnops, G. Influence of flower and flowering characteristics on seed yield in diploid and tetraploid red clover. Plant Breed. 2015, 134, 56–61. [Google Scholar] [CrossRef]
- Vleugels, T.; Ceuppens, B.; Cnops, G.; Lootens, P.; van Parijs, F.R.D.; Smagghe, G.; Roldán-Ruiz, I. Models with only two predictor variables can accurately predict seed yield in diploid and tetraploid red clover. Euphytica 2016, 209, 507–523. [Google Scholar] [CrossRef]
- Steiner, J.J.; Leffel, J.A.; Gingrich, G.; Aldrich-Markham, S. Red clover seed production: III. Effect of forage removal time under varied environments. Crop Sci. 1995, 35, 1667–1675. [Google Scholar] [CrossRef]
- Hočevar, M.; Širok, B.; Godeša, T.; Stopar, M. Flowering estimation in apple orchards by image analysis. Precis. Agric. 2014, 15, 466–478. [Google Scholar] [CrossRef]
- Thorp, K.R.; Dierig, D.A. Color image segmentation approach to monitor flowering in lesquerella. Ind. Crops Prod. 2011, 34, 1150–1159. [Google Scholar] [CrossRef]
- Jing, S.; Kryger, P.; Markussen, B.; Boelt, B. Pollination and plant reproductive success of two ploidy levels in red clover (Trifolium pratense L.). Front. Plant Sci. 2021, 12, 1580. [Google Scholar] [CrossRef]
- Jing, S.; Kryger, P.; Boelt, B. Review of seed yield components and pollination conditions in red clover (Trifolium pratense L.) seed production. Euphytica 2021, 217, 69. [Google Scholar] [CrossRef]
- Vleugels, T.; van Laere, K.; Roldán-Ruiz, I.; Cnops, G. Seed yield in red clover is associated with meiotic abnormalities and in tetraploid genotypes also with self-compatibility. Euphytica 2019, 215, 79. [Google Scholar] [CrossRef]
- Armstrong, K.C. Cytpgenetic and Embryological Studies of the Interspecific Hybrid Trifolium Pratense L. × T. Pallidum Waldst. and Kit. Ph.D. Dissertation, The Pennsylvania State University, University Park, PA, USA, 1968. [Google Scholar]
Figure 1.
Meteorological data of mean daily temperature (°C) and monthly precipitation (mm) during red clover seed production at AU-Flakkebjerg, Denmark in experimental year 2013–2015 and mean values of 30 years between 1961–1990.
Figure 1.
Meteorological data of mean daily temperature (°C) and monthly precipitation (mm) during red clover seed production at AU-Flakkebjerg, Denmark in experimental year 2013–2015 and mean values of 30 years between 1961–1990.

Figure 2.
Visual score of flowering intensity during June to August for red clover cultivars ‘Rajah’ (2x), ‘Suez’ (2x), and ‘Amos’ (4x) in the seed production years 2013–2015. Visual-score based judgement: 0 equals ‘no florets open’ and 100 equals ‘one or more florets open on any flower head’.
Figure 2.
Visual score of flowering intensity during June to August for red clover cultivars ‘Rajah’ (2x), ‘Suez’ (2x), and ‘Amos’ (4x) in the seed production years 2013–2015. Visual-score based judgement: 0 equals ‘no florets open’ and 100 equals ‘one or more florets open on any flower head’.

Figure 3.
Comparison of plant density in average of the red clover cultivars ‘Rajah’ (2x), ‘Suez’ (2x), and ‘Amos’ (4x) during the seed production years 2013–2015. In the x-axis, autumn represents the establishment year and spring represents the seed production year. Visual score-based judgment: 0 equals ‘no plants in the row’ and 100 equals ‘full ground cover in the row’. Within each figure, error bars indicate the 95% confidence interval of the estimated marginal means (EMMs). EMMs sharing a letter are not significantly different at 0.05 significance level (Tukey adjusted comparisons).

Figure 4.
Comparison of plant density for red clover cultivars ‘Rajah’ (2x), ‘Suez’ (2x), and ‘Amos’ (4x) during the seed production years 2013–2015. In the x-axis, each cultivar represents the average of autumn and spring plant density. Visual score-based judgment: 0 equals ‘no plants in the row’ and 100 equals ‘full ground cover in the row’. Within each figure, error bars indicate the 95% confidence interval of the estimated marginal means (EMMs). EMMs sharing a letter are not significantly different at 0.05 significance level (Tukey-adjusted comparisons).

Figure 5.
Comparison of seed yield (kg ha−1) for red clover cultivars ‘Rajah’ (2x), ‘Suez’ (2x), and ‘Amos’ (4x) during the seed production years 2013–2015. Error bars indicate the 95% confidence interval of the estimated marginal means (EMMs). EMMs sharing a letter are not significantly different at 0.05 significance level (Tukey adjusted comparisons).

Figure 6.
Correlation between seed yield (kg ha−1) with total precipitation during peak flowering time in red clover cultivars ‘Rajah’ (2x), ‘Suez’ (2x), and ‘Amos’ (4x) during the seed production years 2013–2015. Error bars indicate the 95% confidence interval of the means.
Figure 6.
Correlation between seed yield (kg ha−1) with total precipitation during peak flowering time in red clover cultivars ‘Rajah’ (2x), ‘Suez’ (2x), and ‘Amos’ (4x) during the seed production years 2013–2015. Error bars indicate the 95% confidence interval of the means.

Figure 7.
Correlation between thousand seed weight with precipitation during peak flowering time in red clover cultivars ‘Rajah’ (2x), ‘Suez’ (2x), and ‘Amos’ (4x) during the seed production years 2013–2015. Error bars indicate the 95% confidence interval of the means.
Figure 7.
Correlation between thousand seed weight with precipitation during peak flowering time in red clover cultivars ‘Rajah’ (2x), ‘Suez’ (2x), and ‘Amos’ (4x) during the seed production years 2013–2015. Error bars indicate the 95% confidence interval of the means.

Figure 8.
Comparison of seed number per flower head among three red clover cultivars ‘Rajah’ (2x), ‘Suez’ (2x), and ‘Amos’ (4x) during the seed production years 2014 and 2015. Error bars indicate the 95% confidence interval of the estimated marginal means (EMMs). EMMs sharing a letter are not significantly different at 0.05 significance level (Tukey adjusted comparisons).

Figure 9.
Comparison of floret number per flower head among three red clover cultivars ‘Rajah’ (2x), ‘Suez’ (2x), and ‘Amos’ (4x). Error bars indicate the 95% confidence interval of the estimated marginal means (EMMs). EMMs sharing a letter are not significantly different at 0.05 significance level (Tukey adjusted comparisons). EMMs were the mean values of year 2014 and 2015.

Figure 10.
Comparison of seed set (%) among three red clover cultivars ‘Rajah’ (2x), ‘Suez’ (2x), and ‘Amos’ (4x) during the seed production years 2014 and 2015. Error bars indicate the 95% confidence interval of the estimated marginal means (EMMs). EMMs sharing a letter are not significantly different at 0.05 significance level (Tukey-adjusted comparisons).


Table 1.
Dates and method of harvesting for red clover cultivars ‘Rajah’, ‘Suez’, and ‘Amos’ during the seed production years 2013–2015.
Table 1.
Dates and method of harvesting for red clover cultivars ‘Rajah’, ‘Suez’, and ‘Amos’ during the seed production years 2013–2015.
| Cultivar | Year | Swathing | Combine-Harvesting |
|---|---|---|---|
| ‘Rajah’ | 2013 | 9 August | 14 August |
| 2014 | 5 August | 8 August | |
| 2015 | 7 September | 9 September | |
| ‘Suez’ | 2013 | 1 August | 5 August |
| 2014 | 28 July | 8 August | |
| 2015 | 11 August | 22 August | |
| ‘Amos’ | 2013 | 1 August | 5 August |
| 2014 | 5 August | 8 August | |
| 2015 | 17 August | 22 August |
Table 2.
Total precipitation (mm) of different flowering stages for red clover cultivars ‘Rajah’ (2x), ‘Suez’ (2x), and ‘Amos’ (4x) during the seed production years 2013–2015.
Table 2.
Total precipitation (mm) of different flowering stages for red clover cultivars ‘Rajah’ (2x), ‘Suez’ (2x), and ‘Amos’ (4x) during the seed production years 2013–2015.
| Cultivar | Year | Precipitation (Prior) 1 | Precipitation (Peak Flowering) | Days (Peak Flowering) | Precipitation (After) 2 |
|---|---|---|---|---|---|
| Rajah (2x) | 2013 | 37.4 | 0.3 | 14 | 25.6 |
| 2014 | 15.5 | 31.2 | 11 | 52.4 | |
| 2015 | 22.8 | 45.8 | 22 | 58.6 | |
| Suez (2x) | 2013 | 10.8 | 70.2 | 22 | 18.0 |
| 2014 | 6.1 | 14.9 | 17 | 29.6 | |
| 2015 | 6.1 | 18.9 | 18 | 61.7 | |
| Amos (4x) | 2013 | 10.9 | 52.6 | 16 | 7.9 |
| 2014 | 6.1 | 17.3 | 22 | 29.6 | |
| 2015 | 13.1 | 25.0 | 14 | 35.1 |
1 Duration for prior peak flowering stage was 14 days for all three cultivars; 2 duration for after peak flowering stage was 25 days for all three cultivars.
Table 3.
Type II ANOVA table of GLM for plant density in red clover cultivars ‘Rajah’ (2x), ‘Suez’ (2x), and ‘Amos’ (4x) during the seed production years 2013–2015, respectively.
Table 3.
Type II ANOVA table of GLM for plant density in red clover cultivars ‘Rajah’ (2x), ‘Suez’ (2x), and ‘Amos’ (4x) during the seed production years 2013–2015, respectively.
| Effect | 2013 | 2014 | 2015 | ||||||
|---|---|---|---|---|---|---|---|---|---|
| df | χ2 | p-Value | df | χ2 | p-Value | df | χ2 | p-Value | |
| Cultivar | 2 | 18.5069 | <0.0001 | 2 | 47.734 | <0.0001 | 2 | 5.6357 | 0.0597 |
| Time | 1 | 4.9345 | 0.0263 | 1 | 4.394 | 0.0361 | 1 | 9.6660 | 0.0019 |
| Cultivar × Time | 2 | 1.0005 | 0.6064 | 2 | 0.739 | 0.6912 | 2 | 2.6841 | 0.2600 |
Table 4.
Type III ANOVA table of linear model for seed yield (kg ha−1) in red clover cultivars ‘Rajah’ (2x), ‘Suez’ (2x), and ‘Amos’ (4x) during the seed production years 2013–2015.
Table 4.
Type III ANOVA table of linear model for seed yield (kg ha−1) in red clover cultivars ‘Rajah’ (2x), ‘Suez’ (2x), and ‘Amos’ (4x) during the seed production years 2013–2015.
| Effect | Seed Yield (kg ha−1) | ||
|---|---|---|---|
| df | χ2 | p-Value | |
| Cultivar | 2 | 870946 | <0.0001 |
| Year | 2 | 286676 | <0.0001 |
| Cultivar × Year | 4 | 997862 | <0.0001 |
Table 5.
Type III ANOVA table of GLMM for seed number per flower head in red clover cultivars ‘Rajah’ (2x), ‘Suez’ (2x), and ‘Amos’ (4x) during the seed production years 2013–2015.
Table 5.
Type III ANOVA table of GLMM for seed number per flower head in red clover cultivars ‘Rajah’ (2x), ‘Suez’ (2x), and ‘Amos’ (4x) during the seed production years 2013–2015.
| Effect | Seed Number per Flower Head | ||
|---|---|---|---|
| df | χ2 | p-Value | |
| Cultivar | 2 | 249.6202 | <0.0001 |
| Year | 1 | 3.7988 | 0.05129 |
| Cultivar × Year | 2 | 26.7654 | <0.0001 |
Table 6.
Type II ANOVA table of GLMM for floret number per flower head in red clover cultivars ‘Rajah’ (2x), ‘Suez’ (2x), and ‘Amos’ (4x) during the seed production years 2014 and 2015.
Table 6.
Type II ANOVA table of GLMM for floret number per flower head in red clover cultivars ‘Rajah’ (2x), ‘Suez’ (2x), and ‘Amos’ (4x) during the seed production years 2014 and 2015.
| Effect | Floret Number per Flower Head | ||
|---|---|---|---|
| df | χ2 | p-Value | |
| Cultivar | 2 | 9.4188 | 0.00901 |
| Year | 1 | 48.2821 | <0.0001 |
Table 7.
Type III ANOVA table of GLMM for seed set (%) in red clover cultivars ‘Rajah’ (2x), ‘Suez’ (2x), and ‘Amos’ (4x) during the seed production years 2013–2015.
Table 7.
Type III ANOVA table of GLMM for seed set (%) in red clover cultivars ‘Rajah’ (2x), ‘Suez’ (2x), and ‘Amos’ (4x) during the seed production years 2013–2015.
| Effect | Seed Set (%) | ||
|---|---|---|---|
| df | χ2 | p-Value | |
| Cultivar | 2 | 150.076 | <0.0001 |
| Year | 1 | 3.648 | 0.05612 |
| Cultivar × Year | 2 | 18.923 | <0.0001 |
Publisher’s Note: MDPI stays neutral with regard to jurisdictional claims in published maps and institutional affiliations. |
© 2021 by the authors. Licensee MDPI, Basel, Switzerland. This article is an open access article distributed under the terms and conditions of the Creative Commons Attribution (CC BY) license (https://creativecommons.org/licenses/by/4.0/).
Share and Cite
MDPI and ACS Style
Jing, S.; Boelt, B. Seed Production of Red Clover (Trifolium pratense L.) under Danish Field Conditions. Agriculture 2021, 11, 1289. https://0-doi-org.brum.beds.ac.uk/10.3390/agriculture11121289
AMA Style
Jing S, Boelt B. Seed Production of Red Clover (Trifolium pratense L.) under Danish Field Conditions. Agriculture. 2021; 11(12):1289. https://0-doi-org.brum.beds.ac.uk/10.3390/agriculture11121289
Chicago/Turabian StyleJing, Shuxuan, and Birte Boelt. 2021. "Seed Production of Red Clover (Trifolium pratense L.) under Danish Field Conditions" Agriculture 11, no. 12: 1289. https://0-doi-org.brum.beds.ac.uk/10.3390/agriculture11121289
Note that from the first issue of 2016, this journal uses article numbers instead of page numbers. See further details here.