
Stability and Social Sustainability of Farm Household Income in Poland in 2003–2020


Institute of Economics and Finance, University of Rzeszow, 35-601 Rzeszow, Poland
*
Author to whom correspondence should be addressed.
Agriculture 2021, 11(12), 1296; https://0-doi-org.brum.beds.ac.uk/10.3390/agriculture11121296
Submission received: 24 November 2021
/
Revised: 15 December 2021
/
Accepted: 17 December 2021
/
Published: 20 December 2021
(This article belongs to the Special Issue Agricultural Food Marketing, Economics and Policies)
Abstract
:This article analyses the available income of farmer households in Poland in 2003–2020 in the context of their level, variability, and differentiation. The income situation of farmers was analysed from the intra-sectoral perspective and the inter-sectoral perspective by comparing the average monthly available income per capita of farmer households to the income of employees and total households. The research aimed to assess the stability of farmers’ incomes against the background of comparative groups and to assess their social sustainability. We understand farmers’ income parity relative to other socio-professional groups and a similar level of intra-sectoral differentiation. The source of empirical materials was the cyclical statistics of the Central Statistical Office prepared as part of the Household Budget Surveys, published in the years 2004–2021. It was found that despite a significant increase in the real income of farmers’ households in Poland over the studied years, the income disparity of farmers relative to other socio-occupational groups persisted. However, the income gap of farmers in relation to workers from the non-agricultural sector decreased from 35.1% in 2003 to an average of 15.7% in 2004–2020, which is largely due to the support for agriculture from the CAP funds. Compared to the analysed groups, the income of farmers’ households is characterised by the most significant instability and greater diversification. These results indicate a persistent deficit in the social sustainability of farmers’ household income in Poland.
1. Introduction
The need to increase and stabilise farmers’ income (both in absolute and relative terms, relating to other social groups) remains one of the fundamental premises of agricultural policy, especially the Common Agricultural Policy (CAP) of the European Union. The problem of so-called parity income concerns the issue of fair income distribution within the market economy and the existence of income inequalities in society [1,2,3,4]. Income inequalities are natural to a market economy, but when they are too high and result from the non-equivalent distribution of income due to production factors (labour, land, and capital), they can lead to the economic deprivation of certain socio-professional groups.
The active agricultural support policy conducted in the European Union countries since the 1960s caused that the income disparity between farmers and other socio-professional groups was significantly reduced. However, empirical studies show that in most EU countries, the income of agricultural producers is still below the income earned by employees in other sectors of the economy, and it mainly concerns the so-called new member states, including Poland [5,6,7].
The population’s income determines the possibilities for satisfying its individual needs and, as a result, is a determinant of the quality of life. It also concerns the agricultural population. Obtaining sufficient incomes by agricultural producers is necessary to maintain agricultural production at the level desired by society and obtain appropriate quality food. It is also an indispensable condition for the realisation of other functions of agriculture, which are crucial for the sustainable development of this sector and the sustainable development of rural areas [8,9,10]. These include functions essential for preserving the values of the natural environment, biodiversity, maintaining the climate, rural landscape, or providing society with other public goods (social, cultural, etc.) [11,12]. Agriculture faces pressure from both policymakers and consumers to adopt sustainable development practices [13]. However, the implementation of many ecological or social order functions is not conducive to maximising the income of agricultural producers. This is one of the arguments to justify rewarding farmers for adopting certain agricultural practices considered beneficial for the climate, environment, and society.
The problem of income disparity of farmers relating to other socio-professional groups has been present in the literature for many decades, but also today, it has not lost its topicality [14,15,16]. It is similar to the issue of stability of farmers’ income [17,18,19,20,21]. This difficulty is fundamental because farmers’ incomes are subject to large fluctuations over time due to the variability of the volume of agricultural production, shaped under the influence of natural factors and the variability of prices of agricultural products and prices of purchased means of production. However, it should be emphasised that, by economists representing the neoliberal trend, this topic is treated marginally because they assume that the characteristic attribute of the market economy is differentiation and unpredictability [22], rather than balance and stability [23,24].
Much space in the literature is devoted to the impact of agricultural policy instruments, including CAP instruments, on farmers’ income [25,26,27,28,29,30,31,32]. In most studies, the subject of analysis is the efficiency and effectiveness of public expenditure in achieving CAP objectives related to the level and stability of farmers’ income. The subject of analysis is also the effectiveness of subsidies directed to farmers in reducing their income disparity relating to other socio-professional groups [33,34,35]. Much less attention is paid to the problem of income disparities within agriculture, although this issue has been gaining importance lately [36,37,38,39,40,41,42]. This is due to the growing conviction about the negative consequences of the progressive increase in income inequality of agricultural holdings for sustainable agricultural development [43].
The object of interest of researchers is usually agricultural income, i.e., income from agricultural production. Concerning individual farmers, this is the so-called income from the family farm. These analyses are often based on FADN agricultural accounting data, which are representative of commercial farms. In Poland, these are farms delivering about 90% of production to the market, but in terms of numbers, they constitute about 55% of all farms registered as agricultural producers. The FADN data are therefore not representative of a significant proportion of agricultural holdings in the country.
In the context of stability and especially social sustainability of farmers’ income, the category of particular interest is not so much agricultural income (from agricultural production) but the disposable income of farmers’ households. For farmer households, the primary source of livelihood is farm income, but this income is most frequently supplemented by non-agricultural income, i.e., from hired labour, non-agricultural economic activities, or budget transfers, but not related to agricultural activities. Due to the strong connection between the farmer’s household and their farm, there are strong couplings between agricultural income and income obtained from other sources. Farm income is used to support the farmer’s family, but non-agricultural income is also frequently a source of financing for the costs of farming activities. Available income determines the standard of living of the farming family and the sustainability and development possibilities of the agricultural holding.
A higher and stable income contributes to the better resilience of farmer households to crisis and protects the farm against materialisation of adverse risks related to natural and economic factors [44]. Moreover, a fair and stable income enables farmers to take advantage of a broader set of economic opportunities for farm development. It should be emphasised that available income is not only an economic, but also a social category. This is because it is a determinant of the social status of the household. Farmers need to compare their income relative to other socio-professional groups and other farmers [4].
2. Materials and Methods
This study analyses the average available income per capita in farmer households in Poland in 2003–2020 in the context of its level, variability, and diversity. The study aims to assess the level of variability (stability) of farmers’ available income and its social sustainability in absolute (intra-sectoral) and relative terms, i.e., relating to the income of total households and workers’ households.
We understand the social sustainability of agricultural income as a situation in which farmers’ available income is similar to the income of households in general and workers’ households, and the intra-sectoral differentiation of farmers’ income does not differ too much from the differentiation of income of the groups of households mentioned above. Such a perception of the social sustainability of farmers’ income results from the essence of available income as an economic and social category.
In the research procedure, the following hypotheses were formulated:
Hypothesis 1 (H1).
The per capita available income of farmer households in Poland shows much more significant year-to-year variation than that of total households and worker households.
Hypothesis 2 (H2).
Support through subsidies from the Common Agricultural Policy contributes to reducing the income disparity of farmers compared to other socio-occupational groups and reducing income inequality in agriculture.
The research period includes the year before Poland’s accession to the European Union (2003) as a base year for comparisons, and the years 2004–2020, i.e., 15 years of agriculture in Poland under the influence of the Common Agricultural Policy. Verifying the first Hypothesis (H1) will make it possible to assess the impact of CAP instruments on mitigating the naturally high variability (fluctuation) of farmers’ household incomes. On the other hand, verifying the second Hypothesis (H2) is interesting in answering the question to what extent the CAP support for agriculture influences the more outstanding social balance of farmers’ income.
We assume that the stabilization of agricultural income and, to a certain extent, the reduction of income inequalities within the sector are influenced by those CAP instruments that directly support farmers’ income and are not related to the volume of agricultural production (e.g., direct payments, LFA payments). Under the second pillar of the CAP, these objectives are implemented by such instrument as, for example, “Restoring agricultural production potential following natural disasters”.
The level and variability of per capita available income of farmer households was analysed relating to the income of total households and employee households. The latter are households whose exclusive or main (prevailing) source of maintenance is income from hired work in either the public or private non-agricultural sector.
The farmers income parity was established as an indicator (in %) that determines the ratio of the average monthly available income per capita in farmers households compared to the average monthly available income per capita in the reference group of households (i.e., all households or employee households). If this ratio is lower than 100%, then we are talking about the farmers’ income disparity, and the relative difference (in %) between the average level of farmers’ income and the average level of income of the compared group will be referred to as the income gap.
Changes in income dynamics were presented in absolute terms (in constant prices), and the consumer price index (CPI) was used as a deflator. In the analysis of income variability of farmers relating to other socio-occupational groups, the parameters of descriptive statistics were applied, such as the average annual rate of income change, as well as the minimum, maximum, divergence, and the value of standard deviation, as well as the coefficient of variation V, determined for the average annual rate of income change.
To assess the scale of intra-sectoral income inequality in agriculture (among farmer households), the Gini coefficient for per capita available income in farmer households was used. The coefficient values are in the range [0, 1]. Assuming that income values are ordered in ascending order, the Gini coefficient is determined by the formula:
where i = 1 to N, N denotes the number of subjects in a population, yi the income of the i household indexed in non-decreasing order (yi ≤ yi+1), and the average income of households in a population.
A higher value of G indicates a high income differentiation, while a lower value is a distribution close to equality. Low income stratification of a given population of households can occur when the value of the Gini coefficient is less than 0.30. The Gini coefficient within the range of 0.30–0.45 reflects average income disparities, while values above 0.45 characterise communities with high income stratification [45].
The source of data on disposable income in different types of households in Poland was the cyclical research of the Central Statistical Office (CSO) entitled Household Budget Survey from 2004 to 2021. This income category is the resultant volume of household budget surveys, which reflects the income obtained by farmers from different sources, i.e., from the farm, hired labour, property rights, and social benefits, which is reduced by taxes and social and health insurance contributions [46]. In this approach, the fluctuations in disposable income are significantly influenced by the factors determining the level of income of farming families also obtained outside agriculture. In Polish statistics, presenting data in microeconomic terms, the main criterion for distinguishing farmer households is the overwhelming basic source of their livelihood, which is income from the use of a private farm for agriculture. It is worth emphasizing that the research on household budgets in Poland concerns the living conditions of the population and is carried out by the Central Statistical Office using the monthly rotation method on a random sample of total households. According to this method, a different randomly selected household participates in the annual survey each month. The research is therefore representative. Such an approach allows for an in-depth assessment of the financial situation of households: in current and retrospective terms, in the light of the most important categories of economic well-being, both monetary and non-monetary. The research covers various groups of farms according to their socio-professional profile.
3. Results
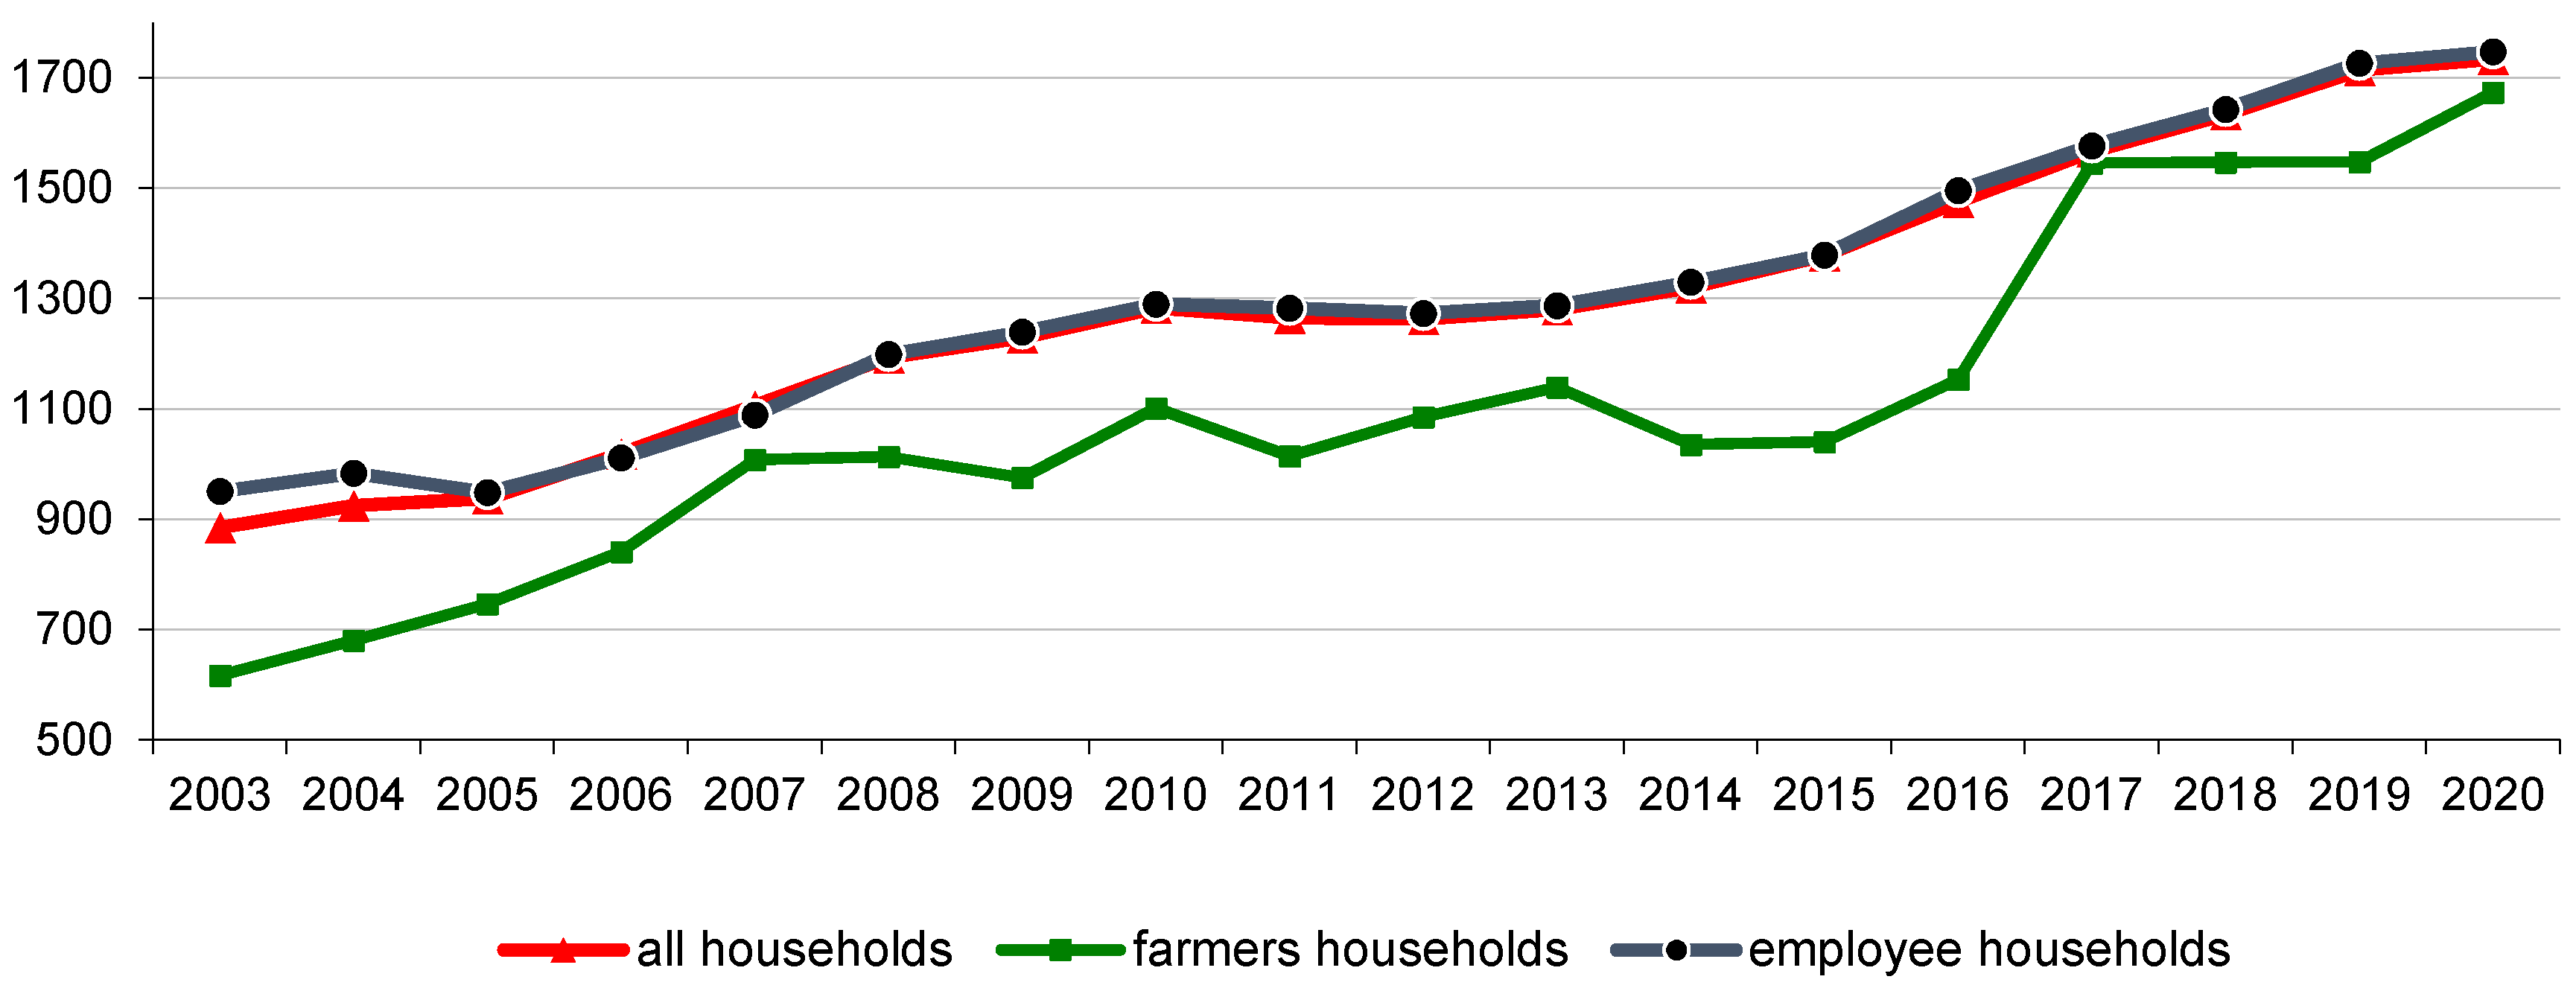
The amount of income obtained, in comparison to other socio-professional groups and other farmers, is a measure of the living standard of the agricultural population and is a necessary factor for the occurrence of satisfaction, usefulness, and well-being. It concerns not only its objective dimension, but also its subjective one. Figure 1 presents the development of real available income per capita in farmer households in 2003–2020 in comparison with total households and employees’ households.
Monthly per capita available income in farmer households increased by 171.3% in real terms (290.9% in nominal terms) between 2003 and 2020. At the same time, in employee households, per capita, disposable income increased by 83.8% in real terms, and in total households by 95.8% (in nominal terms, by 164.9% and 182.2%, respectively). Farmers’ incomes grew faster than those of comparable groups, thanks to which their income gap relating to other socio-occupational groups was gradually reduced. It is worth noting that after the period of market transformation in Poland at the beginning of the 1990s, farmers’ real income decreased the most compared to other groups of households. Only in 1995–1997 was the rate of their decline halted, and the process of their slow reconstruction began [47]. However, in the following years, 1998–1999, there was an actual decline in farmers’ incomes and a deepening of the income disparity regarding other groups of farms. In 2000–2002, farmers’ incomes grew in real terms, while in 2003 they again recorded a decline. Thus, while in 1995–2003 there was a real improvement in the income situation of average households and employee households (the average annual growth rate of their income was 1.7% and 2.3%, respectively), farmers’ income recorded a regression (an average annual decline of 0.9%). Moreover, the period just before accession to the European Union (2000–2003) was characterised by a high variability of available income of farmers [48].
The income situation of farmers has radically improved since 2004, i.e., since agriculture was covered by support under the EU Common Agricultural Policy instruments. As a result of direct payments and other agricultural support instruments, farmers’ income increased in 2004–2008 by 64.2% in real terms. In this period, the real incomes of farms in general increased by 34.8%, and of employee farms by 26.2%. In 2009, there was a noticeable slowdown in the dynamics of the average household’s income, which was caused by a decrease in the rate of economic growth. A renewed increase in farmers’ income took place in 2010. During the following years (2011–2015), relative stabilisation of the level of real income was noted in all socio-economic groups. However, farmers’ incomes compared to other groups showed the most significant volatility during this period, and in 2014 recorded a rather deep decline (by 9.1% compared to the previous year). In turn, between 2015 and 2017, farmers’ incomes showed a clear upward trend but remained all the time below the average incomes of workers and farms in general. In 2017, compared to 2016, farmers’ households recorded the highest increase in real income (by 34.0%) among all household groups [46]. In that year, the income gap of farmers against total households (1.3%) and worker households (2%) was the lowest not only in the entire period under study, but also since the early 1990s [48]. However, this rebound in farmers’ incomes in 2017 was essentially the result of their previous stagnation at low levels in 2014–2016 and was to some extent ‘statistical’ in nature. In 2018–2019, farmers’ real incomes remained at a level similar to 2017. A fairly deep decrease of farmers available income in 2009 and 2014 resulted mainly from unfavorable price relations in agriculture (the price scissors index in those years was 0.90 and 0.98, respectively). On the other hand, a strong increase farmers’ income in 2017, in addition to the aforementioned statistical effect, was caused by favorable price relations in agriculture (the price scissors index was 1.10). In 2020, despite the COVID-19 pandemic and its negative economic impact, farmers’ incomes in real terms increased quite dynamically by 8.2% compared to the previous year. Over the post-accession period (2004–2020), farmers’ incomes grew at an average annual rate of 6%, while total farm incomes grew at 4% and employee farms at 3.6%. These results indicate unequivocally that farmers are the occupational group that benefited most from Poland’s accession to the EU. It is reflected in the improvement in the income parity of farmers relating to other household groups.
Table 1 shows the relation of the average per capita available income of farmers and workers regarding the average household’s income in Poland. The relation of farmers’ available income to workers’ income is also shown. The data confirm that in the post-accession period (2004–2020), the average income gap between farmers’ and workers’ incomes was smaller, relative to the 2003 gap by 19.4%, and relative to total households by 15.3% (Table 1).
The higher dynamics of farmers’ available income relating to other socio-professional groups is not only due to EU subsidies supporting farmers’ income. It is also due to the increase in agricultural productivity in Poland after 2004, both globally and in terms of productivity of individual production factors in agriculture [49]. For example, the final output of agriculture expressed in constant prices was 75% higher in 2019 compared to 2003 [50,51]. The increase in agricultural productivity in the post-accession period, to some extent, was also due to transfers of CAP funds to this sector. They allowed farmers to implement modernisation investments and increase the production potential of farms and, as a result, the profitability of agricultural production. Moreover, the increase in farmers’ household income was also influenced by transfers from government social programmes, such as the Family 500+ and Good Start programmes, which have been in operation since 2016 and support families with children. Thanks to these programmes, budget expenditures for social purposes increased from about 20 billion PLN in 2015 to 60.4 billion PLN in 2019, i.e., by more than three times (by 213%) [52]. It is estimated that about 60% of these funds went to the countryside. A significant part of them went to agricultural families, which have more children than those living in cities. However, both transfers from CAP funds and government programmes supporting families and the improvement of agricultural productivity did not allow for the complete elimination of the income disparity of farmers, but undoubtedly caused its significant reduction.
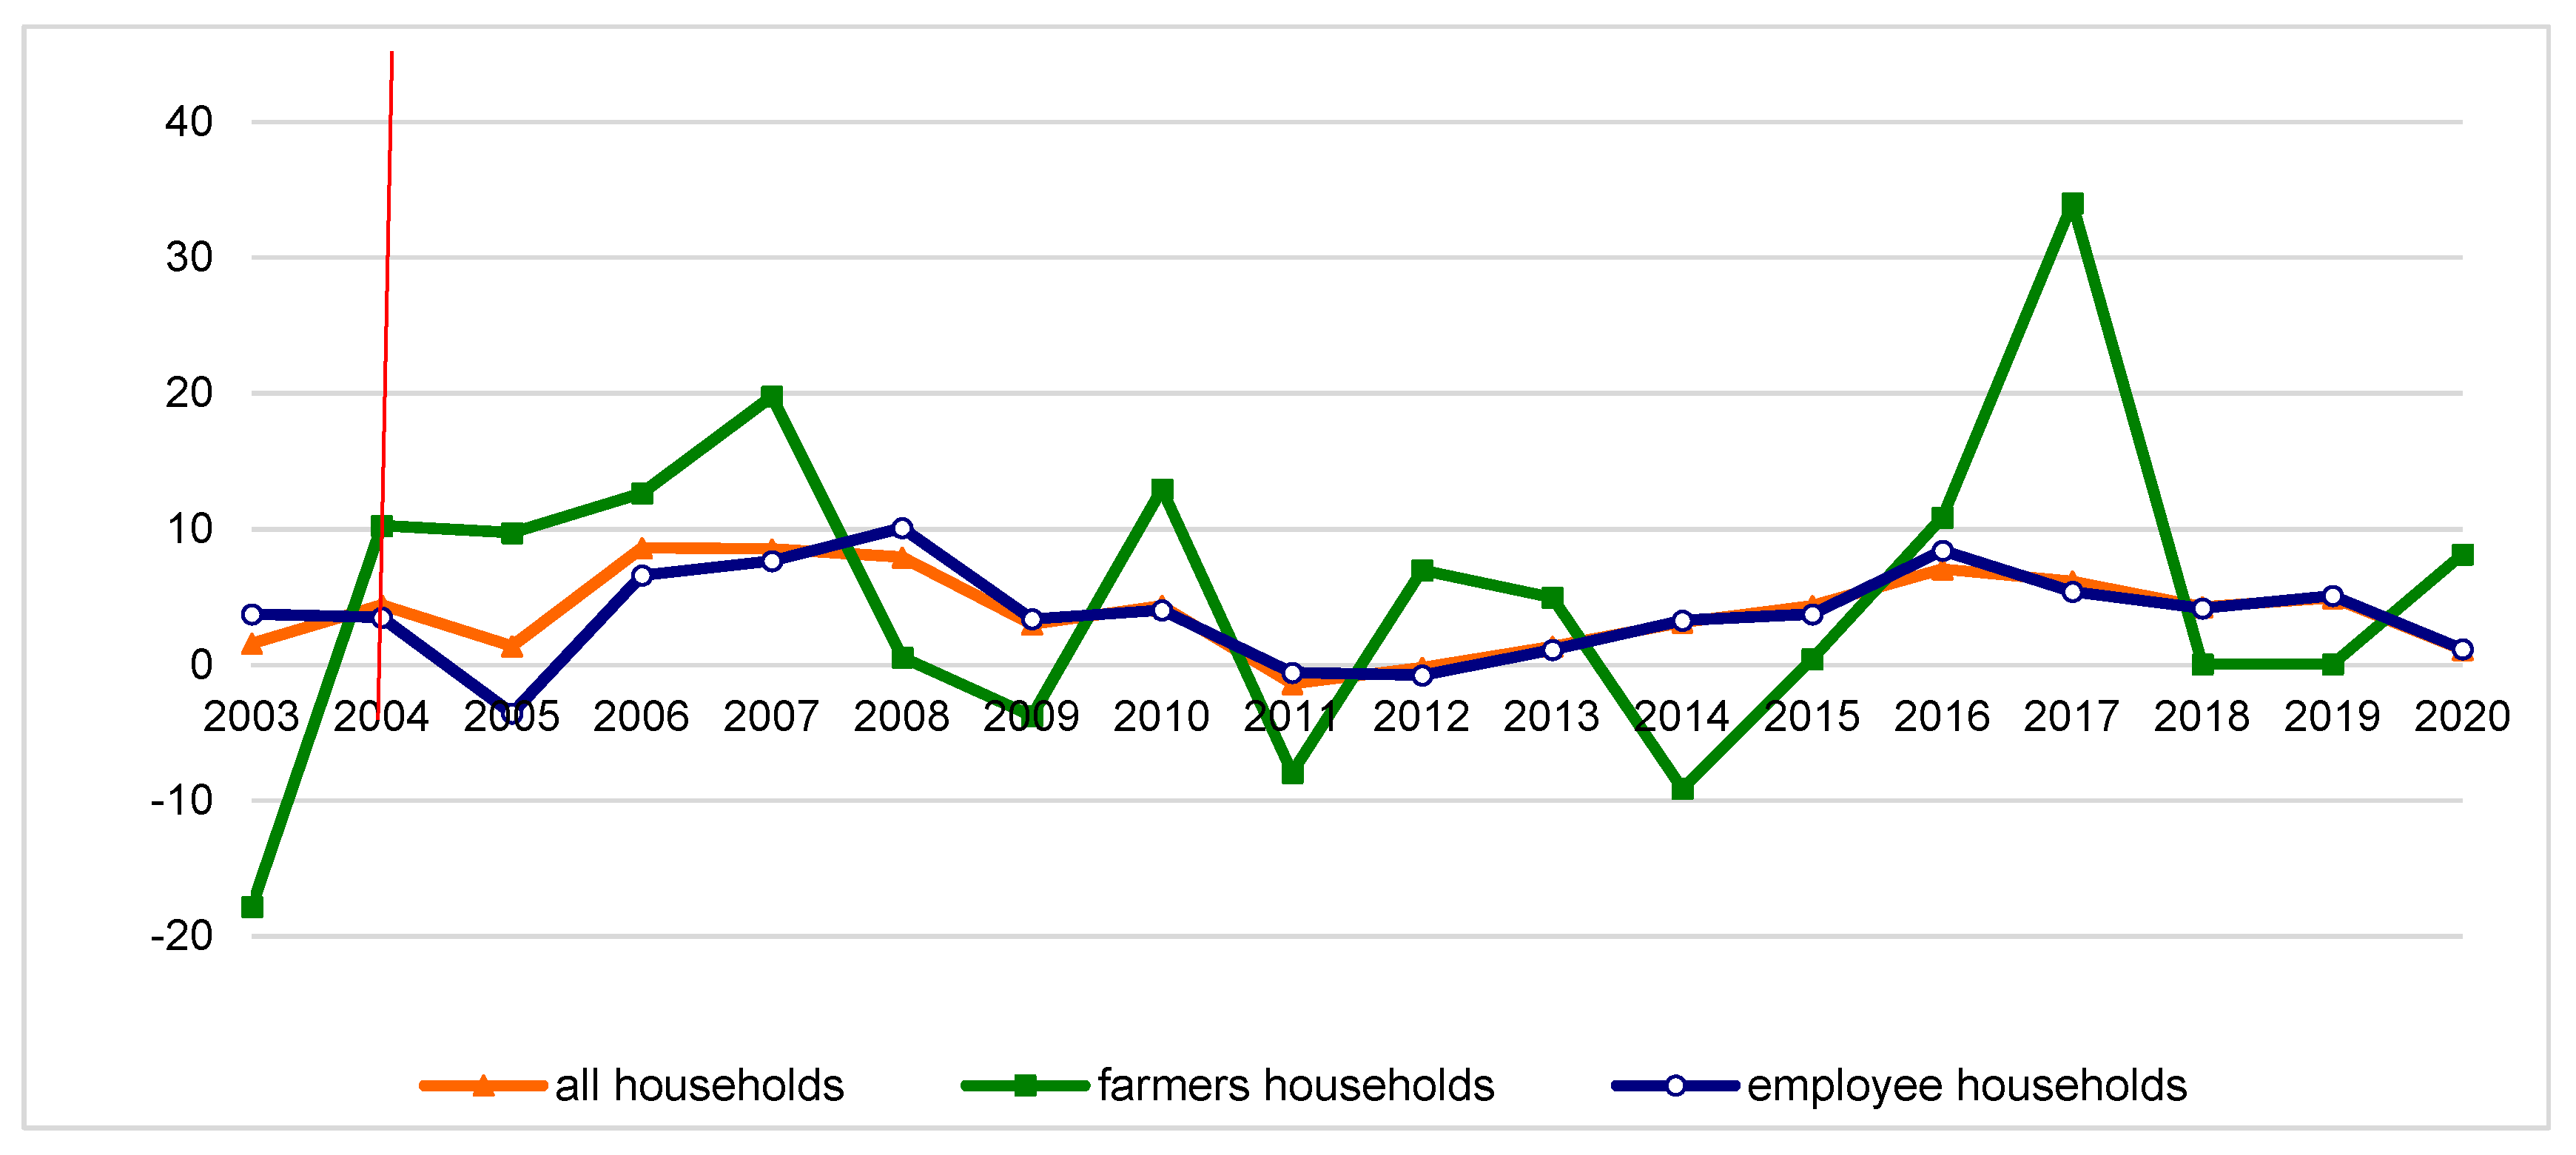
As shown in Figure 2, between 2003 and 2020, the average annual growth rates of per capita disposable income of agricultural households show much higher volatility than the income of total households and worker households.
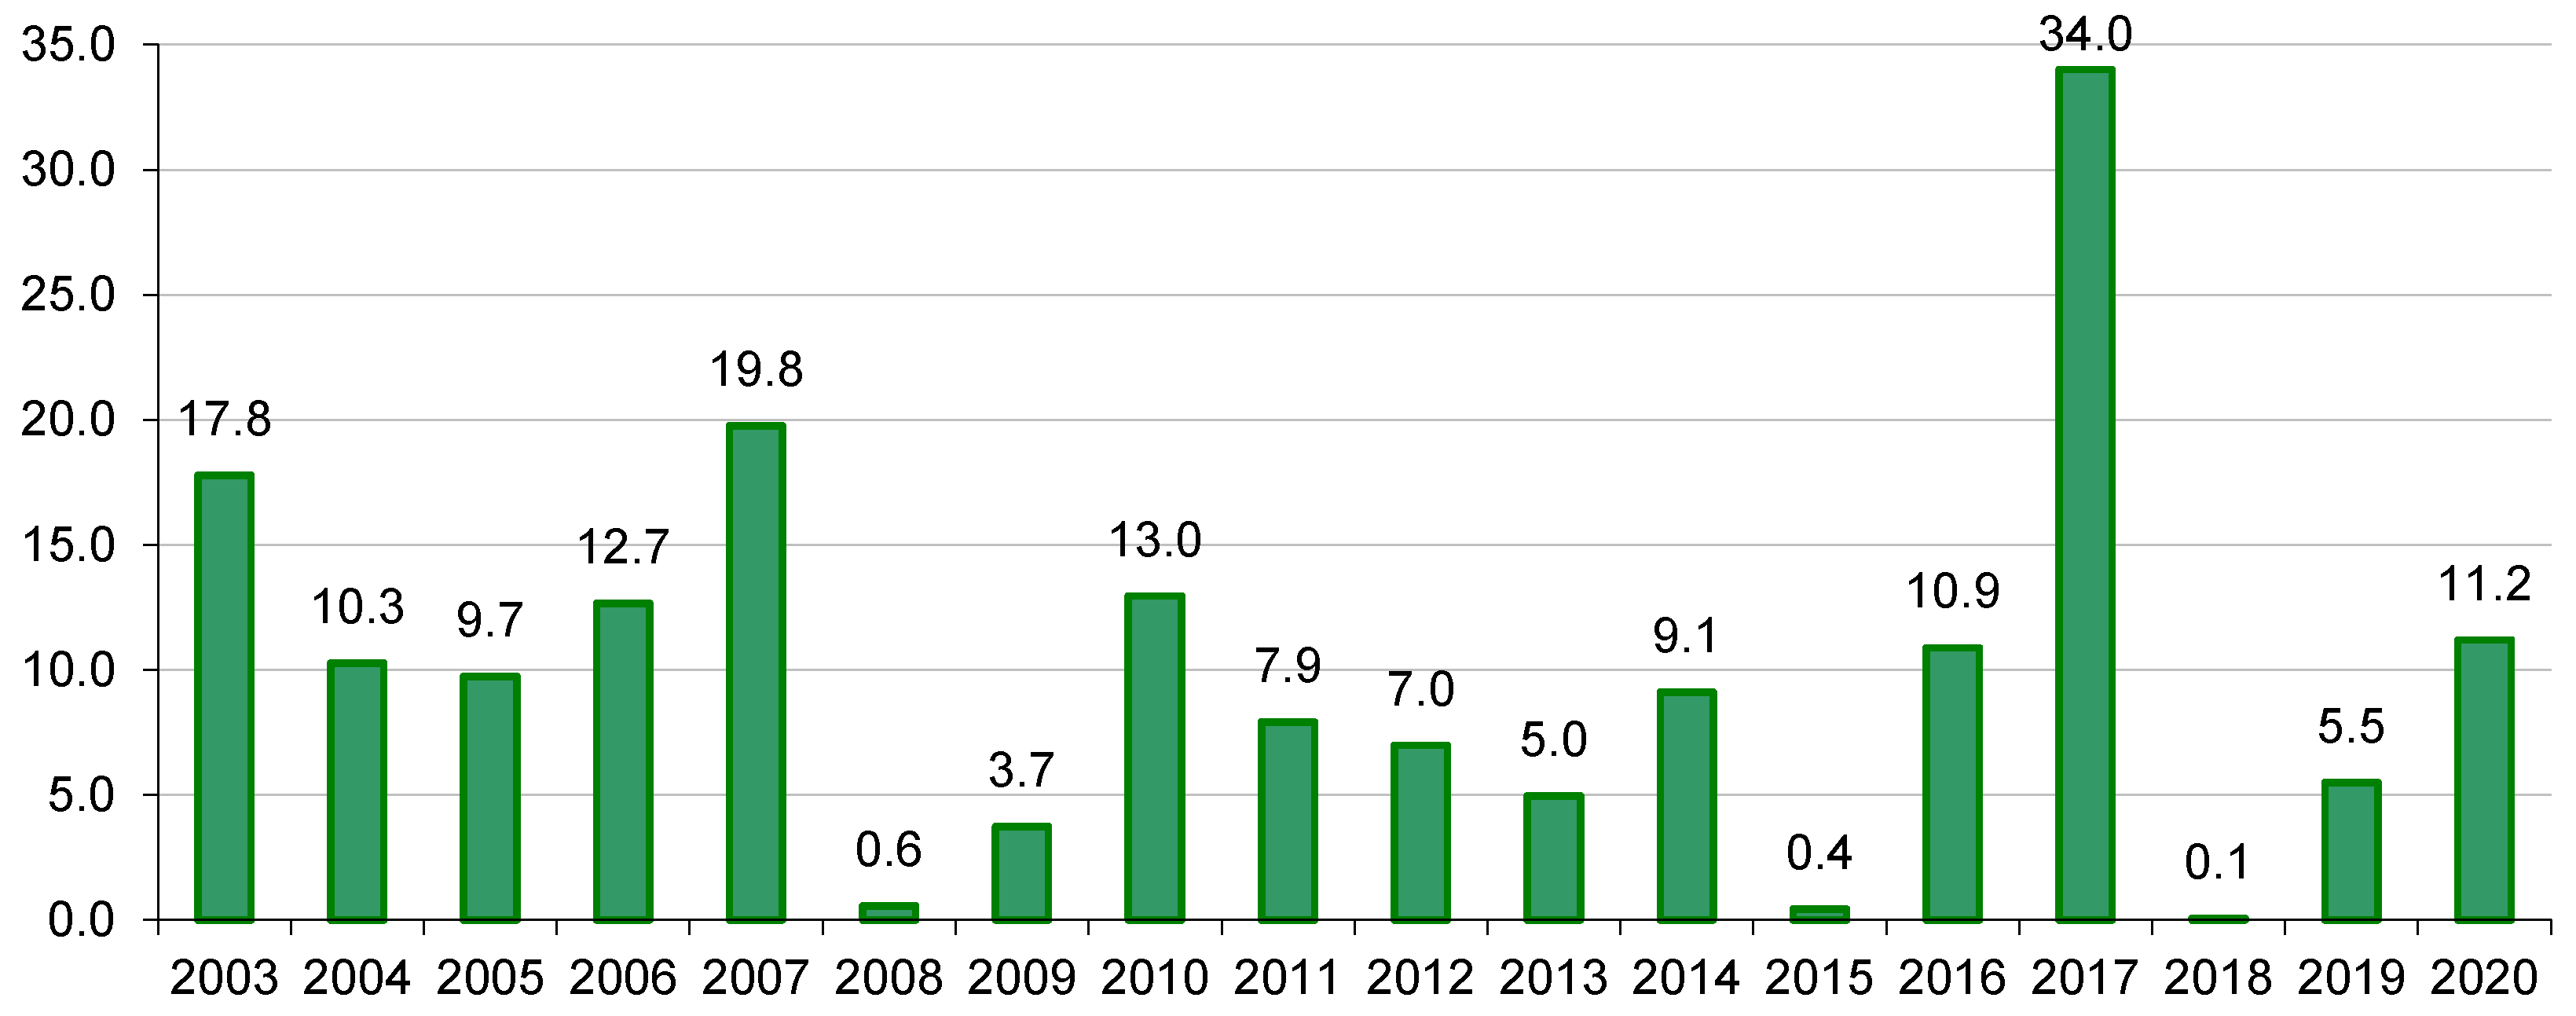
Over the period 2003–2020, the average rate of change in farmers’ available income, i.e., its year-on-year deviation (in %), was 7.4% in nominal terms and 5.2% in real terms and exceeded these rates for total households and workers (Table 2). This measure indicates that the average annual amplitude of fluctuation of these incomes for farmers is higher by about 1.4%. Much higher fluctuation of farmers’ incomes compared to other socio-occupational groups is also evidenced by such measures of variability as the R-square, the standard deviation, and the coefficient of variation V for the annual growth rate of real incomes (Table 2). The relatively higher income variability of farmers, i.e., self-employed in agriculture, may not be surprising. It results from the direct dependence of their income on unstable market factors (economic situation, prices of means of production and products or services sold by farmers). Concerning farmers, income variability is also determined by natural factors that influence the volume and quality of agricultural production. Nevertheless, more than three times higher coefficient of variation of the annual growth rate of farmers’ household income relating to the compared groups of households indicates a very high income instability. This problem is one of the most important current challenges for agricultural policy, as fluctuations in farmers’ income have been very high for many years. Figure 3 shows the absolute values of fluctuations in the annual rate of change of farmers’ available income. Over the entire period under study (2003–2020), they averaged 9.92%, while in 2003–2010 they averaged 10.94%, and in the next decade they were 9.11%. These data indicate that CAP instruments dedicated to stabilising agricultural income are insufficient or not very effective, as the fluctuation of this income has remained at a similar level for years.
The available income of farmer households is less stable relating to other socio-professional groups. It shows relatively more significant internal differentiation, illustrated by the Gini coefficient values (Figure 4).
Differences in available income per capita in total households and households of employees in Poland, as measured by the Gini coefficient, have decreased since 2004, from the level of 0.364 to about 0.313. In the studied period (2003–2020), in the group of farmers’ households, an opposite tendency could be observed, i.e., an increase in income inequality, measured by the Gini coefficient. Its level in this group of households was 0.473 in 2003, while at the end of the analysed period it was as high as 0.583.
Progressive intra-sectoral differentiation of farmers’ household incomes in Poland is primarily a derivative of structural changes in agriculture, i.e., processes of agrarian structure concentration and decrease in employment in agriculture. In 1995–2016, the average area of agricultural holdings increased from 7.6 ha to 10.7 ha of arable land (AL). The number of farms above 15 ha of AL increased from 8% to 15%, and their share in agricultural land increased from 31% to 60.4%. In the same period, employment in agriculture, expressed in the annual work unit (AWU), decreased by as much as 51.8% [32]. These changes lead to an improvement in the relations of factors of production (land, labour, and capital) and, as a result, to an increase in their productivity and an increase in profitability per employed person. The key here is to increase the capital stock per unit of labour (increase in the technical equipment of labour) and per unit of land and reduce labour input [53,54,55,56]. However, the tendencies described here are not universal for the whole collective of agricultural holdings. Some farms develop their production potential, invest, intensify, and increase the scale of production. Others seek alternative development paths and sources of income, and still, others enter a decline phase or collapse, constituting to some extent a reservoir of resources for developing farms. Income differentiation in agriculture is a natural consequence of the sector’s development. However, sustainable development requires that these processes are not spontaneous but stable, leading to the retention in agriculture of indispensable labour resources with high human capital and outflow of surplus resources. Income from agricultural activity should ensure a fair remuneration of production factors, including the labour factor, involved in this sector, but should be obtained primarily on the market.
4. Discussion
The presented research results are consistent with other studies, which show that the dynamics of disposable income of farmers’ households in Poland in the post-accession period, i.e., after 2004, have significantly increased compared to the pre-accession period [57,58]. The increase in budget expenditure on the agricultural sector since 2004 also significantly mitigated the fluctuations in the level of farmers’ income. However, this stabilising effect of budget expenditure was more evident regarding real gross disposable income than disposable income [42]. The former income category is a sectoral approach (based on national accounts), while the latter results from microeconomic studies of household budgets. Gross disposable income reflects better than disposable income from agricultural production. On the other hand, the fluctuations of disposable income are significantly influenced by factors determining the income level of agricultural families obtained outside agriculture.
Studies indicate that the orientation of financial support for agriculture to make direct payments, at the expense of market interventions, contributes to the reduction of income fluctuations of agricultural producers [30,59]. Still, farmers’ income volatility is very high and significantly exceeds the income volatility of other socio-professional groups. The Common Agricultural Policy increasingly considers the need to reduce the volatility and uncertainty of agricultural incomes. However, thus far the CAP policies have not been able to buffer the farmers income fluctuations. Mitigating the volatility of agricultural incomes affects the greater stability of investment processes, as the private capital of farms primarily finances these. The above premises are essential for capturing the objectives of the stabilisation function in the budgeting of agricultural expenditure [42].
Many researchers point to the persistent income gap of farmers relating to other socio-professional groups, both in Poland [60] and in other EU countries [61,62,63]. In Poland, as in other EU countries, the income disparity of farmers is reduced under the influence of subsidies directly supporting farmers’ income and other CAP instruments, supporting investments in farms [64,65], or ecological and climatic objectives or structural changes in agriculture [30,40,66].
The necessity to increase the stability of farmers’ income and improve their income relative to other socio-professional groups remains one of the most critical challenges relating to the EU Common Agricultural Policy and its national implementation [67,68]. It is also an essential element of the social sustainability of farmers’ income, without which farmers will not be able to fulfil all those functions (productive, environmental, social) that the society expects from them [12,69]. In the extreme scenario, without the social sustainability of income in agriculture, family farms will be replaced by industrial, agricultural monocultures, farmers as a social group will disappear, and the village will lose its natural (cultural and social) character [11]. It will also be complicated to achieve the objectives of environmental governance and the changes required of agriculture related to climate challenges.
The concept of sustainable development points to the need for economic and social inclusion, i.e., achieving decent incomes, or at least parity incomes [70] and the full integration of different social groups in socio-economic development. It also points to efforts to reduce inequalities between and within socio-economic groups [43,71,72,73]. In this respect, the research results presented in the article indicate an incomplete realisation of the social sustainability of farmers’ incomes in Poland understood in this way. In the studied period, there was significant progress only in reducing the income disparity of farmers relative to other socio-professional groups.
5. Conclusions
The conducted research confirms that in Poland, over the period 2003–2020, the level of available income per capita in farmers’ households significantly improved. The average income of farmer households in that period increased nominally and in absolute terms (by more than 170%), which improved the living standards of most farm families. After Poland’s accession to the EU, there was also a faster increase in disposable income in farmers’ households compared to households in general and employees’ households. This resulted in a significant reduction of the income gap of farmers compared to other socio-professional groups. This is undoubtedly due to the support of farmers’ income with direct payments and other subsidies (e.g., agri-environmental payments) under CAP instruments since 2004. Moreover, the improvement in farmers’ income is also the result of increased agricultural productivity, which was also helped by European funds channelled to support investment and structural changes in agriculture. Farmers have also shared the benefits of Poland’s economic growth, while rural residents, and farmers to a relatively greater extent than urban residents, have benefited from budget transfers supporting families under social policy programmes operating since 2016.
For farmers, the stability of the available income received is essential. On average, farm income (agricultural activity) still accounts for two thirds of a farmer family’s income (65.7% on average in 2019). The variability of farm income mainly causes the variability of the available income of farmer households. Large fluctuations in these incomes can create specific tensions in terms of financial stability or even the financial security of agricultural households.
A significant problem that is gaining strength is the excessive intra-sectoral differentiation of agricultural incomes. Unevenness (concentration) of income distribution is natural for agriculture. The processes governing the concentration of production factors are a condition for the growth of production potential, economic effectiveness, and competitiveness of agriculture in Poland. This results from the relatively high fragmentation and dispersion of the resources of production factors in this sector, particularly from the fragmentation of the agrarian structure. However, excessive income disproportions limit the chances for smaller farms to stay on the market, which provide valuable public goods for society (biodiversity, rural landscape, vitality of villages, cultural values, etc.). High levels of income inequality are undesirable for the social context of sustainable agricultural development but can also harm the achievement of economic and environmental governance.
The empirical research carried out allowed for the verification of hypotheses posed at the beginning of this article. The first one (H1) was fully confirmed, while the second Hypothesis (H2) was partially confirmed. Regarding H1, it has been shown that the high instability of available income of farmer households in absolute and relative terms, i.e., in comparison to the income of households in general and worker households, is a fact. As regards H2, it was shown that support subsidies from the Common Agricultural Policy contribute to the reduction of the income disparity of farmers relating to other socio-occupational groups, which is evidenced by the reversal in 2004 (since Poland’s accession to the EU) of the previously observed trend towards an increase in the income disparity of farmers. Over the period 2004–2020, the average income gap of farmers against total households and employee households decreased approximately twofold in comparison to 2003, i.e., from about 30% (against total households) and 35% (against employee households) to, respectively, 15.3% and 19.4%.
The research carried out did not allow us to accept the second hypothesis, indicating that expenditure allocated to agriculture under the CAP contributed to reducing income inequality among farmer households. In the period in question, an increase in the income polarisation of agricultural households (intra-sectoral) was observed, but it should be assumed that this increase would be more significant if no financial transfers under the CAP were directed to agricultural households. This results from the fact that some of them are redistributive, i.e., they prefer smaller farms or are addressed only to farms that do not exceed a specific size concerning agricultural area (direct payments) or economic strength (support for farm modernisation).
Considering the persistence and inevitability of concentration processes of production factors in agriculture, responsible for progressing income polarisation in this sector, and given the high variability of farmers’ incomes, a unique role should be assigned to agricultural policy instruments. To a greater extent than in the past, they should have an impact on mitigating the growing income disproportions in agriculture and reducing the fluctuation of agricultural income. Apart from the actual convergence of farmers’ incomes towards other socio-occupational groups, these objectives should represent the most critical area of intervention towards achieving a more outstanding social balance of agricultural income.
Author Contributions
Conceptualization, R.K. and M.L.; methodology, R.K. and M.L.; formal analysis, R.K. and M.L., editing, M.L. and R.K. All authors have read and agreed to the published version of the manuscript.
Funding
This work has been supported by the funds of the Ministry of Science and Higher Education granted to the University of Rzeszow, Poland.
Institutional Review Board Statement
Not applicable.
Informed Consent Statement
Not applicable.
Data Availability Statement
Publicly available datasets were analyzed in this study. This data can be found here: https://stat.gov.pl/obszary-tematyczne/warunki-zycia/dochody-wydatki-i-warunki-zycia-ludnosci/budzety-gospodarstw-domowych-w-2020-roku,9,15.html (accessed on 20 November 2021).
Conflicts of Interest
The authors declare no conflict of interest.
References
- Smith, V.L.; Wilson, B.J. Humanomics: Moral Sentiments and the Wealth of Nations for the Twenty-First Century; Cambridge University Press: Cambridge, UK, 2019. [Google Scholar]
- Kiryluk-Dryjska, E. Sprawiedliwy Podział: Kryteria, Metody i Aplikacje; PWN, Uniwersytet Przyrodniczy w Poznaniu: Poznań, Poland, 2019. [Google Scholar]
- Jędrzejczak, A.; Pekasiewicz, D. Nierówności dochodowe gospodarstw domowych rolników na tle innych grup społeczno-ekonomicznych w Polsce w latach 2006–2014. Probl. Rol. Swiat. 2017, 17, 166–176. [Google Scholar] [CrossRef]
- Kata, R.; Wosiek, M. Inequality of Income in Agricultural Holdings in Poland in the Context of Sustainable Agricultural Development. Sustainability 2020, 12, 4963. [Google Scholar] [CrossRef]
- Bear-Nawrocka, A. Wpływ Wspólnej Polityki Rolnej na efekty dochodowe w rolnictwie nowych krajów członkowskich Unii Europejskiej, Polityki Eur. Finan. Mark. 2013, 9, 34–44. [Google Scholar]
- DG ARD, Operating Subsides (Both Direct Payments and Rural Development Except Investment Suport), DG Agriculture and Rural Development, Unit Farm Economics, 2017. Available online: https://ec.europa.eu/info/sites/default/files/food-farming-fisheries/farming/documents/cap-operating-subsidies_en.pdf (accessed on 27 October 2021).
- Runowski, H. Zróżnicowanie dochodów ludności rolniczej między krajami Unii Europejskiej i kierunki ich zmian. Wieś Rol. 2018, 2, 65–84. [Google Scholar] [CrossRef]
- FAO. Putting Family Farmers at the Centre to Achieve the SDGs; FAO: Rome, Italy, 2019. [Google Scholar]
- Zegar, J.S. Kwestia agrarna w niepodległej Rzeczypospolitej—Aspekt ekonomiczny. Soc. Inequalities Econ. Growth 2019, 59, 83–94. [Google Scholar] [CrossRef]
- Wrzaszcz, W.; Zegar, J.S. Challenges for Sustainable Development of Agricultural Holdings. Econ. Environ. Stud. 2020, 16, 377–402. [Google Scholar]
- Zegar, J.S. Współczesne Wyzwania Rolnictwa; PWN: Warszawa, Poland, 2012. [Google Scholar]
- Matuszczak, A. Ewolucja Kwestii Agrarnej a Środowiskowe Dobra Publiczne; IERiGŻ-PIB: Warszawa, Poland, 2020. [Google Scholar]
- Bartolini, F.; Magrini, C.A.; Pacini, B. Measuring environmental efficiency of agricultural sector: A comparison between EU countries. In Proceedings of the 4th Annual Conference of the Italian Association of Environmental and Resource Economists (IAERE 2016) Bologna, Project: IMPRESA, Bologna, Italy, 11–12 February 2016. [Google Scholar]
- Xue, J. Urban-rural income disparity and its significance in China. Hitotsubashi J. Econ. 1997, 38, 45–59. [Google Scholar] [CrossRef]
- Mishra, A.K.; El-Osta, H.S.; Morehart, M.J.; Johnson, J.D.; Hopkins, J.W. Income, Wealth, and the Economic Well-Being of Farm Households. In Agricultural Economic Reports from United States Department of Agriculture; Economic Research Service (U.S. Dep. of Agric., ERS, AER): Washington, DC, USA, 2002; p. 73. [Google Scholar]
- Zegar, J.S. Kwestia Agrarna w Polsce; IERiGŻ-PIB: Warszawa, Poland, 2018. [Google Scholar]
- Mishra, A.K.; Sandretto, C.L. Stability of Farm Income and the Role of Nonfarm Income in U.S. Agriculture. Rev. Agric. Econ. 2002, 24, 208–221. [Google Scholar] [CrossRef]
- Phimister, E.; Roberts, D.; Gilbert, A. The Dynamics of Farm Incomes. J. Agric. Econ. 2004, 2, 197–220. [Google Scholar] [CrossRef]
- Hsiang, S.M.; Burke, M. Climate, conflict, and social stability: What does the evidence say? Clim. Chang. 2014, 123, 39–55. [Google Scholar] [CrossRef] [Green Version]
- Hill, B. Farm household incomes: Perceptions and statistics. J. Rural Stud. 1999, 15, 345–358. [Google Scholar] [CrossRef]
- Harkness, C.; Areal, F.J.; Semenov, M.A.; Senapati, N.; Shield, I.F.; Bishop, J. Stability of farm income: The role of agricultural diversity and agri-environment scheme payments. Agric. Syst. 2021, 187, 103009. [Google Scholar] [CrossRef]
- Rembisz, W. Kwestie Ryzyka, Cen, Rynku, Interwencji i Stabilności Dochodów w Rolnictwie; Vizja Press & IT: Warszawa, Poland, 2013. [Google Scholar]
- Soliwoda, M.; Kulawik, J.; Góral, J. Stabilizacja dochodów rolniczych. Perspektywa międzynarodowa, Unii Europejskiej i Polski. Wieś Rol. 2016, 3, 41–68. [Google Scholar] [CrossRef]
- Urruty, N.; Tailliez-Lefebvre, D.; Huyghe, C. Stability, robustness, vulnerability and resilience of agricultural systems. A review. Agron. Sustain. Dev. 2016, 36, 1–15. [Google Scholar] [CrossRef] [Green Version]
- Poon, K.; Weersink, A. Factors affecting variability in farm and off-farm income. Agric. Financ. Rev. 2011, 71, 379–397. [Google Scholar] [CrossRef] [Green Version]
- Hansen, H.; Teuber, R. Assessing the impacts of EU’s common agricultural policy on regional convergence: Sub-national evidence from Germany. Appl. Econ. 2010, 43, 3755–3765. [Google Scholar] [CrossRef]
- Schmid, E.; Sinabell, F.; Hofreither, M. Direct Payments of the CAP-Distribution across Farm Holdings in the EU and Effects on Farm Household Incomes in Austria; Univ. für Bodenkultur Wien, Inst. für Nachhaltige Wirtschaftsentwicklung: Wien, Austria, 2006. [Google Scholar]
- Severini, S.; Tantari, A. The Effect of the EU Farm Payments Policy and its Recent Reform on Farm Income Inequality. J. Policy Modeling 2013, 35, 212–227. [Google Scholar] [CrossRef]
- Poczta-Wajda, A. Polityka Wsparcia Rolnictwa a Problem Deprywacji Dochodowej Rolników w Krajach o Różnym Poziomie Rozwoju; PWN: Warszawa, Poland, 2017. [Google Scholar]
- Severini, S.; Tommaso, G.; Finger, R. Effects of the Income Stabilization Tool on farm income level, variability and concentration in Italian agriculture. Agric. Food Econ. 2019, 7, 1–23. [Google Scholar] [CrossRef]
- Bojnec, S.; Fertö, I. Farm household income inequality in Slovenia. Span. J. Agric. Res. 2019, 17, 1–12. [Google Scholar] [CrossRef]
- Czyżewski, A.; Kata, R.; Matuszczak, A. Wpływ krajowych i unijnych wydatków budżetowych na alokację czynników produkcji w polskim rolnictwie. Ekonomista 2019, 1, 45–72. [Google Scholar]
- Katchova, A.L. A comparison of the economic well-being of farm and nonfarm households. Am. J. Agric. Econ. 2008, 90, 733–747. [Google Scholar] [CrossRef] [Green Version]
- de Frahan, B.H.; Dong, J.; de Blander, R. Farm household incomes in OECD member countries over the last 30 years of public support. In Public Policy in Agriculture; Routledge: London, UK, 2017; pp. 148–175. [Google Scholar]
- Marino, M.; Rocchi, B.; Severini, S. Conditional Income Disparity between Farm and Non-farm Households in the European Union: A Longitudinal Analysis. J. Agric. Econ. 2021, 72, 589–606. [Google Scholar] [CrossRef]
- Gardner, B.L. Determinants of farm family income inequality. Am. J. Agric. Econ. 1969, 51, 753–769. [Google Scholar] [CrossRef]
- Mishra, A.K.; El-Osta, H.S.; Gillespie, J.M. Effect on agricultural policy on regional income inequality among farm households. J. Policy Modeling 2009, 31, 325–340. [Google Scholar] [CrossRef]
- Allanson, P. The Redistributive E_ects of Agricultural Policy on Scottish Farm Incomes. J. Agric. Econ. 2006, 51, 117–128. [Google Scholar] [CrossRef]
- Allanson, P. On the Characterisation and Measurement of the Redistributive Effect of Agricultural Policy. J. Agric. Econ. 2007, 59, 169–187. [Google Scholar] [CrossRef]
- Moreddu, C. Distribution of Support and Income in Agriculture. OECD Food Agric. Fish. Work. Pap. 2011, 46, 108. [Google Scholar] [CrossRef]
- Sinabell, F.; Schmid, E.; Hofreither, M.F. Exploring the distribution of direct payments of the Common Agricultural Policy. Empirica 2013, 40, 325–341. [Google Scholar] [CrossRef] [Green Version]
- Czyżewski, A.; Kata, R.; Matuszczak, A. The redistribution function in Poland’s agricultural budgets in the long term. ACTA Sci. Polonorum. Oeconomia 2019, 18, 25–35. [Google Scholar] [CrossRef]
- Kryszak, Ł. Nierówności dochodowe w rolnictwie krajów Unii Europejskiej w kontekście koncepcji zrównoważonego rozwoju. Rocz. Nauk. Stowarzyszenia Ekon. Rol. I Agrobiz. SERIA 2016, 18, 166–171. [Google Scholar]
- Corrado, G.; Corrado, L. Inclusive finance for inclusive growth and development. Curr. Opin. Environ. Sustain. 2017, 24, 19–23. [Google Scholar] [CrossRef]
- Panek, T. Ubóstwo, Wykluczenie Społeczne i Nierówności. Teoria i Praktyka Pomiaru; Oficyna Wydawnicza SGH: Warszawa, Poland, 2011. [Google Scholar]
- Central Statistical Office. Household Budget Survey in 2003 and Next Until 2020; Central Statistical Office: Warsaw, Poland, 2021.
- Leszczyńska, M. Zróżnicowanie Dochodów Ludności Rolniczej i ich Uwarunkowania; Uniwersytet Rzeszowski: Rzeszów, Poland, 2007. [Google Scholar]
- Leszczyńska, M. Ocena społecznego zrównoważenia rozwoju w Polsce według kryterium dynamiki dochodów gospodarstw domowych. Nierówności Społeczne A Wzrost Gospod. 2014, 37, 410–420. [Google Scholar]
- Kata, R.; Nowak, K.; Leszczyńska, M.; Kowal, A.; Sebastianka, B. Bezpieczeństwo Finansowe Gospodarstw Domowych–Wybrane Zagadnienia; Wydawnictwo Uniwersytetu Rzeszowskiego: Rzeszów, Poland, 2021. [Google Scholar]
- Central Statistical Office. Rocznik Statystyczny Rolnictwa i Obszarów Wiejskich 2007; Central Statistical Office: Warszawa, Poland, 2008.
- Central Statistical Office. Rocznik Statystyczny Rolnictwa 2020; Central Statistical Office: Warszawa, Poland, 2021.
- Najwyższej Izby Kontroli. Analiza Wykonania Budżetu Państwa i Założeń Polityki Pieniężnej w 2017 Roku; Raport Najwyższej Izby Kontroli: Warszawa, Poland, 2020.
- Poczta, W.; Śledzińska, J.; Mrówczyńska-Kamińska, A. Determinanty dochodów gospodarstw rolnych Unii Europejskiej według typów rolniczych. Ekon. I Organ. Gospod. Żywnościowej 2009, 76, 17–30. [Google Scholar]
- Gołaś, Z. Wydajność i dochodowość pracy w rolnictwie w świetle rachunków ekonomicznych dla rolnictwa. Zagadnienia Ekon. Rolnej 2010, 3, 19–42. [Google Scholar]
- Czyżewski, A.; Kryszak, Ł. Relacje głównych składowych determinujących rachunki dochodów rolniczych w krajach o różnym stażu członkowskim w Unii Europejskiej. Rocz. Nauk. Ekon. Rol. I Rozw. Obsz. Wiej. 2016, 103, 17–31. [Google Scholar]
- Kata, R. Agricultural Productivity in Poland in the Context of Structural Changes in the Sector in 2002–2016. In Proceedings of the 2018 International Scientific Conference Economic Sciences for Agribusiness and Rural Economy, No 2, Warsaw, Poland, 7–8 June 2018; pp. 109–115. [Google Scholar]
- Grzelak, M. Dochody rozporządzalne gospodarstw rolnych na tle dochodów innych grup społeczno-ekonomicznych w Polsce w latach 2003–2014. Ann. Univ. Mariae Curie-Skłodowska Sect. H Oekonomia 2016, 50, 139–149. [Google Scholar] [CrossRef] [Green Version]
- Czyżewski, A.; Kata, R.; Matuszczak, A. Stabilizacyjny wpływ krajowych i unijnych wydatków budżetowych na polskie rolnictwo-próba kwantyfikacji. Zesz. Nauk. Szkoły Głównej Gospod. Wiej. Ekon. I Organ. Gospod. Żywnościowej 2019, 125, 17–32. [Google Scholar] [CrossRef] [Green Version]
- El Bennini, N.; Finger, R.; Mann, S. Effects of agricultural policy reforms and farm characteristics on income risk in Swiss agriculture. Agric. Financ. Rev. 2012, 72, 301–324. [Google Scholar] [CrossRef]
- Wąs, A.; Sulewski, P.; Majewski, E. Methodical and Practical Aspects of the Parity Income in the Polish Agriculture. Zagadnienia Ekon. Rolnej 2019, 2, 3–27. [Google Scholar] [CrossRef]
- O’Donoghue, C.; Devisme, S.; Ryan, M.; Conneely, R.; Gillespie, P.; Vrolijk, H. Farm economic sustainability in the European Union: A pilot study. Stud. Agric. Econ. 2016, 118, 163–171. [Google Scholar] [CrossRef] [Green Version]
- Kisielińska, J. Dochody z gospodarstwa rolnego a wynagrodzenia z pracy najemnej w krajach UE. Probl. Rol. Swiat. 2018, 18, 130–139. [Google Scholar] [CrossRef]
- Skarżyńska, A.; Grochowska, R. Determinants of farm income diversification among the European Union countries. Probl. Agric. Econ. 2021, 2, 119–134. [Google Scholar] [CrossRef]
- Czubak, W.; Jędrzejak, P. Wykorzystanie dopłat bezpośrednich w gospodarstwach rolnych. Rocz. Nauk. SERIA 2011, 2, 75–79. [Google Scholar]
- Lovec, M. The European Union’s Common Agricultural Policy Reforms. Towards a Critical Realist Approach; Palgrave Macmillan: London, UK, 2016. [Google Scholar]
- Majewski, E.; Sulewski, P.; Wąs, A. Ewolucja Wspólnej Polityki Rolnej w Kontekście Wyzwań Trwałego Rozwoju; Wydawnictwo SGGW: Warszawa, Poland, 2018. [Google Scholar]
- Kułyk, P. Finansowe Wsparcie Rolnictwa W Krajach O Różnym Poziomie Rozwoju Gospodarczego; Wyd. Uniwersytetu Ekonomicznego w Poznaniu: Poznań, Poland, 2013. [Google Scholar]
- Staniszewski, J.; Czyżewski, A. Rolnictwo Unii Europejskiej W Procesie Zrównoważonej Intensyfikacji; PWN: Warszawa, Poland, 2019. [Google Scholar]
- Brunstad, R.J.; Gaaslad, I.; Vardal, E. Multifunctionality of agriculture: An inquiry into the complementarity between landscape preservation and food security. Eur. Rev. Agric. Econ. 2005, 32, 469–488. [Google Scholar] [CrossRef]
- Tomilova, O.; Valenzuela, M. Financial Inclusion + Stability, Integrity and Protection (I-SIP), Overview of the I-SIP Approsch, CGAP, 2018. Available online: https://www.cgap.org/sites/default/files/publications/Technical-Guide-ISIP-Policy-Making-Nov-2018.pdf (accessed on 12 March 2021).
- Chmielewska, B. Zmiany zróżnicowania dochodów rolniczych w państwach członkowskich Unii Europejskiej. Zagadnienia Ekon. Rolnej 2018, 2, 61–75. [Google Scholar] [CrossRef]
- Piketty, T. Kapitał w XXI Wieku Czy Ekonomia Nierówności; Wydawnictwo Krytyki Politycznej: Warszawa, Poland, 2015. [Google Scholar]
- Wilkinson, R.G.; Pickett, K.E. The Spirit Level: Why More Equal Societies Almost Always Do Better; Allen Lane: London, UK, 2009. [Google Scholar]
Figure 1.
Real available income per capita in farmers’ households and in total households and employees in 2003–2020 (in PLN) This is a figure. Schemes follow the same formatting. Source: own study based on Household Budget Survey in 2003 and next until 2020; Central Statistical Office: Warsaw, 2004–2021.

Figure 2.
Annual growth rates of real available income in farmers’ households in 2003–2020 as compared to the income of employees and total households (in %). Source: as Figure 1. Note: 2004—Poland joins the EU and agriculture is covered by CAP instruments.
Figure 2.
Annual growth rates of real available income in farmers’ households in 2003–2020 as compared to the income of employees and total households (in %). Source: as Figure 1. Note: 2004—Poland joins the EU and agriculture is covered by CAP instruments.

Figure 3.
The absolute rate of change in the monthly nominal available income per capita in farmers’ households (in %). Source: as Figure 1.
Figure 3.
The absolute rate of change in the monthly nominal available income per capita in farmers’ households (in %). Source: as Figure 1.

Figure 4.
Differences in available income per capita measured by the Gini coefficient in Poland in 2003–2020 for selected groups of households. Source: as Figure 1.
Figure 4.
Differences in available income per capita measured by the Gini coefficient in Poland in 2003–2020 for selected groups of households. Source: as Figure 1.


Table 1.
Relationships of available income per capita of farmers ‘and employees’ households in relation to total household income (in %).
Table 1.
Relationships of available income per capita of farmers ‘and employees’ households in relation to total household income (in %).
| Years | Households Income Relationships Total Households = 100 | Farmers’ Income Parity in Relation to Employees (%) | |
|---|---|---|---|
| Farmers | Employee | ||
| 2003 | 69.7 | 107.4 | 64.9 |
| 2004 | 73.6 | 106.4 | 69.2 |
| 2005 | 79.7 | 101.2 | 78.7 |
| 2006 | 82.6 | 99.3 | 83.2 |
| 2007 | 91.1 | 98.5 | 92,.5 |
| 2008 | 84.9 | 100.5 | 84.5 |
| 2009 | 79.4 | 100.8 | 78.7 |
| 2010 | 85.9 | 100.5 | 85.4 |
| 2011 | 80.2 | 101.4 | 79.1 |
| 2012 | 85.9 | 100.8 | 85.3 |
| 2013 | 89.0 | 100.5 | 88.5 |
| 2014 | 78.4 | 100.7 | 77.9 |
| 2015 | 75.5 | 100.1 | 75.4 |
| 2016 | 78.0 | 101.4 | 77.1 |
| 2017 | 98.6 | 100.6 | 98.0 |
| 2018 | 93.4 | 100.5 | 94.2 |
| 2019 | 91.6 | 100.7 | 89.6 |
| 2020 | 96.6 | 100.8 | 95.8 |
| Average 2004–2020 | 85.0 | 100.9 | 84.3 |
| - Difference to 2003 | 15.3 | −6.5 | 19.4 |
Source: as Figure 1.
Table 2.
Changes (in %) of the annual growth rates of real income of farmers ‘households against the background of total households and employees’ households in 2003–2020.
Table 2.
Changes (in %) of the annual growth rates of real income of farmers ‘households against the background of total households and employees’ households in 2003–2020.
| Specification | Available Income per Capita for Selected Groups of Households | |||||
|---|---|---|---|---|---|---|
| Nominal Take | Real Take | |||||
| All Households | Farmers Households | Employee Households | All Households | Farmers Households | Employee Households | |
| - average rate of growth | 6.1 | 7.4 | 5.9 | 3.9 | 5.2 | 3.7 |
| - minimum | 2.3 | −17.1 | −1.5 | −1.4 | −17.8 | −3.6 |
| - maximum | 12.5 | 36.7 | 14.7 | 8.6 | 34.0 | 10.1 |
| - range R | 10.2 | 53.8 | 16.2 | 10.0 | 51.8 | 13.7 |
| - standard deviation | 3.1 | 12.1 | 3.6 | 3.0 | 11.7 | 3.4 |
| - coefficient of variation V (%) | 50.3 | 164.0 | 60.5 | 75.3 | 226.7 | 91.8 |
Source: as Figure 1.
Publisher’s Note: MDPI stays neutral with regard to jurisdictional claims in published maps and institutional affiliations. |
© 2021 by the authors. Licensee MDPI, Basel, Switzerland. This article is an open access article distributed under the terms and conditions of the Creative Commons Attribution (CC BY) license (https://creativecommons.org/licenses/by/4.0/).
Share and Cite
MDPI and ACS Style
Kata, R.; Leszczyńska, M. Stability and Social Sustainability of Farm Household Income in Poland in 2003–2020. Agriculture 2021, 11, 1296. https://0-doi-org.brum.beds.ac.uk/10.3390/agriculture11121296
AMA Style
Kata R, Leszczyńska M. Stability and Social Sustainability of Farm Household Income in Poland in 2003–2020. Agriculture. 2021; 11(12):1296. https://0-doi-org.brum.beds.ac.uk/10.3390/agriculture11121296
Chicago/Turabian StyleKata, Ryszard, and Małgorzata Leszczyńska. 2021. "Stability and Social Sustainability of Farm Household Income in Poland in 2003–2020" Agriculture 11, no. 12: 1296. https://0-doi-org.brum.beds.ac.uk/10.3390/agriculture11121296
Note that from the first issue of 2016, this journal uses article numbers instead of page numbers. See further details here.