Article

Transparent and Black Film Mulching Improve Photosynthesis and Yield of Summer Maize in North China Plain

1
State Key Laboratory of Simulation and Regulation of Water Cycle in River Basin, China Institute of Water Resources and Hydropower Research, Beijing 100048, China
2
Department of Irrigation and Drainage, China Institute of Water Resources and Hydropower Research, Beijing 100048, China
3
Institute of Environment and Sustainable Development in Agriculture, Chinese Academy of Agricultural Sciences, Beijing 100081, China
*
Author to whom correspondence should be addressed.
Submission received: 2 April 2022 / Revised: 13 May 2022 / Accepted: 16 May 2022 / Published: 18 May 2022
(This article belongs to the Special Issue Water-Saving Irrigation Technology and Strategies for Crop Production)

Abstract

:
In order to clarify the influences of drip irrigation under different mulch materials on crop yield, field experiments were carried out in the North China Plain for two seasons in 2020 and 2021. The changes in field microenvironment, photosynthetic capacity, leaf biological factors, and maize growth indexes were analyzed under drip irrigation with transparent film (W), black film (B), and straw mulching (S), with a nonmulching field as control (CK). The results showed that compared with CK, the yield of W and B increased by 7.2–9.9% and 7.1–12.4%, and the yield of S did not change significantly. The increase in yield was related to the improvement of the field microenvironment and photosynthetic capacity and higher LAI. Compared with CK, the soil water content 0–40 cm below the soil surface of W, B, and S increased by 13.6%, 9.1%, and 4.6%, respectively, and the 5 cm effective accumulated soil temperature of W and B increased by 7.9–10.2% and 4.1–4.7%, respectively. The maximum carboxylation rate (Vmax) of W, B, and S at the jointing stage was significantly increased by 3.5–17.3%, 12.7–17.6%, and 10.1–12.7% compared with CK. There was a significant linear correlation between Vmax and Nmass, and the correlation was affected by mulching treatments. At the jointing stage, compared with the CK, the LAI of W and B significantly increased by 8.6–66.5% and 7.2–56.0%, but there was no significant difference between S and CK. In conclusion, the increase in yield of W and B resulted from the combined effect of increasing LAI, Vmax, and soil water content and temperature.

1. Introduction

By 2050, food production needs to double to meet the growing demand for food [1]. Climate change intensifies soil drought and water shortage, which pose a great threat to crop yield [2,3]. In this context, the sustainable way to achieve food security is to improve crop yield and water use efficiency. The combination of agronomic measures, such as film or straw mulching, and efficient irrigation systems, such as drip irrigation, is conducive to reducing soil evaporation, improving water use efficiency, and achieving the purpose of saving water and increasing production [4,5,6].
The research results on crop growth and water use efficiency under different mulching and irrigation methods have been different. Transparent film, black film, and straw mulching are commonly applied in croplands to improve soil water conditions. Although each single one of the mulching methods has been reported applied in croplands, comparisons of transparent film, black film, and straw mulching effects on crops in one field have been relatively rare. Results from different studies may greatly vary because of the varied soil and air conditions of different research areas. First, the effects of transparent film and black film on crop growth and yield vary with the region and application conditions. Some researchers found that both transparent film and black film could improve yield, but the high temperature of transparent film would lead to tassel abortion of maize, which made the yield improvement effect of the transparent film not as good as that of the black film [7,8]. However, Xu, et al. [9] found that plants with black film grew higher and thinner than those with transparent film, resulting in lodging occurring at the booting stage under black film mulching with drip irrigation of spring maize in North China, which made the effect on yield improvement of the black film less apparent than that of the transparent film. Second, the impact of straw mulching on crop yield also varies with crop types and research areas. Some studies have shown that straw mulching increased soil moisture, reduced water consumption, and improved crop yield and water use efficiency [10]. In other studies, crop yield decreased because of the low soil temperature caused by straw mulching [11,12]. Therefore, the effects of black film, transparent film, and straw mulching on crop yield are inconsistent, and the influence mechanism remains unclear.
Soil water and temperature conditions influence the water status and physiological activity of crops [13]. After surface mulching, the changes in soil hydrothermal conditions cause changes in plant growth and leaf physiological factors, which affect the yield. The photosynthetic rate is positively correlated with temperature within an appropriate temperature range. When the temperature exceeds a certain threshold, the activities of key metabolic enzymes in leaves decrease, causing a decrease in the photosynthetic rate [14,15]. In addition, better physiological characteristics of maize leaves usually correspond to higher grain yield [16]. The improvement of photosynthetic parameters is crucial for improving crop yield and water use efficiency [17,18]. Leaf photosynthetic capacity is closely related to leaf biological factors. Photosynthetic capacity per leaf area is linearly correlated with leaf nitrogen (N) content per leaf area (Narea) and leaf N content per leaf mass (Nmass) [19,20,21]. Leaf N content determines the photosynthetic capacity of leaves, and research results can provide a reference for yield estimation [19,22]. Under drought stress, photosynthesis is restricted by stomata and the biochemical activities of photosynthetic enzymes [23,24]. The biochemical limitation of C3 plants is mainly reflected in the reduction in the maximum carboxylation rate of Rubisco enzyme (Vcmax) [23], while that of C4 plants is reflected in the maximum carboxylation rate of PEP carboxylase (Vpmax) and other remaining enzymes (including Rubisco enzyme, Vmax) [25]. It was found that Vcmax of rice was significantly correlated with Nmass and chlorophyll content expressed with SPAD readings, but not with leaf mass per area (LMA) [26]. There was a significant linear relationship between Nmass and Vmax of maize leaves [27]. However, it is still unclear whether field surface mulching affects leaf N content and photosynthetic capacity. Studies with physiological parameters of plants usually give descriptive results, but studies with quantified mathematical relationships are fewer. The leaf photosynthetic characteristic parameters of crops grown under different filed mulching should be quantified to uncover the internal causes of yield differences caused by mulching and irrigation modes. This has important scientific significance and practical value for understanding the photosynthetic physiological response of maize under different soil hydrothermal conditions.
In this study, summer maize in the North China Plain was selected, and three mulching methods were set up. Field measurements were carried out for two consecutive years, from 2020 to 2021. The field soil hydrothermal parameters, crop growth, yield, and leaf gas exchange parameters were determined to achieve the following three goals: (1) to examine the temporal and spatial variations in the field microenvironment, such as soil moisture, soil temperature, and leaf gas exchange parameters, under different treatments; (2) to determine the effects of different mulching treatments on crop growth, components of yield, and yield; (3) to explain the internal mechanisms of different mulching treatments affecting leaf photosynthetic capacity via the changed crop growth environment and consequently influencing crop growth and yield. We hypothesized that straw mulching, black film, and transparent film mulching affected plant growth and yield from mildly to severely because of the differences in their improvement effects on soil moisture and temperature.

2. Materials and Methods

2.1. Research Site and Experimental Design

The experiment was carried out in the field of the Agricultural Water Conservation Irrigation Experiment Station in the Daxing District of Beijing, China (39°39′ N, 116°15′ E). The local climate belongs to a typical semiarid continental monsoon climate, with an average annual rainfall of 540 mm. The soil texture of 0–00 cm soil layer in the experimental plot was loam with average field capacity and soil bulk density of 36.58% and 1.41 g/cm3, respectively. The field experiment was carried out from June to October every year from 2020 to 2021. The summer maize was sewn by machine, with wide row spacing of 80 cm, narrow row spacing of 40 cm, plant spacing of 20 cm, and planting density of 83,300 plants/ha. In 2020, the sowing and harvesting times were 30 June and 17 October, while those for 2021 were 26 June and 7 October.
The field was surface drip irrigated and treated with transparent film (W), black film (B), and straw (S) mulching compared with no mulching (CK) under drip irrigation. Three replicates of each treatment were set, with each area being 10.8 m × 4 m and arranged randomly. The film was polyethylene transparent film and black film with a thickness of 0.01 mm. All the straws of previous winter wheat were harvested and removed from the field. Part of the straw was crushed and covered over the driplines in the S plots. The coverage amount was 6000 kg ha−1. Straw mulching was covered evenly across the field, while 80 cm-width films was covered two lines of maize and the narrow rows, leaving the wide row bared. The transparent film, black film, and straw were covered on the drip irrigation belt. The driplines were laid in the middle of narrow rows with a ’one dripline, two rows‘ layout mode.
Rain-fed and supplemental drip irrigations were applied as needed to remove the water stress of the crops. In 2020, because of the rainfall after sowing, the seedling water was not irrigated. It was irrigated three times, 5 mm every time, during topdressing. In 2021, there were three times of irrigation. The first time was 50 mm of seedling water, and the last two times were 5 mm each time of topdressing irrigation. The total rainfall in 2020 and 2021 was 309.63 mm and 341.88 mm, respectively. Rainstorms are usually heavy and frequently happen in the summer maize sowing season in the research area, leading to fertilizer leaching. In such cases, no base fertilizer but only topdressing was used. During the growth period of maize, the application rates of nitrogen, phosphorus (P2O5), and potassium (K2O) were 240, 135, and 135 kg/ha, respectively. The specific water and fertilizer schedules are shown in Table 1.

2.2. Soil Water Content and Soil Temperature

The soil water content and temperature were monitored by EM50 soil moisture and temperature sensors and data collectors (Decagon devices Inc., Pullman, WA, USA) and collected every 30 min. Three depths of 5 cm, 15 cm, and 30 cm below the soil surface were selected at which to install the 5TM sensors for the two years. The sensor measurements were carried out two repetitions in each treatment. Data of one system were collected by a datalogger automatically as previously described, and those of the other system were collected manually with a precheck device (Decagon devices Inc., Pullman, WA, USA) at 18:00 every two days. The soil water content of the profile was also measured by the oven-drying method. The soil sampling depths were 5 cm, 15 cm, and 30 cm. The soil sampling times were during the growth stage to cover the different soil water content ranges. The times were 19 July, 18 August, 4 September, and 9 October in 2020 and 7 July, 11 September, and 8 October in 2021. By fitting the soil water contents from the oven-drying method and those from the sensors on the same day, the soil water content of the probe was corrected.
The effective accumulated temperature of soil is referred to the method of Zhang et al. [28]. The lower limit temperature (biological zero) for the growth and development of summer maize in North China is 10 °C, and the effective accumulated temperature is the sum of the daily average ground temperature exceeding biological zero during the growth period of maize.

2.3. Air Temperature and Relative Humidity

The air temperature and relative humidity between rows were monitored by automatic-datalogging sensor (Hobo Pro V2, ONSET, Bourne, MA, USA), which was installed 20 cm away from the ground surface for all treatments. The data acquisition interval was once every 30 min.

2.4. Photosynthetic Physiological Parameters

At the jointing, filling, and maturity stages, three sun leaves were randomly selected from each plot. The response of the net rate of photosynthetic CO2 assimilation (A, μmol m−2 s−1) versus the intercellular CO2 concentrations (A-Ci) was measured by a portable photosynthetic system (Li- 6800, LiCor Inc., Lincoln, NE, USA). The temperature and humidity of the leaf chamber were set to 26 °C and 60%, and the light intensity was set to 2100 μmol m−2s−1. Measurements were taken at CO2 concentrations of 400, 300, 200, 150, 100, 80, 40, 400, 400, 600, 800, 1000, and 1200 μmol mol−1. According to Von Caemmerer [25], the A to Ci relationship at a Ci < 50 μmol mol−1 was used to solve the maximum carboxylation capacity of phosphoenolpyruvate carboxylase (Vpmax, μmol m−2 s−1), and the CO2 saturated photosynthetic capacity (Vmax, μmol m−2 s−1) was the horizontal asymptote of the A/Ci curve. Next, the relative value of chlorophyll was measured by a SPAD instrument, and the measurement position was consistent with that of photosynthesis. Five points were selected in the middle of the leaf for reading. Then, avoiding the main vein, ten holes were punched in the leaf with a 20 mm diameter punch, and the leaves were weighed, and the leaf mass per area (LMA) measured, after drying. The main veins, tip, and base of the remaining leaves were removed from the middle part of the leaves. After drying and grinding, the leaves were digested with sulfuric acid, and the N content per leaf mass (Nmass) was determined with an automatic Kjeldahl apparatus (Kjeltec 8400; FOSS, Denmark).

2.5. Leaf Area Index and Yield

Leaf area index (LAI) was measured three to four times during the growing season. The length and width in the widest part of each leaf were measured using a tape with a precision of 1 cm, while the leaf area was obtained by multiplying the empirical coefficient of 0.74. LAI was calculated as the sampled leaf area divided by the product of the plant spacing (20 cm) and sampled length (60 cm). At the harvest, four subplots with areas of 3 m × 1.2 m were selected from each plot, and the ear length (cm), ear diameter (mm), kernels per ear (ear−1), and the hundred grain mass (g) were determined and converted to yield of the plot (Y, t/ha).

2.6. Statistical Analysis

The soil water content and soil temperature among CK, W, B, and S treatments were compared via a paired sample T test in SPSS (v13.0, IBM SPSS Statistics, Chicago, IL, USA). The mean differences in Vmax, Vpmax, LMA, Nmass, SPAD, and yield among different treatments were determined by one-way ANOVA. The data of Vmax, Vpmax, LMA, Nmass, and SPAD in two years were analyzed using Origin 2021 and tested by the general linear model. If there was a significant difference in the slope and intercept of the regression line among Vmax, Vpmax, and Nmass, four lines were fitted: CK, W, B, and S; otherwise, a single line was fitted for all treatments. All figures were drawn using SigmaPlot (v13.0, Systat Software Inc., San Jose, CA, USA).

3. Results

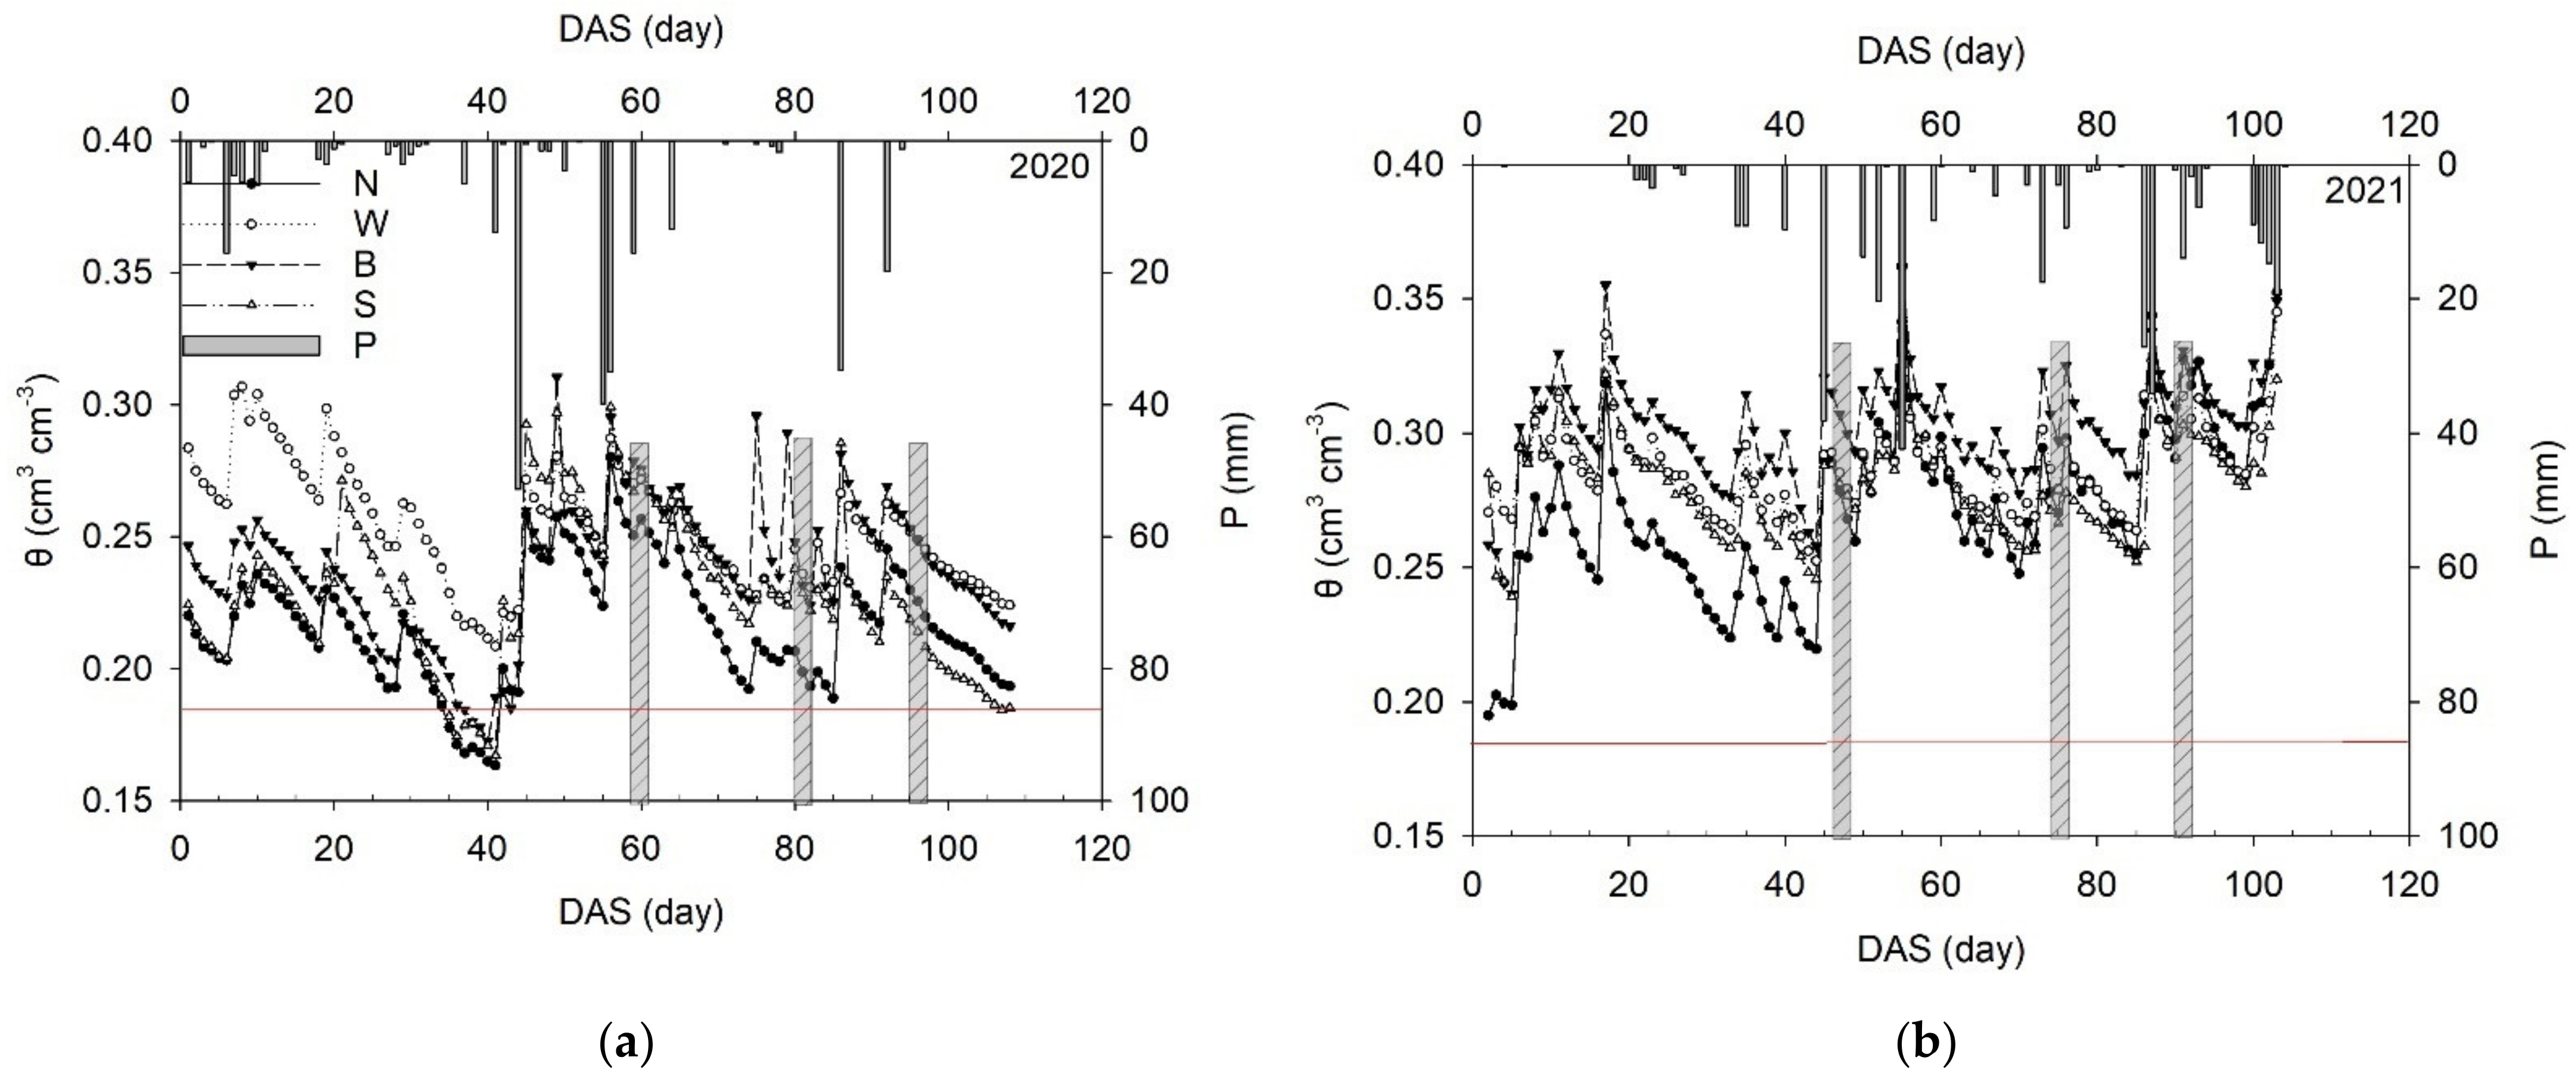
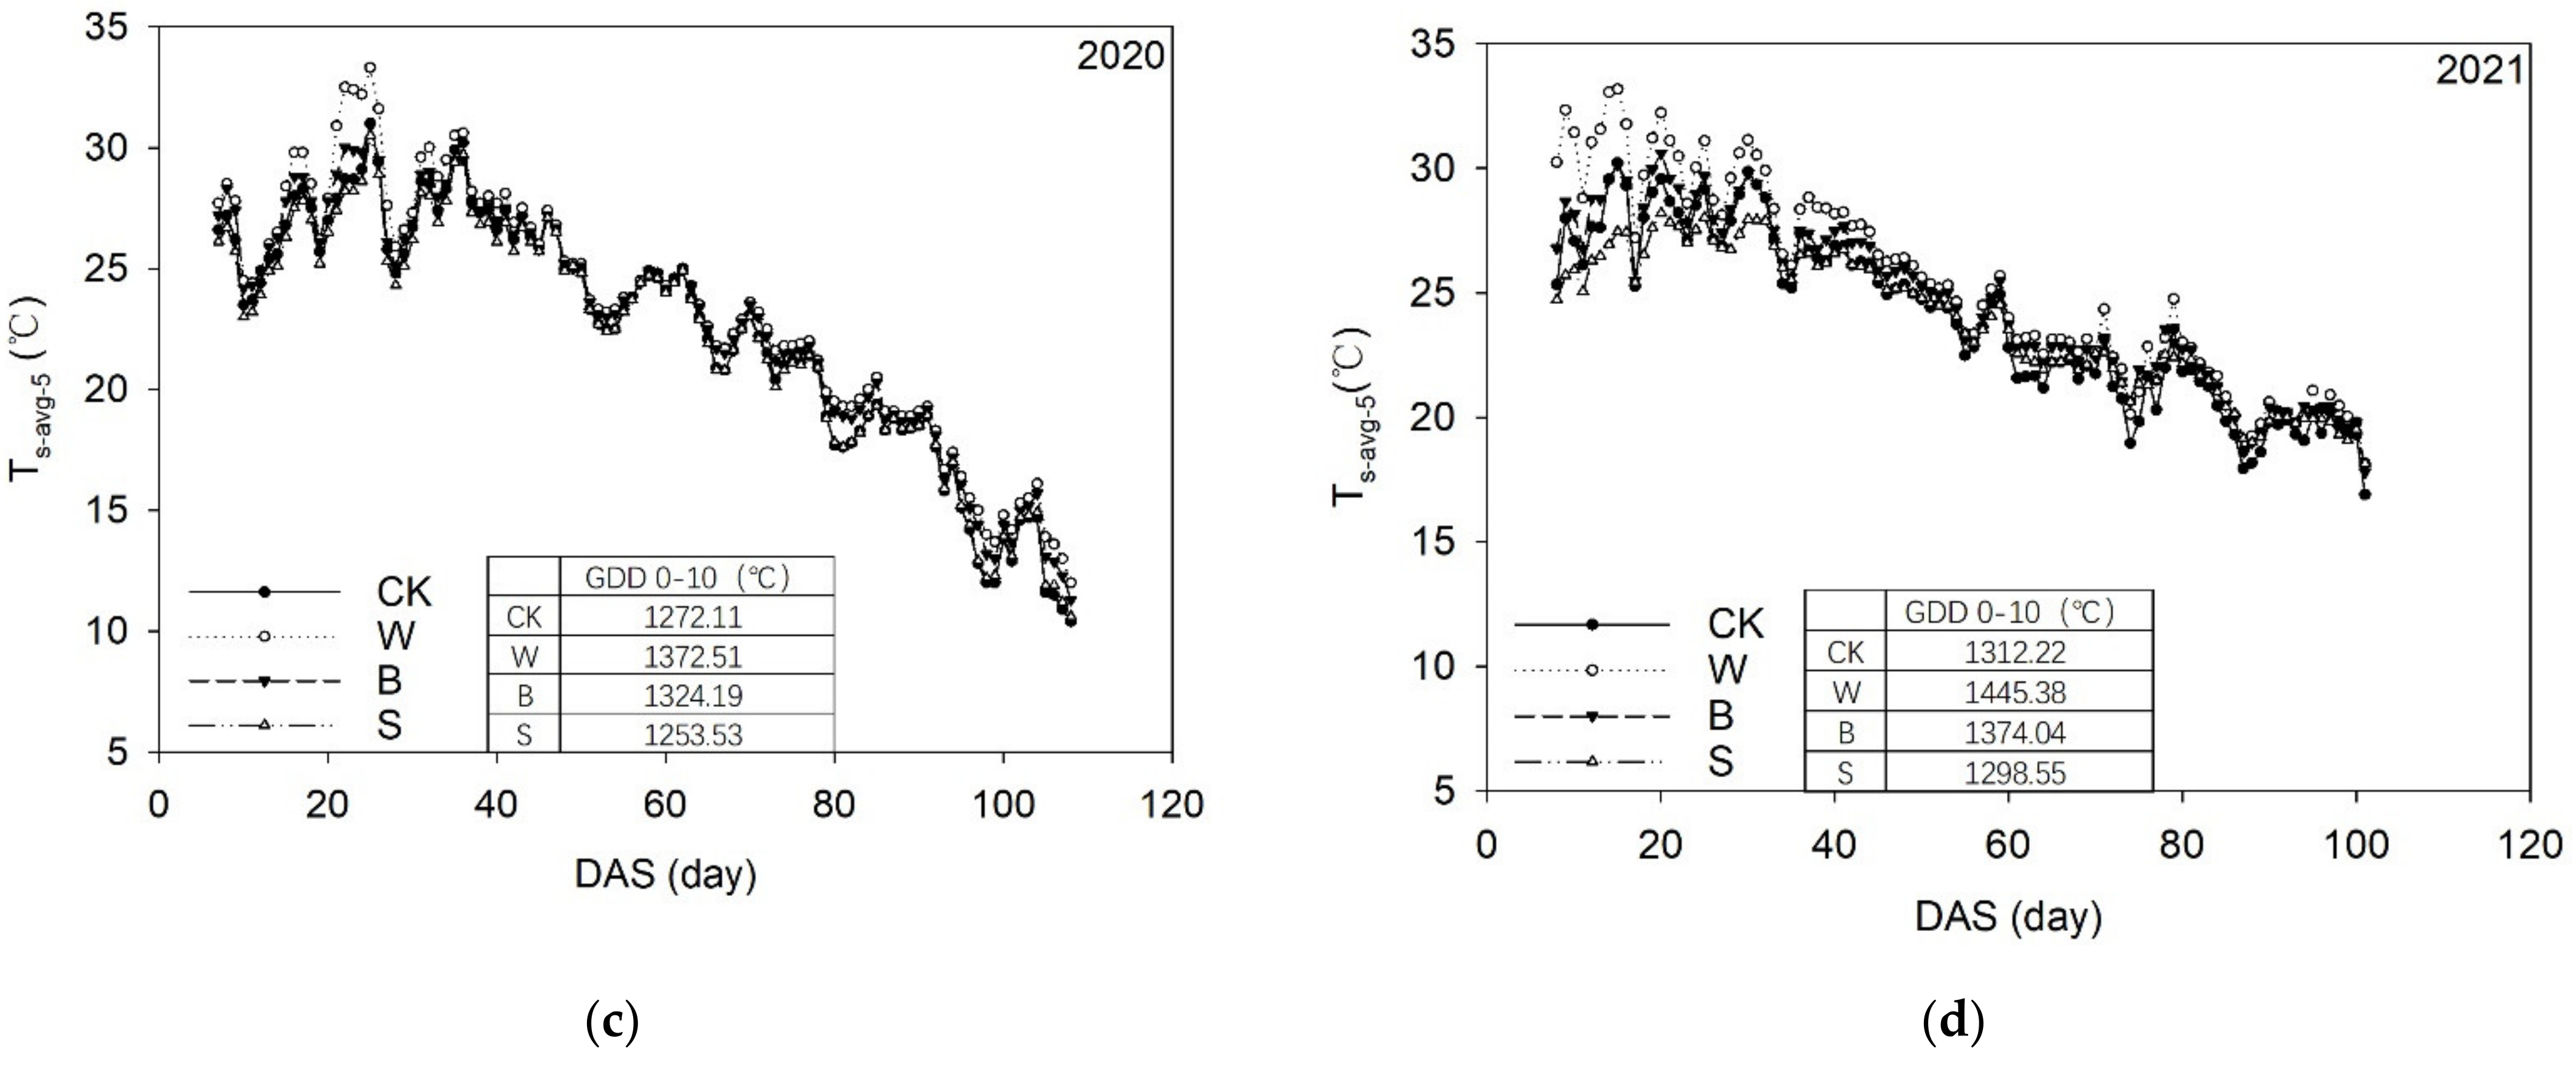
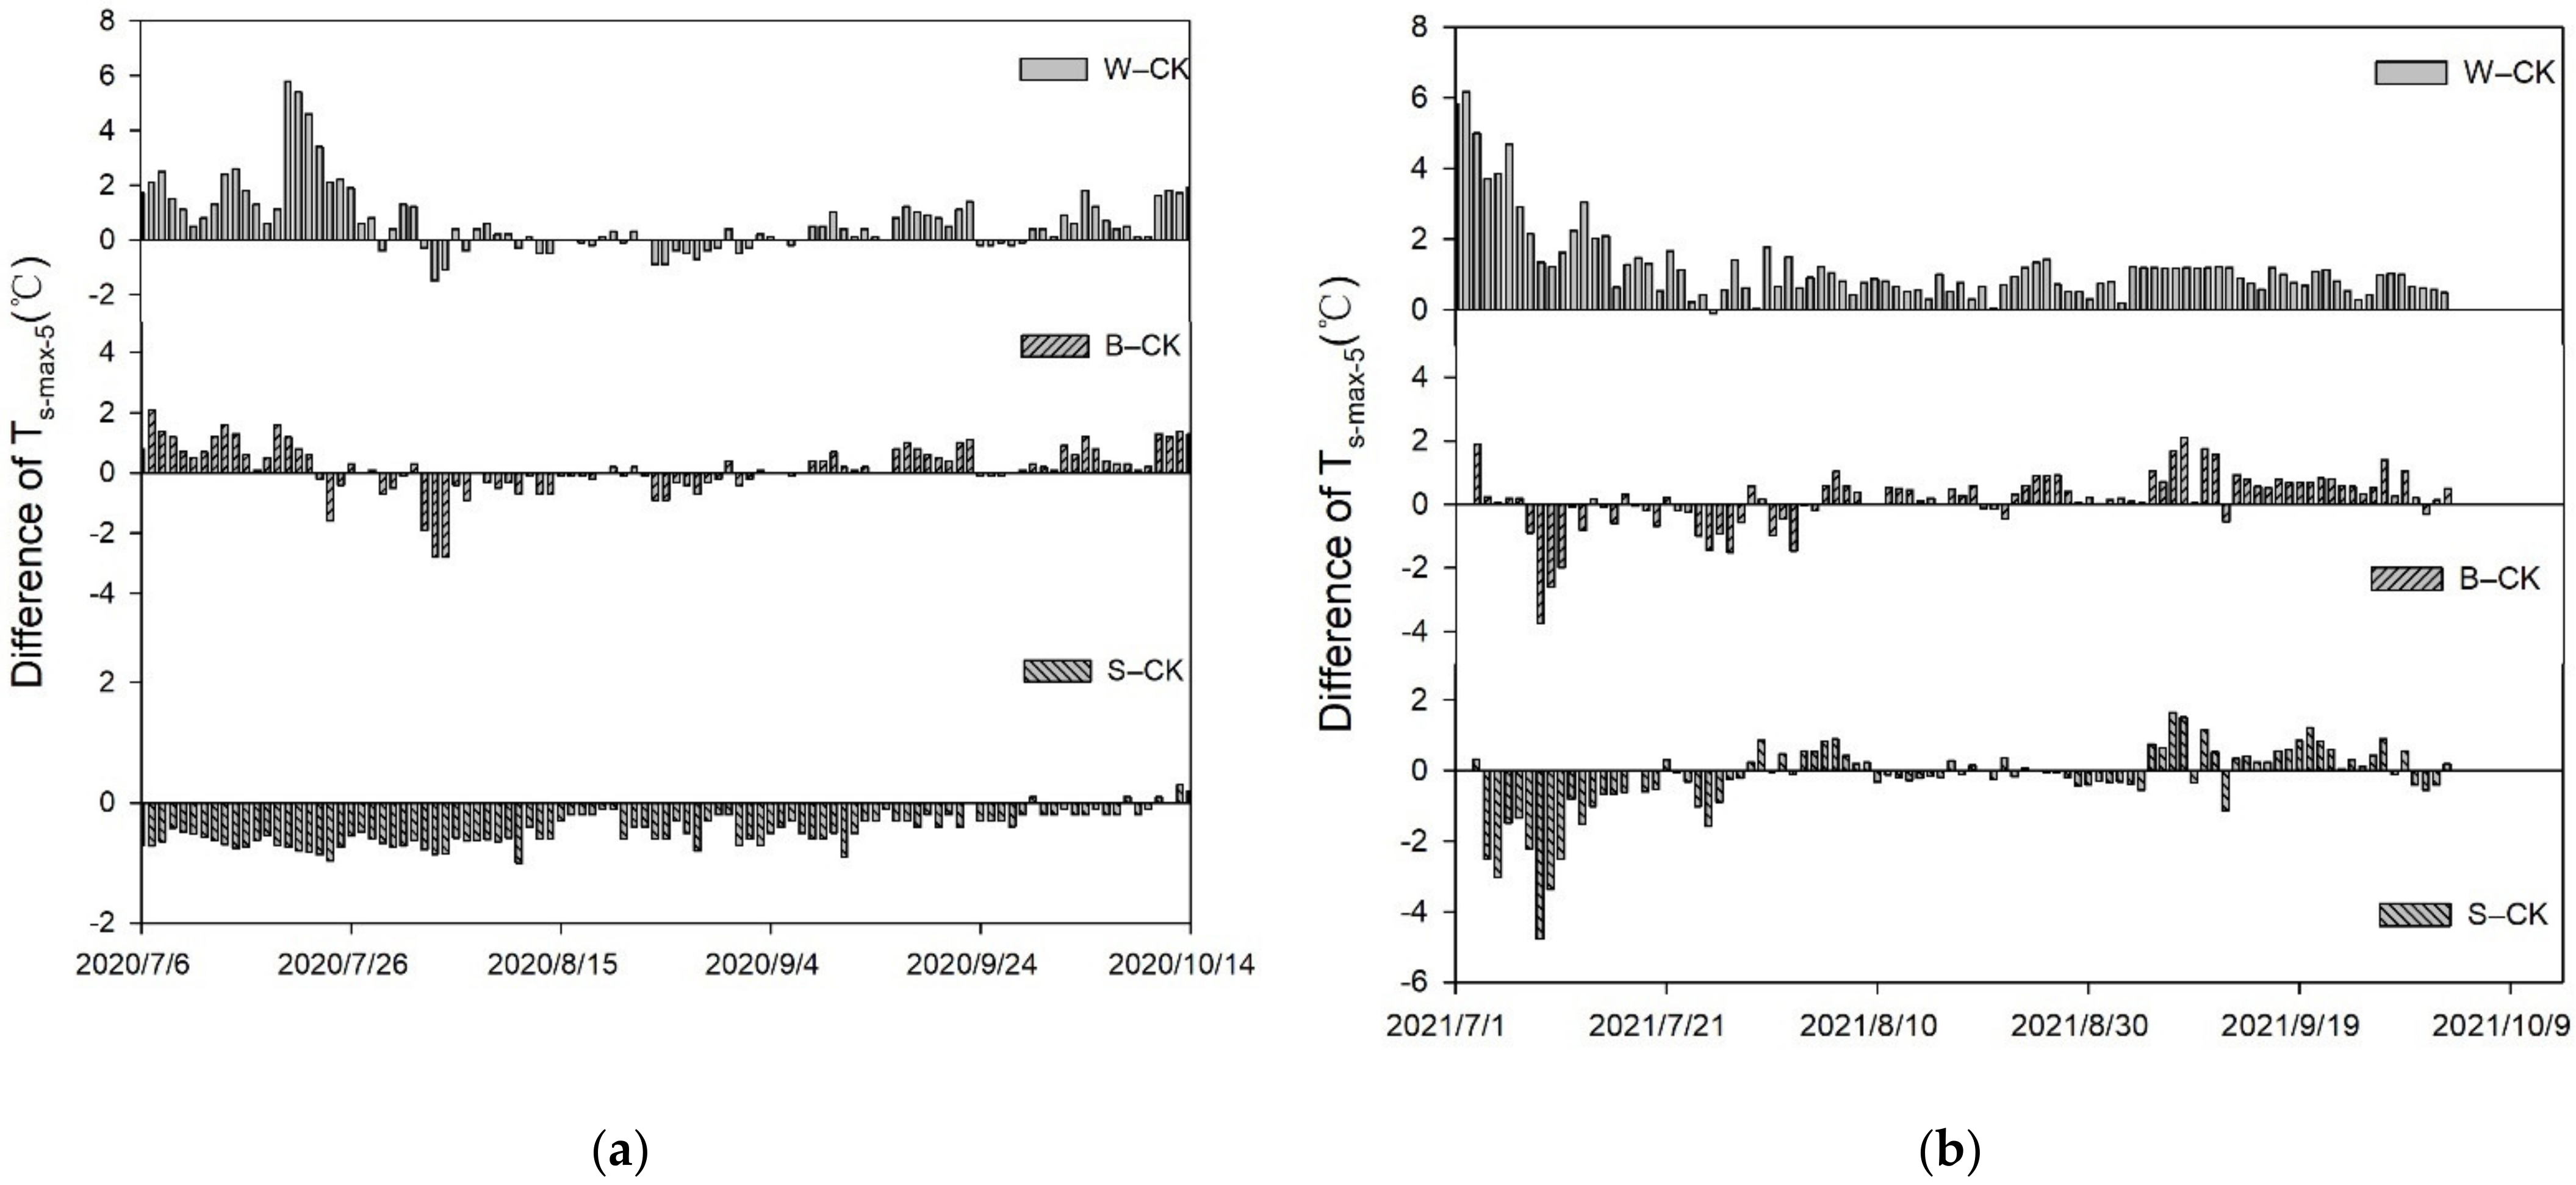
3.1. Field Microenvironment

The average value of 0–40 cm soil water content (θ) in the growing season of the three mulching treatments in 2020 was 0.23–0.25 cm3 cm3 (Figure 1). Compared with CK, the θ of W, B, and S increased significantly by 13.6%, 9.1%, and 4.6% (p < 0.001), respectively. In 2021, the θ varied from 0.28 to 0.30 cm3 cm−3 among all the treatments. Compared with CK, θ of W, B, and S increased significantly by 7.4%, 11.1%, and 3.7% (p < 0.001), respectively. In 2020, there were seven days with θ below 60% field capacity (60% FC) in both CK and S treatments during the whole growing season. B and W treatments reduced the days with θ below 60% FC to four and zero days, respectively.
After the emergence of seedlings in 2020, the averaged soil temperatures at the depth of 5 cm below ground (Ts-avg-5) of CK, W, B, and S were 22.5 °C, 23.5 °C, 23.0 °C, and 22.3 °C, respectively (Figure 1). The 5 cm soil effective accumulated temperature (GDD5) of W and B were 7.9% and 4.1% higher than that of CK, respectively, and that of S was 1.5% lower than that of CK. The results of soil temperature in 2021 were similar to those in 2020. The GDD5 of W and B increased by 10.2% and 4.7%, respectively, and S decreased by 1.0%.
Figure 2 shows the seasonal dynamics of the differences in the daily maximum soil temperature at 5 cm below ground (Ts-max-5) between the three mulching treatments and CK. During the growth period, even with several exceptions in 2020, during which the Ts-max-5 difference between W and CK was negative because of the rainy weather or irrigation, W significantly increased the Ts-max-5 (p < 0.001), and S significantly reduced the Ts-max-5 (p < 0.001), for two years. The Ts-max-5 of B increased significantly in 2020 (p < 0.001), but it did not increase significantly in 2021 (Figure 2). W and B significantly increased Ts-avg-5 and minimum value of soil temperature at 5 cm below ground (Ts-min-5, p < 0.001). The Ts-avg-5 of S increased significantly in 2020 (p < 0.001), but it did not increase significantly in 2021, and S significantly increased the Ts-min-5 (p < 0.001) for two years (Figure S1).
The daily changes in air temperature and relative humidity at 20 cm on the surface showed the opposite trend. There was no significant difference in air temperature and relative humidity among all treatments (Figure S2).

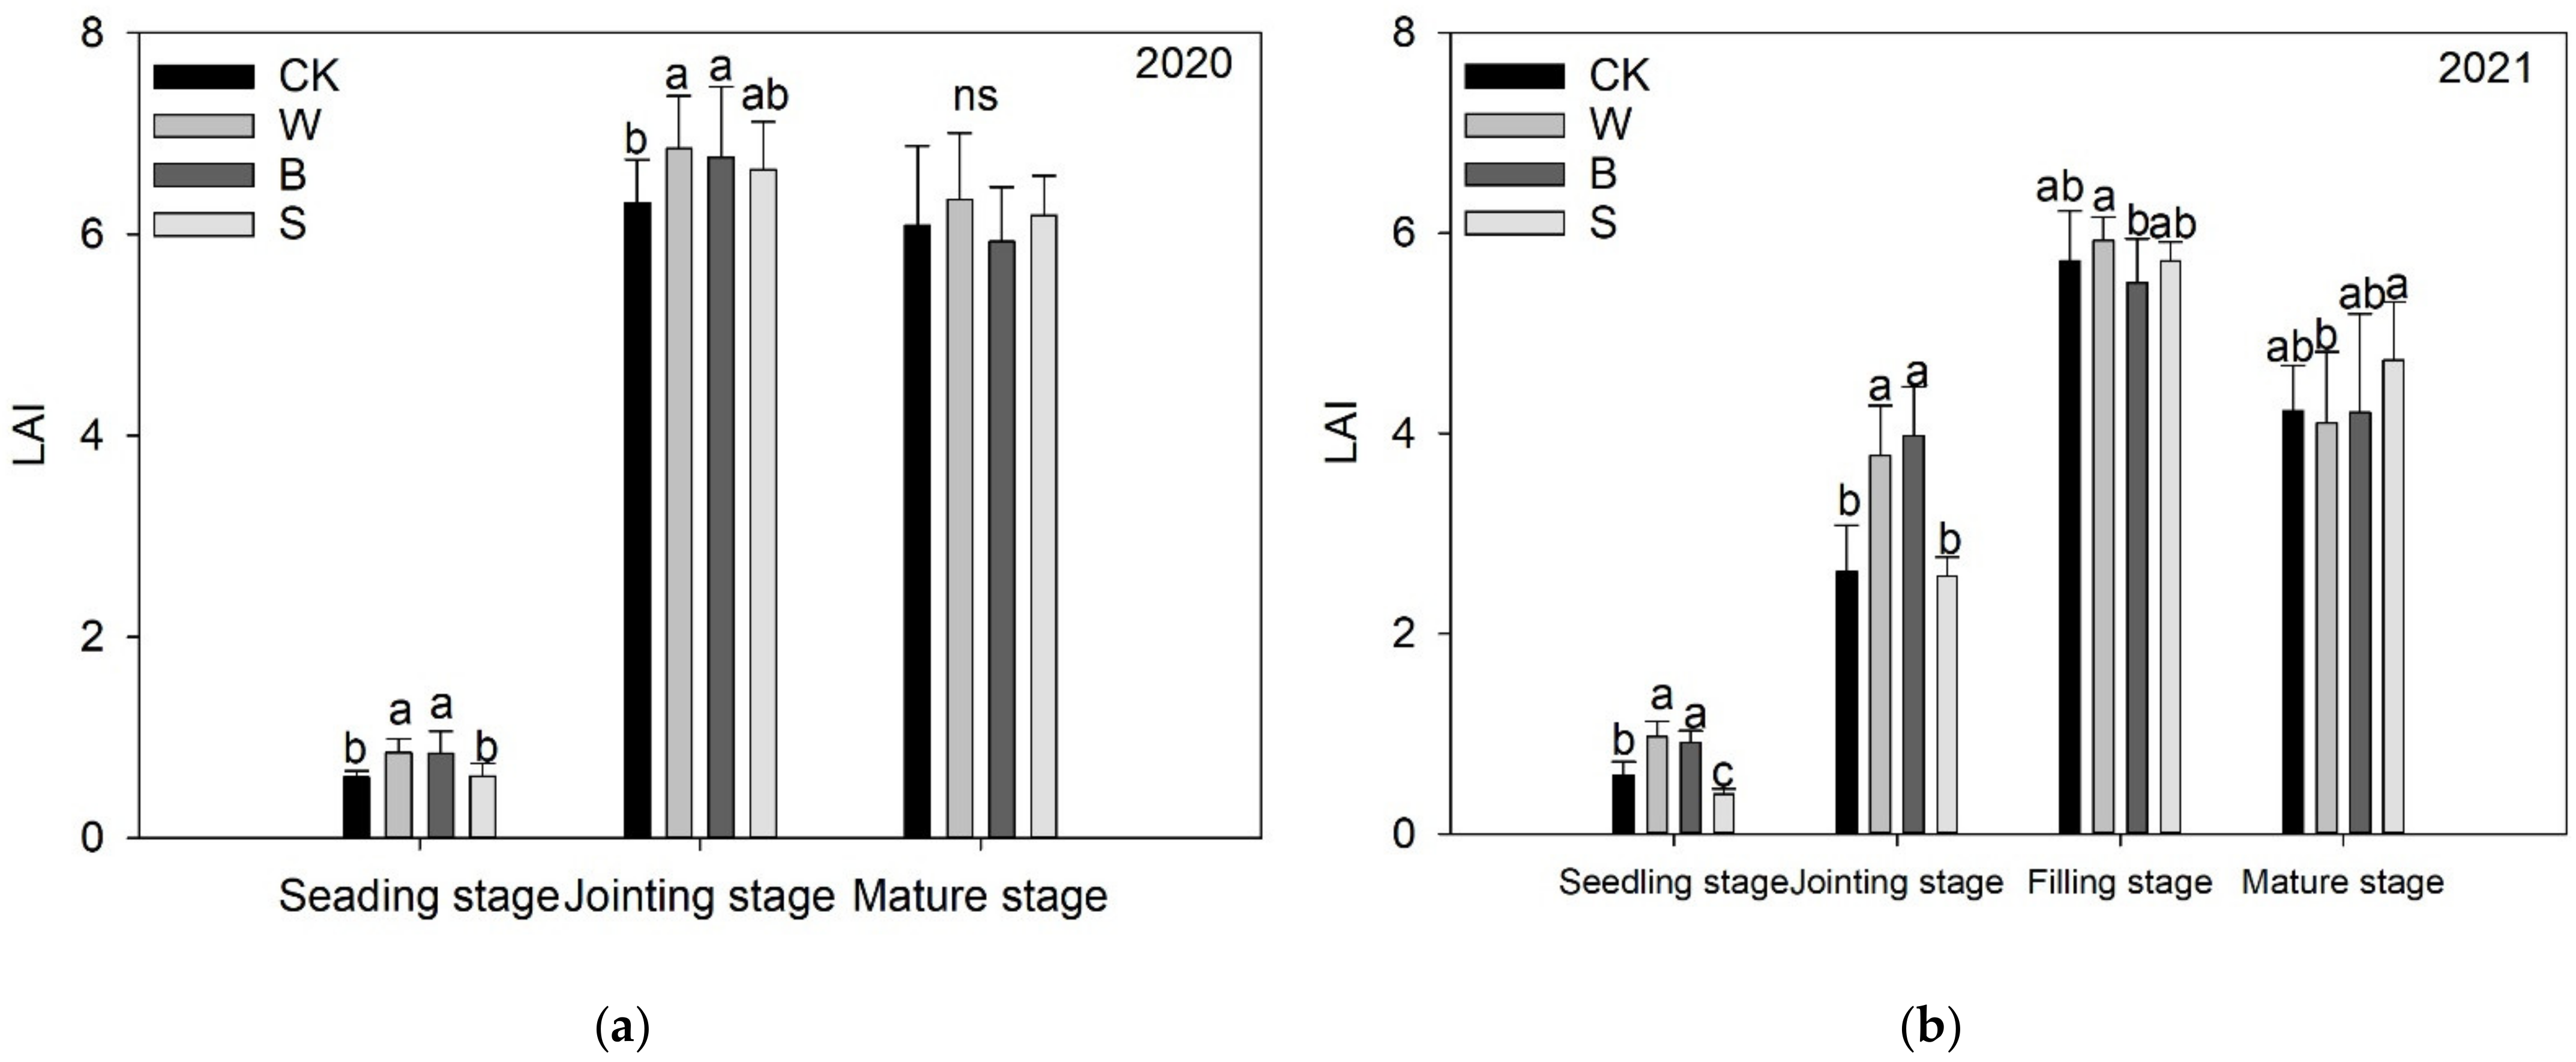
3.2. Leaf Area Index

The effect of mulching on LAI occurred mainly before the jointing stage (Figure 3). Compared with CK, the LAI of W and B increased significantly by 8.6–40.5% and 7.2–38.7% (p < 0.001), respectively, during the seedling and jointing stages in 2020, but there was no significant difference between S and CK during the same stages (p > 0.1). There was no significant difference in the LAI among W, B, S, and CK after the jointing stage (p > 0.1). The changes in 2021 were similar to those in 2020. During the seedling and jointing stages, the LAI of W and B increased significantly by 44.3–66.5% and 51.9–56.0% (p < 0.001), respectively, but there was no significant difference among treatments (p > 0.1) after the jointing stage.

3.3. Yield and Water Use Efficiency

Compared with CK, the kernels per ear of W and B treatments increased by 4.2–12.5% and 5.0–8.5%; the hundred kernel mass of W and B treatment increased by 2.3–2.8% and 1.9–3.9%; and the yield of W and B increased significantly by 7.2–9.9% and 7.1–12.4%, respectively. Compared with W and B, the hundred kernel mass of S decreased by 5.1–8.4% and 6.8–8.3%, respectively. No significant difference was observed between the yield of S and CK (Table 2).
Principal component analysis of yield components in 2020 and 2021 showed that the first two principal components in 2020 explained 80% of the total variation (Figure 4). PC1 explained 58.9% of the total variation and positively correlated with yield, kernels per ear, and ear diameter. In addition, PC2 explained 21.1% of the total variation. PC2 had a positive correlation with hundred kernel mass and a negative correlation with kernels per ear. In 2021, the first two principal components explained 79.9% of the total variation. PC1 explained 63.7% of the total variation and showed a positive correlation with yield, kernels per ear, ear diameter, and hundred kernel mass. PC2 explained 16.2% of the total variation and was positively correlated with ear length. The results showed that kernels per ear and ear diameter had important effects on maize yield.

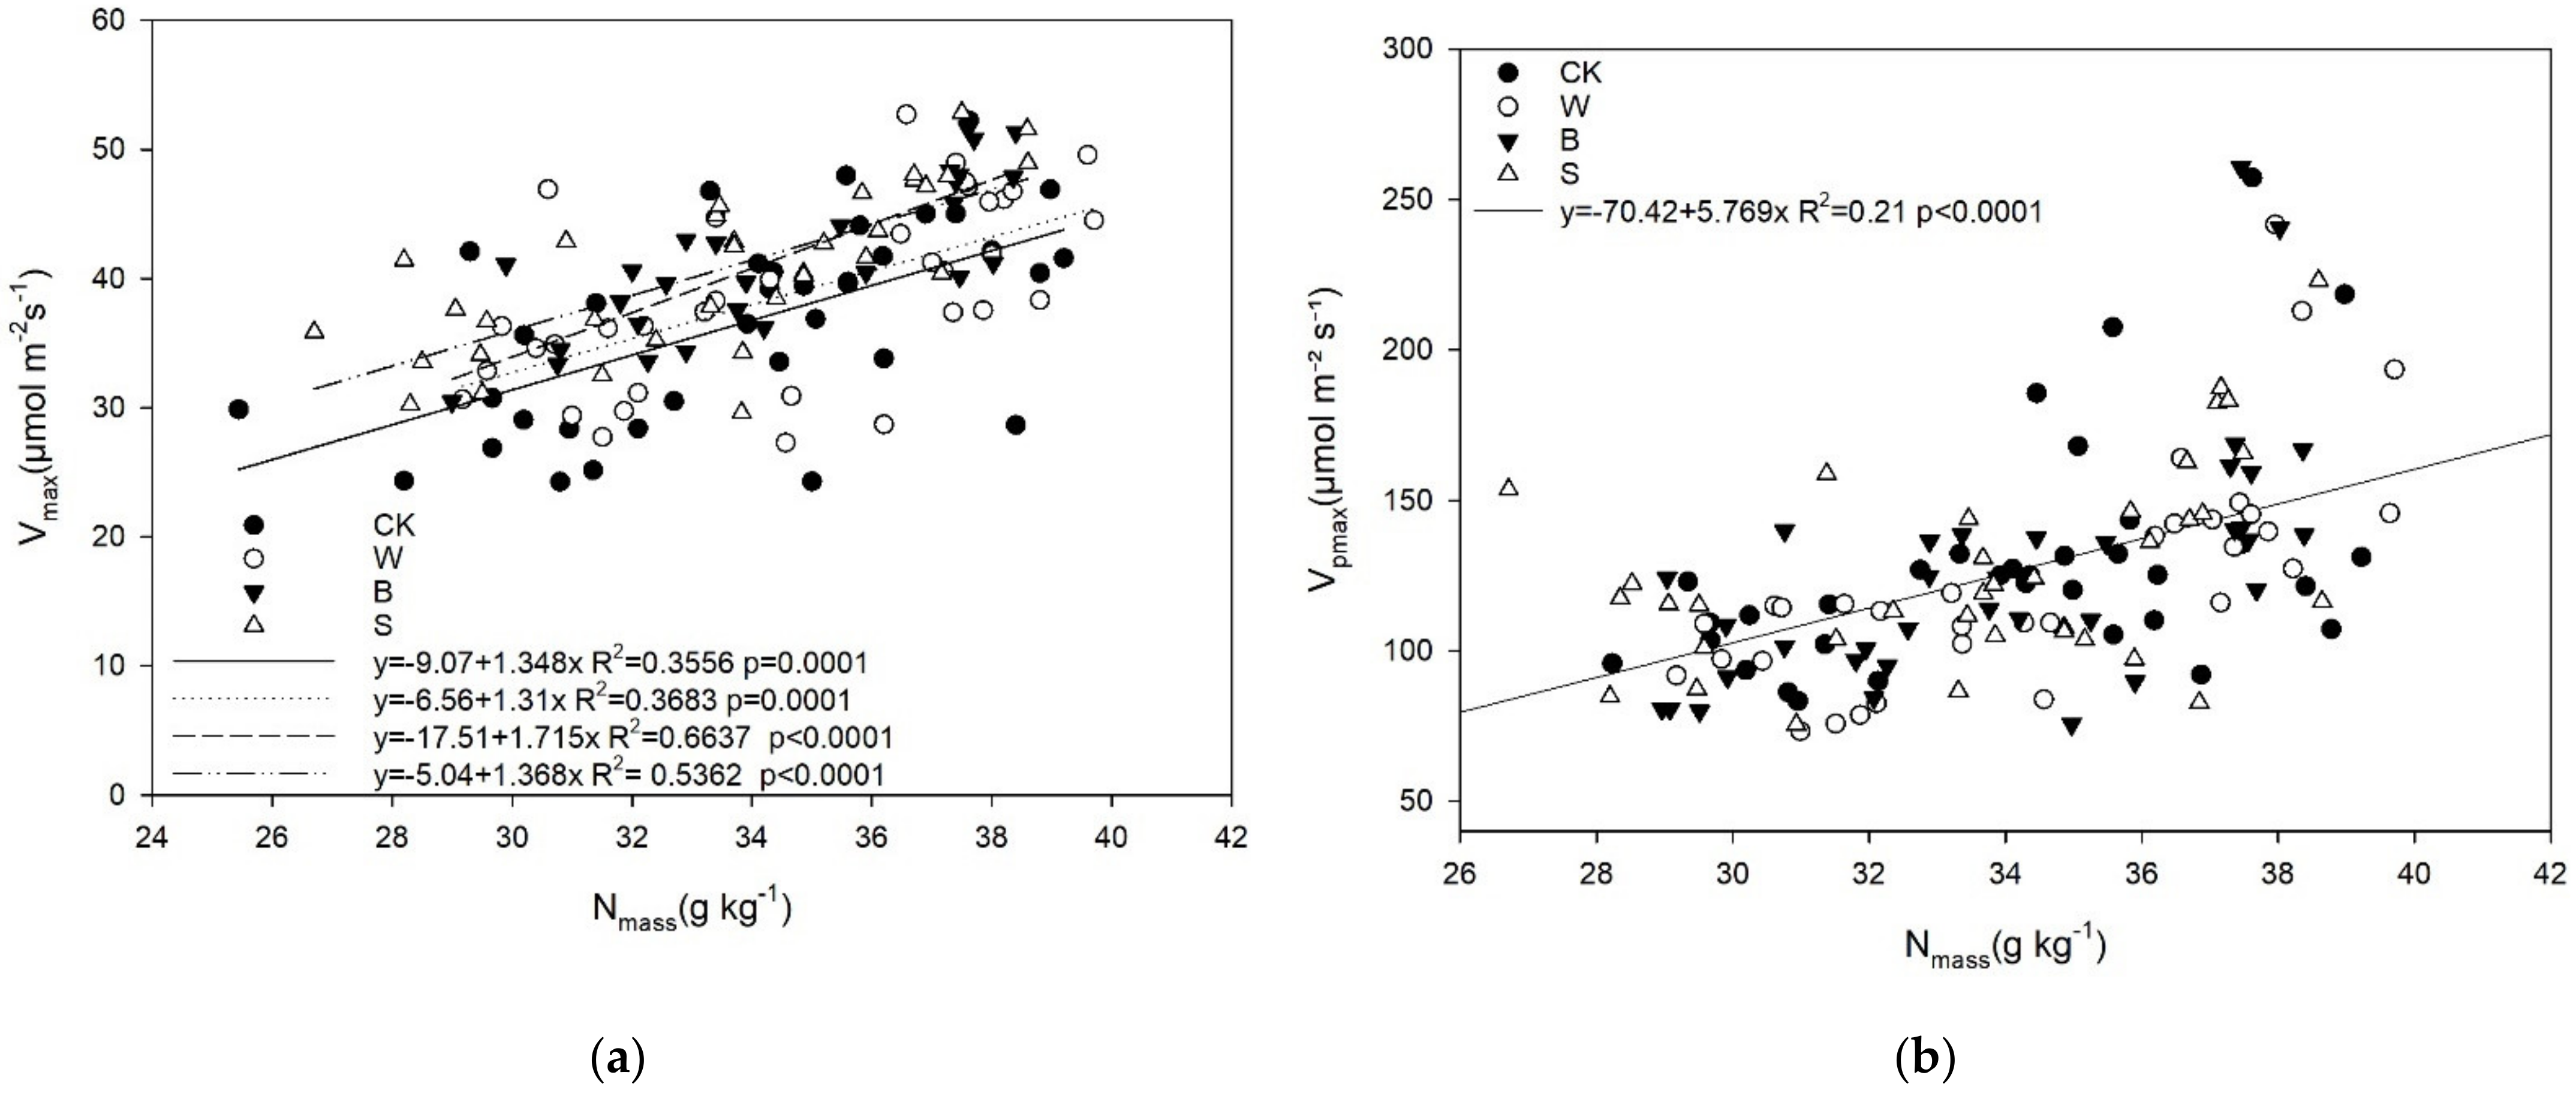
3.4. Photosynthetic Capacity

In 2020 and 2021, the Vmax was highest at the jointing stage and then gradually decreased (Table 3). At the jointing stage in 2020, the Vmax of W, B, and S was significantly higher than that of CK by 3.5%, 17.6%, and 10.1% (p = 0.005), respectively. In 2021, compared with CK, the Vmax of W, B, and S treatments significantly increased by 17.3%, 12.7%, and 12.7%, respectively, at the jointing stage (p = 0.066), and W and S significantly increased by 12.9% and 18.6%, respectively, at the maturity stage (p = 0.033). No significant difference in Vmax among treatments was found in other measurement periods. There was no significant difference in Vpmax among the jointing, filling, and mature stages in 2020 and 2021 (p > 0.1).

3.5. Biological Factors of Leaves

The characteristics of biological factors of leaves affect the photosynthesis and yield formation of maize. Table 4 showed the LMA, Nmass, and SPAD of all treatments at different growth stages. In 2021, at the jointing stage, W and S significantly increased LMA by 9.7% and 5.1% (p = 0.02), respectively, compared with CK. At the mature stage, the LMA of S was significantly higher than CK.
The Nmass was the highest at the jointing stage and gradually decreased with the advancement of the growth stage. In 2020, the Nmass of W was the highest in the whole growth period, and the Nmass of W at the jointing stage was significantly higher than that of S by 4.4% (p = 0.09). There was no significant difference in Nmass among other treatments. In 2021, the Nmass of W was significantly higher than that of B and S by 5.6% and 5.0% (p = 0.08), respectively, but no significant difference was found bet3ween the three treatments and CK.
SPAD did not show evident seasonal trends in the two seasons, and the SPAD of W was the highest. Compared with CK, the SPAD of W at the mature stage in 2020 increased significantly by 6.5% (p = 0.02), and the SPAD of the W and S at the mature stage in 2021 both increased significantly by 7.7% (p = 0.09). No significant difference in SPAD was found among treatments in other determination periods.
Vmax was significantly correlated with Vpmax, Nmass, SPAD (Figure 5). In 2020, the correlation coefficients between Vmax and Vpmax, LMA, Nmass, SPAD were 0.53 (p < 0.001), −0.47 (p < 0.001), 0.63 (p < 0.001), and 0.46 (p = 0.001), respectively; in 2021, the correlation coefficients between Vmax and Vpmax, LMA, Nmass, and SPAD were 0.75 (p < 0.001), −0.23 (p = 0.07), 0.65 (p < 0.001), and 0.42 (p < 0.001), respectively.
The correlations between Vpmax and LMA, Nmass, and SPAD were significant. In 2020, the correlation coefficients between Vpmax and LMA, Nmass, and SPAD were −0.33 (p = 0.005), 0.37 (p = 0.002), and 0.29 (p = 0.056), respectively. In 2021, the correlation coefficients between Vpmax and LMA, Nmass, and SPAD were −0.40 (p = 0.001), 0.62 (p < 0.001), and 0.23 (p = 0.063), respectively.
The linear regressions between Vmax, Vpmax, and Nmass were further analyzed. A significant linear correlation between Vmax and Nmass was found, and the correlation among the treatments was affected by mulching. The intercept of the regression equation of W, B, and S was significantly higher than that of CK (Figure 6a, p < 0.001). There was a significant linear correlation between Vpmax and Nmass, but no significant treatment effects on the regressions (Figure 6b, p > 0.1).

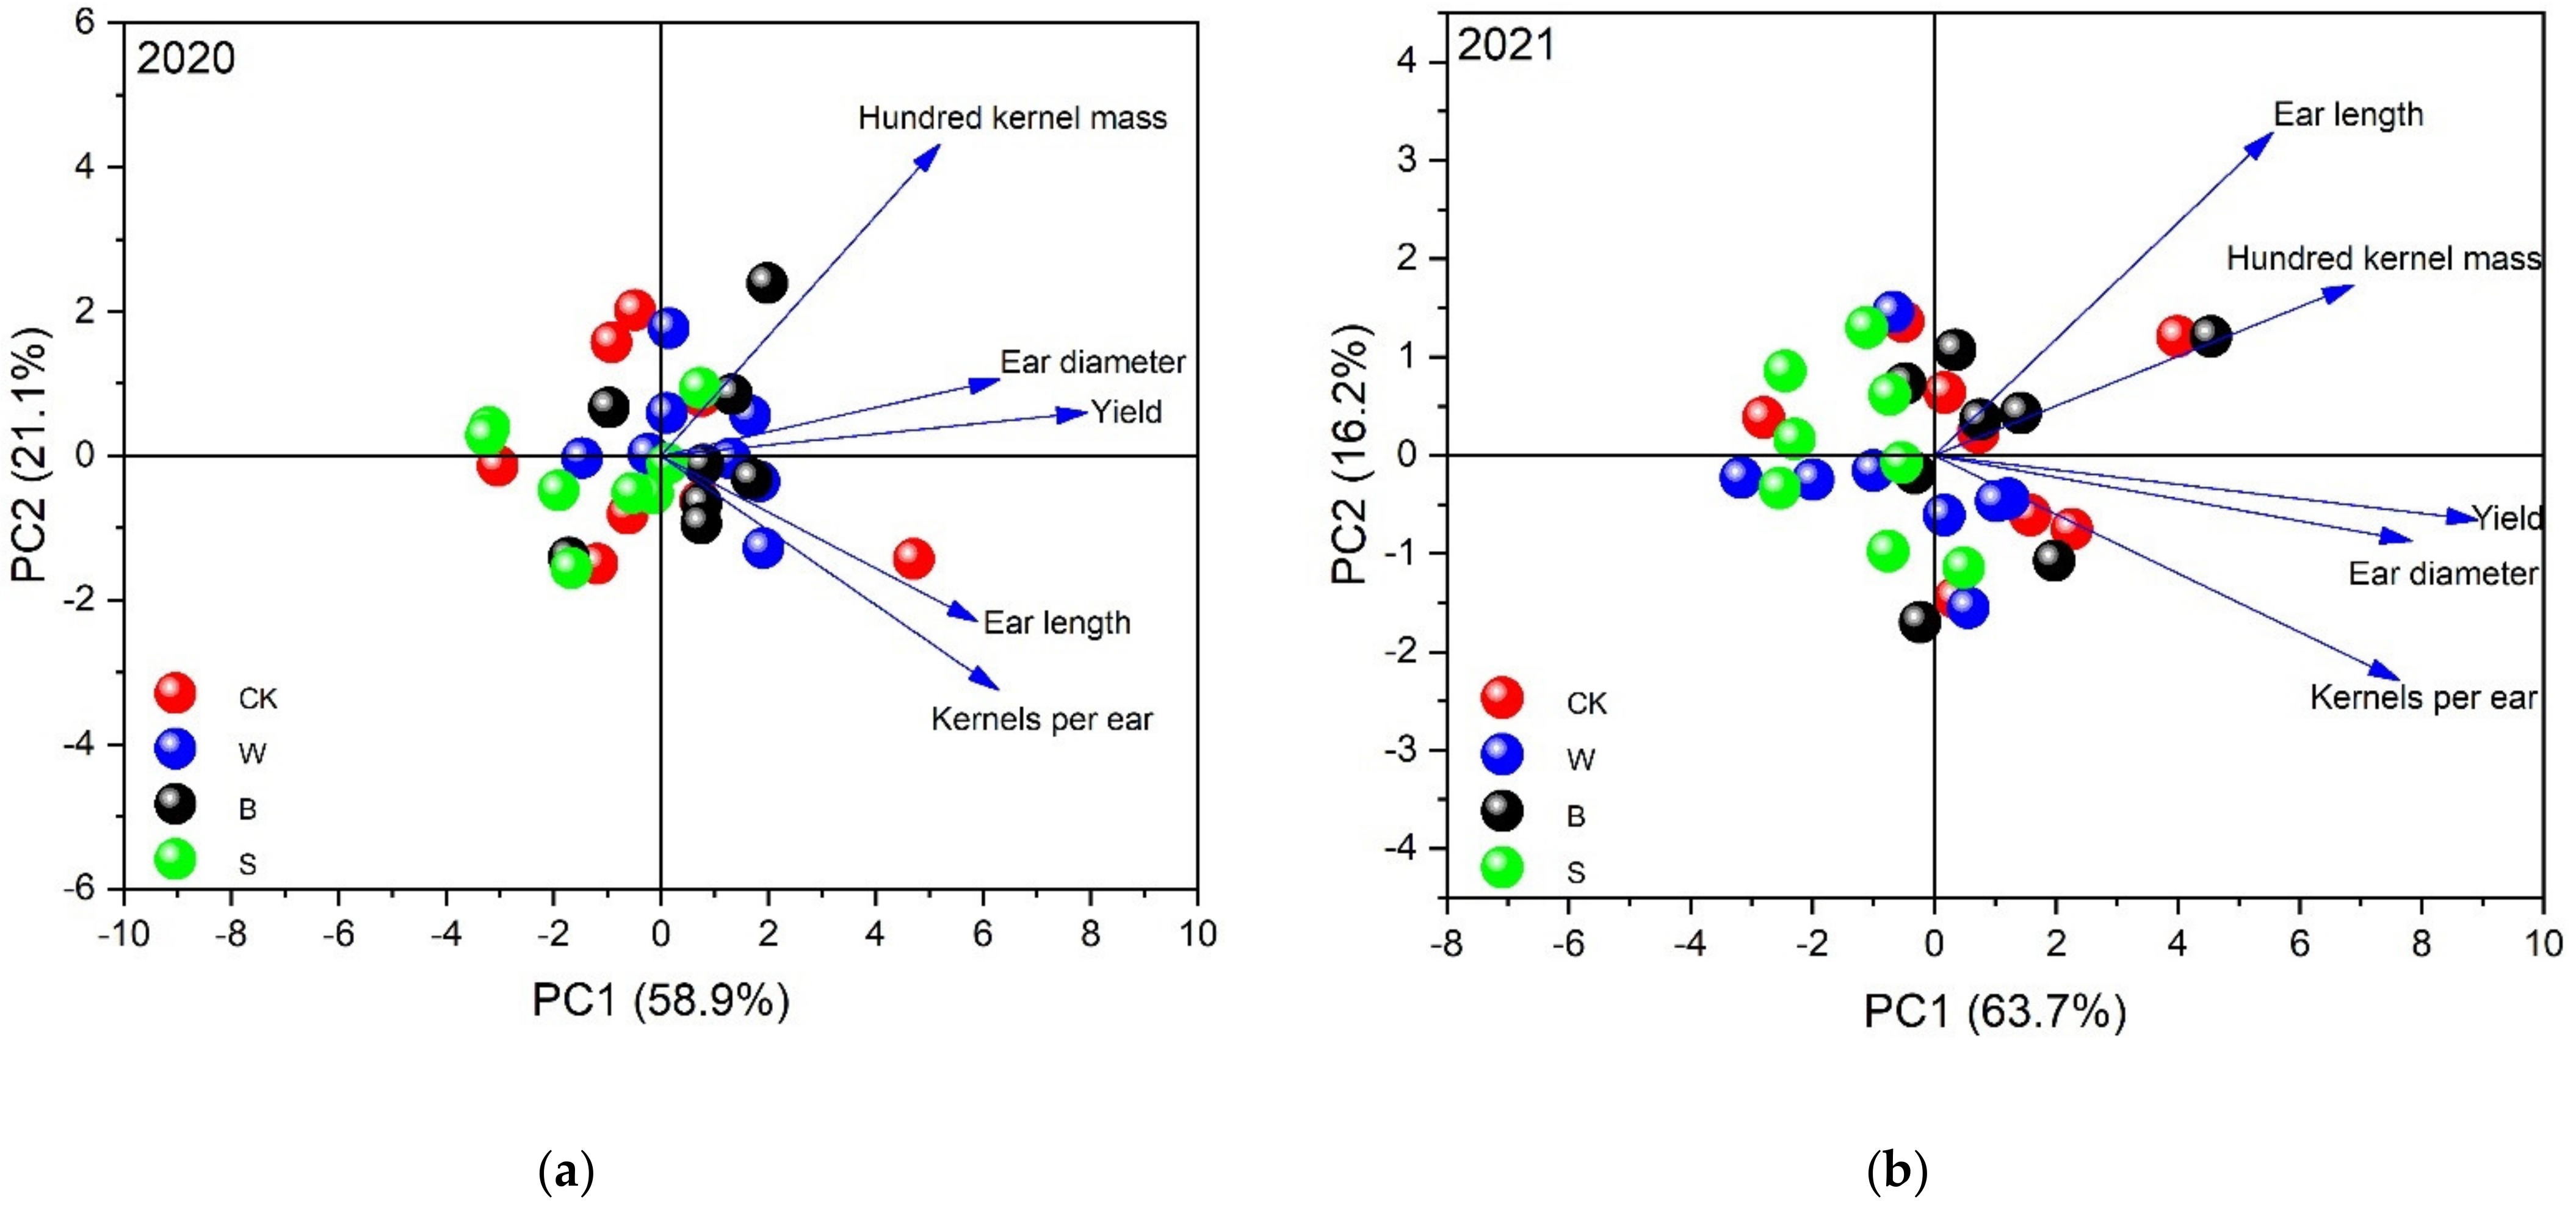
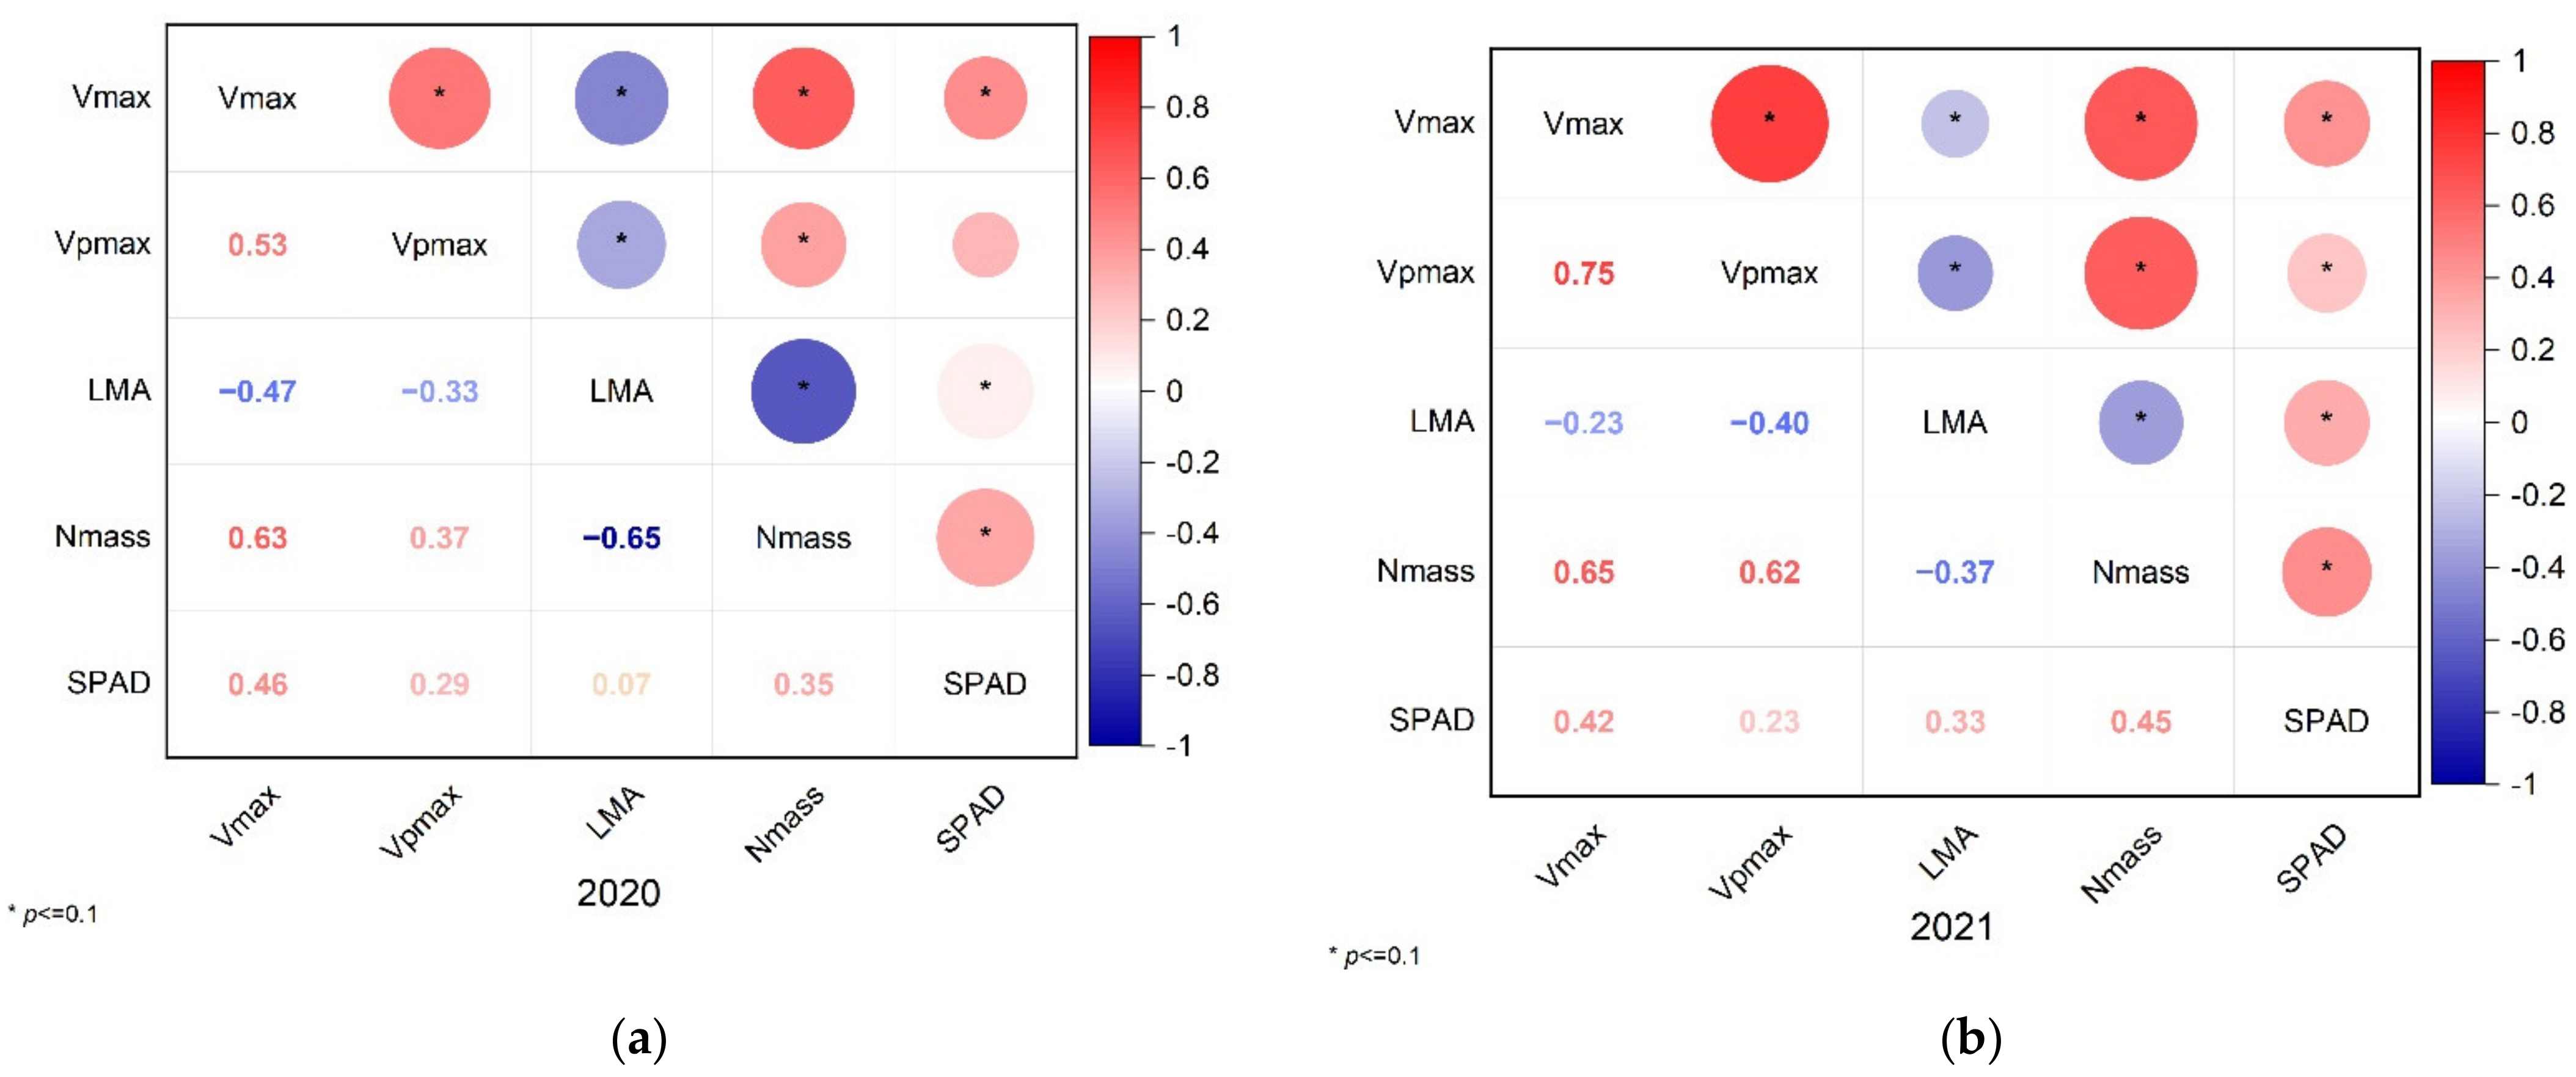
3.6. A Comprehensive Evaluation of the Relationship between Factors Affecting Yield

Six index factors (Table 5) of field microenvironment, growth index, physiological index, and yield components were selected for principal component analysis. The extraction conditions in the SPSS software environment were that the eigenvalue was greater than one, and the cumulative contribution rate was greater than 85%. Thus, according to the extraction conditions, the total variance decomposition table and the principal component load matrix (Tables S1 and S2) were obtained. According to Table S1, the eigenvalues of the two principal components were greater than one at 4.18 and 1.30. The cumulative variance contribution rate reached 91.27%, basically covering the information of all influencing factors. Therefore, this paper summarized two principal components. The first principal component was related to ear diameter (x5), LAI (x3), soil water content (x1), kernels per ear (x6), and soil temperature (x2). Among them, a strong positive correlation between ear diameter (x5) and LAI (x3) was found, mainly reflecting the impact of nonphysiological indicators such as yield components and growth indicators on yield. The second principal component was mainly positively correlated with the maximum rate of carboxylation (x4), which mainly reflected the positive effect of the physiological index on maize.
Through principal component analysis, we summarized six indexes as the effects of physiological and nonphysiological factors on maize yield, including both positive and negative correlation index factors. To better analyze the correlation degree between factors and crop yield, grey correlation analysis of maize yield was established (Table 6), which was ranked as LAI (x3) > soil temperature (x2) > θ (x1) > maximum carboxylation rate (x4) > ear diameter (x5) > kernels per ear (x6).

4. Discussion

4.1. Growth and Yield

Compared with CK, W and B treatments significantly increased kernels per ear and hundred kernel mass, resulting in a significant increase of 7.2–12.4% in yield. At the same time, there was no significant difference in ear length, kernels per ear, hundred kernel mass, or yield between S and CK (Table 2). The changes in yield and components of yield could be contributed by the improvement in the θ, soil temperature, and growth indexes such as LAI. Transparent film mulching increased maize yield by providing appropriate soil temperature and water content, air temperature, and relative humidity [29]. Unlike Liu et al. in [29], we did not find a significant difference in air temperature and relative humidity at 20 cm above the soil surface among treatments (Figure S2). However, the θ and soil temperature were significantly improved in W and B treatments (Figure 1 and Figure 2), which may be the main reason for the better plant growth and higher yield and photosynthetic parameters of those treatments. In 2020 and 2021, W, B, and S increased the 0–40 cm θ by 7.4–13.6%, 9.1–11.1%, and 3.7–4.6%, respectively which was consistent with previous studies that found that transparent film, black film, and straw mulching can increase soil water content [9,30,31]. In addition, although there was sufficient rainfall during the growth period of summer maize in the experimental area, in 2020, because of the uneven distribution of rainfall, the θ of CK was less than 60%FC for seven days. Below 60%FC was generally considered as the beginning of crop drought stress [32]. W and B significantly reduced the number of such days to zero and four. Although S treatment did not shorten the drought stress period, the θ of S also increased significantly, indicating that all the mulching treatments in our study could reduce crop drought stress. The change in soil temperature and the increase in GDD5 could also promote crop growth. Significant correlations between the growth rate of maize and the accumulated temperature at the depth of 5 cm below ground have been reported previously [33,34]. In this study, compared with CK, W and B increased the temperature and the GDD5 (Figure 1 and Figure 2), so they probably would improve the growth rate of maize. Although S did not increase the GDD5, the S treatment could cool down the soil temperature when the temperature was high and warm up it when low. Thus, the S treatment reduced the temperature variation experienced by crops (Figure 2), which may also have a positive effect on crop growth [21].
The increase in plant height, LAI, stem diameter, and dry matter also promoted the increase in yield. In particular, rising LAI is closely related to light interception. Studies have shown that 95% of radiation in crucial growth periods should be intercepted in order to maximize the growth rate and potential yield per plant [35,36]. Leaf area not only affects crop transpiration but also affects the size of sunlight exposure area and the ability of crop photosynthesis [37,38]. From the grey correlation analysis of yield and influencing factors in our study, LAI had a relatively significant impact on maize yield in this study (Table 6), and the increase in LAI under W and B treatments positively affected yield formation (Figure 3).

4.2. Photosynthetic Physiological Parameters

Leaf physiological and ecological indexes such as leaf nitrogen content, chlorophyll content, and LMA can significantly affect leaf photosynthetic capacity and then affect the formation of crop yield. Vpmax and Vmax are two critical parameters for characterizing the photosynthetic capacity of maize as C4 plants. The variation range of Vmax in this study was 27.9–50.2 µmol m⁻2 s⁻¹, and Vpmax varied between 92.0 and 222.9 µmol m⁻2 s⁻¹. This was consistent with previous research [39,40]. This study found that although there was no significant difference in Vpmax among different mulching treatments, the Vmax of all the mulching treatments significantly increased compared with CK. The increase in Vmax was significantly correlated with the Nmass, which was consistent with the results of previous studies [41,42]. Moreover, we found that different mulching treatments significantly affected the correlation between Vmax and Nmass (Figure 6). The intercepts of the linear regression equation between Vmax and Nmass in W, B, and S treatments were significantly higher than that in CK, suggesting that when Nmass was the same, the Vmax of W, B, and S were higher than that of CK. Such results indicated that the mulched maize had higher leaf nitrogen utilization efficiency, which was consistent with the results of previous studies on the photosynthesis of maize under transparent film mulching [43] and straw mulching [21]. The improvement in leaf nitrogen utilization efficiency has been observed several times in maize with mulching treatments, though the internal reasons need to be further studied. In this study, both W and B increased SPAD, which was consistent with previous studies, but S also increased SPAD, which was contrary to a previous study in which S reduced SPAD [12]. The impact of straw mulching on crop growth is complex and affected by the interaction of farming measures, straw mulch amounts, soil texture, and other factors [44,45], which need to be further studied.

5. Conclusions

This study quantified the differences in field microenvironment, crop growth, yield, and photosynthetic physiological parameters among different mulching treatments with drip irrigation and tried to explain the contributions to yield improvement through correlation analysis. Our results partially supported our hypothesis. At least in North China Plain under the condition of full drip irrigation, transparent and black film mulching affected plant growth and yield to the same extent, because both mulching types increased soil water content in the root zone, increased the minimum soil temperature and accumulated temperature in 5 cm soil, and improved photosynthetic area (LAI) and photosynthetic capacity (Vmax). However, straw mulching, even with the increase in soil water content, did not increase yield. Through principal component analysis and grey correlation analysis, it was found that LAI had the greatest impact on maize yield. This study also provided the biological factors of maize leaves in this area and clarified the environmental and physiological reasons for yield changes under different mulching treatments.

Supplementary Materials

The following supporting information can be downloaded at: https://0-www-mdpi-com.brum.beds.ac.uk/article/10.3390/agriculture12050719/s1, Figure S1: Comparison of daily average and minimum soil temperatures at the depth of 5 cm below ground in the maize growing seasons in 2020 (a and c) and 2021 (b and d) among all treatments, Figure S2: Changes in air temperature and humidity under different covering treatments in 2020 (a and b) and 2021 (c and d), Table S1: Total variance decomposition table, Table S2: Principal component load matrix.

Author Contributions

Conceptualization, Y.Z. and J.W.; methodology and formal analysis, S.Q., J.W., C.W. and Y.Z.; investigation, S.Q., Y.M. and C.W.; writing—original draft preparation, S.Q.; writing—review and editing, Y.Z., J.W., C.W, Y.M. and S.G.; supervision, S.G.; funding acquisition, Y.Z., J.W. and S.G. All authors have read and agreed to the published version of the manuscript.

Funding

This work was supported by the National Natural Science Foundation of China (51879277, 51979288); the Special Fund of the State Key Laboratory of Simulation and Regulation of Water Cycle in River Basins, China Institute of Water Resources and Hydropower Research (SKL2022TS08); and the Agricultural Science and Technology Innovation Program (2021–2025).

Data Availability Statement

Not applicable. The data that support the finding of this study are available from the corresponding author upon reasonable request.

Acknowledgments

The authors are grateful to Mingming Xu, Kaixuan Du, Lijuan Wang, Jie Geng, Wenjun Li, Hao Sun, and Ni Gao for field assistance. We thank two anonymous reviewers and the editors for their instructive comments.

Conflicts of Interest

All authors declare no conflict of interest.

References

  1. Ray, D.K.; Mueller, N.D.; West, P.C.; Foley, J.A. Yield trends are Insufficient to double global crop production by 2050. PLoS ONE 2013, 8, e66428. [Google Scholar] [CrossRef] [PubMed] [Green Version]
  2. Lesk, C.; Rowhani, P.; Ramankutty, N. Influence of extreme weather disasters on global crop production. Nature 2016, 529, 84–87. [Google Scholar] [CrossRef] [PubMed]
  3. Van Zelm, E.; Zhang, Y.; Testerink, C. Salt tolerance mechanisms of plants. Annu Rev. Plant. Biol. 2020, 71, 403–433. [Google Scholar] [CrossRef] [PubMed] [Green Version]
  4. Martins, J.D.; Rodrigues, G.C.; Paredes, P.; Carlesso, R.; Oliveira, Z.B.; Knies, A.E.; Petry, M.T.; Pereira, L.S. Dual crop coefficients for maize in southern Brazil: Model testing for sprinkler and drip irrigation and mulched soil. Biosyst. Eng. 2013, 115, 291–310. [Google Scholar] [CrossRef]
  5. Wang, J.D.; Zhang, Y.Q.; Sui, J.; Zhao, Y.F.; Ma, F.S. Effect of straw mulching and fertilizing on the growth and yield of maize under surface drip irrigation. J. Irrig. Drain. 2016, 35, 1–6. [Google Scholar] [CrossRef]
  6. Zhang, Y.; Sun, M.H. The Effect of straw mulching coupled with furrow irrigation on root distribution and yield of summer maize. J. Irrig. Drain. 2021, 40, 16–21. [Google Scholar] [CrossRef]
  7. Chen, Z.J.; Zhang, L.L.; Jiang, H.; Sun, S.J. Effects of plastic film mulching and planting density on soil temperature and maize yield in rain-fed area of Northeast China. Chin. J. Ecol. 2017, 36, 2169–2176. [Google Scholar]
  8. He, G.; Wang, Z.H.; Hui, X.L.; Huang, T.M.; Luo, L.C. Black film mulching can replace transparent film mulching in crop production. Field Crops Res. 2021, 261, 108026. [Google Scholar] [CrossRef]
  9. Xu, M.M.; Zhao, Y.F.; Zhang, Y.Q.; Wang, J.D. Effects of adequate drip irrigation with different mulching treatments on spring maize yield and water use efficiency. Water Sav. Irrig. 2020, 12, 1–7. [Google Scholar]
  10. Yu, Y.Y.; Turner, N.C.; Gong, Y.H.; Li, F.M.; Fang, C.; Ge, L.J.; Ye, J.S. Benefits and limitations to straw- and plastic-film mulch on maize yield and water use efficiency: A meta-analysis across hydrothermal gradients. Eur. J. Agron. 2018, 99, 138–147. [Google Scholar] [CrossRef]
  11. Hu, Y.; Ju, H.G.; Zhao, X.; Cao, T.H.; Liang, X.H. Effects of different mulching conditions on the yield of middle-late mature maize in the cool area of Eastern Jilin Province. J. Northeast. Agric. Sci. 2019, 44, 20–25, 42. [Google Scholar] [CrossRef]
  12. Ding, B.; Liang, X.H.; Zhao, X.; Li, S.L.; Sun, R.D. Effect of Different Coverage Methods on Dry Matter Accumulation and Yield of Maize in Low Temperature Cold Zone. Available online: https://kns.cnki.net/kcms/detail/46.1068.S.20210107.1504.010.html (accessed on 18 January 2021).
  13. Li, Y.Y.; Huang, Z.B.; Huang, S.Y. Response of maize growth and water-photosynthesis characteristic to different combination of air humidity with soil moisture. Bull. Soil Water Conserv. 1999, 19, 23–26. [Google Scholar]
  14. Wang, D.; Heckathorn, S.A.; Barua, D. Effects of elevated CO2 on the tolerance of photosynthesis to acute heat stress in C3, C4, and CAM species. Am. J. Bot. 2008, 95, 165–176. [Google Scholar] [CrossRef] [PubMed]
  15. Liu, L.; Hao, L.h.; Li, F.; Guo, L.L.; Zhang, X.X.; He, C.L.; Zheng, Y.P. Effects of CO2 concentration and temperature on leaf photosynthesis and water use efficiency in maize. Trans. Chin. Soc. Agric. Eng. 2020, 36, 122–129. [Google Scholar] [CrossRef]
  16. Zhou, Q.Y.; Li, M.C.; Qi, D.L.; Huang, C.Y.; Wang, Z.C. Effects of nitrogen rate on physiological characteristics of spring maize under waterlogging at jointing stage. J. Irrig. Drain. 2020, 39, 40–44. [Google Scholar] [CrossRef]
  17. Wang, C.J.; Zhang, Y.Q.; Wang, J.D.; Xu, D.; Gong, S.H.; Wu, Z.D. Photosynthetic response of water-saving and yield-increasing of mulched drip irrigation for spring maize (Zea mays L.) in northeast China. Trans. Chin. Soc. Agric. Eng. 2019, 35, 90–97. [Google Scholar] [CrossRef]
  18. Duan, M.; Mao, X.M.; Xu, Z.Q.; Zhao, Y. Effects of water deficit and mulching on leaf gas exchange parameters and yield in seed-maize grain filling stage. J. Drain. Irrig. Mach. Eng. 2018, 36, 1065–1070. [Google Scholar]
  19. Hikosaka, K. Interspecific difference in the photosynthesis-nitrogen relationship: Patterns, physiological causes, and ecological importance. J. Plant. Res. 2004, 117, 481–494. [Google Scholar] [CrossRef]
  20. Vos, J.; Putten, P.E.L.v.d.; Birch, C.J. Effect of nitrogen supply on leaf appearance, leaf growth, leaf nitrogen economy and photosynthetic capacity in maize (Zea mays L.). Field Crops Res. 2005, 93, 64–73. [Google Scholar] [CrossRef]
  21. Zhang, Y.Q.; Wang, J.D.; Gong, S.H.; Xu, D.; Mo, Y. Straw mulching enhanced the photosynthetic capacity of field maize by increasing the leaf N use efficiency. Agric. Water Manag. 2019, 218, 60–67. [Google Scholar] [CrossRef]
  22. Zhang, Y.Q.; Wang, J.D.; Gong, S.H.; Sui, J. Photosynthetic response of yield enhancement by nitrogen fertilization in winter wheat fields with drip irrigation. Trans. Chin. Soc. Agric. Eng. 2017, 31, 170–177. [Google Scholar] [CrossRef]
  23. Flexas, J.; Medrano, H. Drought-inhibition of photosynthesis in C3 plants: Stomatal and non-stomatal limitations revisited. Ann. Bot 2002, 89, 183–189. [Google Scholar] [CrossRef] [PubMed] [Green Version]
  24. Pinheiro, C.; Chaves, M.M. Photosynthesis and drought: Can we make metabolic connections from available data? J. Exp. Bot 2011, 62, 869–882. [Google Scholar] [CrossRef] [PubMed] [Green Version]
  25. Von Caemmerer, S. Biochemical Models of Leaf Photosynthesis; CSIRO Publishing: Victoria, Australia, 2000. [Google Scholar]
  26. Tatsumi, K.; Kuwabara, Y.; Motobayashi, T. Monthly variability in the photosynthetic capacities, leaf mass per area and leaf nitrogen contents of rice (Oryza sativa L.) plants and their correlations. J. Agric. Meteorol. 2019, 75, 111–119. [Google Scholar] [CrossRef] [Green Version]
  27. Miner, G.L.; Bauerle, W.L. Seasonal responses of photosynthetic parameters in maize and sunflower and their relationship with leaf functional traits. Plant. Cell Environ. 2019, 42, 1561–1574. [Google Scholar] [CrossRef] [PubMed]
  28. Zhang, Y.S.; Yu, Z.R.; Driessen, P.M. Growing degree-days requirements for plant and leaf development of summer maize (Zea mays)—An experimental and simulation study. Chin. J. Appl. Ecol. 2001, 12, 561–565. [Google Scholar]
  29. Liu, Y.; Li, Y.F.; Li, J.S.; Yan, H.J. Effects of mulched drip irrigation on water and heat conditions in field and maize yield in sub-humid region of Northeast China. Trans. Chin. Soc. Agric. 2015, 46, 93–104. [Google Scholar]
  30. Sun, S.J.; Chen, Z.J.; Jiang, H.; Zhang, L.L. Black film mulching and plant density influencing soil water temperature conditions and maize root growth. Vadose Zone J. 2018, 17, 1–12. [Google Scholar] [CrossRef] [Green Version]
  31. Yang, Y.H.; Ding, J.L.; Zhang, Y.H.; Wu, J.C.; Zhang, J.M.; Pan, X.Y.; Gao, C.; Wang, Y.; He, F. Effects of tillage and mulching measures on soil moisture and temperature, photosynthetic characteristics and yield of winter wheat. Agric. Water Manag. 2018, 201, 299–308. [Google Scholar] [CrossRef]
  32. Allen, R.G.; Pereira, L.S.; Raes, D.; Smith, M. Crop. Evapotranspiration-Guidelines for Computing Crop. Water Requirements—FAO Irrigation and Drainage Paper 56; Food and Agriculture Organization of the United Nations: Rome, Italy, 1998. [Google Scholar]
  33. Yang, W.B. Effect of soil accumulative temperature on growt and development of root system and above-ground part of maize in plastic dilm mulched field. Acta Phytoecol. ET Geobot. Sin. 1989, 13, 282–288. [Google Scholar]
  34. Sun, S.J.; Jiang, H.; Chen, Z.J.; Zhu, Z.C. Effects of surface-layer accumulated temperature on major growth traits of spring maize when un-mulched or under clear or black plastic film mulches. Acta Prataculturae Sinica. 2019, 28, 61–72. [Google Scholar]
  35. Otegui, M. Growth, water use, and kernel abortion of maize subjected to drought at silking. Field Crops Res. 1995, 40, 87–94. [Google Scholar] [CrossRef]
  36. Puntel, L.A. Field Characterization of Maize Photosynthesis Response to Light and Leaf Area Index under Different Nitrogen Levels: A Modeling Approach. Master’s Thesis, Crop Production and Physiology Department, Iowa State University, Ames, IA, USA, 2012. [Google Scholar]
  37. Steduto, P.; Hsiao, T.C. Maize canopies under two soil water regimes II. Seasonal trends of evapotranspiration, carbon dioxide assimilation and canopy conductance, and as related to leaf area index. Agric. For. Meteorol. 1998, 89, 185–200. [Google Scholar] [CrossRef]
  38. Zhang, Y.Q.; Wang, J.D.; Gong, S.H.; Xu, D.; Sui, J.; Wu, Z.D.; Mo, Y. Effects of film mulching on evapotranspiration, yield and water use efficiency of a maize field with drip irrigation in Northeastern China. Agric. Water Manag. 2018, 205, 90–99. [Google Scholar] [CrossRef]
  39. Liao, Q.; Gu, S.; Kang, S.; Du, T.; Tong, L.; Wood, J.D.; Ding, R. Mild water and salt stress improve water use efficiency by decreasing stomatal conductance via osmotic adjustment in field maize. Sci Total Environ. 2022, 805, 150364. [Google Scholar] [CrossRef]
  40. Perdomo, J.A.; Carmo-Silva, E.; Hermida-Carrera, C.; Flexas, J.; Galmes, J. Acclimation of biochemical and diffusive components of photosynthesis in rice, wheat, and maize to heat and water deficit: Implications for Modeling Photosynthesis. Front. Plant. Sci. 2016, 7, 1719. [Google Scholar] [CrossRef] [Green Version]
  41. Wang, S.; Guan, K.; Wang, Z.; Ainsworth, E.A.; Zheng, T.; Townsend, P.A.; Li, K.; Moller, C.; Wu, G.; Jiang, C. Unique contributions of chlorophyll and nitrogen to predict crop photosynthetic capacity from leaf spectroscopy. J. Exp. Bot 2021, 72, 341–354. [Google Scholar] [CrossRef]
  42. Yendrek, C.R.; Tomaz, T.; Montes, C.M.; Cao, Y.; Morse, A.M.; Brown, P.J.; McIntyre, L.M.; Leakey, A.D.; Ainsworth, E.A. High-throughput phenotyping of maize leaf physiological and biochemical traits using hyperspectral reflectance. Plant. Physiol 2017, 173, 614–626. [Google Scholar] [CrossRef]
  43. Wang, C.J.; Zhang, Y.Q.; Wang, J.D.; Xu, D.; Gong, S.H.; Wu, Z.D.; Mo, Y.; Zhang, Y.Y. Plastic film mulching with drip irrigation promotes maize (Zea mays L.) yield and water-use efficiency by improving photosynthetic characteristics. Arch. Agron. Soil Sci. 2020, 67, 191–204. [Google Scholar] [CrossRef]
  44. Wang, J.D.; Zhang, Y.Q.; Gong, S.H.; Xu, D.; Juan, S.; Zhao, Y.F. Evapotranspiration, crop coefficient and yield for drip-irrigated winter wheat with straw mulching in North China Plain. Field Crops Res. 2018, 217, 218–228. [Google Scholar] [CrossRef]
  45. Xiao, L.G.; Zhao, R.Q.; Kuhn, N.J. Straw mulching is more important than no tillage in yield improvement on the Chinese Loess Plateau. Soil Tillage Res. 2019, 194, 104314. [Google Scholar] [CrossRef]
Figure 1. The seasonal dynamics in 0–40 cm soil water content (θ) and soil temperature at the depth of 5 cm below ground (Ts-avg-5) in 2020 (a,c) and 2021 (b,d). The column with a slash indicates the time of the determination curve. p represents precipitation.
Agriculture 12 00719 g001aAgriculture 12 00719 g001b
Figure 2. Comparison of daily maximum soil temperature at the depth of 5 cm below ground (Ts-max-5) in the maize growing seasons in 2020 (a) and 2021 (b) among all treatments. The bars in the figures show the Ts-max-5 differences between the three mulching treatments (W, B, and S are transparent film, black film, and straw mulching, respectively) and the CK.
Agriculture 12 00719 g002
Figure 3. LAI changes under different coverage treatments in 2020 (a) and 2021 (b). Different lower-case letters (a, b, and c) in the table indicate statistically significant differences, ns represents no significant differences at 0.05 < p < 0.1.
Agriculture 12 00719 g003
Figure 4. Principal component analysis of yield components in 2020 (a) and 2021 (b).
Agriculture 12 00719 g004
Figure 5. Correlation analysis of leaf biological factors among treatments in 2020 (a) and 2021 (b). As can be seen from the y-axis on the right, red and blue represent positive and negative correlations, respectively. The numbers are the correlation coefficients.
Agriculture 12 00719 g005
Figure 6. Fitting relationships between (a) Vmax, (b) Vpmax, and Nmass in different coverage treatments.
Agriculture 12 00719 g006
Table 1. Irrigation and fertilization schedules for 2020 and 2021.
YearsTimesGrowth StagesDateIrrigation (mm)Nutrients (kg/ha)
NP2O5K2O
20201Jointing stage8/15156108135
2Tasseling period8/1654827
3Filling stage9/13536
Total 15240135135
20211Seedling stage6/2750
2Jointing stage8/25156108135
3Tasseling period8/22 58427
Total 60240135135
Table 2. Yield and its components among treatments for the two years. Notes: Data are given as means with standard deviations in brackets.
YearsTreatmentsEar Length (cm)Ear Diameter (mm)Kernels/earHundred Kernel Mass (g)Yield (t/ha)
2020CK19.4354.29a481.29b33.32ab12.58b
W19.2554.38a501.63a34.24a13.48a
B19.2554.13a505.50a33.95a13.47a
S19.2553.5b489.38ab32.39b12.44b
p value0.9030.0640.0730.0520.027
2021CK17.6349.63410.75b27.35bc10.37b
W18.0049.5462.13a27.97ab11.40a
B17.7549.75445.50a28.43a11.66a
S17.5049.38409.50b26.62c10.16b
p value0.4550.905<0.0010.0070.001
Notes: Different lower-case letters (a, b, and c) in the table indicate statistically significant differences at 0.05 < p < 0.1.
Table 3. Changes in photosynthetic capacity among treatments.
YearsParametersTreatmentsJointing StageFilling StageMature Stage
2020VmaxCK42.7 ± 2.4a40.9 ± 4.730.2 ± 5.7
(µmol m⁻2 s⁻¹)W44.2 ± 4.7ab42.3 ± 3.633.5 ± 3.1
B50.2 ± 1.8c39.4 ± 3.536.6 ± 4.4
S47 ± 3.9bc40.5 ± 4.535.1 ± 5.3
p value0.0050.7230.186
VpmaxCK123.6 ± 19.6115.4 ± 16.7104.3 ± 16.1
(µmol m⁻2 s⁻¹)W120.3 ± 25.4121.7 ± 20.996.2 ± 18.6
B142.8 ± 15.4120.8 ± 18.2103.8 ± 14.4
S134.1 ± 24.1116.2 ± 8.5116.3 ± 11.2
p value0.2810.9050.328
2021VmaxCK41.7 ± 6.3a39.4 ± 1.827.9 ± 1.8a
(µmol m⁻2 s⁻¹)W48.9 ± 3.0b36.4 ± 4.731.5 ± 3.3bc
B47.0 ± 0.9b38.6 ± 3.629.6 ± 3.0ab
S47.0 ± 4.1b38.0 ± 5.533.1 ± 4.3c
p value0.0660.6850.033
VpmaxCK173.1 ± 35.3126.3 ± 3.498.4 ± 8.7
(µmol m⁻2 s⁻¹)W222.9 ± 45.5122.5 ± 20.492.0 ± 15.7
B191.5 ± 41.3113.4 ± 15.094.7 ± 22.7
S195.3 ± 35.7111.9 ± 19.3109.0 ± 25.2
p value0.2960.4290.386
Notes: Different lower-case letters (a, b, and c) in the table indicate statistically significant differences at 0.05 < p < 0.1.
Table 4. Changes in biological factors of leaves among treatments.
YearsParametersTreatmentsJointing StageFilling StageMature Stage
2020LMACK21.2 ± 3.2933.8 ± 1.1233.7 ± 0.8
(g/m2)W23.3 ± 5.5732.7 ± 0.9435.5 ± 2.29
B24.8 ± 2.6634.4 ± 1.7235.1 ± 2.63
S21.0 ± 5.7834.5 ± 2.3135.0 ± 2.31
p value0.490.290.48
NmassCK37.3 ± 1.5ab34.6 ± 3.030.9 ± 1.6
(g/kg)W38.2 ± 0.9a35.3 ± 1.931.3 ± 0.8
B37.5 ± 0.2ab33.9 ±1.130.6 ± 1.2
S36.6 ± 0.6b33.6 ± 2.830.6 ± 2.6
p value0.090.60.86
SPADCK54.4 ± 2.7253.9 ± 3.19ab
W59.2 ± 3.2857.4 ± 2.94c
B57.9 ± 3.5851.1 ± 2.93a
S57.9 ± 2.7355.0 ± 3.01bc
p value 0.130.02
2021LMACK25.7 ± 1.86a30.9 ± 1.3229.4 ± 1.29a
(g/m2)W28.2 ± 1.32b30.4 ± 1.4129.1 ± 1.62a
B26.1 ± 1.32ab32.0 ± 1.0130.1 ± 1.41ab
S27.0 ± 1.57b30.7 ± 1.6831.1 ± 1.77b
p value0.020.270.15
NmassCK36.7 ± 1.934.6 ± 0.8ab29.6 ± 2.1
(g/kg)W39.6 ± 4.135.7 ± 1.8b30.5 ± 1.1
B37.3 ± 1.133.8 ± 1.4a29.7 ± 1.7
S37.1 ± 0.934.0 ± 0.7a29.5 ± 1.0
p value0.160.080.7
SPADCK52.6 ± 3.4658.0 ± 1.3049.2 ± 2.71a
W54.8 ± 1.2158.4 ± 3.3953.0 ± 2.01b
B53.2 ± 1.7756.0 ± 2.3549.7 ± 4.94ab
S54.7 ± 2.6557.5 ± 2.4853.0 ± 2.11b
p value0.210.630.09
Notes: Different lower-case letters (a, b, and c) in the table indicate statistically significant differences at 0.05 < p < 0.1.
Table 5. Index system of yield influencing factors.
Indicator’s CategoryProjectFactorsUnit
Field microenvironmentx1θcm3cm−3
x2Soil temperature
Growth indexx3LAI
Physiological indexx4Maximum rate of carboxylationµmol m⁻2 s⁻¹
Yield componentsx5Ear diametermm
x6Kernels per ear
Table 6. Grey correlation analysis of yield and influencing factors.
FactorsLAISoil TemperatureθMaximum Carboxylation RateEar DiameterKernels Per Ear
Correlation coefficient0.9950.9720.9720.8940.8760.36
Correlation rank123456
Publisher’s Note: MDPI stays neutral with regard to jurisdictional claims in published maps and institutional affiliations.

