Adjustment of Irrigation Schedules as a Strategy to Mitigate Climate Change Impacts on Agriculture in Cyprus


Agricultural Research Institute, Ministry of Agriculture, Rural Development and Environment, P.O. Box 22016, 1516 Nicosia, Cyprus
*
Author to whom correspondence should be addressed.
Agriculture 2019, 9(1), 4; https://0-doi-org.brum.beds.ac.uk/10.3390/agriculture9010004
Submission received: 30 November 2018
/
Revised: 17 December 2018
/
Accepted: 18 December 2018
/
Published: 21 December 2018
(This article belongs to the Special Issue Agricultural Irrigation)
Abstract
:The study aimed at investigating eventual deviations from typical recommendations of irrigation water application to crops in Cyprus given the undeniable changes in recent weather conditions. It focused on the seasonal or monthly changes in crop evapotranspiration (ETc) and net irrigation requirements (NIR) of a number of permanent and annual crops over two consecutive overlapping periods (1976–2000 and 1990–2014). While the differences in the seasonal ETc and NIR estimates were not statistically significant between the studied periods, differences were identified via a month-by-month comparison. In March, the water demands of crops appeared to be significantly greater during the recent past in relation to 1976–2000, while for NIR, March showed statistically significant increases and September showed significant decreases. Consequently, the adjustment of irrigation schedules to climate change by farmers should not rely on annual trends as an eventual mismatch of monthly crop water needs with irrigation water supply might affect the critical growth stages of crops with a disproportionately greater negative impact on yields and quality. The clear increase in irrigation needs in March coincides with the most sensitive growth stage of irrigated potato crops in Cyprus. Therefore, the results may serve as a useful tool for current and future adaptation measures.
1. Introduction
Theoretical considerations, climate simulation models and empirical evidence indicate that global warming is leading to increased water vapor and to increased land precipitation at higher latitudes, notably over North America and Eurasia [1]. However, contrary to many mid-to-upper latitude regions of the world, several regional studies have shown a dominant decreasing trend over the Mediterranean Basin [2], although changes will not be equivalent across all Mediterranean regions or seasons [3].
In Cyprus, this change is already being manifested by a decrease in mean annual rainfall and an increase in annual mean temperature. Model projections agree on its future warming and drying, with a likely increase of heatwaves and dry spells; a prospect that will worsen the already existing water scarcity [4,5].
The consequences of such temperature and precipitation changes on a number of aspects of human life and agriculture might be considerable. In agriculture, increased temperatures or the extension of dryness may have a negative impact on crop yields [6] and in turn on food security [7] and may influence crops dynamics, e.g., the exclusion of some crops, or their replacement by others more adapted to the new conditions [8]. Changes in climatic conditions might also affect the proliferation and spread of invasive species, weeds, or diseases [9].
Crop production in Cyprus is covered by annual (e.g., potatoes and vegetables) and permanent (e.g., citrus, olives and grapevines) crops summing over 100 × 103 ha, of which 30% is irrigable land. Citrus and potatoes are the most widely grown crops in the country and consume over 30% of the total agricultural water (150 × 106 m3). Crop production is constrained by a highly variable climate, limited precipitation and high temperatures from mid-May to mid-September [10]. However, crop water needs may be fully or partly met by rainfall mainly from October to March. Given the projected lower precipitation it can reasonably be assumed that irrigation water availability and crop yields will be affected [11]. Nonetheless, previous work showed that, considering the changes over recent years in mean rainfall and pan evaporation data, the total irrigation needs of crops in Cyprus have not been modified, at least until now [12].
While extreme weather events, which are predicted to increase under future climate scenarios, are already considered a significant challenge for producers [13], little work has been done so far on the current seasonal or monthly changes of temperature or the distribution of precipitation throughout the year and the consequences that these modifications may bring upon crops. Such changes may have an impact on some critical stages of the biological cycle of plants and disproportionately affect productivity and yields [14]. For example, irrigation experiments showed different effects on wheat yield, quality, and water-use efficiencies depending on the plant-growth or phenological stage at which water deficits were applied [15,16]. Therefore, an eventual mismatch of crop water needs with irrigation water supply might be critical, and adaptation measures related to irrigation schedules or the adjustment of planting/seeding dates might be necessary.
This study aims to investigate whether one of the characteristics of the ongoing climate change in Cyprus is a significant modification of the seasonal or monthly water needs and irrigation demands of crops, and discusses the consequences for agricultural production of an eventual deviation of the prevailing irrigation schedules to the current climatic conditions. It also investigates the possibilities for adaptation to climate change challenges using planting period shifts or irrigation schedule modifications.
2. Materials and Methods
The analysis of water and irrigation needs in this study was applied to 35 irrigated crops cultivated in Cyprus. Some of these crops require their water needs to be met fully or partially by irrigation, while some require irrigation only occasionally.
Mean monthly precipitation (mm) and pan evaporation (screened USWB Class A pan) data from 16 weather stations provided by the Cyprus Meteorological Department were used. These stations were situated in the main agricultural areas of Cyprus.
Crop evapotranspiration (ETc) was calculated from potential evapotranspiration (ETo) and pan evaporation (Epan) data obtained from the weather stations using the methodology proposed by the Food and Agriculture Organization of the United Nations (FAO) [17]. More precisely, Epan measurements were converted to reference evapotranspiration (ETo) using the equation:
where Kp is the pan coefficient, which takes into account the type of pan, its environment and climate. Potential crop evapotranspiration (ETc) was calculated from ETo according to:
where Kc is the crop coefficient, which depends on the kind of crop and its stage of development. Combining the previous two equations, ETc can be expressed as:
ΕTo = Kp × Epan
ETc = Kc × ETo
ETc = Kc × Kp × Epan
Substituting Kc × Kp with a coefficient C equation, (3) becomes:
i.e., crop evapotranspiration is calculated directly from pan evaporation using a single coefficient. Values of the coefficients can be derived from the literature [18,19] but they were extensively studied and adjusted to local conditions by the Agricultural Research Institute of Cyprus (e.g., [20,21]).
ETc = C × Epan
The net irrigation requirements (NIR) of the crops were calculated by subtracting from the actual water requirements of crops (ETc values) the effective rainfall (Pe), i.e., rain water that is not percolated below the root zone or run-off, but is stored in the root zone and can be used by the plants [17].
ETc and NIR values were estimated for the 35 crops cultivated in Cyprus under two overlapping periods, 1976–2000 and 1990–2014, for each of the 16 weather stations. The mean values obtained for these two periods for each season (winter: December–January–February, spring: March–April–May, summer: June–July–August, and autumn: September–October–November) and each month were compared for each crop.
Statistical Analysis
The mean seasonal or monthly ETc and NIR values for each studied crop and mean seasonal or monthly precipitation and Epan values obtained from the 16 weather stations were compared between the two studied periods (1976–2000 and 1990–2014) using a paired t-test (16 double samples for each crop over the 16 weather stations). A p-value < 0.05 in these tests was considered as statistically significant (GraphPad Software, Inc., San Diego, CA, USA).
3. Results
Differences of seasonal ETc and NIR estimates were not statistically significant between the studied periods. The results of the comparison of seasonal NIR between the two studied periods for selected crops cultivated in Cyprus are shown in Table 1. All crops showed decreased average irrigation needs in all seasons apart from spring, where some crops appeared to have greater irrigation water demands in the recent past. The p values for the NIR of many crops were close to statistical significance in autumn.
Table 2, showing the results for only the most water-consuming crops, indicates that March was the only month in which there was a statistically significant difference (increase) in ETc between the two periods (p < 0.05). The water demand of all crops in this month was significantly greater in recent years than in the distant past. Void cells in Table 2 indicate months that are not included in the irrigation period of crops in Cyprus. For NIR, apart from March, statistically significant differences between the two periods were also found for September, as seen in Table 3. In March, the irrigation requirements were greater for 1990–2014 than for 1976–2000, in contrast to what was found for September.
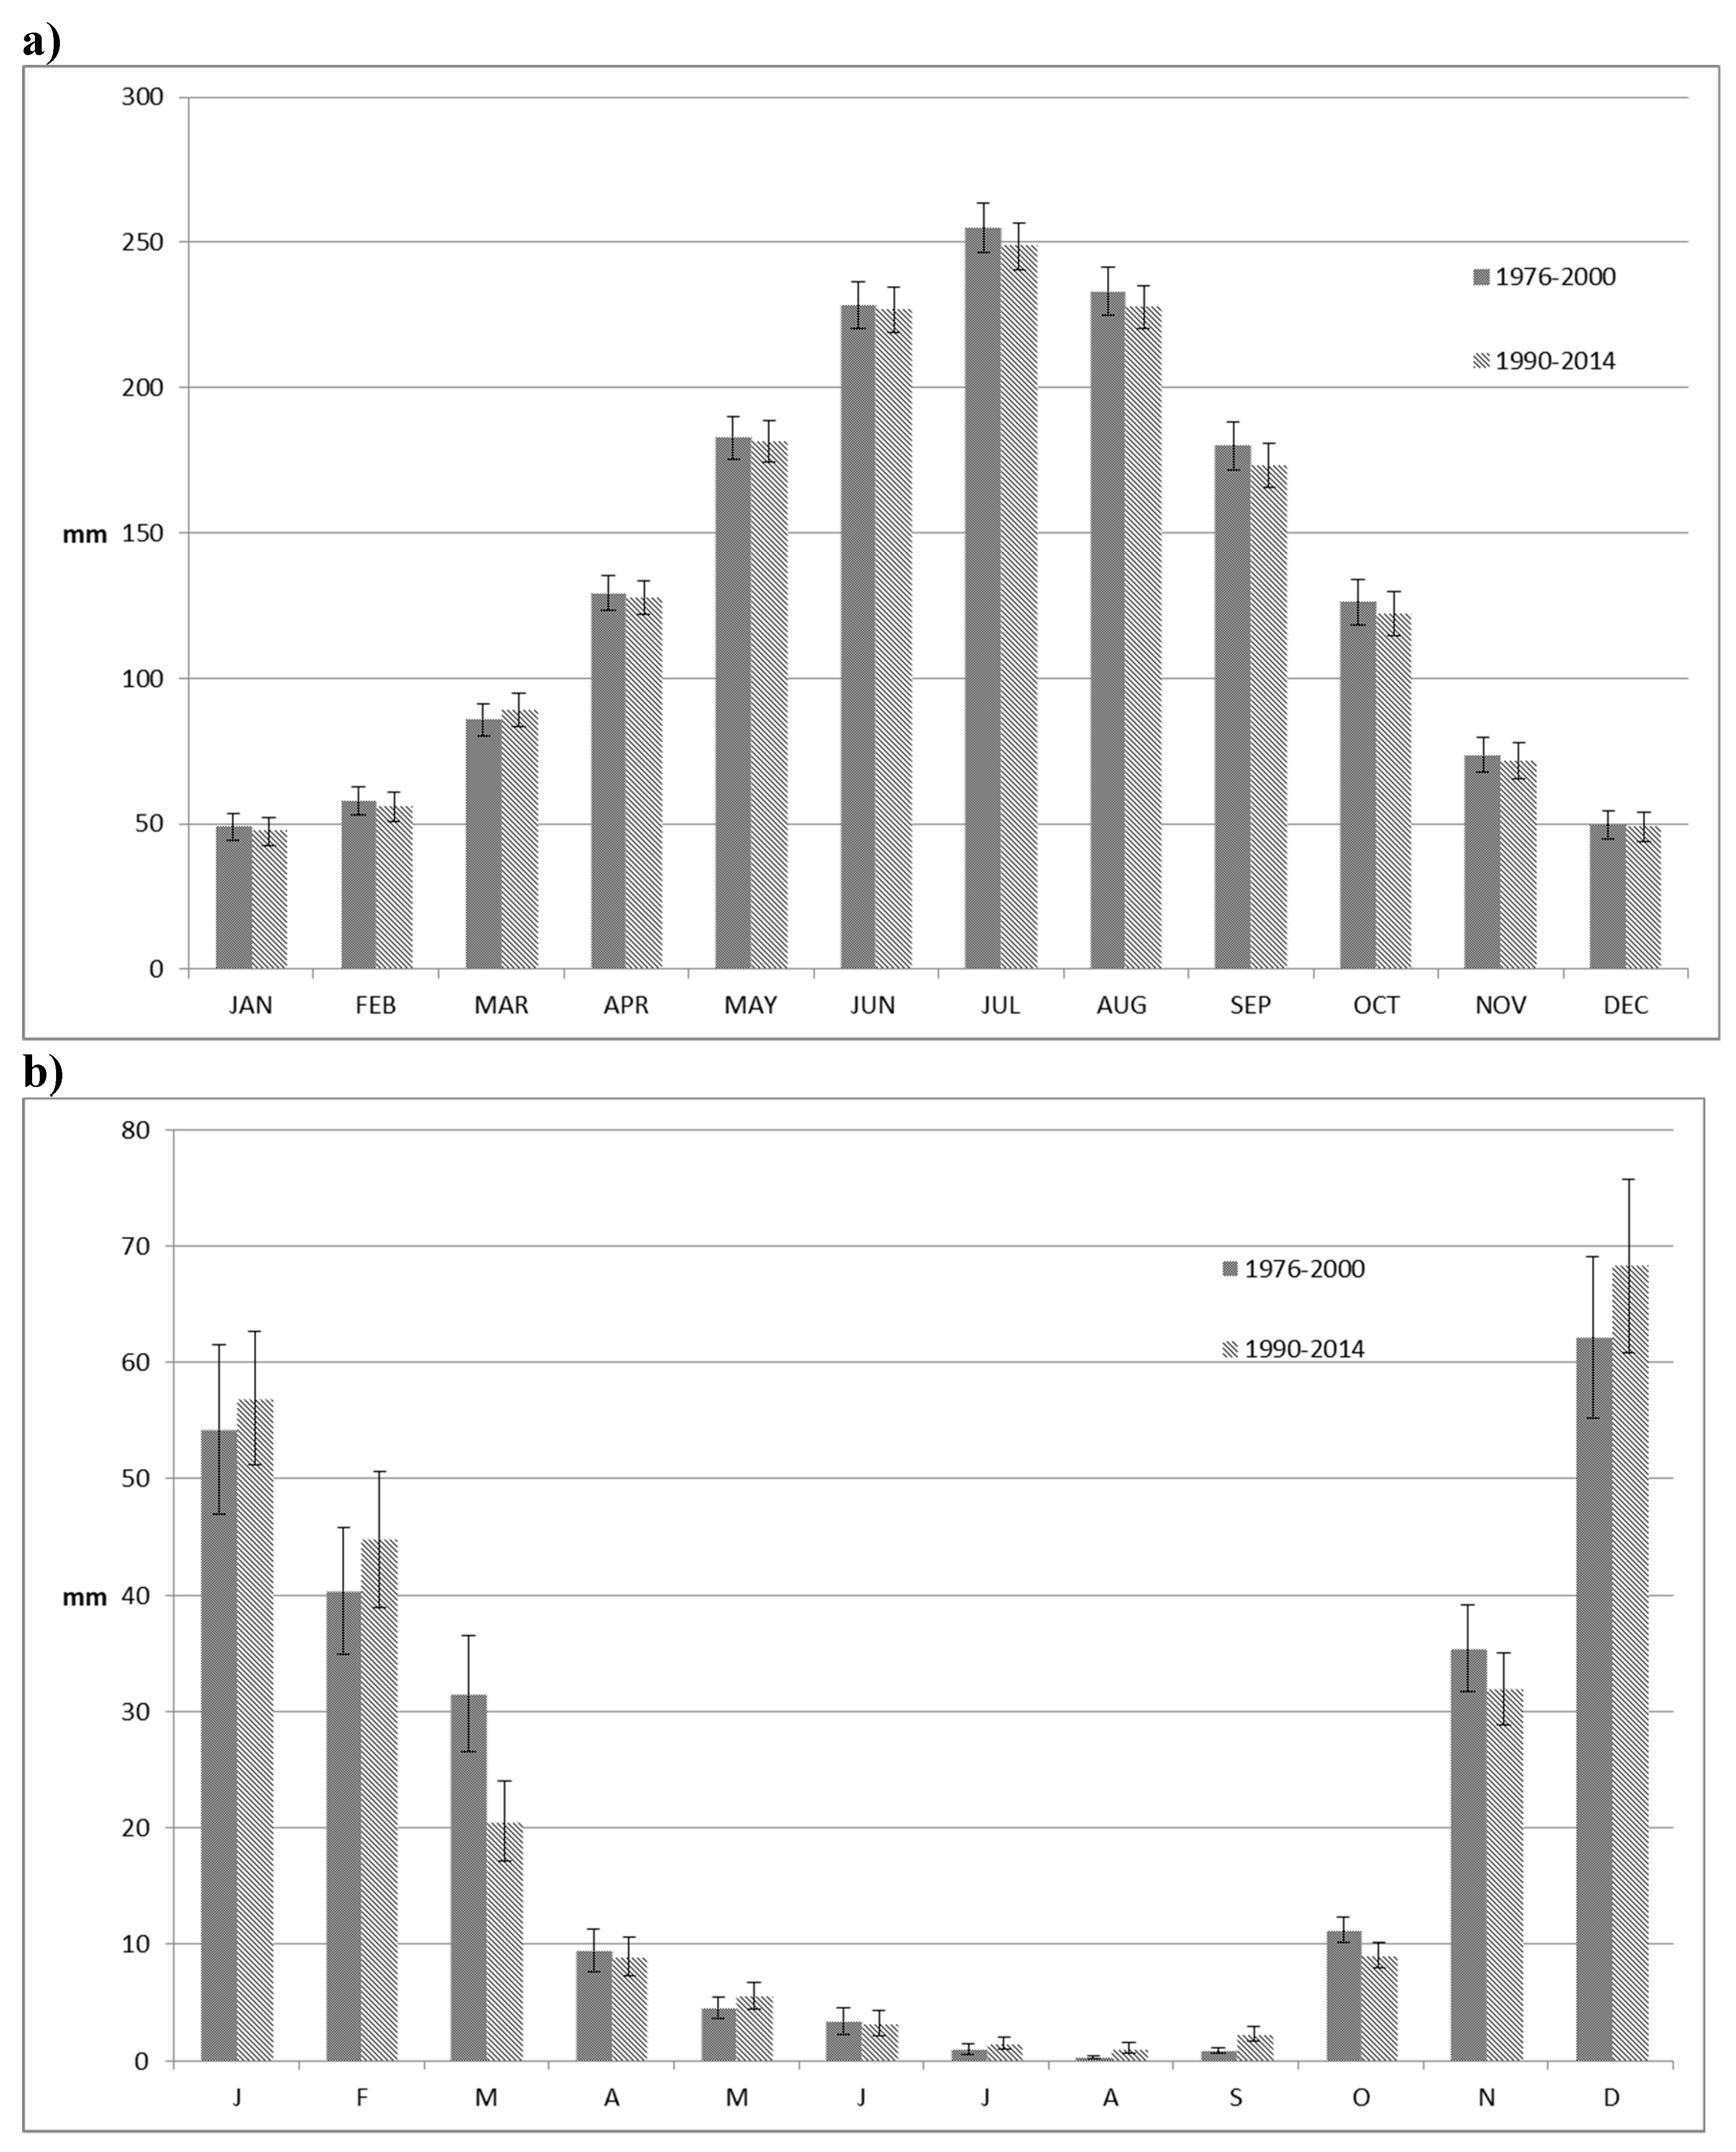
Meteorological precipitation and evaporation data was analyzed to gain insight into the causes of this change. Climate charts of the distribution of rainfall and Epan over the months of the year (Figure 1a,b) illustrate the differences in these meteorological variables between the two 24-year periods. The mean March Epan value for 1990–2014 was significantly increased in relation to the 1976–2000 interval. March and September were the only months that this statistically significant difference was observed. An increase in Epan in March was recorded at 13 of 16 weather stations.
All 16 stations showed decreased average precipitation in more recent years, with an average reduction of 36%. In all other months, the stations showed both increases and decreases in average rainfall when the two periods were compared. The statistically strong tendency to decreased precipitation during March was not followed by a respective decrease during the following two months of spring. In May, for example, at 12 out of 16 stations a tendency towards an increase in precipitation was noted. For September, which also showed a statistically significant change in the irrigation needs of crops, the opposite trend was manifested, with only 1 station out of 16 recording a decrease in rainfall.
4. Discussion
The re-estimation of irrigation required two successive past periods in order to evaluate the effect of the ongoing changes in precipitation and evaporative demand of the atmosphere on the water demand of crops. The results revealed some interesting effects of ongoing climate change, which usually do not receive the deserved attention, and which could prove to be a useful guide for farmers, policy makers, government officers and agricultural advisors.
The trends in the change of mean annual precipitation and mean annual temperature in Cyprus are not reflected equally or proportionally at different times of the year. Consequently, the adjustment of irrigation schedules to climate change by farmers should not rely on annual trends as practiced by local growers. Focusing on month-by-month changes revealed strong trends towards an increase in evaporation during March at all meteorological stations, which in combination with a respective decrease in precipitation attests that an adjustment of irrigation water provision to crops is needed. Irrigation programs that are based on “old” meteorological data would result in water deficiencies, which may affect critical growth stages of plants. Moreover, in many cases, farmers now need to irrigate their crops during March, whereas previously, irrigation in March was negligible. In March, the precipitation dropped by 36% and the amount of water that would be needed to compensate for this reduction was estimated to be also 36% on average, as rainfall covered a large part of the total water demand of crops. Climate change effects on irrigation scheduling parameters were also found in Calabria, Italy. From an analysis of reference evapotranspiration (ETo) during the last decades, it was shown that a positive trend in summer precipitation also caused an advance of the last watering, resulting in a slight decrease of the length of the irrigation season [22].
The example of potatoes is probably indicative of the necessary adaptation measures. Potatoes are one of the most exportable products of Cyprus and one of the most water-consuming crops. The “spring crop” or the “main crop” is planted in November/February and harvested in March/June mainly for export, but also for local consumption. Stolonization and tuber initiation are the stages that are most sensitive to water shortage [23], mainly because they are the stages of the highest crop water demand. If water shortages occur during the mid-season stage, which in Cyprus coincides with March, the negative effect on the yield will be pronounced. Karafyllidis et al. [24] showed that limited soil moisture availability affected yield and the number and size of tubers. In the following year, seed produced under conditions of moisture stress produced plants with 20% fewer stems, 24–33% less yield, 18–22% fewer tubers and 19–22% fewer large tubers than plants from seed produced under abundant water supply.
Hence, irrigation should be applied as an adaptation measure to safeguard yields if meteorological trends continue as they are today. An earlier shift of plantation dates could alternatively also be envisaged as an adaptation measure of potato cultivation, as crops would have completed their water-sensitive stage before the less favorable conditions of March. An analysis of the optimum adjustment of planting dates for corn and soybean was also suggested by Woznicki et al. [25] as one of the best adaptation strategies to cope with future climate change scenarios.
However, in contrast, precipitation increased from 0.9 to 2.3 mm in September, affecting irrigation water demand for this month by only 5%. This is because the contribution of rainfall to the total amount of water that needed to be applied to crops in September was nevertheless very small. In this case, following current irrigation guidelines would result in supplying crops with an excess of water. This would not have a negative effect on productivity and yields but it would result in wasting water. The results, therefore, support the notion that in changing climatic conditions, the irrigation adaptation actions required are different in each case depending on specific conditions. Using a modeling approach to simulate the impact of various climate change scenarios on crop water and downscaling climatic parameters derived from global circulation models, Doria and Madramootoo [26] similarly suggested that in order to sustain crop production in the future, efficient irrigation scheduling for producers should be used as an adaptation measure.
The monthly changes in weather conditions that were highlighted in this study and their significant effects on agricultural production constitute a very subtle aspect of climate change, as they are not obvious even as seasonal changes. As a result, we advocate for further examination and verification in other places with a similar climate. However, if the shown precipitation and evaporation trends continue in the future, rainfed crops could also be affected and emphasis should be placed on supplementary irrigation during March. The addition of small amounts of water in this month could improve and stabilize yields, providing the missing moisture for normal plant growth.
5. Conclusions
Irrigation schedules that are based on the average evaporation and rainfall records of an area have to be adjusted to recent changes of climatic parameters even if the year-round changes are not significantly affected. Shifts in rainfall and temperature “allocation” across the months of the year call for a corresponding adjustment of the irrigation water applied to crops, as an eventual mismatch with plant needs could significantly affect some of their critical growth stages. The adjustment of irrigation schedules should be based on more local studies, even if they are in opposition to trends found in wider areas.
Author Contributions
Each author made substantial contributions to this publication. P.D. collected and analyzed the data and wrote the first draft. D.N. and A.C. had a significant contribution to the improvement and revision of the manuscript.
Funding
This research received no external funding.
Acknowledgments
This work was supported by the Agricultural Research Institute of Cyprus (ARI) and authors did not receive any specific grant from funding agencies in the public, commercial, or not-for-profit sectors. The authors would like to thank the staff of the Natural Resources and Environment Section of ARI for their assistance.
Conflicts of Interest
The authors declare no conflict of interest.
References
- Trenberth, K.E.; Jones, P.D.; Ambenje, P.; Bojariu, R.; Easterling, D.; Klein Tank, A.; Parker, D.; Rahimzadeh, F.; Renwick, J.A.; Rusticucci, M.; et al. Observations: Surface and atmospheric climate change. In Climate Change 2007: The Physical Science Basis; Solomon, S., Qin, D., Manning, M., Chen, Z., Marquis, M., Averyt, K.B., Tignor, M., Miller, H.L., Eds.; Intergovernmental Panel on Climate Change 4th Assessment Report; Cambridge University Press: Cambridge, UK, 2007; pp. 235–336. [Google Scholar]
- Alpert, P.; Ben-Gai, T.; Baharad, A.; Benjamini, Y.; Yekutieli, D.; Colacino, M.; Diodato, L.; Ramis, C.; Homar, V.; Romero, R.; et al. The paradoxical increase of Mediterranean extreme daily rainfall in spite of decrease in total values. Geophys. Res. Lett. 2002, 29, 1536. [Google Scholar] [CrossRef]
- Misra, A.K. Climate change and challenges of water and food security. Int. J. Sustain. Built Environ. 2014, 3, 153–165. [Google Scholar] [CrossRef]
- Lelieveld, J.; Hadjinicolaou, P.; Kostopoulou, E.; Chenoweth, J.; El Maayar, M.; Giannakopoulos, C.; Hannides, C.; Lange, M.A.; Tanarhte, M.; Tyrlis, E.; et al. Climate change and impacts in the eastern Mediterranean and the Middle East. Clim. Chang. 2012, 114, 667–687. [Google Scholar] [CrossRef] [PubMed]
- Lionello, P.; Abrantes, F.; Gacic, M.; Planton, S.; Trigo, R.; Lbrich, U. The climate of the Mediterranean region: Research progress and climate change impacts. Reg. Environ. Chang. 2014, 14, 1679–1684. [Google Scholar] [CrossRef]
- Lobell, D.B.; Field, C.B. Global scale climate–crop yield relationships and the impacts of recent warming. Environ. Res. Lett. 2007, 2, 014002. [Google Scholar] [CrossRef] [Green Version]
- Schmidhuber, J.; Tubiello, F.N. Global food security under climate change. Proc. Natl. Acad. Sci. USA 2007, 104, 19703–19708. [Google Scholar] [CrossRef] [Green Version]
- Olesen, J.E.; Bindi, M. Consequences of climate change for European agricultural productivity, land use and policy. Eur. J. Agron. 2002, 16, 239–262. [Google Scholar] [CrossRef]
- Rosenzweig, C.; Iglesias, A.; Yang, X.B.; Epstein, P.R.; Chivian, E. Climate change and extreme weather events—Implications for food production, plant diseases, and pests. Glob. Chang. Hum. Health 2001, 2, 90–104. [Google Scholar] [CrossRef]
- Papadavid, G.; Neocleous, D.; Kountios, G.; Markou, M.; Michailidis, A.; Ragkos, A.; Hadjimitsis, D. Using SEBAL to Investigate How Variations in Climate Impact on Crop Evapotranspiration. J. Imaging 2017, 3, 30. [Google Scholar] [CrossRef]
- Fraga, H.; Carcia de Cortázar Atauri, I.; Santos, J.A. Viticulture irrigation demands under climate change scenarios in Portugal. Agric. Water Manag. 2018, 196, 66–74. [Google Scholar] [CrossRef]
- Christou, A.; Dalias, P.; Neocleous, D. Spatial and temporal variations in evapotranspiration and net water requirements of typical Mediterranean crops on the island of Cyprus. J. Agric. Sci. 2017, 155, 1311–1323. [Google Scholar] [CrossRef]
- Barlow, K.M.; Christy, B.P.; OLeary, G.J.; Riffkin, P.A.; Nuttall, J.G. Simulating the impact of extreme heat and frost events on wheat crop production: A review. Field Crops Res. 2015, 171, 109–119. [Google Scholar] [CrossRef]
- Hatfield, J.L.; Prueger, J.H. Temperature extremes: Effect on plant growth and development. Weather Clim. Extremes 2015, 10, 4–10. [Google Scholar] [CrossRef]
- Ali, M.H.; Hoque, M.R.; Hassan, A.A.; Khair, A. Effects of deficit irrigation on yield, water productivity, and economic returns of wheat. Agric. Water Manag. 2007, 92, 151–161. [Google Scholar] [CrossRef]
- Tari, A.F. The effects of different deficit irrigation strategies on yield, quality, and water-use efficiencies of wheat under semi-arid conditions. Agric. Water Manag. 2016, 167, 1–10. [Google Scholar] [CrossRef]
- Allen, R.G.; Pereira, L.S.; Raes, D.; Smith, M. Crop Evapotranspiration—Guidelines for Computing Crop Water Requirements; FAO Irrigation and Drainage Paper No. 56; FAO: Rome, Italy, 1998. [Google Scholar]
- Doorenbos, J.; Pruitt, W.O. Guidelines for Predicting Crop Water Requirements; FAO Irrigation and Drainage Paper No. 24; FAO: Rome, Italy, 1975. [Google Scholar]
- Doorenbos, J.; Kassam, A.H. Yield Response to Water; FAO Irrigation and Drainage Paper No. 33; FAO: Rome, Italy, 1979. [Google Scholar]
- Metochis, C. Irrigation of lucerne under semi-arid conditions in Cyprus. Irrig. Sci. 1980, 1, 247–252. [Google Scholar] [CrossRef]
- Metochis, C. Water requirement, yield and fruit quality of grapefruit irrigated with high-sulphate water. J. Hortic. Sci. 1989, 64, 733–737. [Google Scholar] [CrossRef]
- Capra, A.; Mannino, R. Effects of climate change on the irrigation scheduling parameters in Calabria (south Italy) during 1925–2013. Irrig. Drain. Syst. Eng. 2015, S1, 003. [Google Scholar]
- Brouwer, C.; Prins, K.; Heibloem, M. Irrigation Water Management: Irrigation Scheduling; Training Manual No. 4; FAO: Rome, Italy, 1989. [Google Scholar]
- Karafyllidis, D.I.; Stavropoulos, N.; Georgakis, D. The effect of water stress on the yielding capacity of potato crops and subsequent performance of seed tubers. Potato Res. 1996, 39, 153–163. [Google Scholar] [CrossRef]
- Woznicki, S.A.; Pouyan Nejadhashemi, A.; Parsinejad, M. Climate change and irrigation demand: Uncertainty and adaptation. J. Hydrol. Reg. Stud. 2015, 3, 247–264. [Google Scholar] [CrossRef]
- Doria, R.O.; Madramootoo, C.A. Estimation of irrigation requirements for some crops in southern Quebec using CROPWAT. Irrig. Drain. 2009, 64, 1–11. [Google Scholar]
Figure 1.
Monthly averages for (a) Class A pan evaporation (mm) and (b) effective rainfall over two 24-year periods (1976–2000 and 1990–2014) in Cyprus. Data from 16 meteorological weather stations.
Figure 1.
Monthly averages for (a) Class A pan evaporation (mm) and (b) effective rainfall over two 24-year periods (1976–2000 and 1990–2014) in Cyprus. Data from 16 meteorological weather stations.


Table 1.
p-Values for the comparison of seasonal net irrigation requirements (NIR) between the two periods (1976–2000 and 1990–2014) for selected crops cultivated in Cyprus. Months that are not included in the irrigation period of a crop are indicated by n/a (non-applicable).
Table 1.
p-Values for the comparison of seasonal net irrigation requirements (NIR) between the two periods (1976–2000 and 1990–2014) for selected crops cultivated in Cyprus. Months that are not included in the irrigation period of a crop are indicated by n/a (non-applicable).
| Winter | Spring | Summer | Autumn | |
|---|---|---|---|---|
| Fruit trees (mountains) | n/a | 0.7157 | 0.1989 | 0.0680 |
| Green beans: greenhouse | 0.1132 | 0.6404 | n/a | 0.1973 |
| Haricot beans | n/a | n/a | n/a | 0.0728 |
| Lettuce | 0.6292 | n/a | n/a | 0.1639 |
| Marrows: outside grown | n/a | 0.6714 | 0.1924 | n/a |
| Melons: outside grown | n/a | 0.6714 | 0.1879 | n/a |
| Monkey nuts | n/a | 0.6080 | 0.1667 | 0.0680 |
| Okra (lady´s fingers) | n/a | 0.9315 | 0.1750 | n/a |
| Onions dried | n/a | 0.9814 | 0.5567 | n/a |
| Peas general | n/a | 0.8110 | n/a | n/a |
| Peppers: outside grown | n/a | 0.6533 | 0.1773 | 0.0680 |
| Pistachio | n/a | n/a | 0.1903 | 0.0680 |
| Potatoes (spring crop) | n/a | 0.8070 | n/a | n/a |
| Radish | n/a | 0.0054 | n/a | 0.0959 |
| Spinach | n/a | n/a | n/a | 0.0959 |
| Table grapes | n/a | 0.6484 | 0.5567 | n/a |
| Table olives | n/a | 0.6271 | 0.1953 | 0.0712 |
Table 2.
Crop evapotranspiration (ETc) values in mm of the most water-consuming crops in Cyprus. The upper number for each month indicates the average value for the 1976–2000 period and the lower number indicates the average value for the period 1990–2014. Non-significant differences between these two averages are indicated by n.s. (paired t-test) and significant differences (P < 0.05) by *. Months that are not included in the irrigation period of a crop are indicated by n/a (non-applicable).
| Bananas (Musa spp.) | Citrus (Citrus spp.) | Taro (Colocasia esculenta) | Potatoes (Solanum tuberosum) | |||||
|---|---|---|---|---|---|---|---|---|
| January | n/a | n/a | n/a | n/a | ||||
| February | n/a | n/a | n/a | n/a | ||||
| March | 22.9 | * | 18.3 | * | 32.9 | * | 54.9 | * |
| 23.9 | 19.1 | 34.4 | 57.4 | |||||
| April | 70.0 | n.s. | 65.2 | n.s. | 157.3 | n.s. | 95.9 | n.s. |
| 69.3 | 64.6 | 155.7 | 94.9 | |||||
| May | 116.4 | n.s. | 99.7 | n.s. | 186.3 | n.s. | 130.4 | n.s. |
| 115.9 | 99.2 | 185.5 | 129.8 | |||||
| June | 174.1 | n.s. | 132.3 | n.s. | 378.0 | n.s. | n/a | |
| 173.1 | 131.6 | 375.9 | ||||||
| July | 219.4 | n.s. | 138.3 | n.s. | 448.3 | n.s. | n/a | |
| 214.6 | 135.3 | 438.5 | ||||||
| August | 231.8 | n.s. | 176.0 | n.s. | 452.0 | n.s. | n/a | |
| 227.2 | 172.5 | 443.1 | ||||||
| September | 195.5 | n.s. | 119.4 | n.s. | 365.9 | n.s. | n/a | |
| 189.0 | 115.5 | 353.8 | ||||||
| October | 123.5 | n.s. | 52.7 | n.s. | 153.2 | n.s. | n/a | |
| 119.7 | 51.0 | 148.5 | ||||||
| November | 49.2 | n.s. | 9.6 | n.s. | 135.0 | n.s. | n/a | |
| 47.9 | 9.4 | 131.5 | ||||||
| December | n/a | n/a | n/a | n/a | ||||
Table 3.
Net irrigation requirements (NIR) values in mm of the most water-consuming crops in Cyprus. The upper number for each month indicates the average value for the 1976–2000 period and the lower number the average value for the period 1990–2014. Non-significant differences between these two averages are indicated by n.s. (paired t-test) and significant differences (p < 0.05) by *. Months that are not included in the irrigation period of a crop are indicated by n/a (non-applicable).
| Bananas (Musa spp.) | Citrus (Citrus spp.) | Taro (Colocasia esculenta) | Potatoes (Solanum tuberosum) | |||||
|---|---|---|---|---|---|---|---|---|
| January | n/a | n/a | n/a | n/a | ||||
| February | n/a | n/a | n/a | n/a | ||||
| March | 8.1 | * | 5.0 | * | 15.4 | * | 34.5 | * |
| 13.2 | 8.1 | 21.3 | 39.9 | |||||
| April | 64.7 | n.s. | 59.5 | n.s. | 157.7 | n.s. | 92.3 | n.s. |
| 64.5 | 59.4 | 156.6 | 91.8 | |||||
| May | 119.5 | n.s. | 101.6 | n.s. | 194.0 | n.s. | 134.4 | n.s. |
| 117.9 | 100.0 | 192.0 | 132.7 | |||||
| June | 182.1 | n.s. | 137.5 | n.s. | 399.6 | n.s. | n/a | |
| 181.2 | 136.9 | 397.6 | ||||||
| July | 218.4 | n.s. | 137.3 | n.s. | 447.3 | n.s. | n/a | |
| 213.0 | 133.7 | 436.9 | ||||||
| August | 231.5 | n.s. | 175.7 | n.s. | 451.7 | n.s. | n/a | |
| 226.1 | 171.4 | 442.0 | ||||||
| September | 194.6 | * | 118.5 | * | 365.0 | * | n/a | |
| 186.7 | 113.2 | 351.5 | ||||||
| October | 120.0 | n.s. | 44.4 | n.s. | 151.7 | n.s. | n/a | |
| 118.2 | 45.0 | 148.9 | ||||||
| November | 20.1 | n.s. | n/a | n.s. | 107.9 | n.s. | n/a | |
| 20.3 | 107.5 | |||||||
| December | n/a | n/a | n/a | n/a | ||||
© 2018 by the authors. Licensee MDPI, Basel, Switzerland. This article is an open access article distributed under the terms and conditions of the Creative Commons Attribution (CC BY) license (http://creativecommons.org/licenses/by/4.0/).
Share and Cite
MDPI and ACS Style
Dalias, P.; Christou, A.; Neocleous, D. Adjustment of Irrigation Schedules as a Strategy to Mitigate Climate Change Impacts on Agriculture in Cyprus. Agriculture 2019, 9, 4. https://0-doi-org.brum.beds.ac.uk/10.3390/agriculture9010004
AMA Style
Dalias P, Christou A, Neocleous D. Adjustment of Irrigation Schedules as a Strategy to Mitigate Climate Change Impacts on Agriculture in Cyprus. Agriculture. 2019; 9(1):4. https://0-doi-org.brum.beds.ac.uk/10.3390/agriculture9010004
Chicago/Turabian StyleDalias, Panagiotis, Anastasis Christou, and Damianos Neocleous. 2019. "Adjustment of Irrigation Schedules as a Strategy to Mitigate Climate Change Impacts on Agriculture in Cyprus" Agriculture 9, no. 1: 4. https://0-doi-org.brum.beds.ac.uk/10.3390/agriculture9010004
Note that from the first issue of 2016, this journal uses article numbers instead of page numbers. See further details here.