Agricultural Biodiversity and Ecosystem Services of Major Farming Systems: A Case Study in Yayo Coffee Forest Biosphere Reserve, Southwestern Ethiopia


Abstract
:1. Introduction
2. Materials and Methods
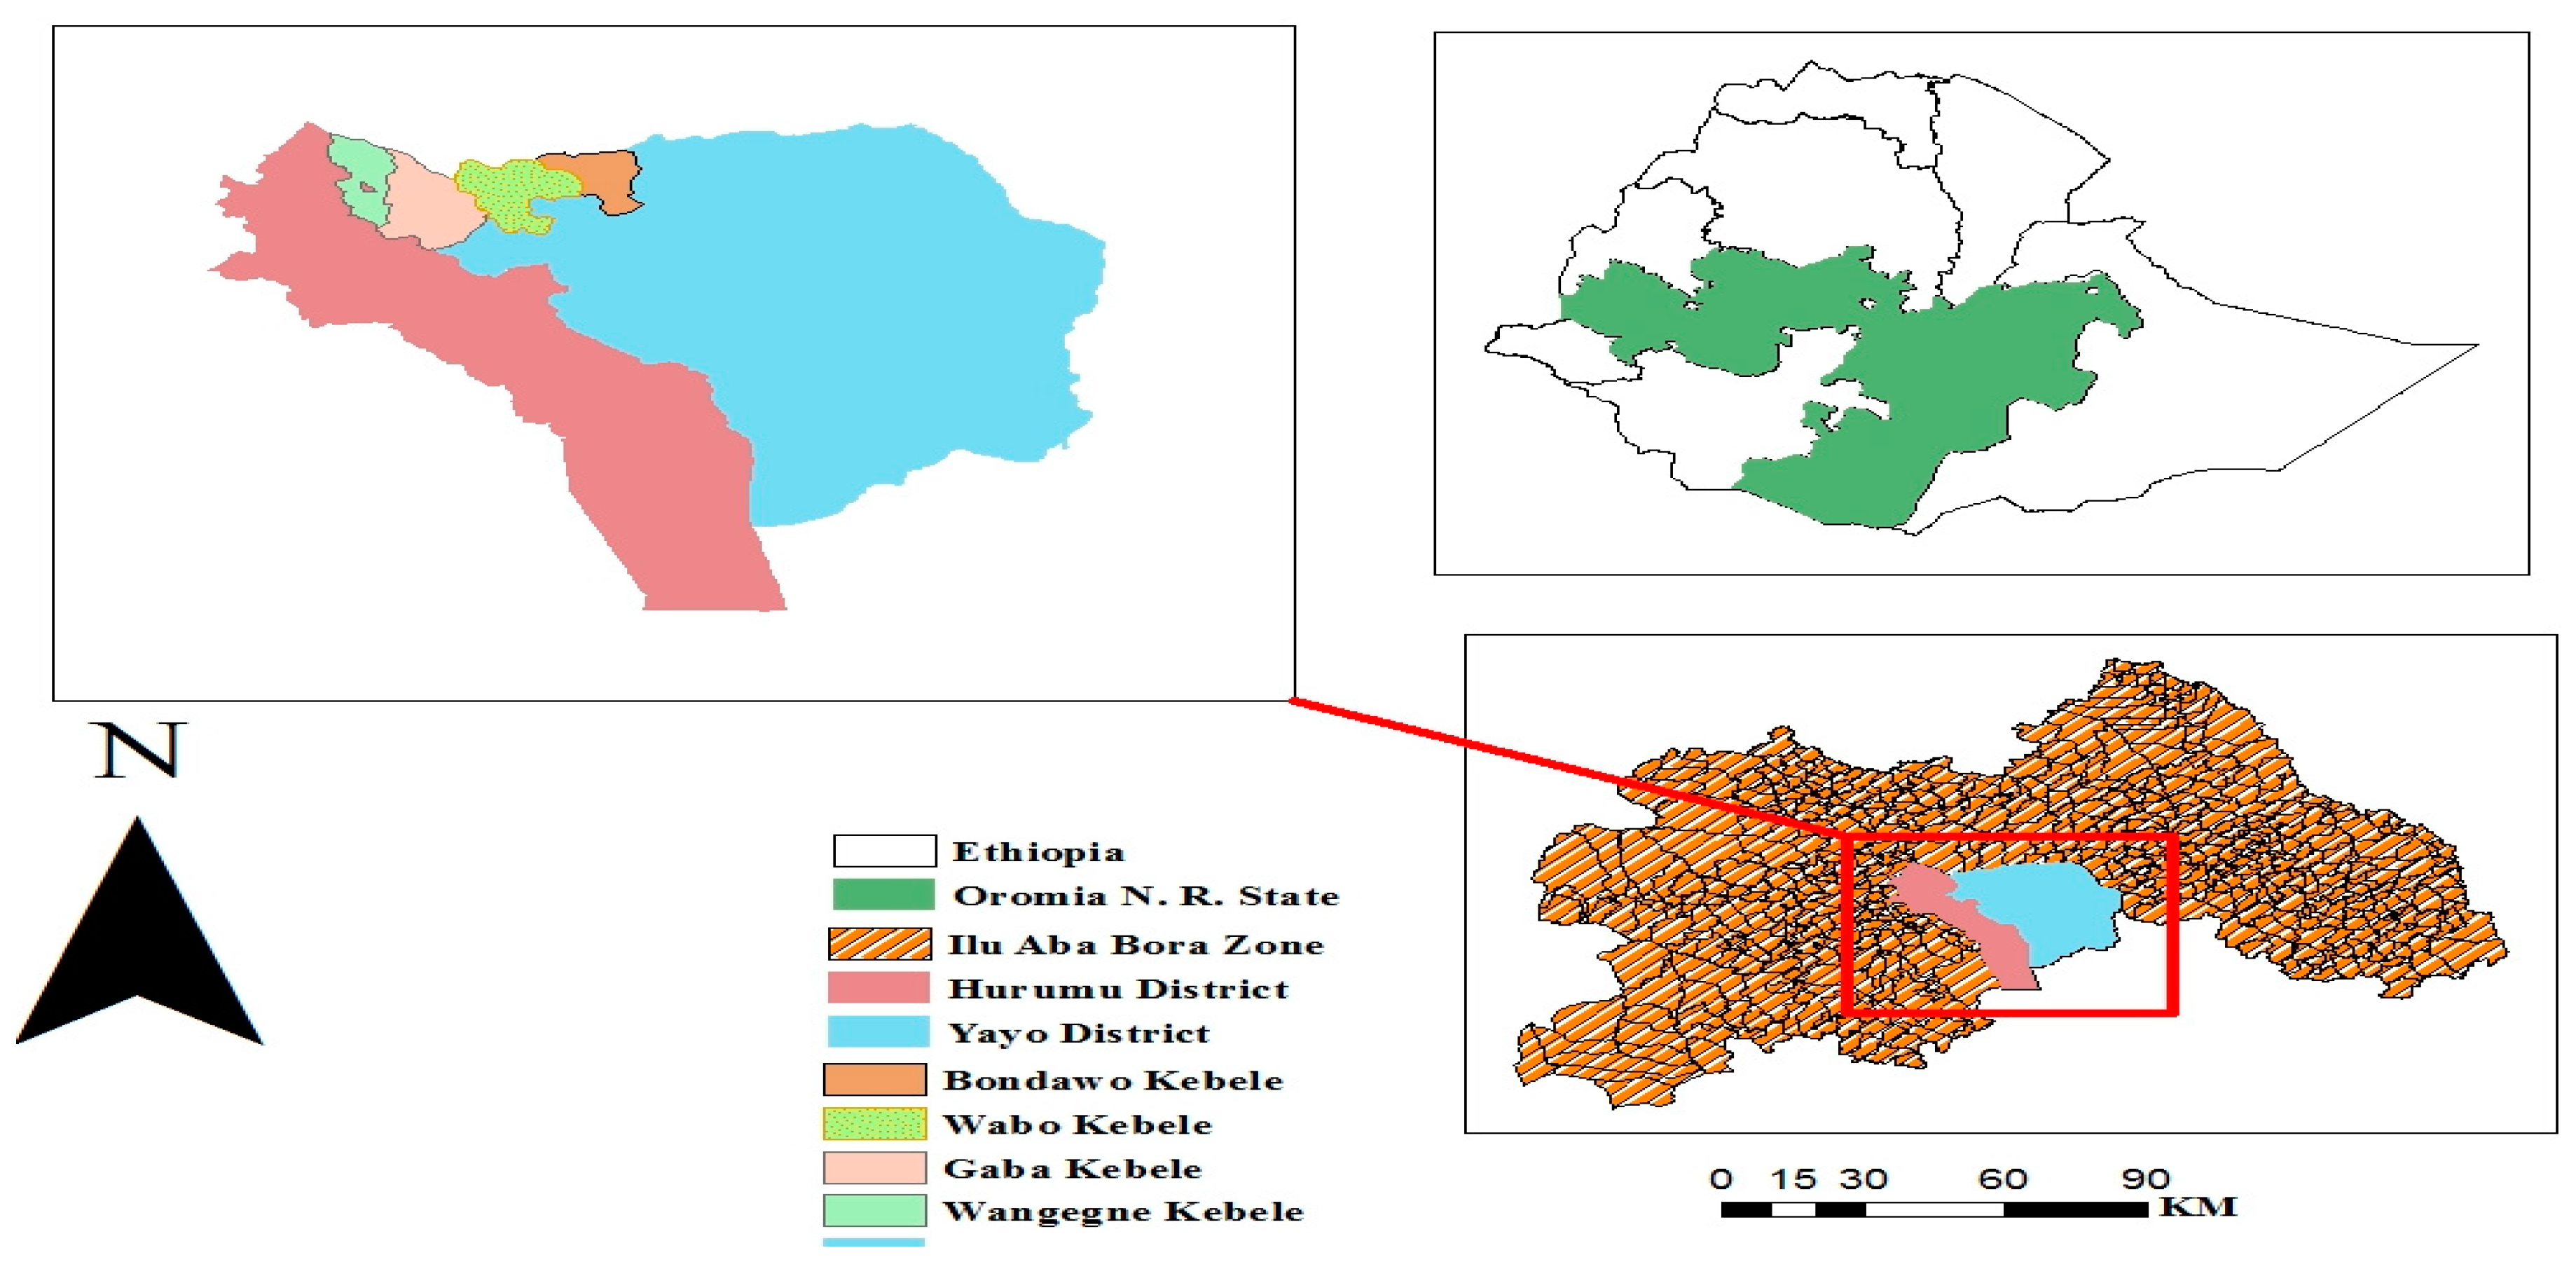
2.1. Description of the Study Area
2.2. Identification of Farming Systems
2.3. Assessments of Species Diversity
2.4. Assessment of Status and Trends of Ecosystem Service Provisioning
2.5. Collection of Supporting and Checkup Information
3. Results and Discussion
3.1. Major Farming Systems
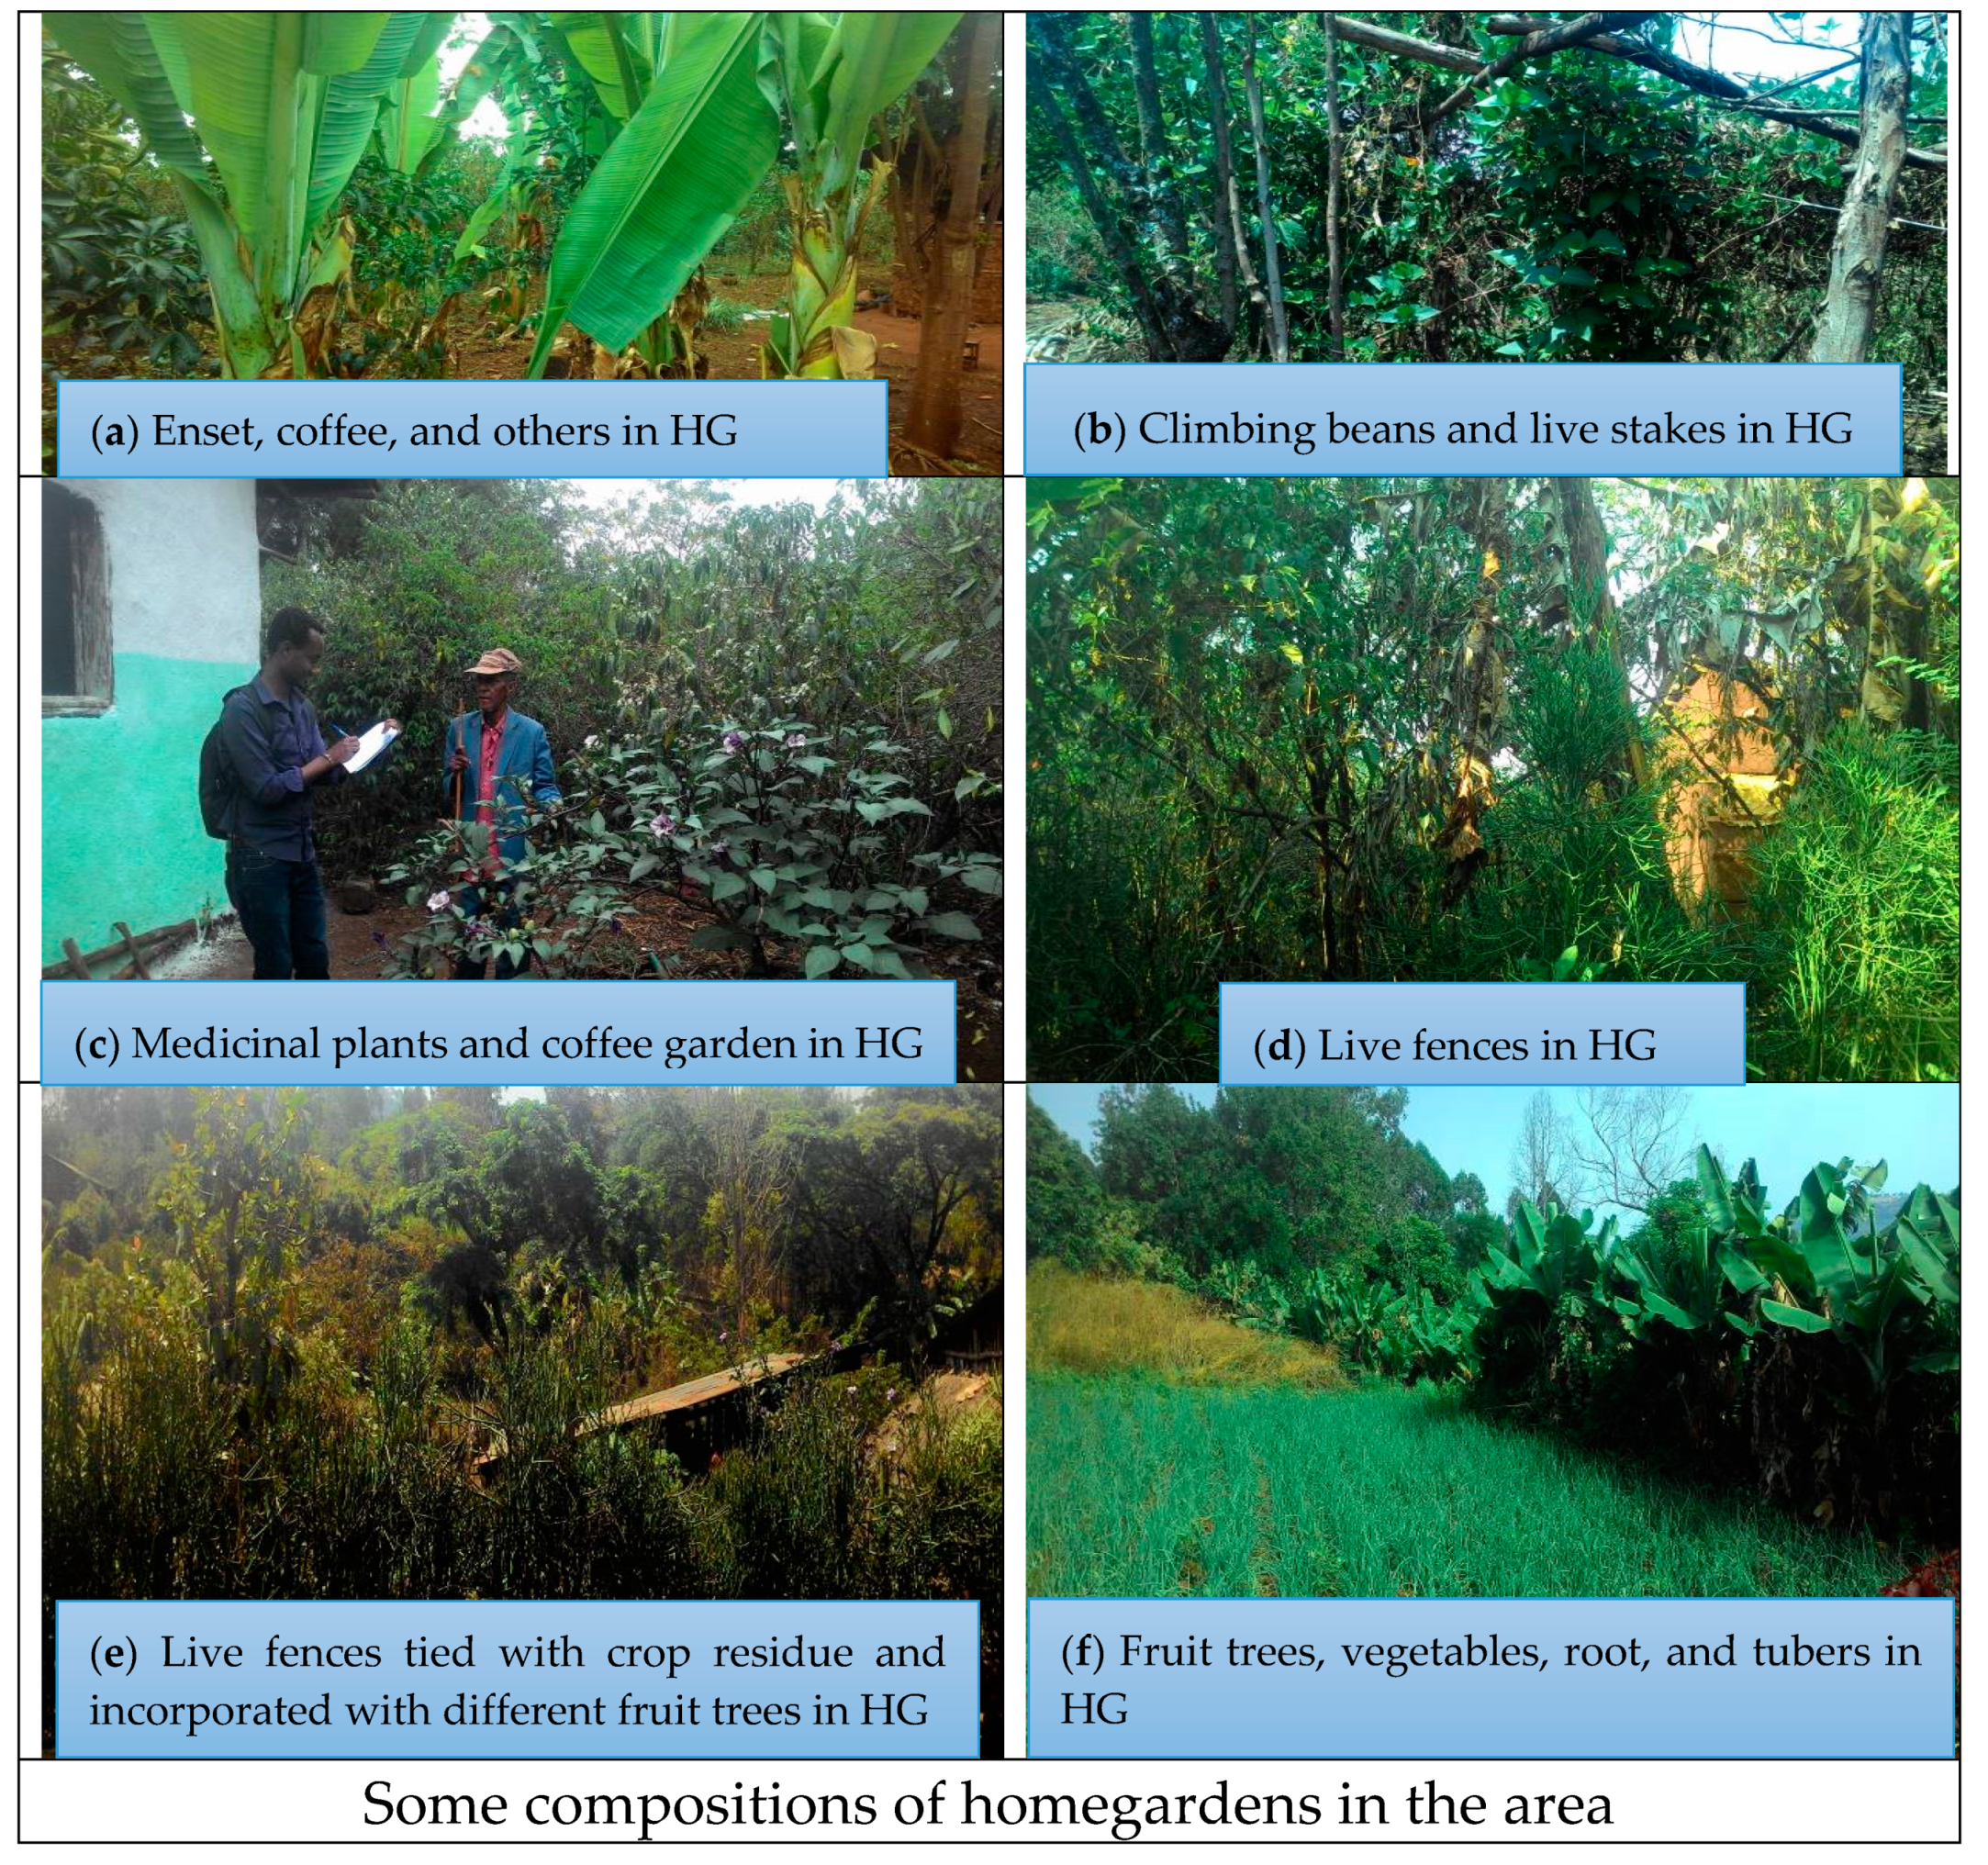
3.1.1. Homegarden Agroforestry System
3.1.2. Plantation Coffee System (PC)
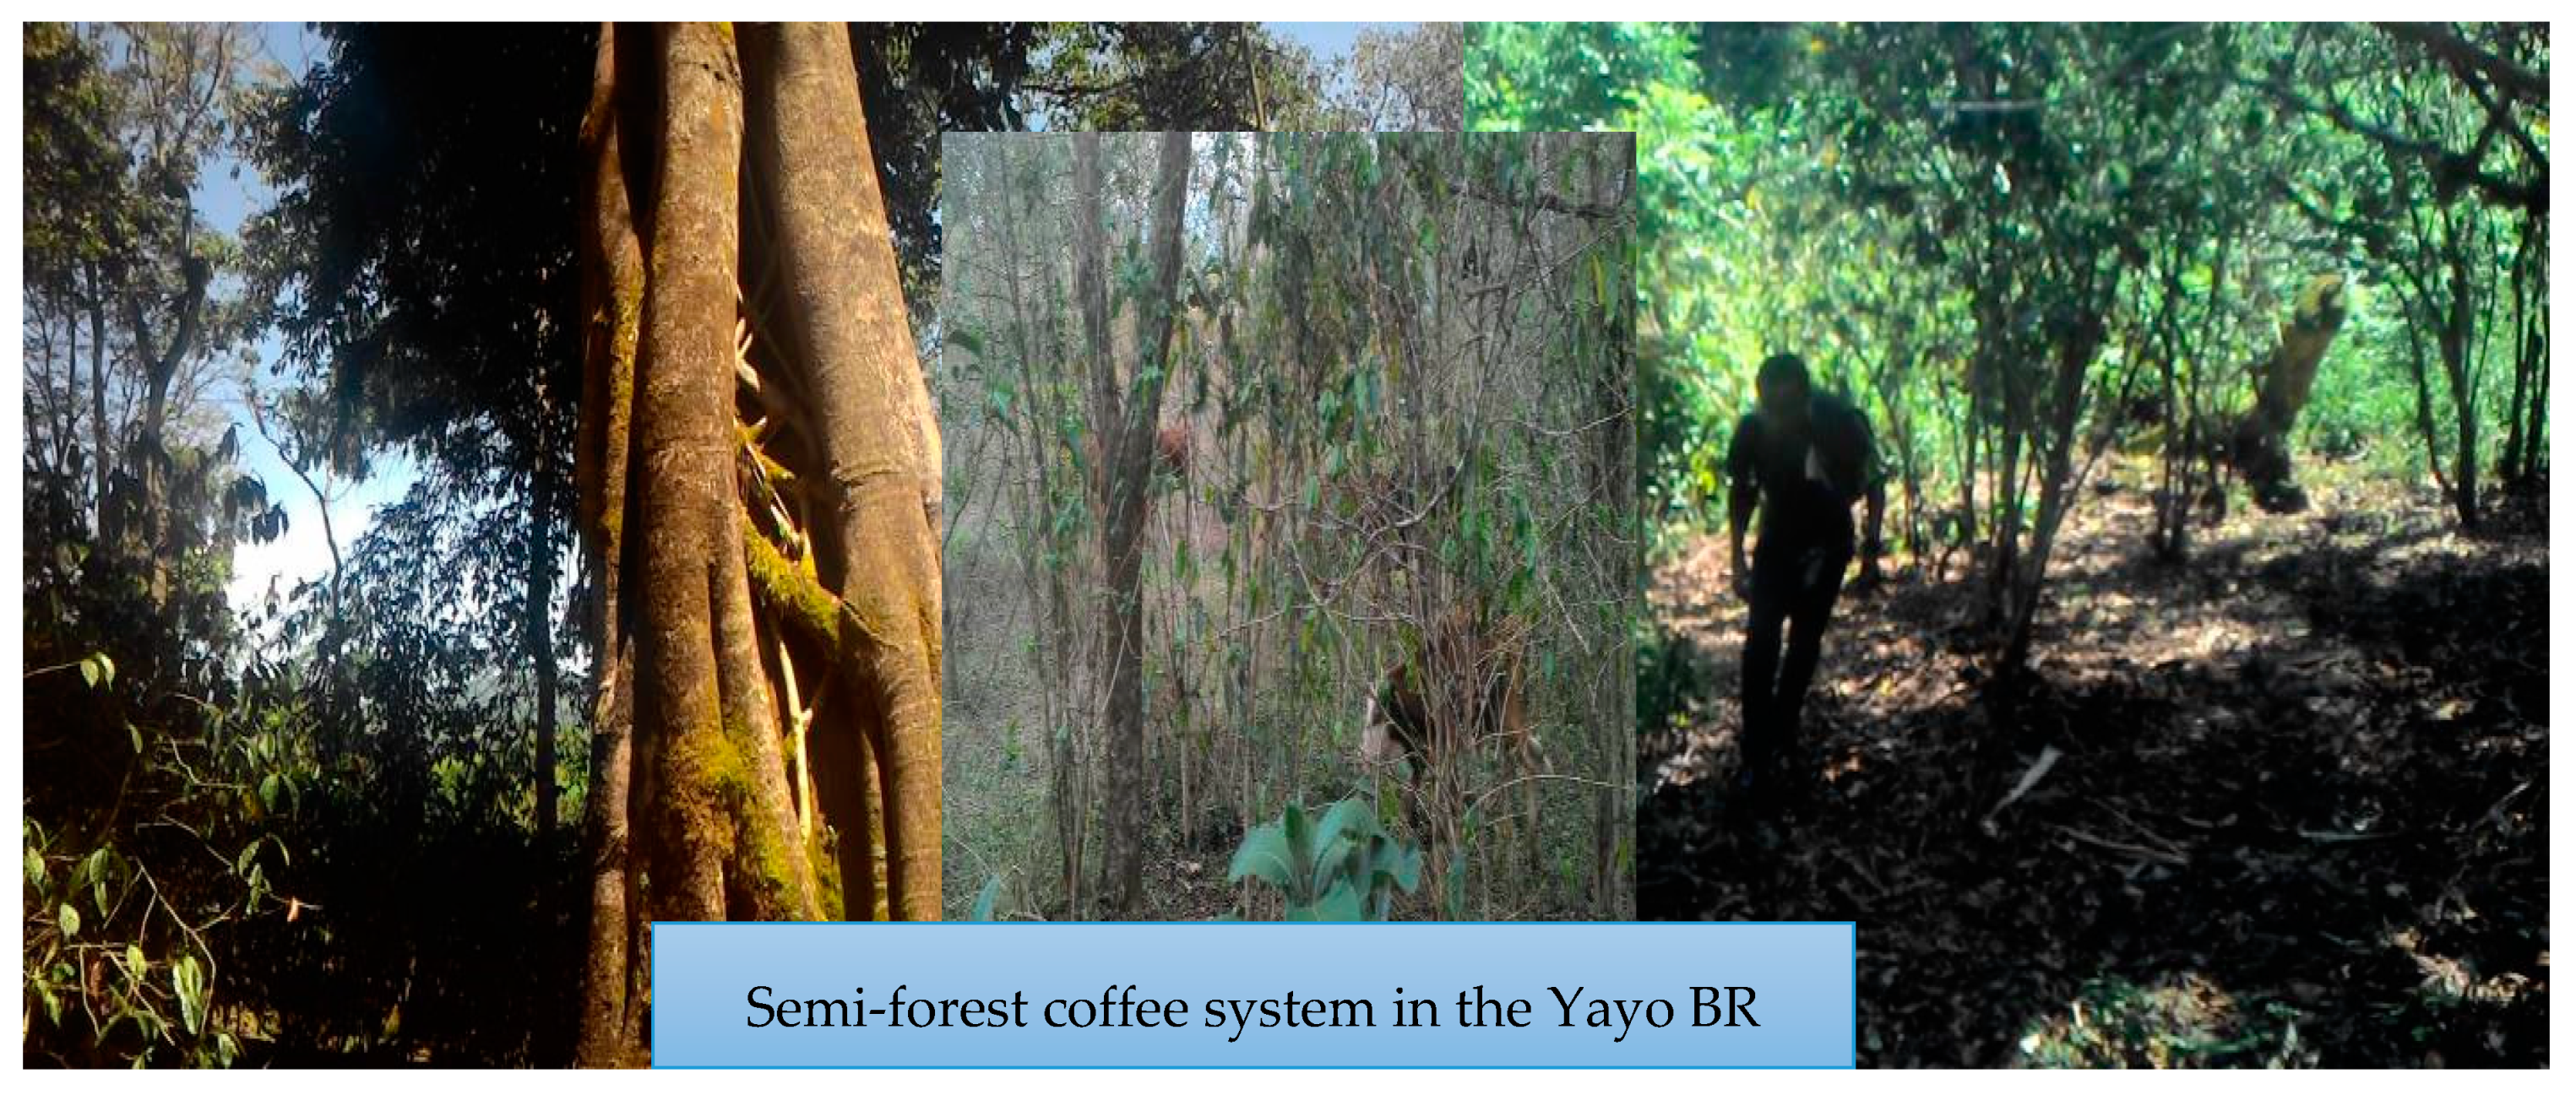
3.1.3. Semi-Forest Coffee Production System (SFCS)
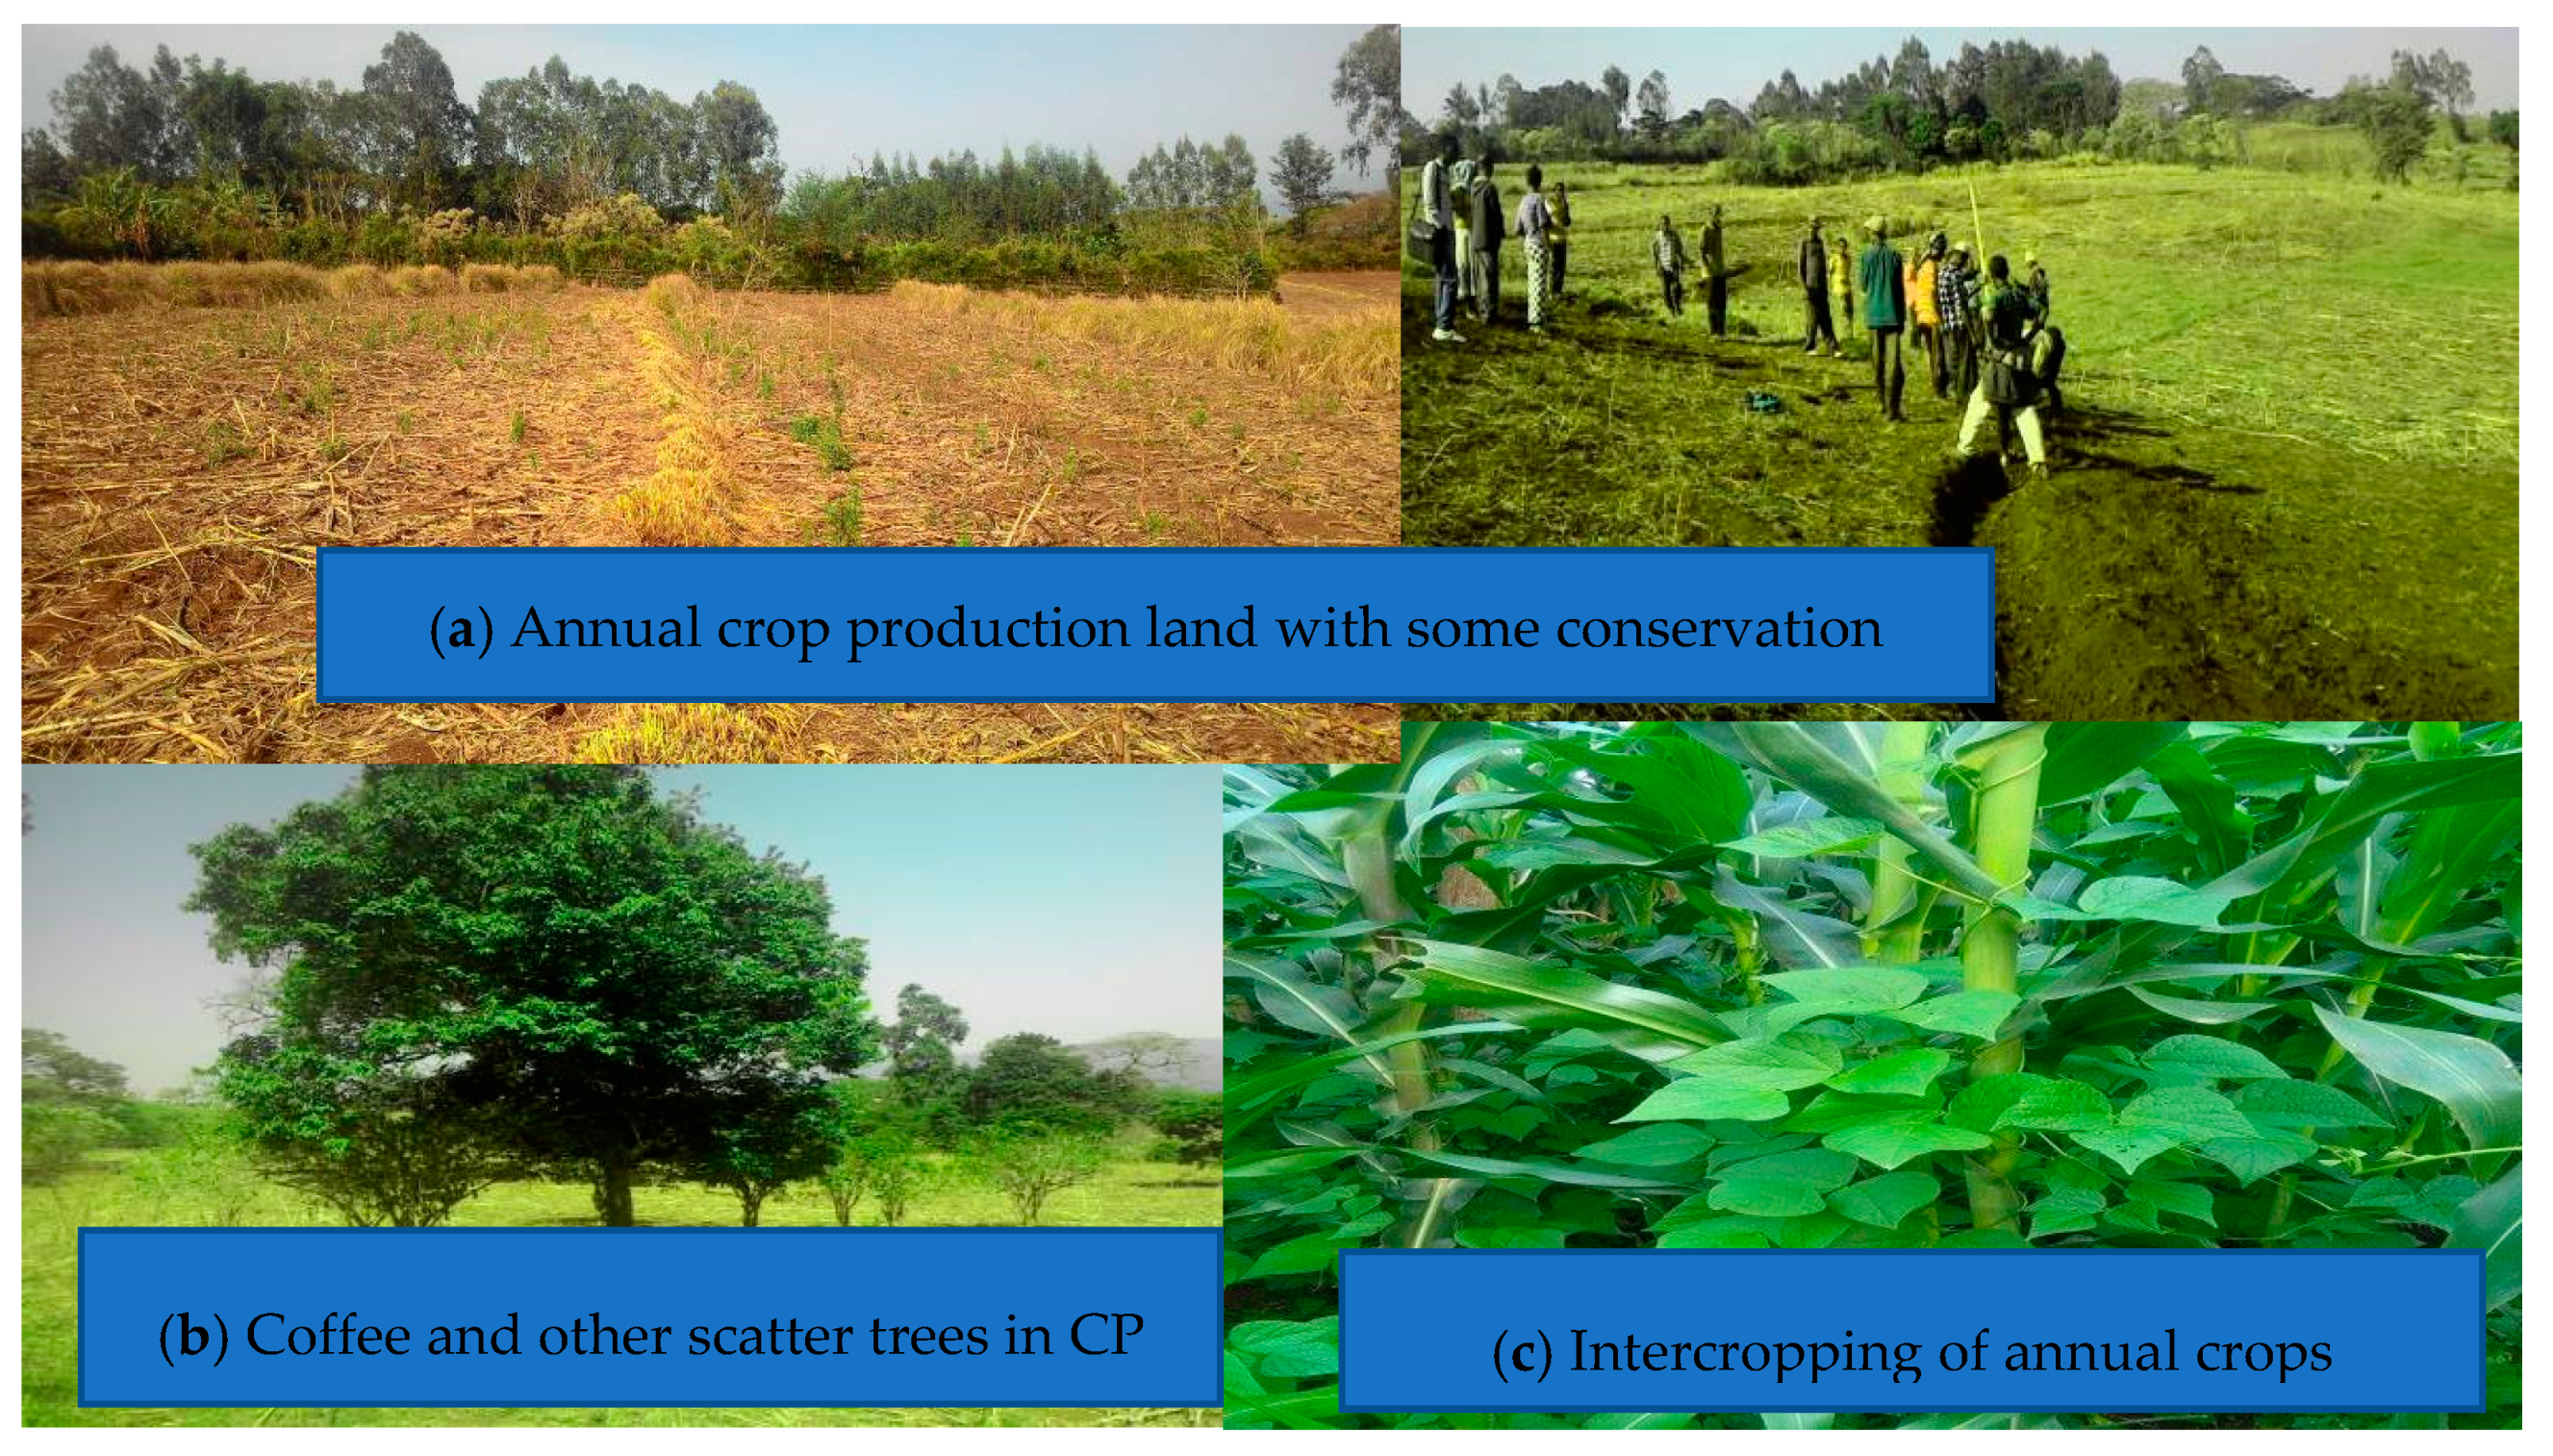
3.1.4. Annual Crop Production Systems
3.2. Agro-Biodiversity within the Major Farming Systems
Species Compositions and Diversity Indices of the Farming Systems
3.3. Mapping of Ecosystem Services of the Major Farming Systems
3.4. Ecosystem Services and Their Temporal Trends of the Major Farming Systems
3.5. Links of Agro-Biodiversity and Ecosystem Services in the Major Farming Systems
4. Conclusions and Recommendations
Author Contributions
Funding
Acknowledgments
Conflicts of Interest
Appendix A. Data Collection Formats/Sheets

| Year | Major Farming Systems | Types of Ecosystem Services | ||||||||||||||
| Provision Services | Regulation | Cultural | Supporting | |||||||||||||
| 1, Food production 2, Biodiversity/Genetic resources 3, Water (drinking, cooking, Irrigation) 4, Fuelwood and Timber 5, Fodder 6, Natural medicines | 1, Climate regulation 2, Erosion protection 3, Water purification | 1, Spiritual values 2, Aesthetic values 3, Educational values 4, Recreation and Ecotourism values | 1, Soil formation 2, Habitat provision | |||||||||||||
| A | B | C | D | E | F | G | H | I | J | K | L | M | N | O | ||
| 1987–1996 G.C | Homegarden AF | |||||||||||||||
| Plantation Coffee | ||||||||||||||||
| Semi-Forest Coffee Systems (SFCS) | ||||||||||||||||
| Annual Croplands | ||||||||||||||||
| Year | Major Farming Systems | Types of Ecosystem Services | ||||||||||||||
| Provision services | Regulation | Cultural | Supporting | |||||||||||||
| 1, Food production 2, Biodiversity/Genetic resources 3, Water (drinking, cooking, Irrigation) 4, Fuelwood and Timber 5, Fodder 6, Natural medicines | 1, Climate regulation 2, Erosion protection 3, Water purification | 1, Spiritual values 2, Aesthetic values 3, Educational values 4, Recreation and Ecotourism values | 1, Soil formation 2, Habitat provision | |||||||||||||
| A | B | C | D | E | F | G | H | I | J | K | L | M | N | O | ||
| 1997–2006 G.C | Homegarden AF | |||||||||||||||
| Plantation Coffee | ||||||||||||||||
| Semi-Forest Coffee Systems (SFCS) | ||||||||||||||||
| Annual Croplands | ||||||||||||||||
| Year | Major Farming Systems | Types of Ecosystem Services | ||||||||||||||
| Provision services | Regulation | Cultural | Supporting | |||||||||||||
| 1, Food production 2, Biodiversity/Genetic resources 3, Water (drinking, cooking, Irrigation) 4, Fuelwood and Timber 5, Fodder 6, Natural medicines | 1, Climate regulation 2, Erosion protection 3, Water purification | 1, Spiritual values 2, Aesthetic values 3, Educational values 4, Recreation and Ecotourism values | 1, Soil formation 2, Habitat provision | |||||||||||||
| A | B | C | D | E | F | G | H | I | J | K | L | M | N | O | ||
| 2007 –2016 G.C | Homegarden AF | |||||||||||||||
| Plantation Coffee | ||||||||||||||||
| Semi-Forest Coffee Systems (SFCS) | ||||||||||||||||
| Annual Croplands | ||||||||||||||||
| S. Number. | Local Name/s of the Plant/Crop Species | Scientific Name | Family Name | Plant/Crop Typology 1. Fruit trees 2. Timber trees 3. Forage 4. Shade trees 5. Root and tuber 6. Vegetables 7. Pulse 8. Cereals 9. Others, specify | Purpose of the Plants/Crops in the System: 1. Food 2. Medicine 3. Fuelwood 4. Construction 5. Fodder 6. Soil conservation 7. Income generation 8. Others: 9. Shade | Abundance of the species in the system |
|---|---|---|---|---|---|---|
| 1 | Abiraangoo | 6. Vegetables | 1 and 2 | 13 | ||
| 2 | Ancootee | Coccinia abyssinica | Cucurbitaceae | 5. Root and tuber | 1 and 7 | 49 |
| 3 | Avokaadoo | Persea americana | Lauraceae | 1. Fruit trees | 1 and 7 | 22 |
| 4 | Baargamoo | Eucalyptus camaldulensis | Myrtaceae | 2. Timber trees | 3 and 4 | 57 |
| 5 | Baqarii/Kefii | Salvia nilotica | Lamiaceae | 9. Spice | 8. spice | 12 |
| 6 | Barbaree | Capsicum annuum | Solanaceae | 9. Spice | 1, 7, and 8 | 30 |
| 7 | Bassoobilaa | Ocimum americanum | Lamiaceae | 9. Spice | 8. spice | 11 |
| 8 | Boqqolloo | Zea mays | Poaceae | 8. Cereals | 1. Food | 221 |
| 9 | Buna | Coffea arabica | Rubiaceae | 9. Cash crop | 1 and 7 | 219 |
| 10 | Burtukaana | Citrus sinensis | Rutaceae | 1. Fruit trees | 1 and 7 | 7 |
| 11 | Caatii | Catha edulis | Celastraceae | 9. Cash crop | 7. Income generation | 218 |
| 12 | Cadaa | Euphorbia tirucalli | Euphorbiaceae | 9. Shrub | 8. live fence | 64 |
| 13 | Dabaaqula/Buqqee | Cucurbita pepo | Cucurbitaceae | 6. Vegetables | 1. Food | 16 |
| 14 | Dafee/Boloqqee | Phaseolus vulgaris | Fabaceae | 7. Pulse | 1. Food | 410 |
| 15 | Dinnicha Oromoo | Plectranthus edulis | Lamiaceae | 5. Root and tuber | 1. Food | 5 |
| 16 | Eebicha | Vernonia amygdalina/schimperi | Asteraceae | 3. Forage | 2, 3, 5, and 6 | 45 |
| 17 | Geeshoo | Rhamnus prinoides | Rhamnaceae | 9. Shrub | 1 and 7 | 6 |
| 18 | Goodarree | Colocasia esculenta | Araceae | 5. Root and tuber | 1. Food | 50 |
| 19 | Giraaviiliyaa | Grevillea robusta | Proteaceae | 2. Timber trees | 3 and 4 | 24 |
| 20 | Harangamaa | Maerua aethiopica | Capparidaceae | 9. Climber | 8. Live fence | 16 |
| 21 | Hundee diimaa | Beta vulgaris | Chenopodiaceae | 5. Root and tuber | 1 and 7 | 20 |
| 22 | Indoodee | Phytolacca dodecandra | Phytolaccaceae | 9. Climber | 2 and 6 | 3 |
| 23 | Irdii | Curcuma domestica | Zingiberaceae | 9. Spice | 8. Spice | 20 |
| 24 | Kaarotii | Daucus carota | Apiaceae | 5. Root and tuber | 1 and 7 | 8 |
| 25 | Kaashimiirii | Conyza stricta | Asteraceae | 1. Fruit trees | 1 and 7 | 9 |
| 26 | Kookii | Prunus persica | Rosacaea | 1. Fruit trees | 1 and 7 | 10 |
| 27 | Korchii | Erythrina abyssinica | Fabaceae | 9. Shrub | 2, 3, and 4 | 6 |
| 28 | Loomii | Citrus aurantifolia | Rutaceae | 1. Fruit trees | 1, 2, and 7 | 6 |
| 29 | Maangoo | Mangifera indica | Anacardiaceae | 1. Fruit trees | 1 and 7 | 29 |
| 30 | Marga Veetiivaar | 9. Grass | 6. Soil conservation | 31 | ||
| 31 | Mishingaa | Sorghum bicolor | Poaceae | 8. Cereals | 1. Food | 38 |
| 32 | Mixaaxisa | Ipomoea batatas | Convolvulaceae | 5. Root and tuber | 1 and 7 | 19 |
| 33 | Muuzii | Musa acuminata | Musaceae | 1. Fruit trees | 1 and 7 | 56 |
| 34 | Paappayyaa | Carica papaya | Caricaceae | 1. Fruit trees | 1 and 7 | 11 |
| 35 | Qobboo | Ricinus communis | Euphorbiaceae | 7. Pulse | 3 and 7 | 15 |
| 36 | Qoccinee | 9. Climber | 1. Food | 3 | ||
| 37 | Qoccoo/Enset | Ensete ventricosum | Musaceae | 5. Root and tuber | 1. Food | 197 |
| 38 | Qoricha bofaa | 9. Shrub | 2. Medicine | 6 | ||
| 39 | Qullubbii | Allium sativum | Alliaceae | 9. Spice | 2, 7, and 8. Spice | 31 |
| 40 | Raafuu Habashaa | Brassica carinata | Brassicaceae | 6. Vegetables | 1. Food | 151 |
| 41 | Raafuu Maraa | Brassica oleracea | Brassicaceae | 6. Vegetables | 1 and 7 | 56 |
| 42 | Rigaa arbaa | Bridelia micrantha | Euphorbiaceae | 9. Shrub | 3. Fuelwood | 4 |
| 43 | Sasbaaniyaa | Sesbania sesban | Fabaceae | 9. Shrub | 3 and 6 | 32 |
| 44 | Shonkoora Agadaa | Saccharum officinarum | Poaceae | 9. Industrial crop | 1 and 7 | 146 |
| 45 | Shunkurtii | Allium cepa | Alliaceae | 9. Spice | 1 and 7 | 16 |
| 46 | Turungoo | Citrus medica | Rutaceae | 1. Fruit trees | 1 and 7 | 3 |
| 47 | Waddeessa | Cordia africana | Boraginaceae | 2. Timber trees | 3, 4, and 7 | 8 |
| 48 | Xeenaaddaam | Ruta chalepensis | Rutaceae | 9. Spice | 2. Medicine | 14 |
| 49 | Zayituunaa | Psidium guajava | Myrtaceae | 1. Fruit trees | 1. Food | 5 |
| 50 | Zinjibila | Zingiber officinale | Zingiberaceae | 9. Spice | 2, 7, and 8. Spice | 72 |
| S. Number | Local Name/s of the Plant/Crop Species | Scientific Name | Family Name | Plant/Crop Typology 1. Fruit trees 2. Timber trees 3. Forage 4. Shade trees 5. Root and tuber 6. Vegetables 7. Pulse 8. Cereals 9. Others, specify | Purpose of the Plants/Crops in the System: 1. Food 2. Medicine 3. Fuelwood 4. Construction 5. Fodder 6. Soil conservation 7. Income generation 8. Others 9. Shade | Abundance of the species in the system |
|---|---|---|---|---|---|---|
| 1 | Abbayyii | Maesa lanceolata | Myrsinaceae | 4. Shade trees | 2, 3, 5, and 6 | 7 |
| 2 | Baargamoo Diimaa | Eucalyptus camaldulensis | Myrtaceae | 2. Timber trees | 3, 4, and 7 | 9 |
| 3 | Bakkanniisa | Croton macrostachyus | Euphorbiaceae | 4. Shade trees | 2, 6, and 9 | 13 |
| 4 | Buna | Coffea arabica | Rubiaceae | 9. Cash crop | 1 and 7 | 965 |
| 5 | Ceekaa | Calpurnia aurea | Fabaceae | 9. Shrub | 3. Fuelwood | 9 |
| 6 | Dambii | Ficus thonningii | Moraceae | 4. Shade trees | 3, 4, 5, and 6 | 3 |
| 7 | Dhummuugaa | Justicia schimperiana | Acanthaceae | 9. Shrub | 2, 3, 4, and 6 | 6 |
| 8 | Eebicha | Vernonia amygdalina | Asteraceae | 3. Forage | 2, 3, 5, and 6 | 20 |
| 9 | Gatamaa/Gagamaa | Olea welwitschii | Oleaceae | 2. Timber trees | 2, 3, 4, and 9 | 1 |
| 10 | Geeshoo | Rhamnus prinoides | Rhamnaceae | 9. Shrub | 1 and 7 | 5 |
| 11 | Gizaawwaa | Withania somnifera | Solanaceae | 9. Shrub | 2 and 3 | 14 |
| 12 | Giraaviiliiyaa/Muka qawwee | Grevillea robusta | Proteaceae | 2. Timber trees | 2, 3, 4, 7, and 9 | 4 |
| 13 | Harbuu | Ficus sur | Moraceae | 4. Shade trees | 1, 3, and 5 | 3 |
| 14 | Hoomii | Prunus africana | Rosaceae | 2. Timber trees | 2, 3, 4, and 7 | 2 |
| 15 | Indoodee | Phytolacca dodecandra | Phytolaccaceae | 9. Climber | 2 and 8, purification | 2 |
| 16 | Laaftoo | Acacia sieberiana | Fabaceae | 4. Shade trees | 3, 4, 5, 6, and 9 | 15 |
| 17 | Mukarbaa/Ambabbeessa | Albizia gummifera | Fabaceae | 4. Shade trees | 9. Shade | 12 |
| 18 | oogiwoo/koroolimaa | Ethiopian candimon | 9. Spice | 7 and 8. Spice | 41 | |
| 19 | Oobdaa | Ficus vasta | Moraceae | 4. Shade trees | 3, 5, 6, and 9 | 5 |
| 20 | Qararoo | Acokanthera schimperi | Apocynaceae | 2. Timber trees | 3 and 4 | 9 |
| 21 | Qolaadii | Mimusops kummel | Sapotaceae | 4. Shade trees | 3, 4, and 9 | 4 |
| 22 | Qomanyoo | Brucea antidysenterica | Simaroubaceae | 9. Shrub | 2 and 3 | 1 |
| 23 | Reejjii | Vernonia rueppellii | Asteraceae | 4 and 9. Shrub | 3, 6, and 9 | 36 |
| 24 | Sesbania | Sesbania sesban | Fabaceae | 9. Shrub | 3, 4, 5, 6, and 9 | 42 |
| 25 | Sondii | Acacia lahai | Fabaceae | 4. Shade trees | 3, 4, 5, 6, and 9 | 5 |
| 26 | Sootalloo | Millettia ferruginea | Fabaceae | 4. Shade trees | 2, 3, and 6 | 6 |
| 27 | Ulaagaa | Ehretia cymosa | Boraginaceae | 4. Shade trees | 2, 3, and 4 | 6 |
| 28 | Waddeessa | Cordia africana | Boraginaceae | 2 and 4 | 3, 4, 5, 7, and 9 | 12 |
| S. Number | Local Name/s of the Plant/Crop Species | Scientific Name | Family Name | Plant/Crop Typology 1. Fruit trees 2. Timber trees 3. Forage 4. Shade trees 5. Root and tuber 6. Vegetables 7. Pulse 8. Cereals 9. Others, specify | Purpose of the Plants/Crops in the System: 1. Food 2. Medicine 3. Fuelwood 4. Construction 5. Fodder 6. Soil conservation 7. Income generation 8. Others 9. Shade | Abundance of the species in the system |
|---|---|---|---|---|---|---|
| 1 | Abbayyii | Maesa lanceolata | Myrsinaceae | 4. Shade trees | 2, 3, 5, and 6 | 5 |
| 2 | Agamsa | Carissa spinarum | Apocynaceae | 9. Shrub, climber | 1, 3, and 5 | 13 |
| 3 | Akuukkuu | Oncoba spinosa | Flacourtiaceae | 4. Shade trees | 3. Fuelwood | 10 |
| 4 | Alalee | Albizia grandibracteata | Fabaceae | 4. Shade trees | 3, 4, and 6 | 5 |
| 5 | Alaltuu | Salix subserrata | Salicaceae | 9. Shrub | 3 and 4 | 8 |
| 6 | Ambabbeessa/mukarbaa | Albizia gummifera | Fabaceae | 4. Shade trees | 9. Shade | 13 |
| 7 | Ambaltaa | Entada abyssinica | Fabaceae | 4. Shade trees | 2, 3, and 6 | 7 |
| 8 | Baddannoo | Balanites aegyptiaca | Balanitaceae | 2. Timber trees | 1, 2, 3, and 4 | 3 |
| 9 | Baddeessaa | Syzygium guineense | Myrtaceae | 2. Timber trees | 1, 3, and 4 | 4 |
| 10 | Bahaa | Strychnos spinosa | Loganiaceae | 4. Shade trees | 3, 4, 5, 6, and 9 | 6 |
| 11 | Bakkanniisa | Croton macrostachyus | Euphorbiaceae | 4. Shade trees | 2, 6, and 9 | 22 |
| 12 | Bosoqa | Sapium ellipticum | Euphorbiaceae | 2. Timber trees | 3, 5, 6, and 9 | 4 |
| 13 | Botoroo | Stereospermum kunthianum | Bignoniaceae | 9. Shrub | 3. Fuelwood | 13 |
| 14 | Buna | Coffea arabica | Rubiaceae | 9. Cash crop | 1 and 7 | 1018 |
| 15 | Burquqqee | Acacia nilotica | Fabaceae | 9. Shrub | 3. Fuelwood | 9 |
| 16 | Cayii | Celtis africana | Ulmaceae | 2. Timber trees | 3 and 4 | 2 |
| 17 | Ceekaa | Calpurnia aurea | Fabaceae | 9. Shrub | 3. Fuelwood | 85 |
| 18 | Dambii | Ficus thonningii | Moraceae | 4. Shade trees | 3, 5, and 6 | 6 |
| 19 | Dhangaggoo | Rhoicissus tridentata | Vitaceae | 9. Herb | 1 and 6 | 32 |
| 20 | Dhoqonuu | Grewia ferruginea | Tiliaceae | 9. Shrub, climber | 4. Construction | 16 |
| 21 | Doggomaa | Croton macrostachyus | Euphorbiaceae | 2. Timber trees | 3 and 4 | 4 |
| 22 | Doqoo | 2. Timber trees | 3, 4, and 9 | 3 | ||
| 23 | Gatamaa/Gagamaa | Olea welwitschii | Oleaceae | 2. Timber trees | 2, 3, 4, and 9 | 2 |
| 24 | Geeshoo | Rhamnus prinoides | Rhamnaceae | 9. Shrub | 1 and 7 | 6 |
| 25 | Gizaawwaa | Withania somnifera | Solanaceae | 9. Shrub | 2 and 3 | 3 |
| 26 | Gursadee | 9. Shrub | 2. Medicine | 12 | ||
| 27 | Harangamaa | Maerua aethiopica | Capparidaceae | 9. Climber | 8. Live fence | 23 |
| 28 | Harbuu | Ficus sur | Moraceae | 4. Shade trees | 1, 3, and 5 | 2 |
| 29 | Harooressa | Grewia bicolor | Tiliaceae | 2. Timber trees | 3 and 4 | 8 |
| 30 | Heexoo/Koosoo | Hagenia abyssinica | Rosaceae | 2. Timber trees | 2, 3, and 6 | 8 |
| 31 | Hoomii | Prunus africana | Rosaceae | 2. Timber trees | 2, 3, 4, and 7 | 3 |
| 32 | Incinnii | Sesbania sesban | Fabaceae | 9. Climber | 4 and 8 | 53 |
| 33 | Indoodee | Phytolacca dodecandra | Phytolaccaceae | 9. Climber | 2. Medicine | 19 |
| 34 | Kombolcha | Maytenus arbutifolia | Celastraceae | 9. Shrub | 8. Live Fence | 25 |
| 35 | Kosorruu/sokorruu | Acanthus pubescens | Acanthaceae | 9. Shrub | 3. Fuelwood | 35 |
| 36 | Laaftoo | Acacia sieberiana | Fabaceae | 4. Shade trees | 3, 4, 5, 6, and 9 | 14 |
| 37 | Lolchiisaa | Bersama abyssinica | Melianthaceae | 2. Timber trees | 2, 3, and 4 | 3 |
| 38 | Lookoo | Diospyros abyssinica | Ebenaceae | 2. Timber trees | 2, 3, and 4 | 8 |
| 39 | Oobdaa | Ficus vasta | Moraceae | 4. Shade trees | 3, 5, 6, and 9 | 4 |
| 40 | oogiwoo/koroolimaa | Ethiopian candimon | 9. Spice | 7 and 8. Spice | 56 | |
| 41 | Qararoo | Acokanthera schimperi | Apocynaceae | 2. Timber trees | 3 and 4 | 4 |
| 42 | Qolaadii | Mimusops kummel | Sapotaceae | 4. Shade trees | 3, 4, and 9 | 5 |
| 43 | Qomanyoo | Brucea antidysenterica | Simaroubaceae | 9. Shrub | 2 and 3 | 3 |
| 44 | Reejjii | Vernonia rueppellii | Asteraceae | 4 and 9. Shrub | 3, 6, and 9 | 44 |
| 45 | Rigaa arbaa | Bridelia micrantha | Euphorbiaceae | 9. Shrub | 8, brush | 12 |
| 46 | Saacoo/too | Erica arborea | Ericaceae | 4. Shade trees | 3, 4, and 9 | 3 |
| 47 | somboo | Ekebergia capensis | Meliaceae | 2. Timber trees | 2, 3, 4, and 9 | 3 |
| 48 | Sondii | Acacia lahai | Fabaceae | 4. Shade trees | 3, 4, 5, 6, and 9 | 7 |
| 49 | Sootalloo | Millettia ferruginea | Fabaceae | 4. Shade trees | 2, 3, and 6 | 7 |
| 50 | Ulaagaa | Ehretia cymosa | Boraginaceae | 4. Shade trees | 2, 3, and 4 | 4 |
| 51 | Ulmaayii | 9. Shrub | 2, 3, and 8, teeth brush | 20 | ||
| 52 | Urgeessaa | Premna schimperi | Lamiaceae | 9. Shrub | 2, 3, and 4 | 6 |
| 53 | uuyyuu/Muka gurraacha | 2. Timber trees | 3, 4, and 9 | 2 | ||
| 54 | Waddeessa | Cordia africana | Boraginaceae | 2 and 4 | 3, 4, 5, 7, and 9 | 8 |
| 55 | Waleensuu | Erythrina abyssinica | Fabaceae | 9. Shrub | 3 and 4 | 6 |
| 56 | Xaaxessaa | Rhus natalensis | Anacardiaceae | 9. Shrub | 2, 3, and 4 | 5 |
| S. Number | Local Name/s of the Plant/Crop Species | Scientific Name | Family Name | Plant/Crop Typology 1. Fruit trees 2. Timber trees 3. Forage 4. Shade trees 5. Root and tuber 6. Vegetables 7. Pulse 8. Cereals 9. Others, specify | Purpose of the Plants/Crops in the System: 1. Food 2. Medicine 3. Fuelwood 4. Construction 5. Fodder 6. Soil conservation 7. Income generation 8. Others 9. Shade | Abundance of the species in the system |
|---|---|---|---|---|---|---|
| 1 | Abbayyii | Maesa lanceolata | Myrsinaceae | 4. Shade trees | 2, 3, 5, and 6 | 1 |
| 2 | Ambabbeessa/mukarbaa | Albizia gummifera | Fabaceae | 4. Shade trees | 9. Shade | 2 |
| 3 | Baargamoo Diimaa | Eucalyptus camaldulensis | Myrtaceae | 3 | ||
| 4 | Bahaa | Strychnos spinosa | Loganiaceae | 4. Shade trees | 3, 4, 5, 6, and 9 | 4 |
| 5 | Bakkanniisa | Croton macrostachyus | Euphorbiaceae | 4. Shade trees | 2, 6, and 9 | 7 |
| 6 | Barbaree | Capsicum annuum | Solanaceae | 176 | ||
| 7 | Boqqolloo | Zea mays | Poaceae | 8. Cereals | 1. Food | 14850 |
| 8 | Bosoqa | Sapium ellipticum | Euphorbiaceae | 2. Timber trees | 3, 5, 6, and 9 | 1 |
| 9 | Botoroo | Stereospermum kunthianum | Bignoniaceae | 9. shrub | 3. Fuelwood | 1 |
| 10 | Buna | Coffea arabica | Rubiaceae | 9. Cash crop | 1. Food | 40 |
| 11 | Burtukaana | Citrus sinensis | Rutaceae | 9 | 1 | |
| 12 | Caatii | Catha edulis | Celastraceae | 9 | 6 | |
| 13 | Cadaa | Euphorbia tirucalli | Euphorbiaceae | 33 | ||
| 14 | Dabaaqula/Buqqee | Dabaaqula/Buqqee | Cucurbita pepo | 4 | ||
| 15 | Dafee/Boloqqee | Phaseolus vulgaris | Fabaceae | 477 | ||
| 16 | Dambii | Ficus thonningi | Moraceae | 4. Shade trees | 3, 5, and 6 | 1 |
| 17 | Dhangaggoo | Rhoicissus tridentata | Vitaceae | 9. Herb | 1 and 6 | 16 |
| 18 | Dinnicha Oromoo | Plectranthus edulis | Lamiaceae | 13 | ||
| 19 | Eebicha | Vernonia amygdalina/schimperi | Asteraceae | 3. Forage | 2, 3, 5, and 6 | 9 |
| 20 | Geeshoo | Rhamnus prinoides | Rhamnaceae | 9. Shrub | 1 and 7 | 5 |
| 21 | Giraaviiliyaa/Muka Qawwee | Grevillea robusta | Proteaceae | 26 | ||
| 22 | Harangamaa | Maerua aethiopica | Capparidaceae | 9. Climber | 8. Live fence | 3 |
| 23 | Harbuu | Ficus sur | Moraceae | 4. Shade trees | 1, 3, and 5 | 1 |
| 24 | Hoomii | Prunus africana | Rosaceae | 2. Timber trees | 2, 3, 4, and 7 | 2 |
| 25 | Indoodee | Phytolacca dodecandra | Phytolaccaceae | 10 | ||
| 26 | Kaashimiirii | Conyza stricta | Asteraceae | 1 | ||
| 27 | Laaftoo | Acacia sieberiana | Fabaceae | 4. Shade trees | 3, 4, 5, 6, and 9 | 2 |
| 28 | Lolchiisaa | Bersama abyssinica | Melianthaceae | 2. Timber trees | 2, 3, and 4 | 1 |
| 29 | Loomii | Citrus aurantiifolia | Rutaceae | 1 | ||
| 30 | Maangoo | Mangifera indica | Anacardiaceae | 5 | ||
| 31 | Marga Veetiivaar | 33 | ||||
| 32 | Mishingaa | Sorghum bicolor | Poaceae | 8. Cereals | 1. Food | 2218 |
| 33 | Mixaaxisa | Ipomoea batatas | Convolvulaceae | 5. Root and tuber | 1 and 7 | 34 |
| 34 | Muuzii | Musa acuminata | Musaceae | 7 | ||
| 35 | Oobdaa | Ficus vasta | Moraceae | 4. Shade trees | 3, 5, 6, and 9 | 2 |
| 36 | Paappayyaa | Carica papaya | Caricaceae | 3 | ||
| 37 | Qobboo | Ricinus communis | Euphorbiaceae | 7 | ||
| 38 | Qomanyoo | Brucea antidysenterica | Simaroubaceae | 9. Shrub | 2 and 3 | 1 |
| 39 | Raafuu Habashaa | Brassica carinata | Brassicaceae | 66 | ||
| 40 | Reejjii | Vernonia rueppellii | Asteraceae | 4 and 9. Shrub | 3, 6, and 9 | 7 |
| 41 | Sasbaaniyaa | Sesbania sesban | Fabaceae | 11 | ||
| 42 | somboo | Ekebergia capensis | Meliaceae | 2. Timber trees | 2, 3, 4, and 9 | 1 |
| 43 | Sondii | Acacia lahai | Fabaceae | 4. Shade trees | 3, 4, 5, 6, and 9 | 1 |
| 44 | Sootalloo | Millettia ferruginea | Fabaceae | 4. Shade trees | 2, 3, and 6 | 2 |
| 45 | Waddeessa | Cordia africana | Boraginaceae | 2 and 4 | 3, 4, 5, 7, and 9 | 4 |
| 46 | Waleensuu | Erythrina abyssinica | Fabaceae | 9. Shrub | 3 and 4 | 1 |
| 47 | Zayituunaa | Psidium guajava | Myrtaceae | 1. Fruit trees | 1 and 7 | 3 |
References
- Liang, W. Farming systems as an approach to agro-ecological engineering. Ecol. Eng. 1998, 11, 27–35. [Google Scholar] [CrossRef]
- Global Agricultural Productivity Report; Global Harvest Initiative: Washington, DC, USA, 2016.
- Coetzer, K.L.; Witkowski, E.T.; Erasmus, B.F. Reviewing B iosphere R eserves globally: Effective conservation action or bureaucratic label? Boil. Rev. 2014, 89, 82–104. [Google Scholar] [CrossRef] [PubMed]
- Prip, C. The Convention on Biological Diversity as a legal framework for safeguarding ecosystem services. Ecosyst. Serv. 2018, 29, 199–204. [Google Scholar] [CrossRef]
- Gatzweiler, F.; Reichhuber, A.; Hein, L. Why Financial Incentives Can Destroy Economically Valuable Biodiversity in Ethiopia; ZEF Discussion Papers on Development Policy; University of Bonn, Center for Development Research (ZEF): Bonn, Germany, 2007. [Google Scholar]
- Young, J. Ethiopian Protected Areas: A “Snapshot”; A Reference Guide for Future Strategic Planning and Project Funding. Available online: https://phe-ethiopia.org/admin/uploads/attachment-1167 (accessed on 2 April 2012).
- Ango, T.G.; Börjeson, L.; Senbeta, F.; Hylander, K. Balancing ecosystem services and disservices: Smallholder farmers’ use and management of forest and trees in an agricultural landscape in southwestern Ethiopia. Ecol. Soc. 2014, 19. [Google Scholar] [CrossRef]
- Senbeta, F.; Gole, T.W.; Denich, M.; Kellbessa, E. Diversity of useful plants in the coffee forests of Ethiopia. Ethnobot. Res. Appl. 2013, 11, 49–69. [Google Scholar]
- Gole, T.W.; Feyera, S.; Kassahun, T.; Fite, G. Yayu Coffee Forest Biosphere Reserve Nomination Form; Ethiopian MAB National Committee: Addis Ababa, Ethiopia, 2009. [Google Scholar]
- Environment and Coffee Forest Forum Report; Unpublished Report; Addis Ababa, Ethiopia, 2016.
- Yakob, G.; Fekadu, A. Diversity and Regeneration Status of Woody Species: The Case of Keja Araba and Tula Forests, South West Ethiopia. Open Access Libr. J. 2016, 3, 1. [Google Scholar] [CrossRef]
- Gole, T.W. Vegetation of the Yayu Forest in SW Ethiopia: Impacts of Human Use and Implications for In Situ Conservation of Wild Coffea arabica, L. Populations; Cuvillier: Göttingen, Germany, 2003. [Google Scholar]
- Jerneck, A.; Olsson, L. More than trees! Understanding the agroforestry adoption gap in subsistence agriculture: Insights from narrative walks in Kenya. J. Rural Stud. 2013, 32, 114–125. [Google Scholar] [CrossRef]
- Chiarucci, A.; De Dominicis, V.; Wilson, J.B. Structure and floristic diversity in permanent monitoring plots in forest ecosystems of Tuscany. For. Ecol. Manag. 2001, 141, 201–210. [Google Scholar] [CrossRef]
- Kothari, C.R. Research Methodology: Methods and Techniques; New Age International: New Delhi, India, 2004. [Google Scholar]
- Assessment, M.E. Millennium ecosystem assessment. Ecosystems and Human Well-Being: Biodiversity Synthesis; World Resources Institute: Washington, DC, USA, 2005. [Google Scholar]
- Bateman, I.J.; Harwood, A.R.; Abson, D.J.; Andrews, B.; Crowe, A.; Dugdale, S.; Fezzi, C.; Foden, J.; Hadley, D.; Haines-Young, R.; et al. Economic analysis for the UK national ecosystem assessment: Synthesis and scenario valuation of changes in ecosystem services. Environ. Resour. Econ. 2014, 57, 273–297. [Google Scholar] [CrossRef]
- Muhamad, D.; Okubo, S.; Harashina, K.; Gunawan, B.; Takeuchi, K. Living close to forests enhances people’s perception of ecosystem services in a forest–agricultural landscape of West Java, Indonesia. Ecosyst. Serv. 2014, 8, 197–206. [Google Scholar] [CrossRef]
- Gole, T.W.; Borsch, T.; Denich, M.; Teketay, D. Floristic composition and environmental factors characterizing coffee forests in southwest Ethiopia. For. Ecol. Manag. 2008, 255, 2138–2150. [Google Scholar] [CrossRef]
- Aerts, R.; Hundera, K.; Berecha, G.; Gijbels, P.; Baeten, M.; Van Mechelen, M.; Hermy, M.; Muys, B.; Honnay, O. Semi-forest coffee cultivation and the conservation of Ethiopian Afromontane rainforest fragments. For. Ecol. Manag. 2011, 261, 1034–1041. [Google Scholar] [CrossRef] [Green Version]
- Burkhard, B.; Müller, A.; Müller, F.; Grescho, V.; Anh, Q.; Arida, G.; Bustamante, J.V.; Van Chien, H.; Heong, K.L.; Escalada, M.; et al. Land cover-based ecosystem service assessment of irrigated rice cropping systems in southeast Asia—An explorative study. Ecosyst. Serv. 2015, 14, 76–87. [Google Scholar] [CrossRef]
- Jackson, L.E.; Pascual, U.; Hodgkin, T. Utilizing and conserving agrobiodiversity in agricultural landscapes. Agric. Ecosyst. Environ. 2007, 121, 196–210. [Google Scholar] [CrossRef]
- Garbach, K.; Milder, J.C.; Montenegro, M.; Karp, D.S.; DeClerck, F.A. Biodiversity and ecosystem services in agroecosystems. Encycl. Agric. Food Syst. 2014, 2, 21–40. [Google Scholar]
- OECD. OECD-Work on Biodiversity and Ecosystems. 2014. Available online: www.oecd.org/env/biodiversity (accessed on 17 June 2017).
- Cassano, C.R.; Barlow, J.; Pardini, R. Forest loss or management intensification? Identifying causes of mammal decline in cacao agroforests. Boil. Conserv. 2014, 169, 14–22. [Google Scholar] [CrossRef]
- Jellinek, S.; Rumpff, L.; Driscoll, D.A.; Parris, K.M.; Wintle, B.A. Modelling the benefits of habitat restoration in socio-ecological systems. Boil. Conserv. 2014, 169, 60–67. [Google Scholar] [CrossRef]
- West, P.C.; Gibbs, H.K.; Monfreda, C.; Wagner, J.; Barford, C.C.; Carpenter, S.R.; Foley, J.A. Trading carbon for food: Global comparison of carbon stocks vs. crop yields on agricultural land. Proc. Natl. Acad. Sci. USA 2010, 107, 19645–19648. [Google Scholar] [CrossRef] [PubMed] [Green Version]
- Abebe, T.; Sterck, F.J.; Wiersum, K.F.; Bongers, F. Diversity, composition and density of trees and shrubs in agroforestry homegardens in Southern Ethiopia. Agrofor. Syst. 2013, 87, 1283–1293. [Google Scholar] [CrossRef]
- Brandt, P.; Abson, D.J.; DellaSala, D.A.; Feller, R.; von Wehrden, H. Multifunctionality and biodiversity: Ecosystem services in temperate rainforests of the Pacific Northwest, USA. Boil. Conserv. 2014, 169, 362–371. [Google Scholar] [CrossRef]
- Mace, G.M.; Norris, K.; Fitter, A.H. Biodiversity and ecosystem services: A multilayered relationship. Trends Ecol. Evol. 2012, 27, 19–26. [Google Scholar] [CrossRef] [PubMed]


| Farming Systems | Diversity Indices | ||
|---|---|---|---|
| Species Richness (S) | Shannon (H′) | Evenness (H′/LN(S)) | |
| Homegarden System | 50 | 3.14 | 0.80 |
| Plantation Coffee System | 28 | 1.21 | 0.36 |
| Semi-Forest Coffee System | 56 | 2.09 | 0.52 |
| Annual Crop Production System | 47 | 0.71 | 0.18 |
| Major Farming Systems | ||||
|---|---|---|---|---|
| Types of Services | Homegarden AF | Plantation Coffee | Semi-Forest Coffee | Crop Production |
| Provisioning Services | ||||
| Food production | Fruits, tubers, vegetables, oils, pulses, and roots | Wild fruits | Wild fruits and some edible leaves of shrubs and climbers | Cereal, pulses, and horticultural crops are all the services |
| Biodiversity/genetic resources | Conservations of anchote (Coccinia abyssinica), godare (Colocasia esculenta), and Oromo dinich (Plectranthus edulis (Vatke) Agnew) genetic resources | Protection of wild fruit trees and the five legally protected tree species | Protection of wild fruit shrubs, climbers, and the five legally protected tree species | Conservations of indigenous and legally protected tree species |
| Water (drinking, cooking, irrigation) | Source of pure streams, springs, and small rivers for humans and livestock | |||
| Fuelwood and timber | Branches, stems, and leaves of fruit trees and others Crop residues | Dried coffee stems, shrubs, branches of shade trees for fuelwood, and shade trees such as Cordia africana for timber | The main source of fuelwood and timber production yet | Crop residues and branches of parkland trees and shrubs (Cordia, Ficus, Croton, etc.) |
| Fodder | Leaves and residues of fruit and border trees, live fences such as Vernonia | Leaves and fruits of shade trees, and weedy herbs in off-seasons | Leaves and fruits of shade trees, shrubs and weedy herbs in off-seasons | Crop residues, leaves, and fruits of parkland and shade trees |
| Medicinal values | Vegetables, tubers, roots, fruits, shrubs and herbs in the system, e.g. ‘Qoricha bineensaa’—snake poison | Croton, Vernonia, Olea, Premna, Qomanyoo (Brucea antidysenterica J.F.Mill.), ‘Gizaawwaa’, and others | Maesa lanceolata, Croton, ‘Qomanyoo’ (Brucea antidysenterica), Premna, Hagenia, and other shrubs, trees and climbers | Vernonia, Maesa lanceolata, Croton, Qomanyoo (Brucea antidysenterica), Premna |
| Regulatory Services | ||||
| Climate regulation | Shade of fruit trees and others in the system | Coffee shades and shrubs used as soil moisture protection, shade provision for human and animals | Coffee shades and shrubs used as soil moisture protection, shade for lives | |
| Erosion protection | More density more protection, no tillage | Zero tillage, live fences, and leafy mulches of shade and other trees and shrubs | Uncultivable and protected to some extent | Vetivar grass strips and conservation structures |
| Water purification | Quality streams, and springs as a result of uncultivability | |||
| Cultural Services | ||||
| Spiritual values | Big trees like Ficus species | Availability and multifunctionality of big and culturally respected trees | Availability and multifunctionality of big and culturally respected trees | |
| Aesthetic values | Landscape formation | Uniformity within each Under and lower storey species | Layers of different storey | |
| Educational values | Fruits, roots and tubers, and vegetables are becoming areas of research | Area of interest for international research on organic coffee production and multiplication systems | Area of interest for international research on organic coffee production and management systems | Research interest to enhance production and productivity |
| Recreation/ecotourism | Opportunities of evergreenness and attractiveness | Area of interest to maintain and enjoy cultural and natural landscapes | Area of interest to enjoy the biodiversity, cultural, and natural landscapes | |
| Supporting Services | ||||
| Soil formation | Litter falls, leguminous shrubs and crops, erosion control and livestock dung | Litter falls, erosion control of shade trees/shrubs | Litter falls, erosion control, and no tillage | Retention of crop residues through conservation agriculture |
| Habitat provision | Birds, insects, wild animals and others used the system, and the opportunity for corridors and nearby patches | Birds, insects, wild animals (climbers), and others used the system as home | Home for most types of living organisms, including big mammals, reptiles, etc. | Soil and water conservation structures for small animals and insects |
| Ecosystem Services | Relative Importance of Ecosystem Services for Major Farming System in (%) | |||||||||||
|---|---|---|---|---|---|---|---|---|---|---|---|---|
| Homegarden AF System | Plantation Coffee System | Semi-Forest Coffee System | Annual Crop Land | |||||||||
| 1987–1996 | 1997–2006 | 2007–2016 | 1987–1996 | 1997–2006 | 2007–2016 | 1987–1996 | 1997–2006 | 2007–2016 | 1987–1996 | 1997–2006 | 2007–2016 | |
| Food Provision | 85.8 | 70.9 | 55.8 | 55 | 76.6 | 78.3 | 96.6 | 78.3 | 70 | 98.3 | 100 | 100 |
| BD/Genetic resources | 76.6 | 55 | 27.5 | 78.3 | 70.9 | 42.5 | 97.5 | 87.5 | 99.1 | 29.2 | 15 | 6.7 |
| Water Resource Provision | 9.9 | 0 | 5.8 | 5.8 | 2.5 | 1.6 | 85.8 | 88.4 | 91.6 | 0 | 7.5 | 0 |
| Fuelwood and Timber | 56.6 | 76.6 | 85.8 | 92.5 | 100 | 100 | 100 | 100 | 96.6 | 67.5 | 98.4 | 98.4 |
| Fodder Provision | 37.5 | 67.4 | 87.5 | 95 | 97.5 | 91.7 | 100 | 100 | 91.7 | 52.5 | 63.3 | 64.2 |
| Medicinal Value | 79.1 | 93.3 | 100 | 99.2 | 100 | 100 | 100 | 100 | 92.4 | 73.4 | 87.5 | 84.2 |
| Climate Regulation | 93.4 | 100 | 100 | 95.9 | 100 | 100 | 100 | 100 | 100 | 32.5 | 43.3 | 24.2 |
| Erosion Protection | 97.1 | 100 | 99.1 | 95.8 | 100 | 97.5 | 100 | 100 | 100 | 48.3 | 36.7 | 38.3 |
| Water Purification | 0 | 4.2 | 7.5 | 6.7 | 0 | 0 | 60 | 58.4 | 39.2 | 5 | 0 | 0 |
| Spiritual Services | 59.1 | 33.4 | 30 | 33.4 | 8.3 | 4.2 | 83.4 | 79.1 | 68.4 | 10 | 3.3 | 3.3 |
| Aesthetic Information | 65.9 | 92.5 | 96.7 | 84.2 | 96.7 | 87.5 | 100 | 96.7 | 100 | 3.3 | 2.5 | 15 |
| Educational Services | 78.3 | 95 | 96.7 | 94.2 | 96.7 | 100 | 100 | 96.6 | 100 | 40 | 60 | 50.8 |
| Recreation and Ecotourism | 81.7 | 85.8 | 97.5 | 85.8 | 77.5 | 100 | 93.4 | 96.7 | 95.8 | 0 | 3.3 | 1.7 |
| Soil Formation | 95.1 | 100 | 100 | 94.2 | 94.2 | 100 | 100 | 100 | 100 | 36.7 | 14.1 | 7.5 |
| Habitat Provision | 91.6 | 100 | 100 | 99.2 | 100 | 100 | 98.3 | 100 | 100 | 31.7 | 56.7 | 52.5 |
| Major Farming Systems | Temporal Trends of Ecosystem Services within the Intervals of (1987–1996, 1997–2006 and 2007–2016) | ||||||||||||||
|---|---|---|---|---|---|---|---|---|---|---|---|---|---|---|---|
| Food Provision | BD/Genetic resources | Water Resource Provision | Fuelwood and Timber | Fodder Provision | Medicinal value | Climate Regulation | Erosion Protection | Water Purification | Spiritual Services | Aesthetic Information | Educational Services | Recreation and Ecotourism | Soil Formation | Habitat Provision | |
| Homegarden | + − − | + − − | + − + | + + + | +++ | + + + | + + + | + + − | + + + | + − − | + + + | + + + | + + + | + + + | + + + |
| Plantation Coffee | + ++ | + − − | + − − | + + + | ++ − | + + + | + + + | + + − | + − − | + − − | + + − | + + + | + − + | + + + | + + + |
| Semi-Forest Coffee | + − − | + − + | + + + | + − + | ++ − | + + − | + + + | + + + | + − − | + − − | + − + | + − + | + + + | + + + | + + + |
| Annual Crop | + + + | + − − | + + − | + + + | ++ + | + + − | + + − | + − + | + − − | + − − | + − + | + + − | + + − | + − − | + + − |
© 2019 by the authors. Licensee MDPI, Basel, Switzerland. This article is an open access article distributed under the terms and conditions of the Creative Commons Attribution (CC BY) license (http://creativecommons.org/licenses/by/4.0/).
Share and Cite
Duguma, M.S.; Feyssa, D.H.; Biber-Freudenberger, L. Agricultural Biodiversity and Ecosystem Services of Major Farming Systems: A Case Study in Yayo Coffee Forest Biosphere Reserve, Southwestern Ethiopia. Agriculture 2019, 9, 48. https://0-doi-org.brum.beds.ac.uk/10.3390/agriculture9030048
Duguma MS, Feyssa DH, Biber-Freudenberger L. Agricultural Biodiversity and Ecosystem Services of Major Farming Systems: A Case Study in Yayo Coffee Forest Biosphere Reserve, Southwestern Ethiopia. Agriculture. 2019; 9(3):48. https://0-doi-org.brum.beds.ac.uk/10.3390/agriculture9030048
Chicago/Turabian StyleDuguma, Mezgebu Senbeto, Debela Hunde Feyssa, and Lisa Biber-Freudenberger. 2019. "Agricultural Biodiversity and Ecosystem Services of Major Farming Systems: A Case Study in Yayo Coffee Forest Biosphere Reserve, Southwestern Ethiopia" Agriculture 9, no. 3: 48. https://0-doi-org.brum.beds.ac.uk/10.3390/agriculture9030048