
CHAP: Cotton-Harvesting Autonomous Platform


1
Department of Agricultural Science, Clemson University, 240 McAdams Hall, Clemson, SC 29634, USA
2
Department of Mechanical Engineering, Clemson University, Fluor Daniel Engineering Innovation Building, Clemson, SC 29634, USA
3
Edisto Research and Education Center, 64 Research Road, Blackville, SC 29817, USA
4
Cotton Incorporated, 6399 Weston Parkway, Cary, NC 27513, USA
*
Author to whom correspondence should be addressed.
AgriEngineering 2021, 3(2), 199-217; https://0-doi-org.brum.beds.ac.uk/10.3390/agriengineering3020013
Submission received: 5 March 2021
/
Revised: 5 April 2021
/
Accepted: 6 April 2021
/
Published: 9 April 2021
(This article belongs to the Special Issue Feature Papers in Cotton Automation, Machine Vision and Robotics)
Abstract
:The US cotton industry provided over 190,000 jobs and more than $28 billion total economic contributions to the United States in 2012. The US is the third-largest cotton-producing country in the world, following India and China. US cotton producers have been able to stay competitive with countries like India and China by adopting the latest technologies. Despite the success of technology adoption, there are still many challenges, e.g., increased pest resistance, mainly glyphosate resistant weeds, and early indications of bollworm resistance to Bt cotton (genetically modified cotton that contains genes for an insecticide). Commercial small unmanned ground vehicle (UGV) or mobile ground robots with navigation-sensing modality provide a platform to increase farm management efficiency. The platform can be retrofitted with different implements that perform a specific task, e.g., spraying, scouting (having multiple sensors), phenotyping, harvesting, etc. This paper presents a proof-of-concept cotton harvesting robot. The robot was retrofitted with a vacuum-type system with a small storage bin. A single harvesting nozzle was used and positioned based on where most cotton bolls were expected. The idea is to create a simplified system where cotton bolls′ localization was undertaken as a posteriori information, rather than a real-time cotton boll detection. Performance evaluation for the cotton harvesting was performed in terms of how effective the harvester suctions the cotton bolls and the effective distance of the suction to the cotton bolls. Preliminary results on field test showed an average of 57.4% success rate in harvesting locks about 12 mm from the harvester nozzle. The results showed that 40.7% was harvested on Row A while 74.1% in Row B for the two-row test. Although both results were promising, further improvements are needed in the design of the harvesting module to make it suitable for farm applications.
1. Introduction
The US is the third-largest cotton producing country in the world. Cotton producers must stay competitive by adopting the latest technologies. The US cotton industry has a significant impact on the economy, with 190,000 jobs and turnover of more than $25 billion per year. This year’s yield forecast at 386 kg. per harvested acre was slightly above the previous year [1]. The US cotton industry has a long history of adopting distributive technologies, starting with the invention of the cotton gin in 1790s, the adoption of mechanical harvesters in the 1950s, and the development of the module builder in the 1970s [2]. These technologies significantly decreased labor requirements and allowed the labor to produce a 218 kg bale of cotton fiber to drop from 140 h in 1940 to less than 3 h today [3]. Despite the success of technology adoption, there are still many challenges faced by the US cotton producer. One major challenge is competition from polyester, where overproduction in China has resulted in polyester prices that are approximately 50% less than cotton and has resulted in suppressed cotton prices [4]. Thus, producers must continue to increase their production efficiency as increased cotton prices are on the near horizon. Other challenges facing cotton producers are increased pest resistance, particularly glyphosate-resistant weeds [5], and early indications of bollworm resistance to Bt cotton (genetically modified cotton that contains genes for an insecticide).
Robots are becoming more integrated into the manufacturing industry. Some examples of these integrations include material handling gantry robots [6], autonomous transport vehicles [7], automotive kitting applications [8], TIREBOT [9], and iRobot-Factory [10]. Robots are also applied in other industries (services, construction, mining, transportation/communication, agriculture/forestry/fishery), smart factories, smart buildings, smart homes, smart cities, and even on smart farms where it employs new paradigms and technologies like Industry 4.0, internet of things (IoT), cyber-physical systems (CPS), artificial intelligence (AI) and machine learning (ML). Zielinska (2019) [11] classified these industrial robots as those that operate under fully structured environments. However, field robots like those in the agriculture industry work in fully unstructured natural environments. Although it was more than three decades ago, Sistler (1987) [12] provided a review of the different robotic applications and their future possibilities in agriculture. More robot-based technologies have been used in agriculture. They have been implemented through the use of automation and with ranges of form factors, e.g., ground-based (e.g., smart tractors, unmanned ground vehicle [UGV]), crane-based systems, aerial-based (e.g., unmanned aerial vehicles [UAV]). A rapidly adopted automation in agriculture, for example, is an automated system for milking cows. Salfer et al. (2019) [13] estimated over 35,000 milking systems are currently used all over the world. For row crops, weed control with the rise of herbicide-resistant weeds and lack of new herbicide modes of action is a significant concern, and robotic systems are one of the proposed solutions [14]. For example, in the textile industry, growers of cotton (Gossypium spp.) aim for optimized fiber yield and quality [15]. The need for the textile industry and advances in robotics has led to the proliferation, and use of mobile robot platforms applied to the cotton industry. Several applications of robot platforms have been studied in cotton phenotyping [16,17,18]; lint yield prediction [19], path tracking [20,21], monitoring germination [22]; wireless tracking of cotton modules [23], yield prediction [24]; yield monitoring [25,26], and cotton residue collection [27]. Cotton growers who applied various technologies reported increased field performance and efficient use of resources [28].
UGVs have been used for different purposes in agriculture. BoniRob is a four-wheeled-steering robot with adjustable track width and used as a crop scout [29]. Its sensor suite includes different cameras (3D time of flight, spectral), and laser distance sensors. It was at first design as a phenotyping robot, but additional functionality was added as a weeder as its development progressed. It used a hammer type of mechanism to destroy weeds. Unfortunately, BoniRob development was discontinued for an unknown reason. Vinobot is a phenotyping UGV implemented on a popular mobile platform from clearpathrobotics. Vinobot can measure phenotypic traits of plants and used different sensors [30]. TERRA-MEPP (Transportation Energy Resource from Renewable Agriculture Mobile Energy-crop Phenotyping Platform) is another UGV that was used for high-throughput phenotyping of energy sorghum. It used imaging sensors to measures the plant from both sides as it traverses within rows, thereby overcoming the limitations of bigger UGV [31]. A center-articulated hydrostatic rover [32] was used for cotton harvesting. It used a red, green and blue (RGB) stereo camera to localized/detect the cotton bolls and a 2D manipulator to harvest the cotton. The system achieved a picking performance of 17.3 s per boll and 38 s per boll for simulated and field conditions, respectively, but the authors indicated that the speed of harvest and successful removal must be improved to be used commercially. ByeLab (Bionic eYe Laboratory) is another UGV used to monitor and sense the orchards and vineyards′ health status using multiple sensors [33]. It used two light-detection and ranging (lidar) sensors to determine the plants′ shape and volume and six AgLeader OptRx crop sensors to obtain the plant′s health. It used the Normalized Difference Vegetation Index (NDVI) of the crop sensors to determine if the vegetation is healthy or unhealthy. The results for measuring the plants′ thickness using the lidar sensors provide a relatively high R2 (0.83 and 0.89 to two different experimental layouts). However, no field result was presented. Phenotron is a system modeled UGV which includes a lidar, inertial measurement unit (IMU), and Global Positioning System (GPS) [34]. The field where the robot was tested was also modeled and designed with Sketchup. It used multiple lidar configurations (nodding, tilted, side and overhead) for phenotyping (canopy volume measurement) and tested on a simulated field. The results showed that three configurations (nodding, tilt, and side) produced comparable volume results with an average percent error of 6%. In comparison, the overhead configuration had the highest average percent error at 15.2%. The paper noted that the position of the lidar sensor could heavily influence the results due to occlusion. The cotton plant model canopy and shape may also have affected the results as the model may not have been dense enough to block the lidar. The shape in this model used an oval cross-section but real cotton exhibits different shapes and may result in different volume calculations. This work is very beneficial for the cotton breeder. It makes it quicker to collect important traits of plants to determine which breed performs best in terms of different inputs (fertilizer, water, different management, etc.).
Robots are becoming more integrated into manufacturing industry. Although most of the manufacturing environment is not as complicated as the outdoors, recent advances in sensors and algorithms provide an interesting outlook on how robots will be working outdoors with humans. Commercial small UGVs or mobile ground robots with navigation-sensing modality provides a platform to increase farm management efficiency. The platform, Husky, (clearpathrobotics) [35] can be retrofitted with different manifolds that perform a specific task, e.g., spraying, scouting (having multiple sensors), phenotyping, weeding, harvesting, etc.
Autonomous robot navigation was developed, and a selective harvesting proof of concept was also designed and field-tested. The robot was retrofitted with a vacuum-type system with a small storage bin. Performance evaluation for the cotton harvesting was performed in terms of how effective the harvester suctions the cotton bolls and the effective distance of the suction cap to the cotton bolls. This work’s overall objective is to investigate the potential of UGV to be used for multiple farm operations, e.g., weeding, harvesting, phenotyping, etc. The specific objectives are to design a selective harvesting autonomous mobile platform for cotton and investigate the module′s efficacy in terms of both laboratory and field performance.
2. Materials and Methods
2.1. Mobile Robot Platform and Harvesting Concept Design
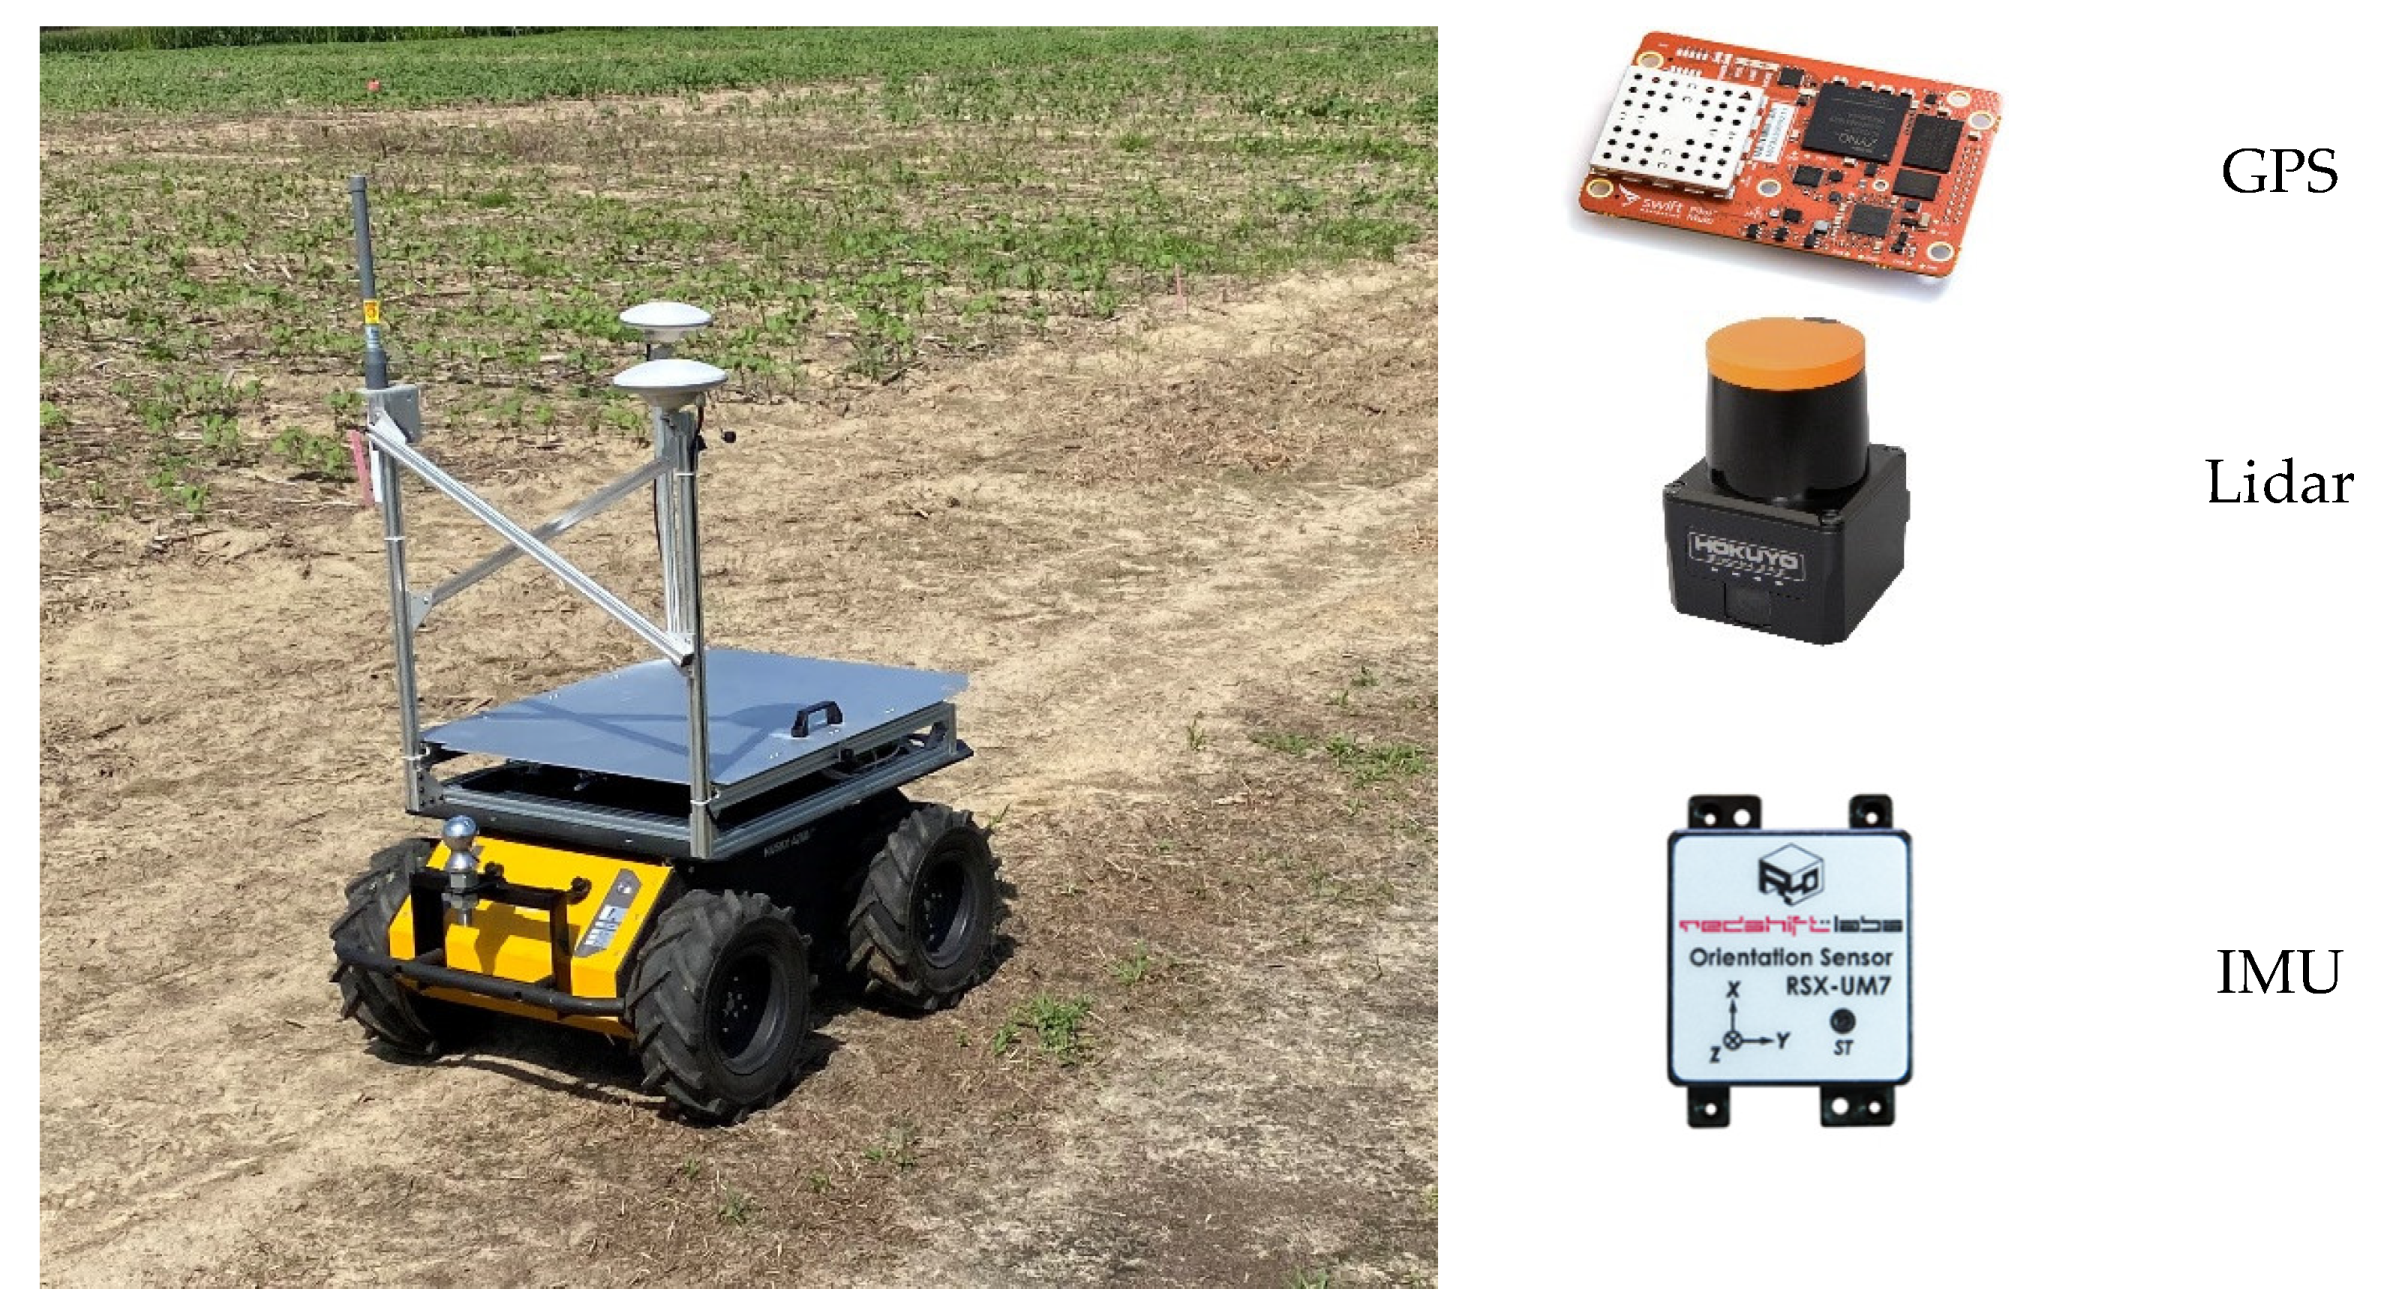
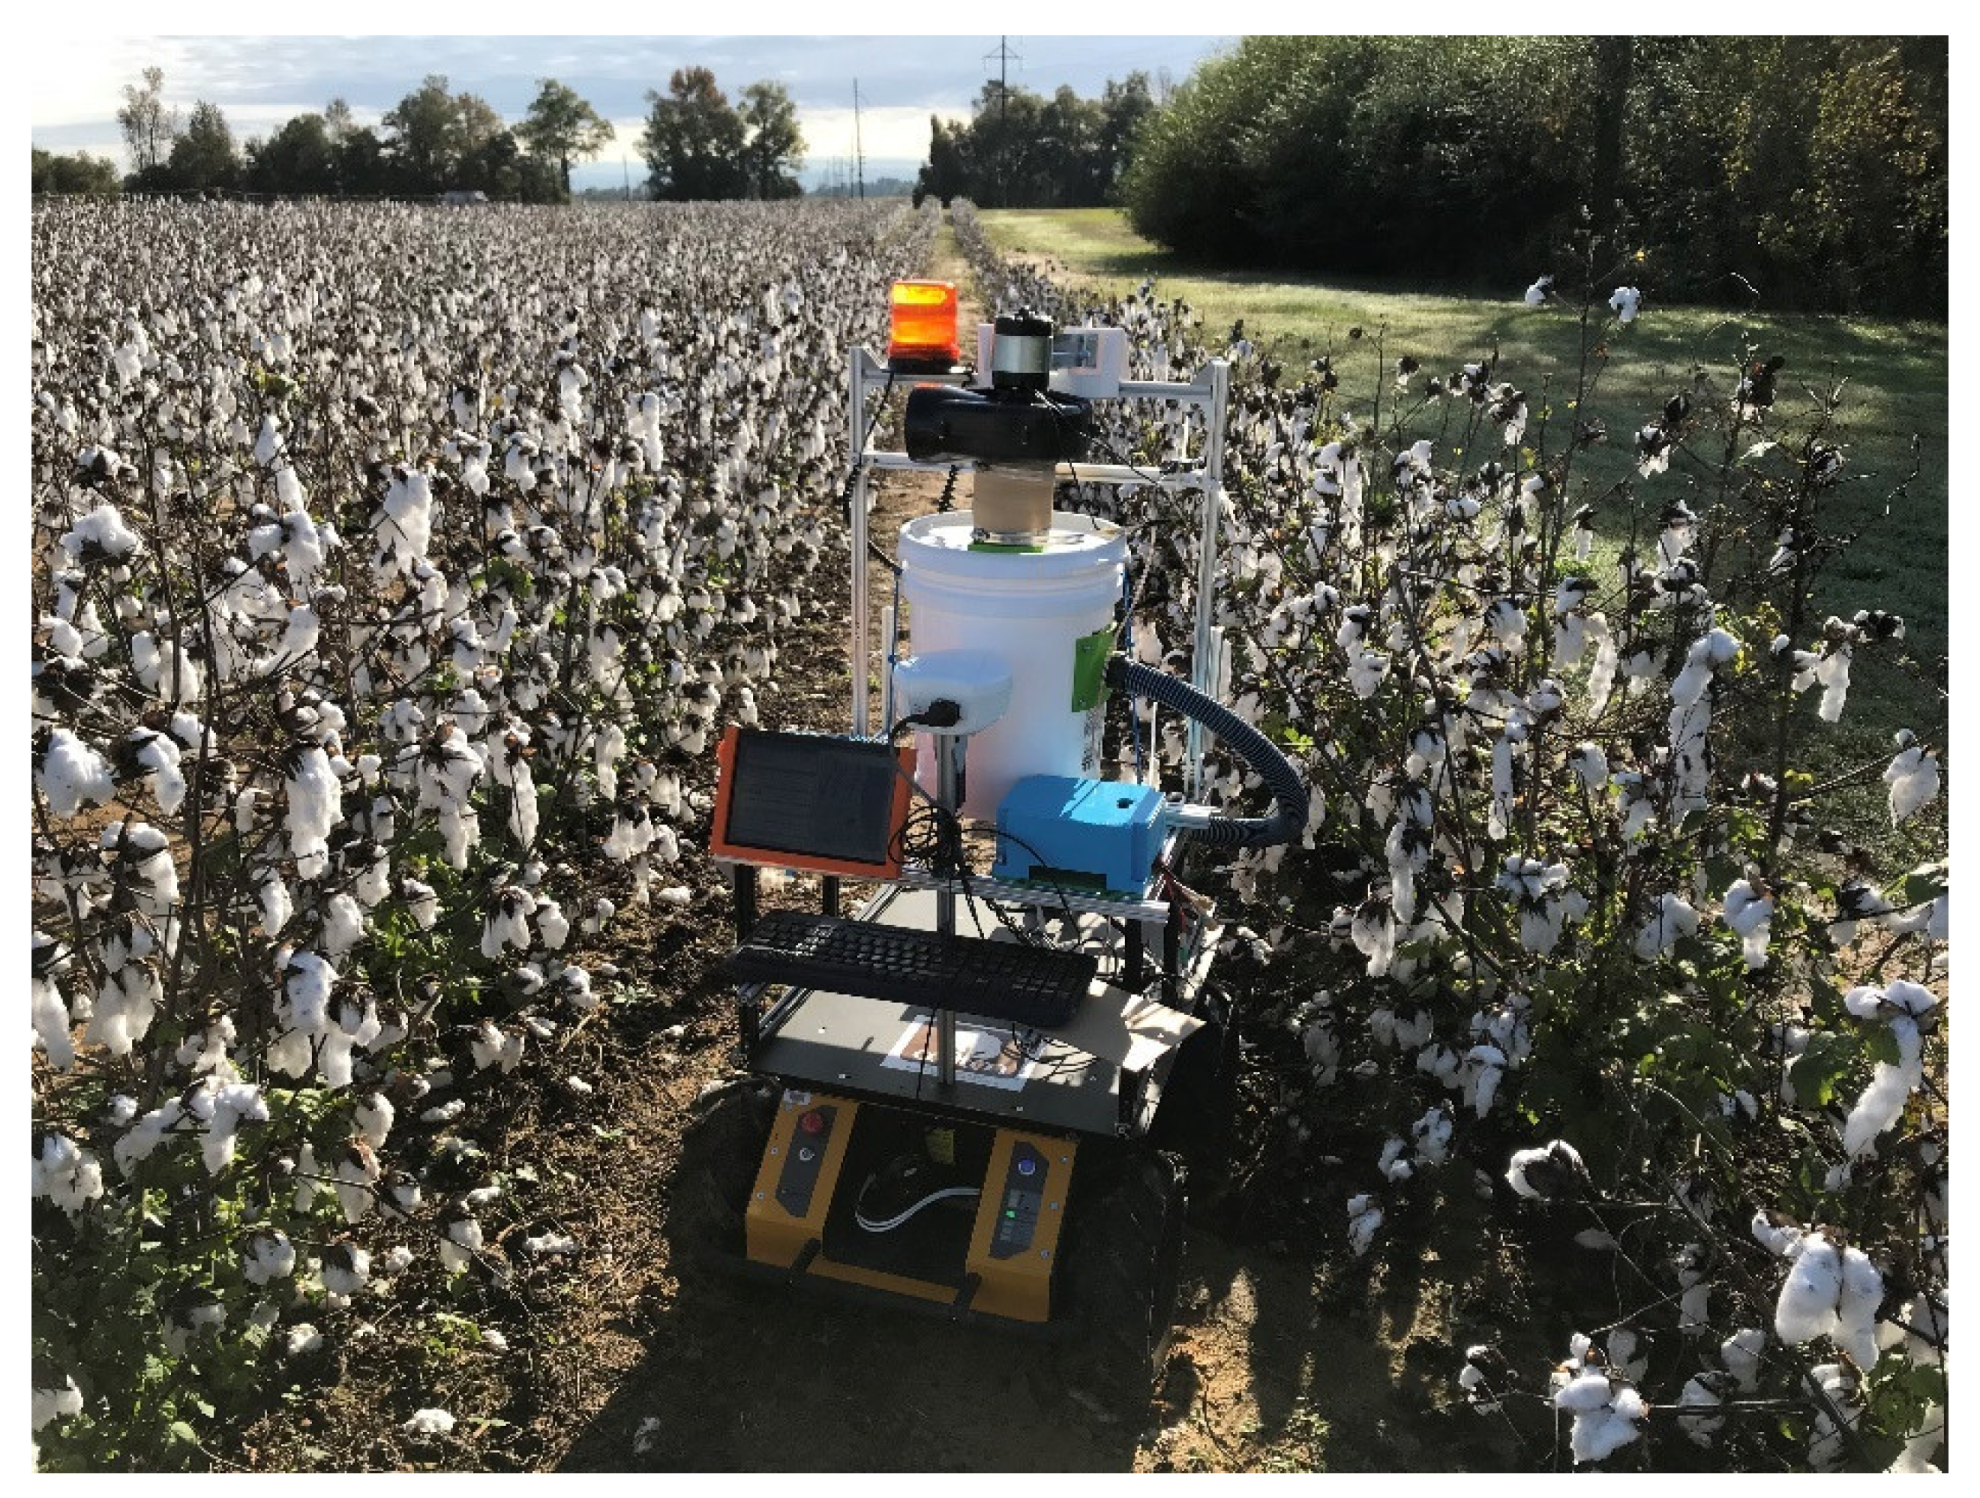
The mobile platform used in this work is the Husky A200 (Figure 1) from Clearpath Robotics. The platform is suitable for field operations as its width of 68 cm fits common cotton row spacings. It is lightweight for field traffic and thus soil compaction is not an issue as compared to huge farm machines.
The platform is powerful enough to handle payloads of up to 75 kg and can operate at speeds of 1 m per second. It has a 24 V direct current (DC) lead-acid battery which can provide 2 h of operation. Two new lithium polymer batteries with 6 cells each and a 10Ah rating provide up to 3 h of operation. Husky is equipped with IMU (UM7, CH Robotics, Victoria, Australia), GPS (Swiftnav, Swift Navigation, CA, USA), individual steering motors and encoders for each wheel for basic navigation, and a laser scanner (UST-10LX, Hokuyo, Osaka, Japan) for obstacle detection. The IMU has an Extended Kalmat Filter (EKF) estimate rate of 500 Hz, with ±2 degrees for static and ±4 degrees accuracy in dynamic pitch and roll. The RTK GPS supports multiple bands (GPS L1/L2, GLONASS G1/G2, BeiDou B1/B2, and Galileo E1/E2), enabling faster convergence times to high precision mode. It has a maximum of 10 Hz solution rates and has flexible interfaces, including Universal Asynchronous Receiver/Transmitter (UART), Ethernet, Controller Area Network (CAN), and Universal Serial Bus (USB). The lidar has a scanning range from 0.02~10 m with ±40 mm accuracy. It has an angular resolution of 0.25 degree and a scanning frequency of 40 Hz. It used an Ethernet as its primary communication. The lidar and IMU were configured for an update rate of 10 Hz, while the GPS was set to 5 Hz. The robot can be programmed to perform specific tasks like mapping, navigation, and obstacle avoidance through its onboard PC (mini-ITX) running on the Ubuntu 16.04 operating system and the Robot Operating System (ROS, Kinetic version) framework. A mini-liquid crystal display (LCD) screen, keyboard, and pointing device are connected to the onboard PC allowing the user to easily write and test code, view and perform operations.
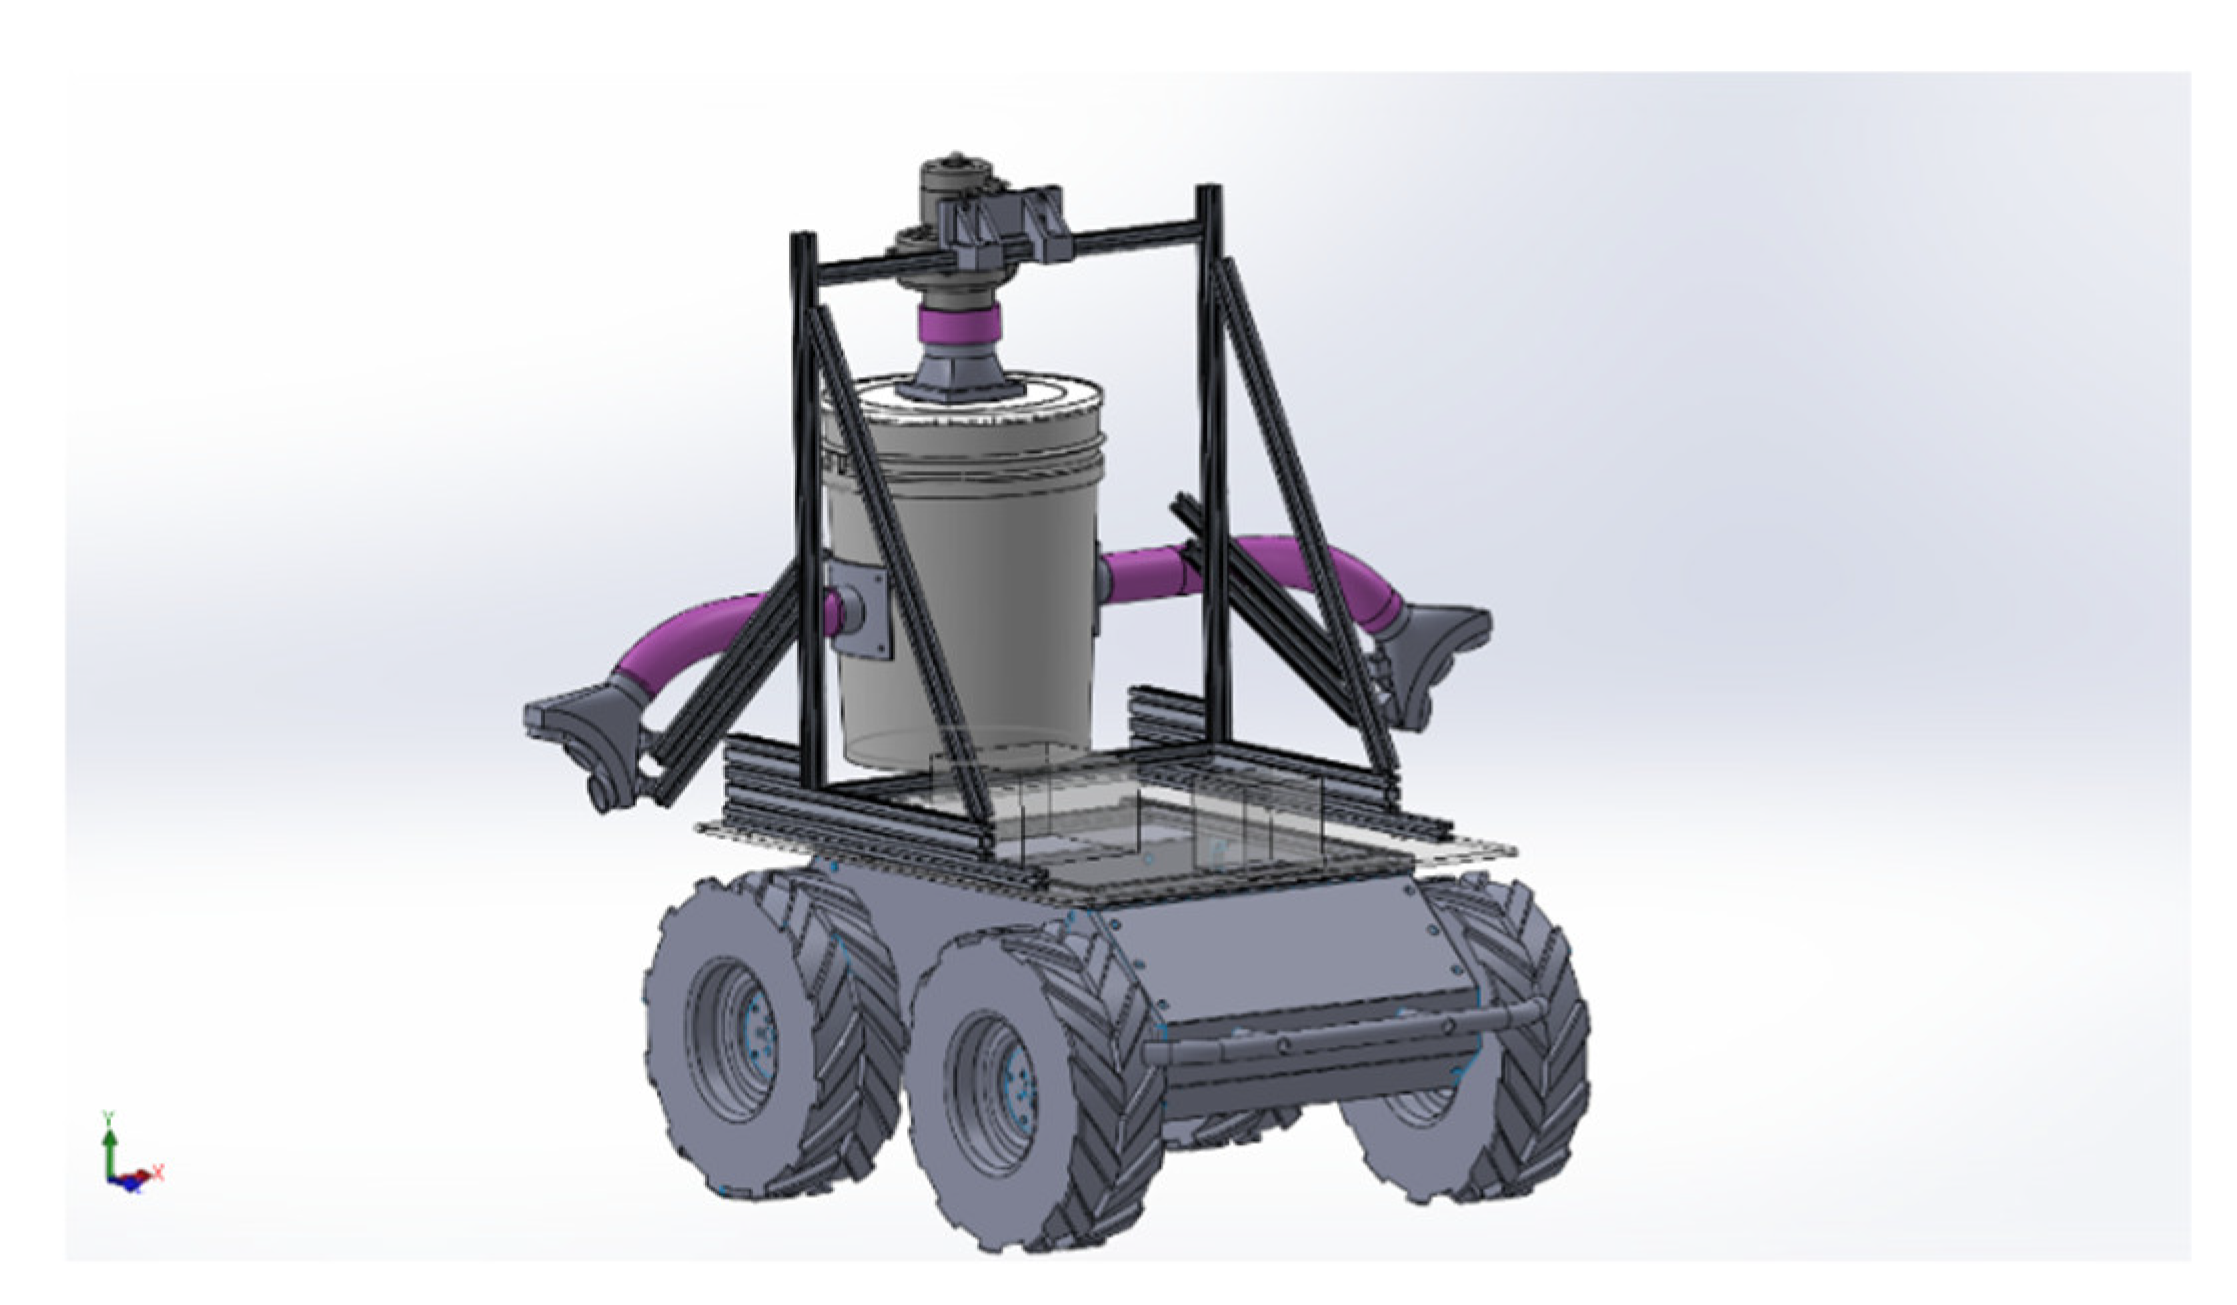
The cotton harvester module underwent several design revisions. The design requirements were based on the following constraints: dimensions and payload of the mobile platform, power supply of the platform, cotton plant height and boll positions, and temporary storage of the harvested cotton bolls. The first few prototypes used a fabric for temporary storage. It was determined that the porous nature of the fabric had a huge impact on the suction of the system. The container was replaced with a sealed container using a modified 19 L bucket with a sealed lid. A fluid simulation was performed for the storage and is presented under Section 4 (Discussion). The overall design of the cotton-harvesting autonomous platform (CHAP) was modified to accommodate the new collection device, as shown in Figure 2.
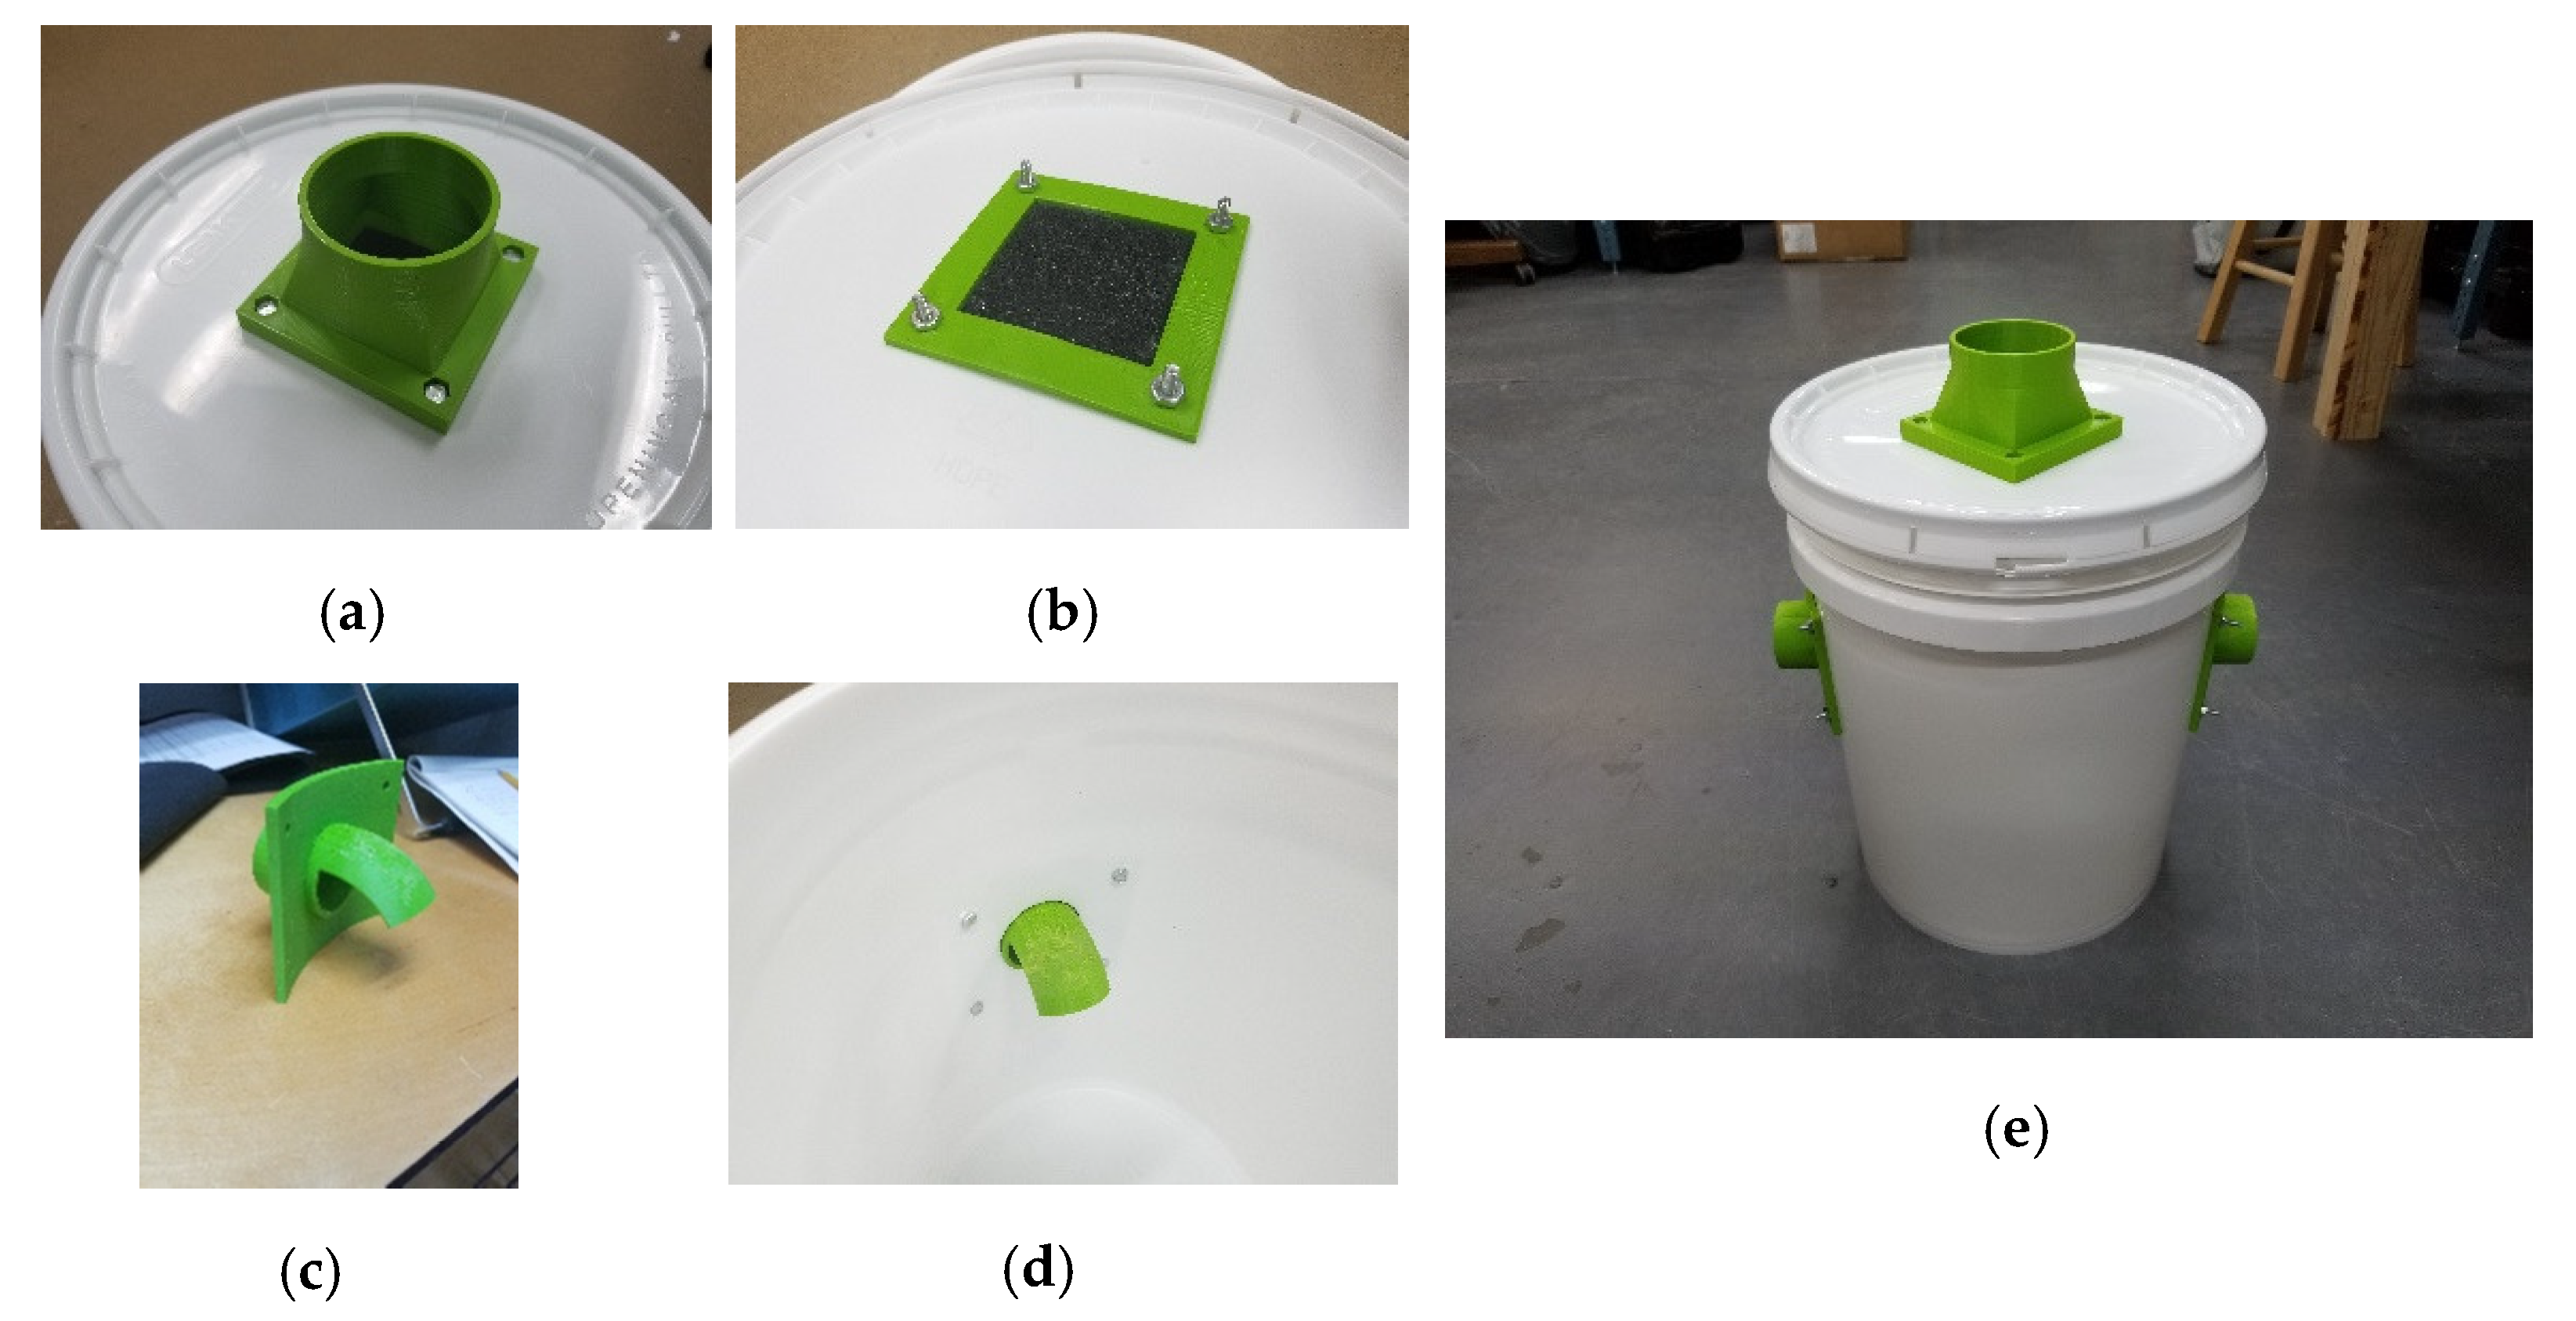
Several different parts were modeled and created via 3D printing because of their unique shapes and requirements, as shown in Figure 3. An outlet from the collection bucket was created to house a filter to prevent the blower from becoming clogged with cotton, as shown in Figure 3a,b. The inlets to the collection bucket were designed to divert the cotton to the bottom as shown in Figure 3c,d. Figure 3e shows the collection bucket with all the 3D printed parts.
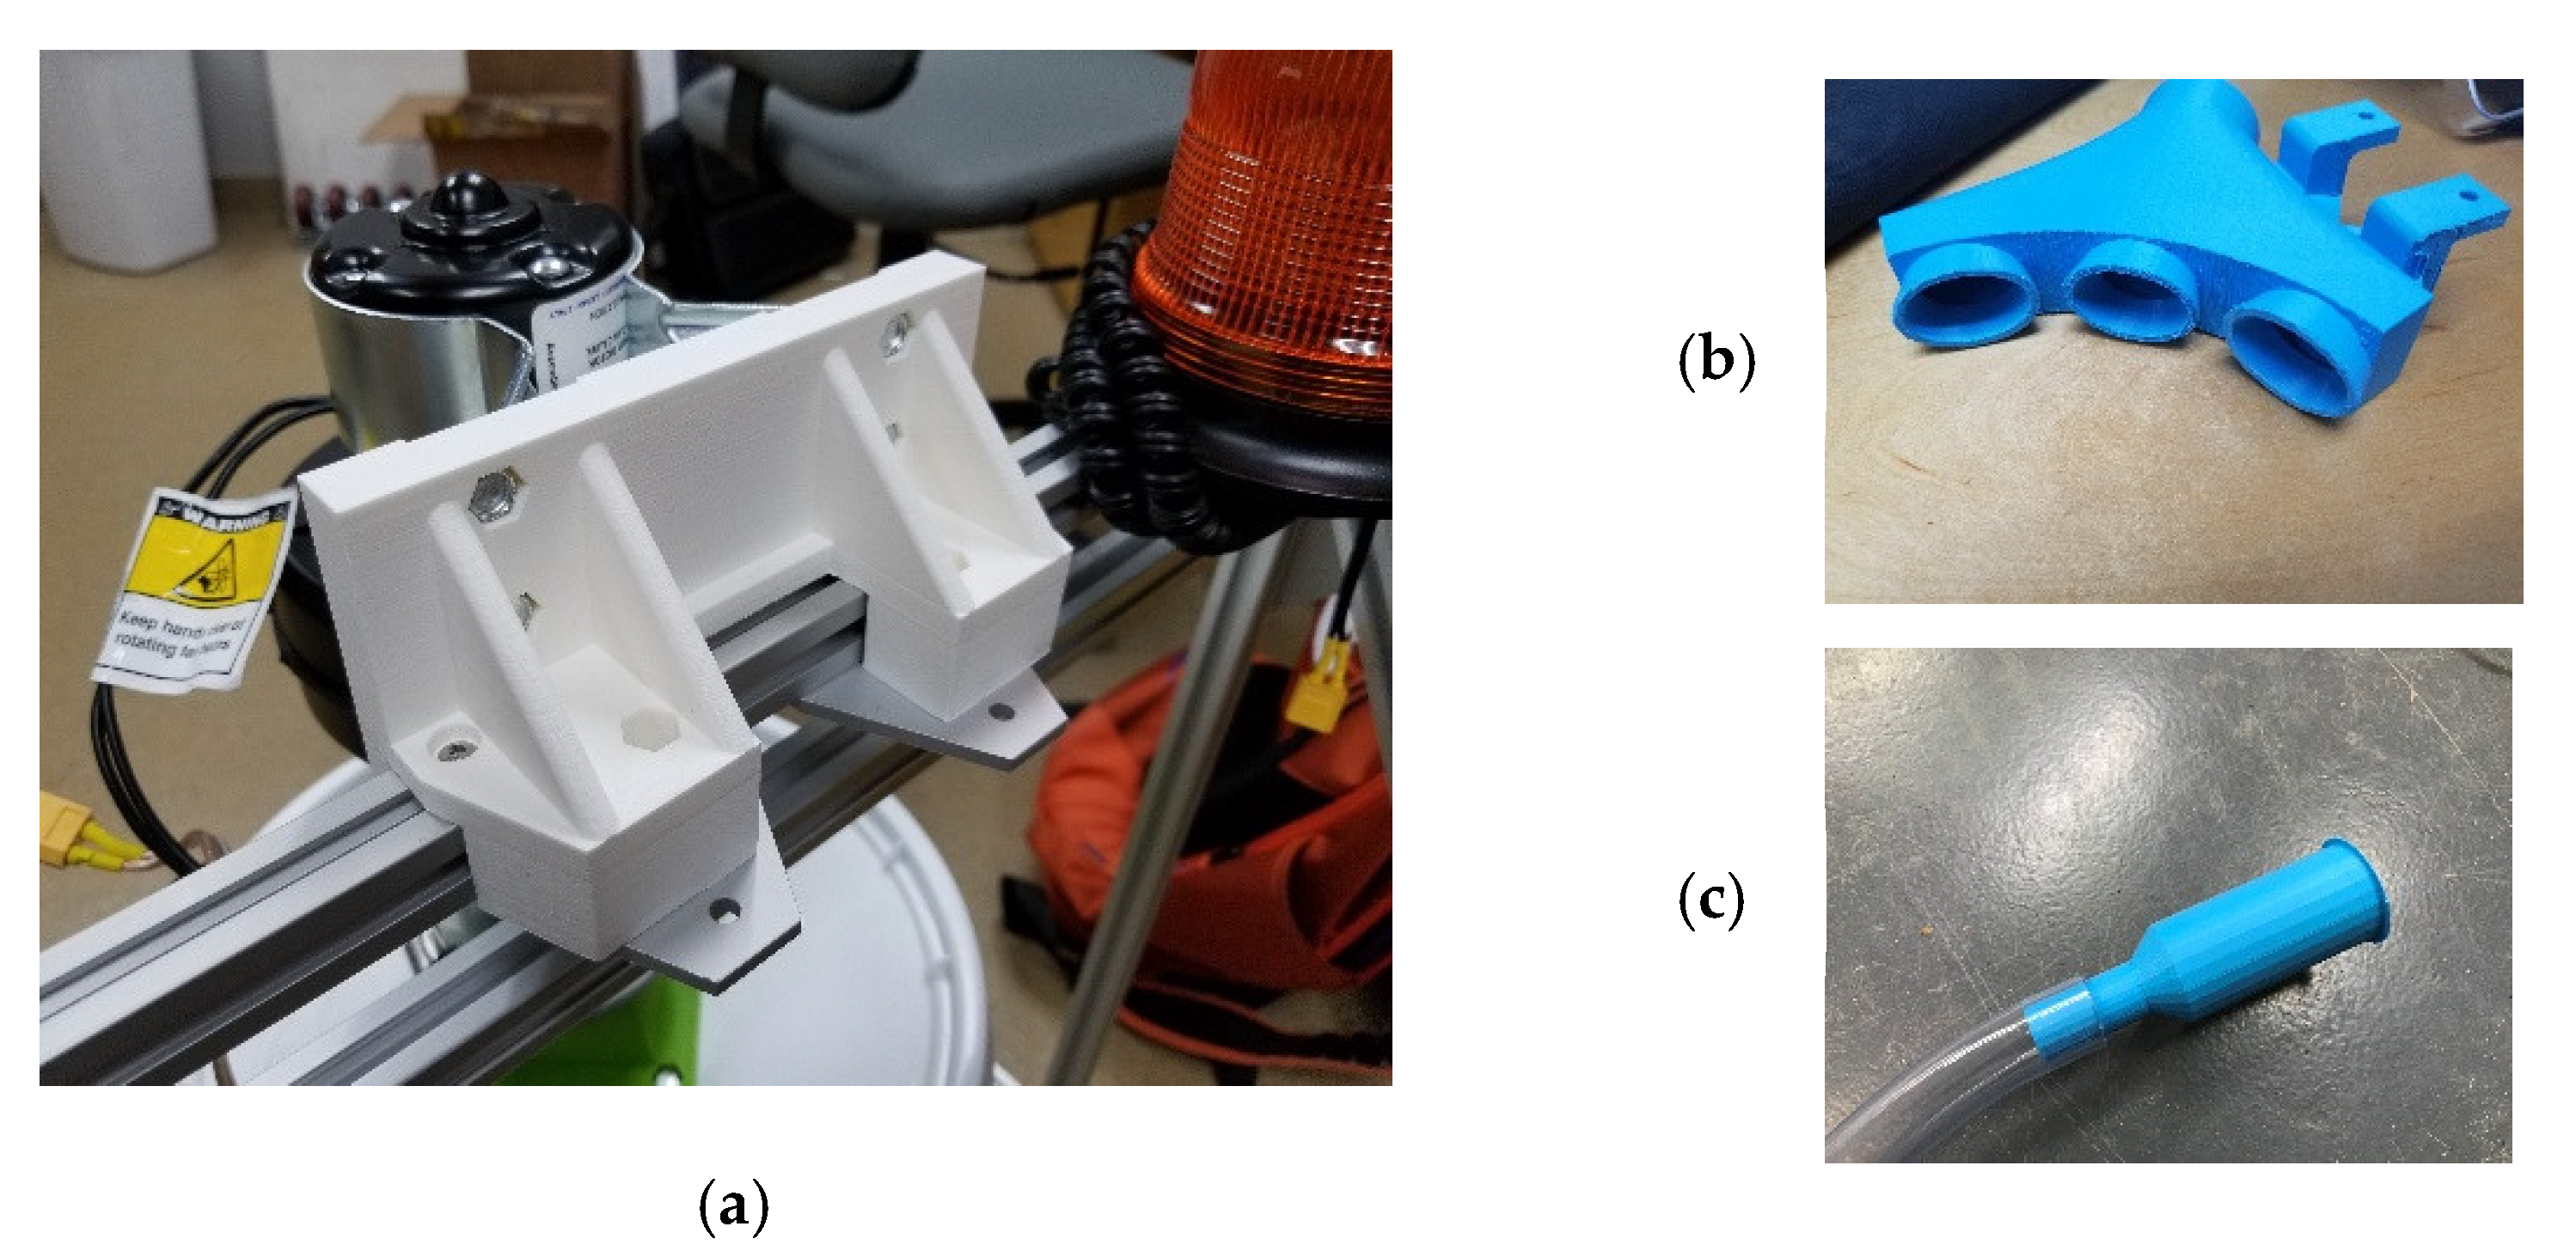
The blower was mounted above the collection bucket and a mount was created using a higher-density setting. This was to prevent the mount from failing due to the blower′s weight and possible vibration, as shown in Figure 4a. Several designs for the suction ports on the cotton intake fitting were printed and tested. The multiple suction port design (Figure 4b) was first envisioned to collect multiple cotton bolls but during testing, a significant drawback was discovered. It lowers the pressure from the blower, which results in no bolls being collected most of the time. The final design was modified and only used one suction port as shown in Figure 4c.
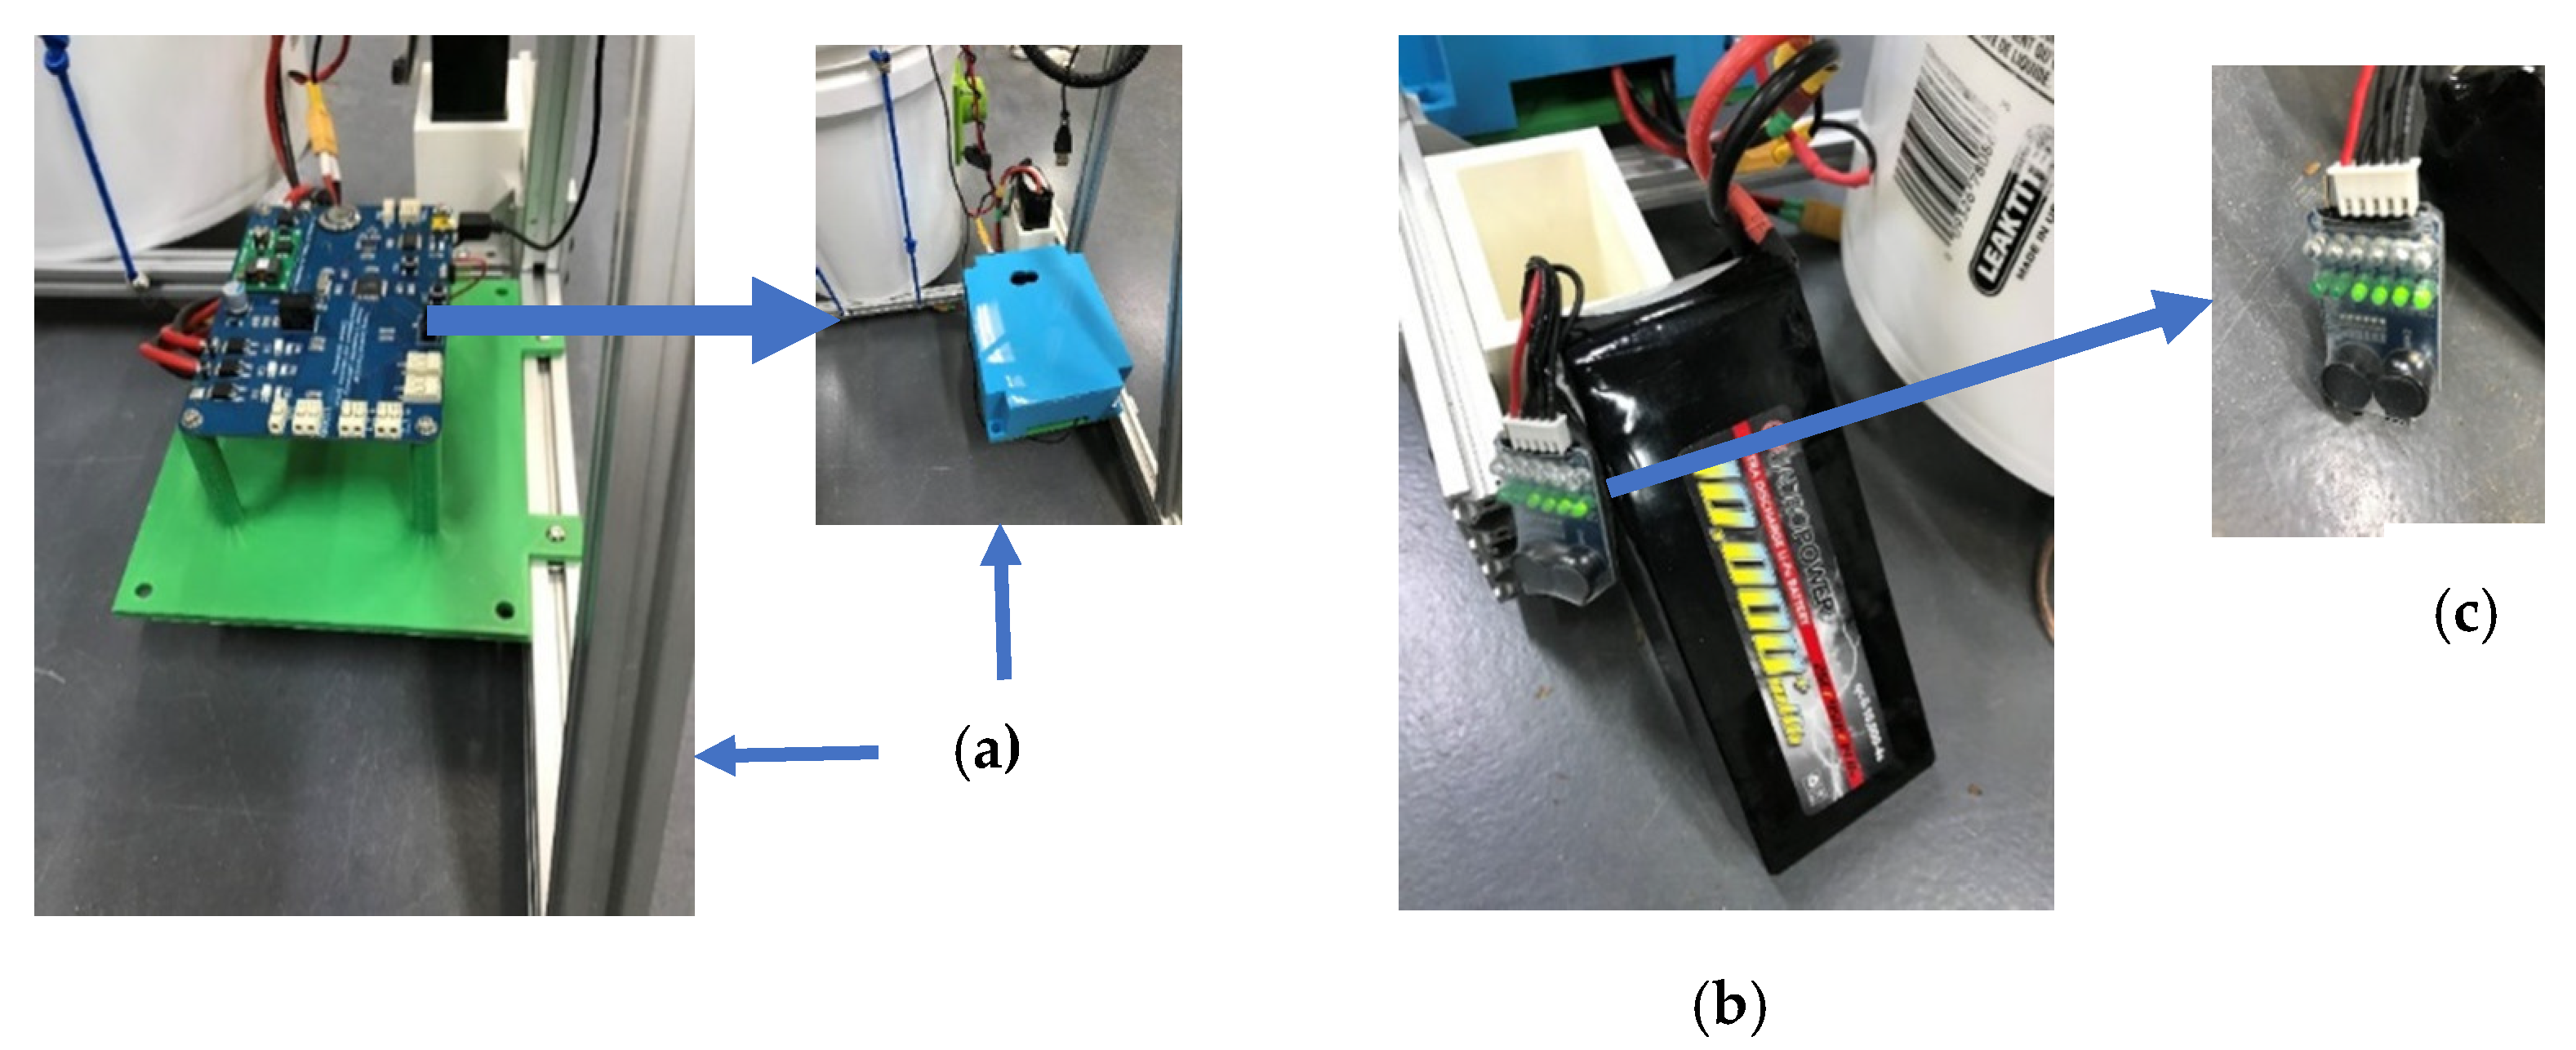
The complete harvesting module used a low-voltage blower motor (McMaster 12 V DC 12 A, 1000 rpm, and 7 Cubic Meters per Minute (CMM) attached on top of a 19 L-bin. The blower’s 10.16 cm diameter inlet port was connected to the bin′s top cover through a rubber hose. A hole was made to fit a 6-feet corrugated hose on one side of the bin with a 3.17 cm diameter opening. At the tip of the hose was a 3D-printed nozzle tied to an extrusion frame that extends on one side of the robot. The nozzle’s position was fixed prior to harvesting operations where most cotton bolls were situated along the plant row. A custom-built controller board (AtMega 644P, Microchip, AZ, USA) interfaced to the robot’s onboard PC controls the blower motor, and the light blinker that serves as a warning device during operation is shown in Figure 5. The controller board, blower, and blinker are powered by an external 12 V DC lithium polymer battery (Figure 5b). All the harvester components were attached to an aluminum extrusion assembly frame that can be easily retrofitted to the robot’s frame. The combined setup of the mounted harvester integrated on the mobile robot platform is shown in Figure 6.
2.2. Navigation
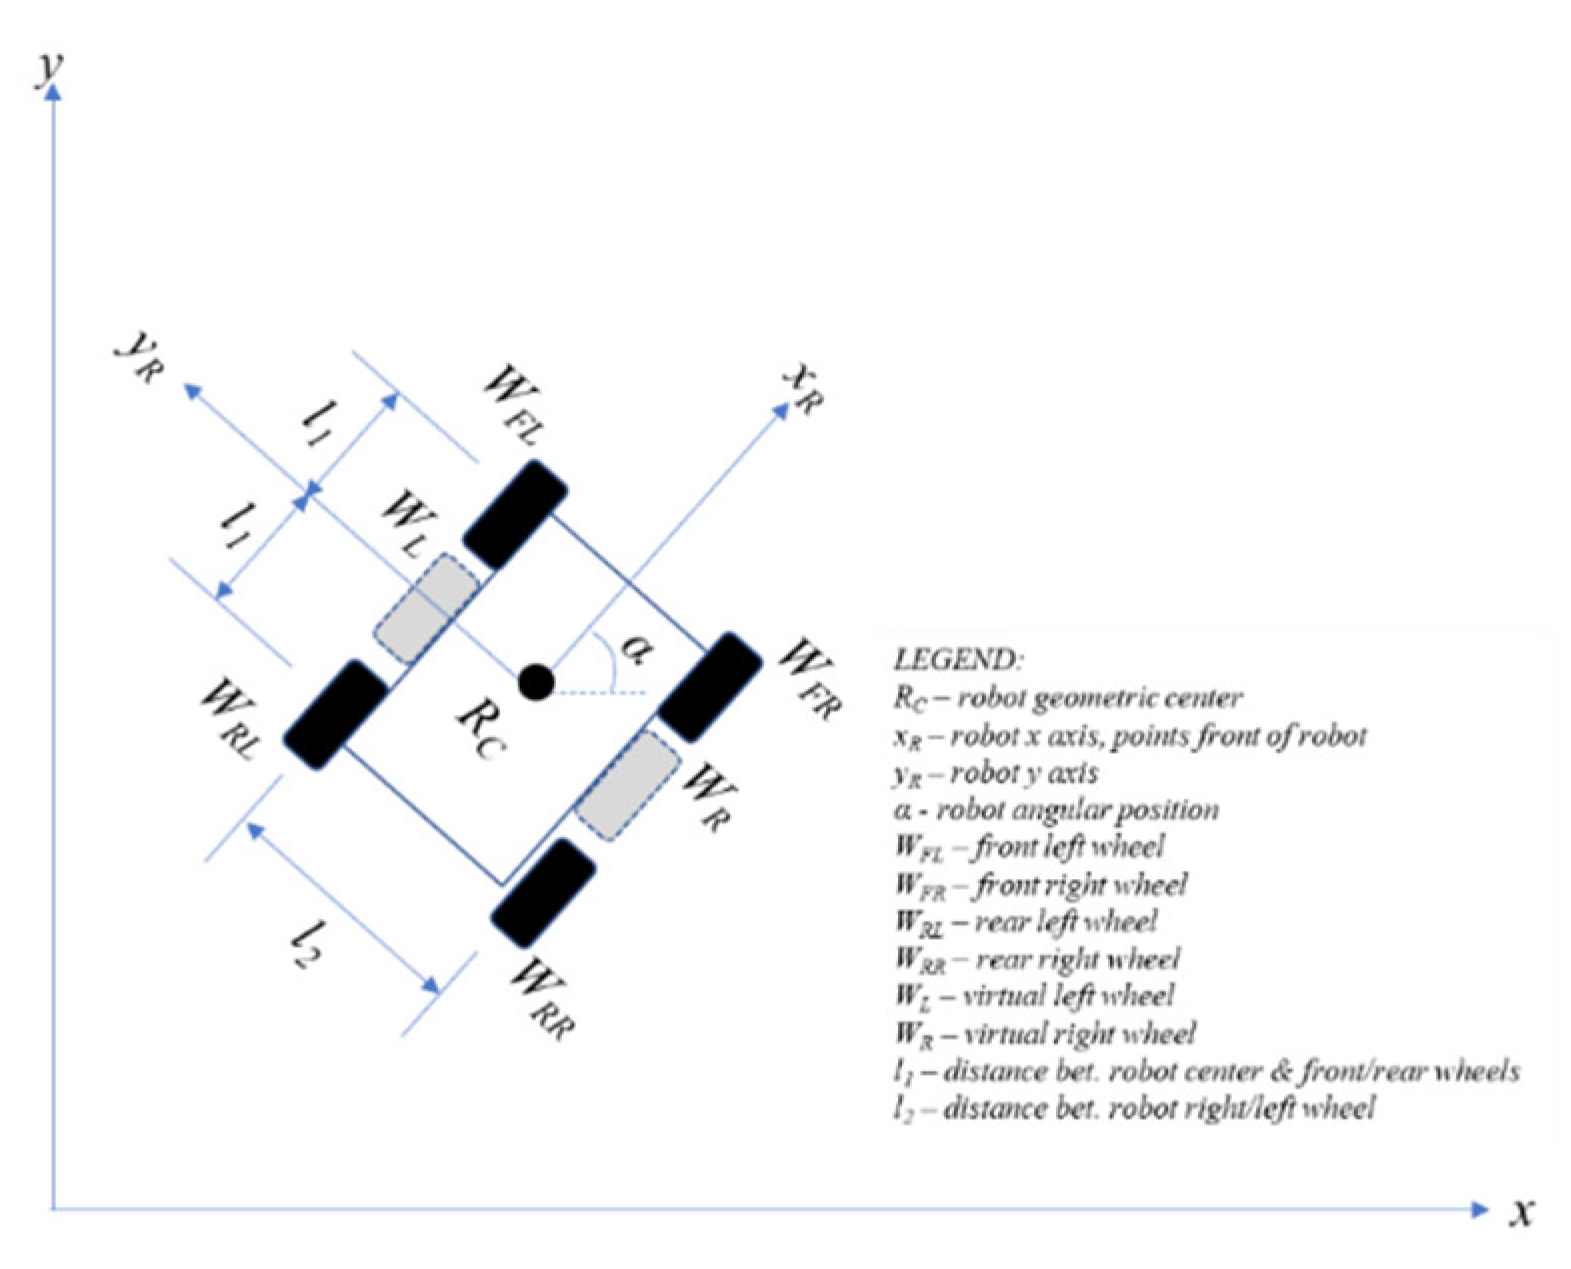
Autonomous field navigation is achieved by having a digital map of the field and localizing the robot on that map. Localization involves integrating the coordinate frame of the robot with the coordinate frame of the digital map. The robot’s coordinate frame, commonly referred to as its odometry, estimates the robot’s position and orientation over time. The accuracy of the robot’s odometry may be enhanced by integrating it with other positional readings from an IMU or a GPS device. The robot’s position is first determined using the kinematic model in Figure 7. The kinematic model of the four-wheeled robot used in this study was treated as a two-wheeled differential robot with virtual wheels WL and WR to simplify calculations. The robot’s current position is determined by a tuple (xc, yc, α) and its new position (xc, yc, α)’ after time δt, given its right and left virtual wheel linear speeds, vR and vL, respectively. The linear speed of each virtual wheel is shown in Equations (1) and (2).
where ω is the angular speed and r is the wheel radius. The angular speeds ω and angular position φ of each virtual wheel is the average of its real counterparts as shown in Equations (3)–(6),
vR = ωWR × r
vL = ωWL × r
φWL = (φWFL + φWRL)/2
φWR = (φWFR + φWRR)/2
ωWL = (ωWFL + ωWRL)/2
ωWR = (ωWFR + ωWRR)/2
The robot’s angular speed and position are shown in Equations (7) and (8),
Equations (9) and (10) compute the robot’s x and y component,
and the actual position is found using Equations (11) and (12),
α = (φWR − φWL) × (r/l2)
ά = dα/dt
ẋc = (vL + ά(l2/2)) cos (α)
ẏc = (vL + ά(l2/2)) sin (α)
xc = ∫t0ẋc dt
yc = ∫t0ẏc dt
The values of each variables above were stored in a data-serialization language, YAML Ain’t Markup Language (YAML). YAML is commonly used for configuration files specially in ROS. The YAML file is one of the many files that were setup to correctly configure the ROS navigation stack on the robot’s PC.
2.3. Robot Operating System (ROS) Navigation Stack and Cotton-Harvesting Autonomous Platform (CHAP) Navigation
The ROS Navigation Stack is an integrated framework of individual software or algorithmic packages bundled together as nodes for steering the robot from one point to the next, as shown in Figure 8. Users configure the navigation stack by either plugging in built-in or custom-built packages in any of the navigation stack nodes. Estimation of the robot’s odometry is therefore handled internally by the nodes in the navigation stack that automatically loads, reference, and updates the configuration file during runtime execution of the robot.
In this study, the field′s digital map was generated using a GMapping algorithm, a variant of simultaneous localization and mapping (SLAM) algorithm [36,37]. GMapping involved fusing the robot’s odometry, GPS, IMU, and laser scanner readings using Kalman filters and Rao-Blackwell particle filters (RBPF) to determine the robot’s current position and orientation on the map. A custom-built global/local planner package was then developed suitable for steering the robot within plant rows and avoiding obstacles using the laser scanner. To navigate, a graphical user interface (GUI) showing the map of the field allows users to either click points/segments on the map or hardcode the coordinates where the robot will navigate autonomously. These points/segments could be the locations of the cotton bolls to be harvested.
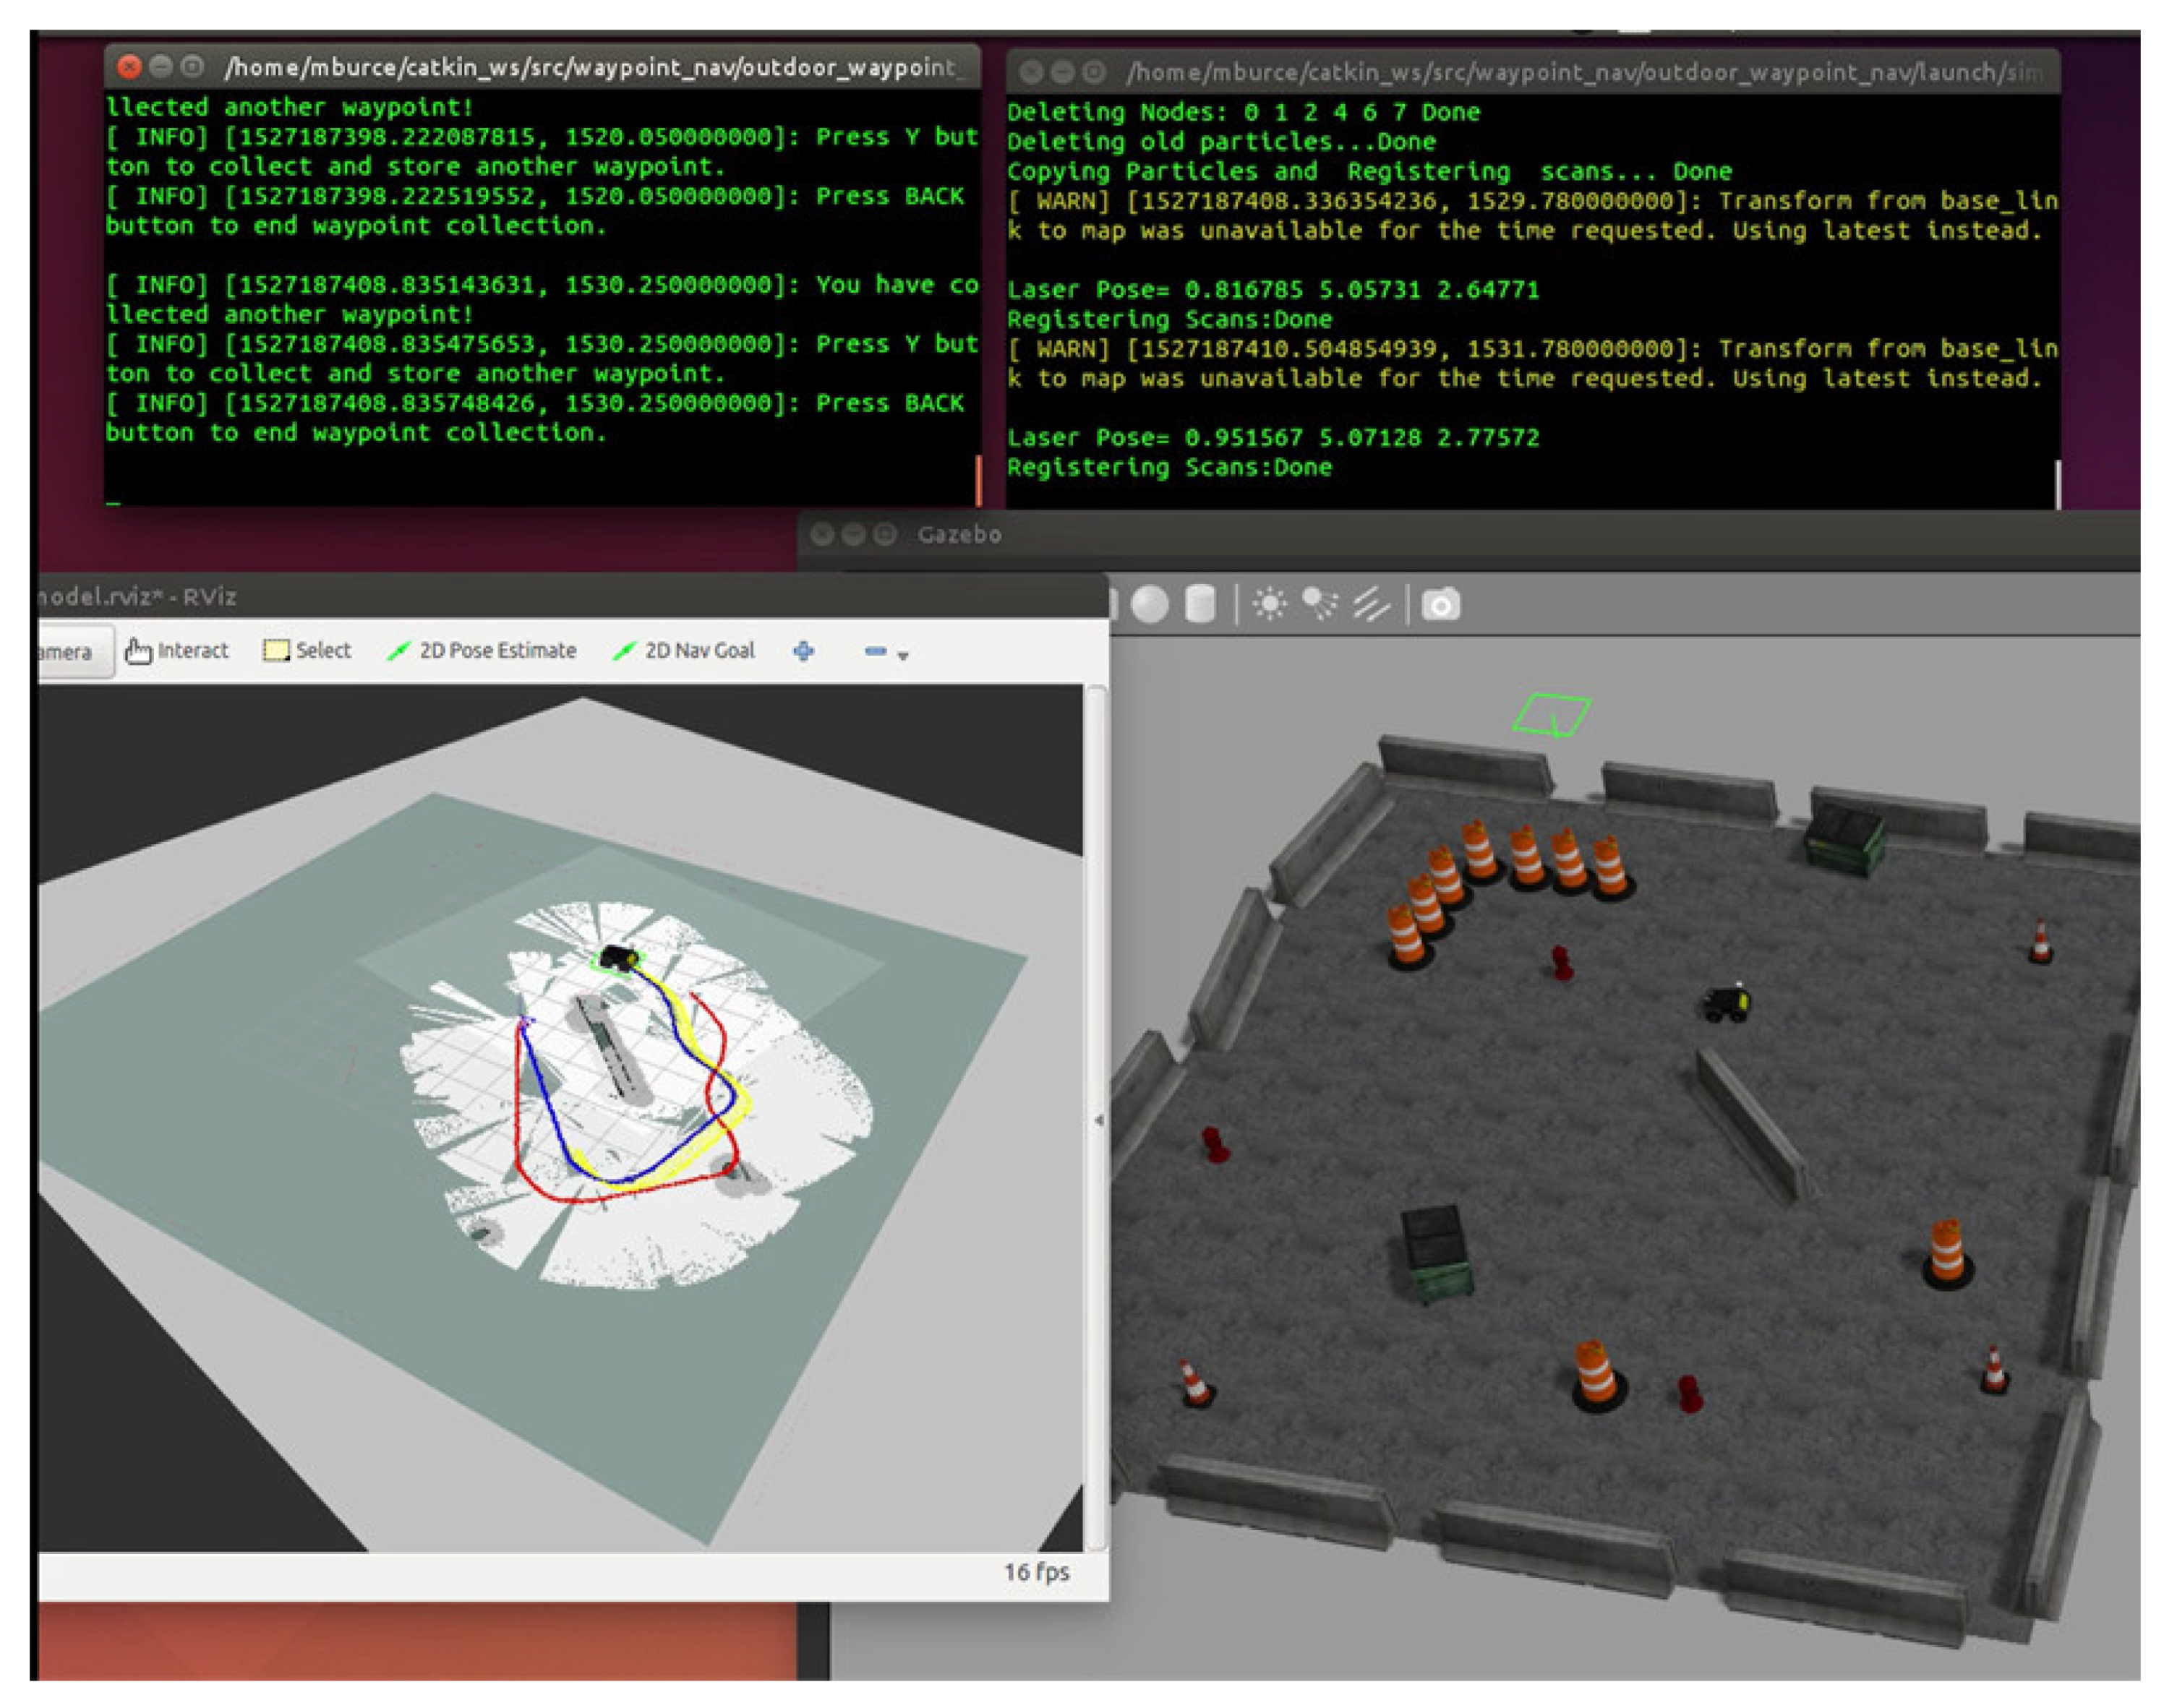
A computer program for the navigation and control of CHAP was developed. The program was tested via computer simulation using a pre-built model of the platform. For proper navigation, support devices like the GPS, IMU, and laser scanner were calibrated for the simulation to work. The results are shown in Figure 9. The lower right image shows the simulated playpen where the platform navigates, and the lower-left image shows its path and movement. The upper two terminals show the status readings of the different devices.
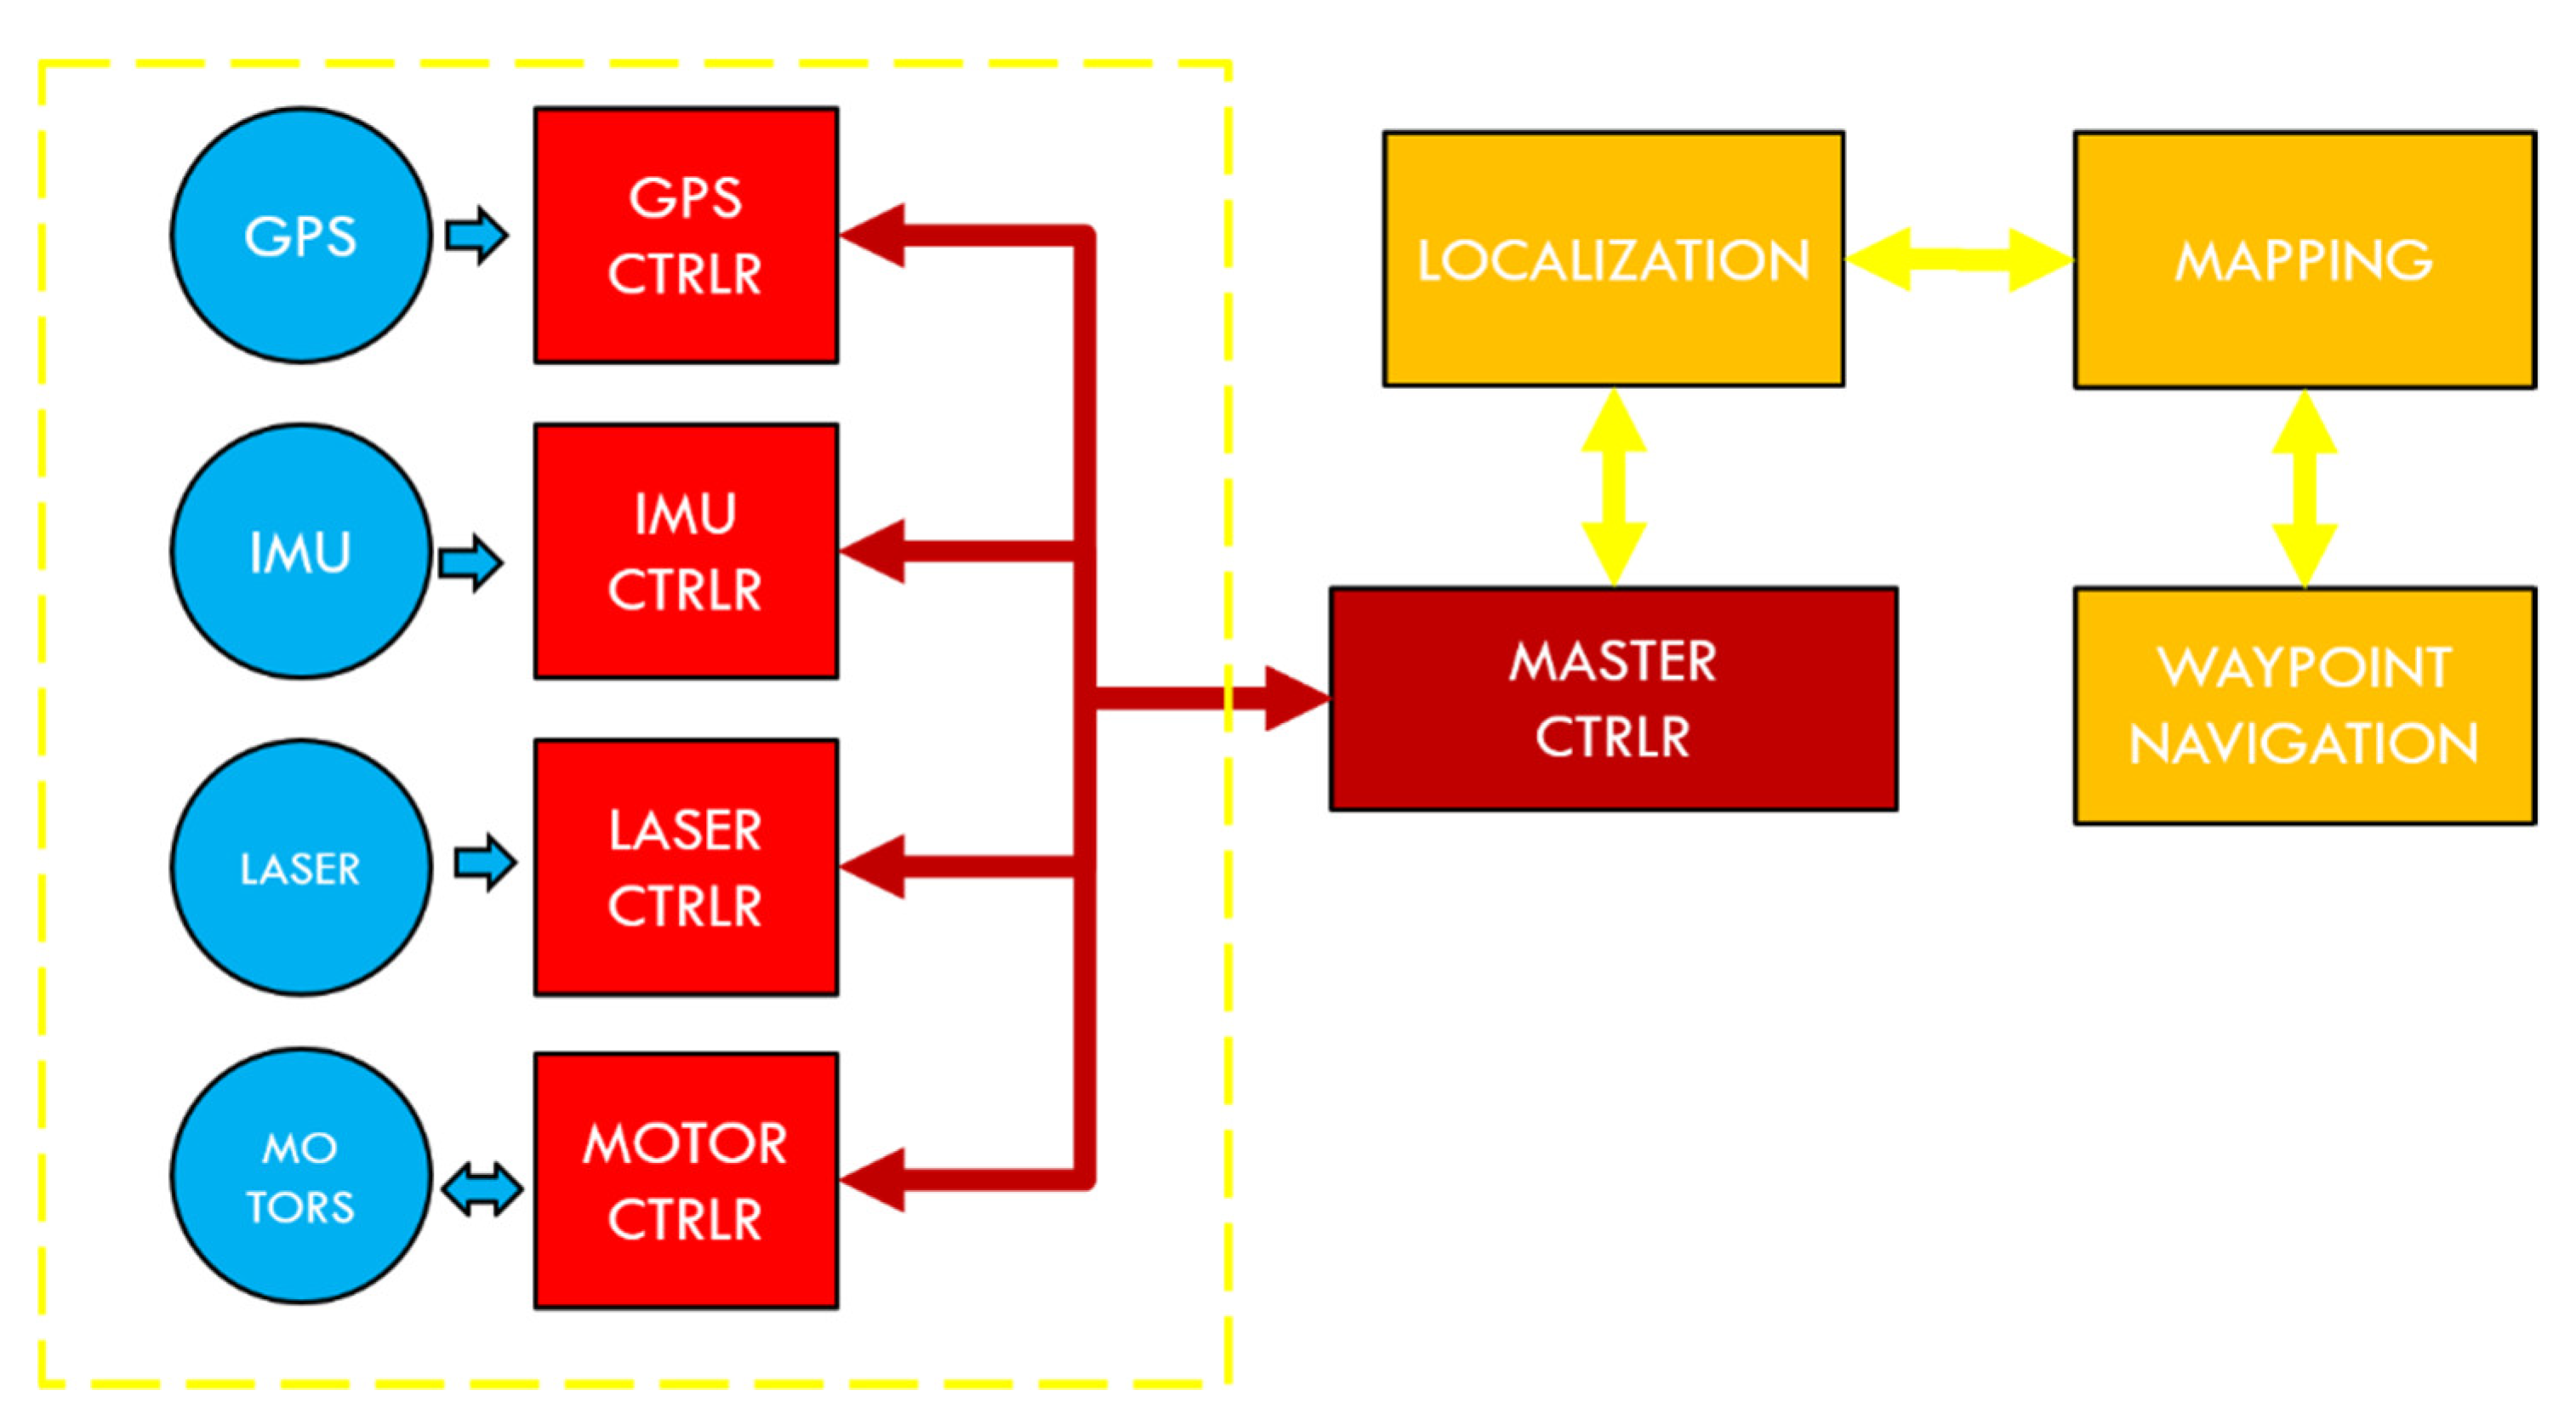
An overview of the hardware and software components needed for CHAP to navigate is shown in Figure 10. CHAP needs to know its location in a given map for it to navigate around it. To do this, it needs data readings from several sensors (GPS, IMU, and laser) for it to steer its wheel motors in the correct direction. Two essential tests (GPS accuracy and lidar precision) were conducted to configure and calibrate the hardware and software components and presented in Section 2.6.
2.4. Cotton Boll Harvest
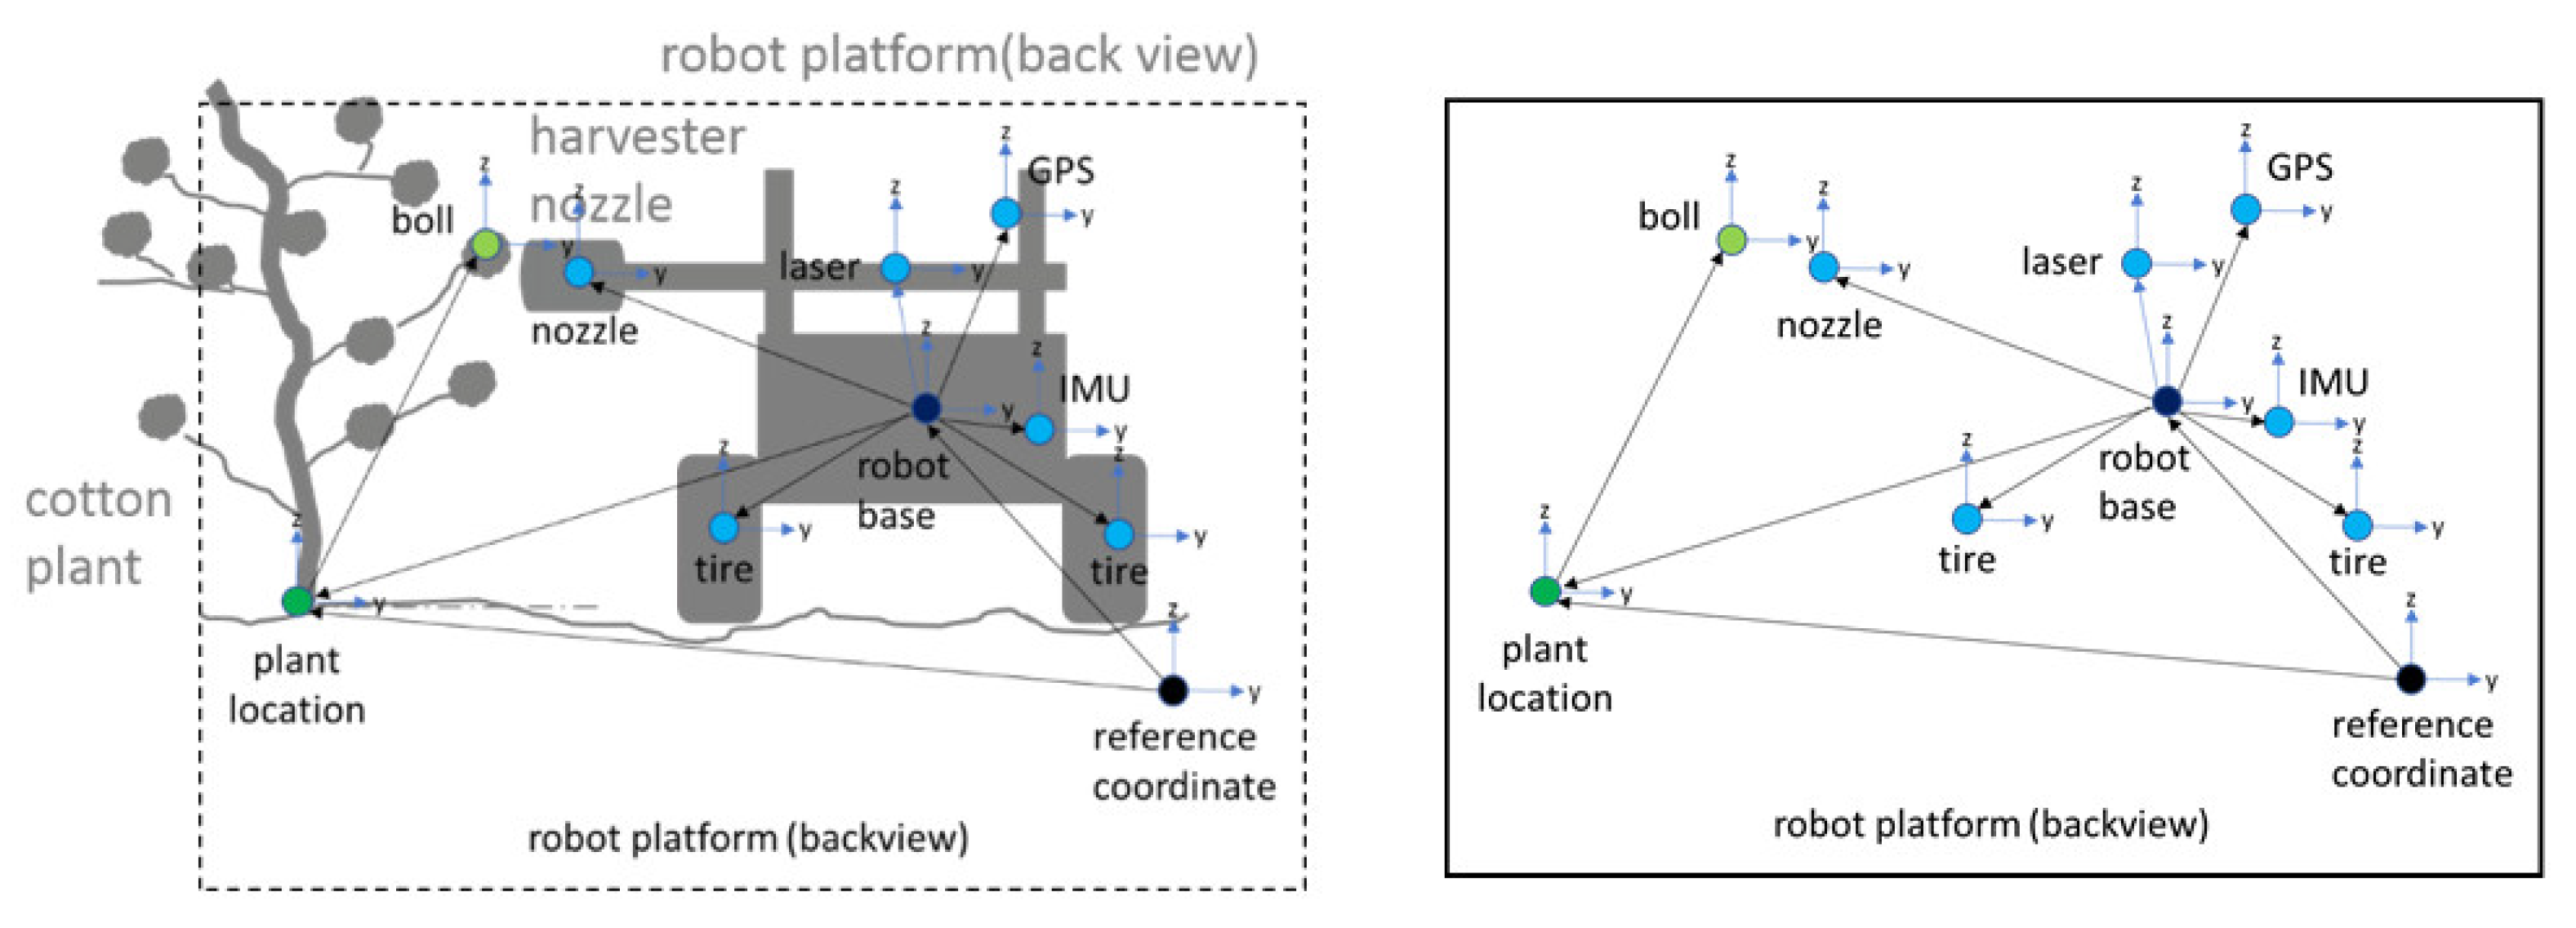
To harvest the cotton bolls on the plant, a common reference coordinate was first established between the robot base with respect to the plant location, as shown in Figure 11. Both the relative positions of the cotton bolls and the nozzle was then defined from this reference coordinate. Prior to harvesting, the average boll heights and boll offsets for each row or plot to be sampled were measured to calibrate the nozzle position. The nozzle position was located based on where most of the cotton bolls were expected. The robot was then programmed to keep track of its relative position away from the plant as it navigates along the rows. The robot also monitored the user′s points/segments, which signals the activation or deactivation of the blower motor and blinker to start or end the harvesting.
2.5. Study Site
An 82 × 142 sq m 29-row loamy sand field of cotton (Deltapine 1358 B2XF) was established with 96.5 cm row spacing and 10 cm in-row plant spacing at the Edisto Research and Education Center in Blackville, SC (33.3570° N, 81.3271° W). Seeding was done in early May and harvesting in the last week of November. Regular crop management practices were applied during the growing season. Laboratory and field tests were conducted to configure and evaluate the navigation and harvesting system′s performance before they were integrated.
2.6. Global Positioning System (GPS) and Laser Scanner Testing and Mapping
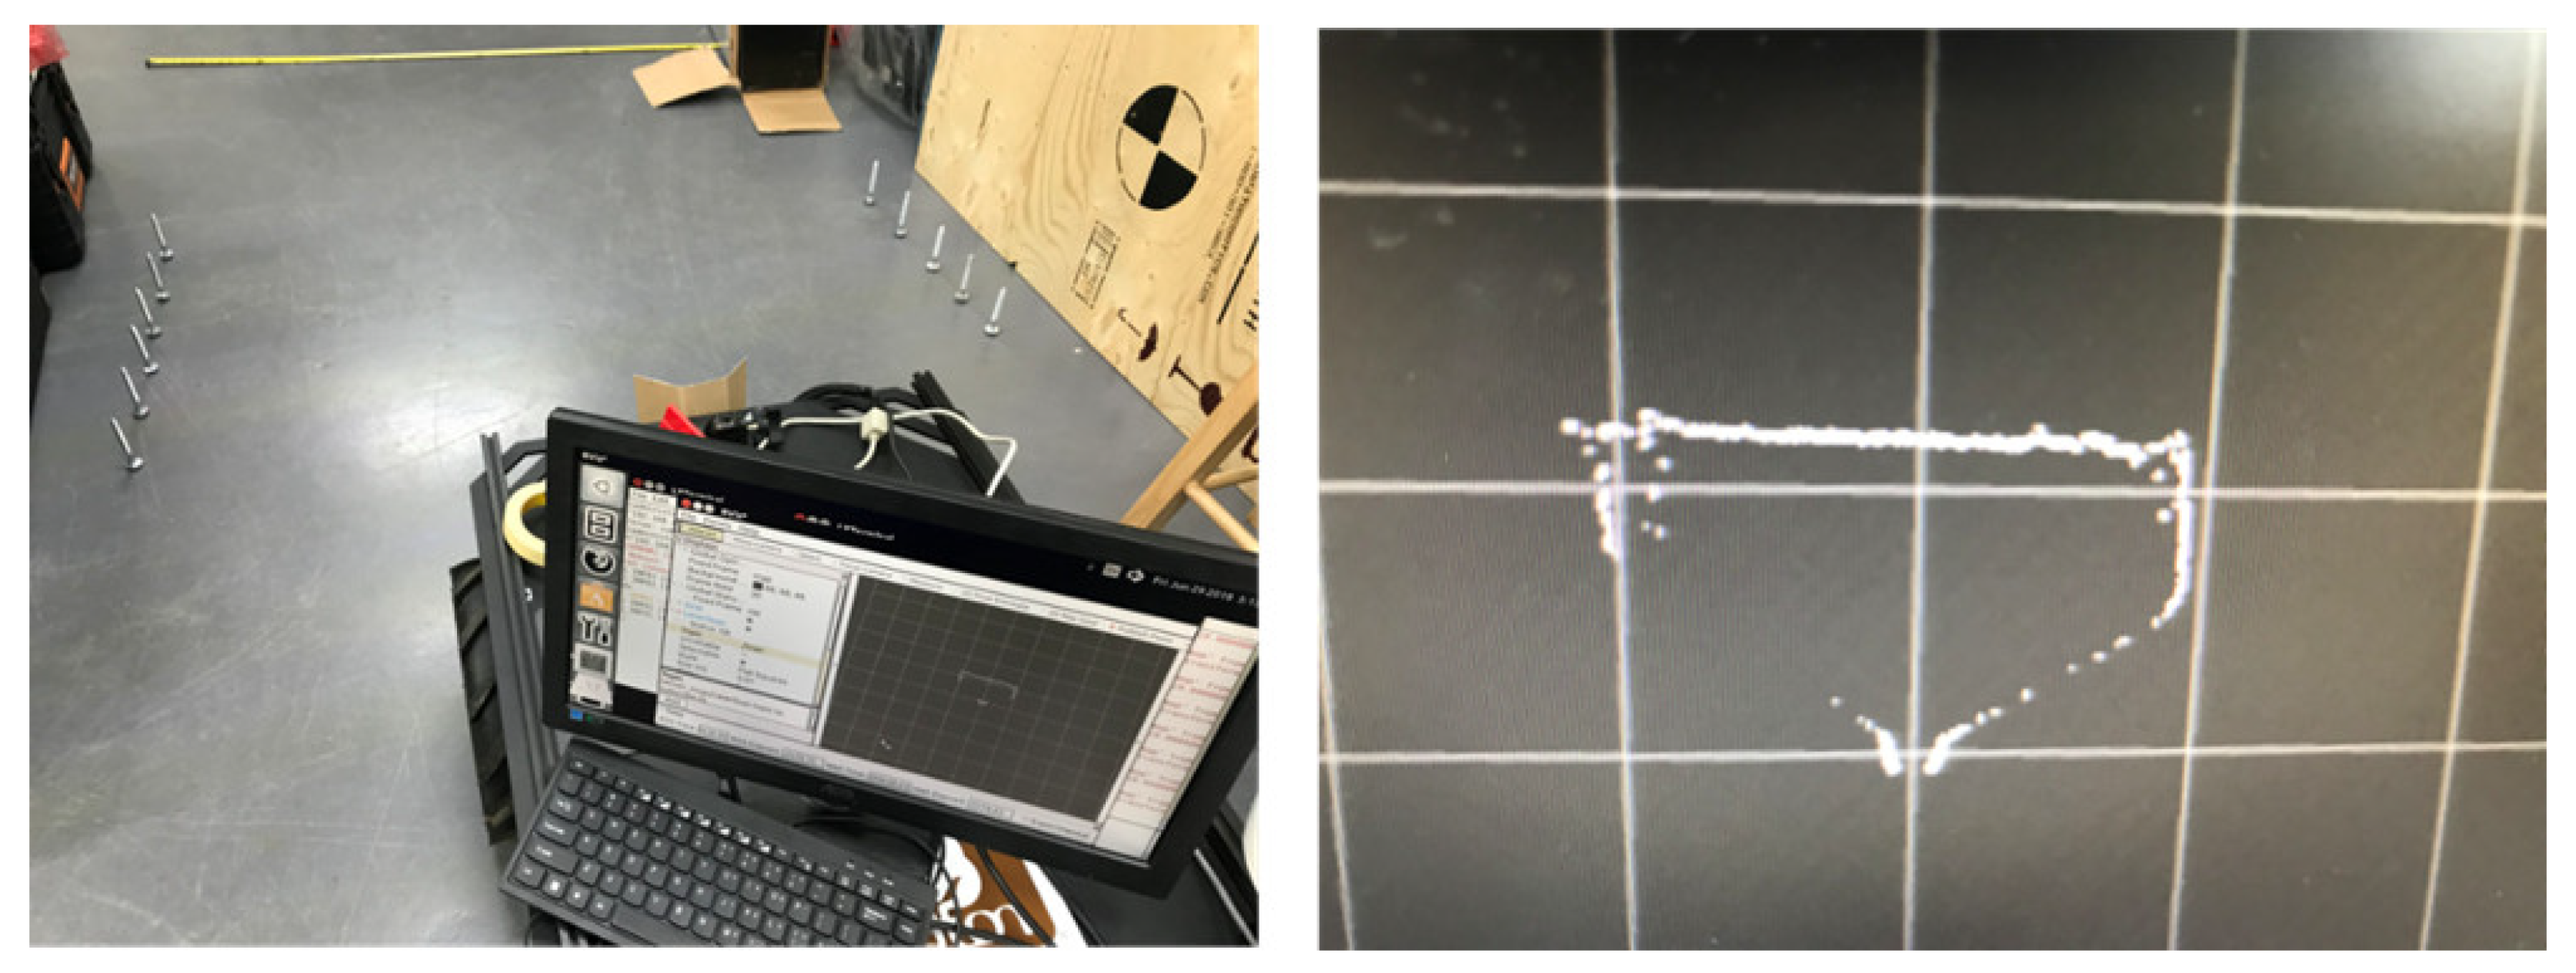
Key components of the navigation and harvester systems were first tested to determine if it satisfies the study′s objective and requirements. Onboard GPS, laser scanner, and other important components (e.g., blower motors, hose size, nozzle type, and size) were all subjected to test trials. But only the GPS and laser scanner will be presented, as these were the critical factors in autonomous navigation. For GPS, outdoor waypoint measurements were conducted to determine the longitude and latitude readings′ accuracy per waypoint. Seven sampling sites were chosen to test the accuracy of the GPS. While the laser scanner’s resolution was tested to determine if it detects the cotton stem′s diameter in a simulated experiment. In this test, smaller 6.25 mm diameter bolts were used as a simulated cotton stem. The bolts were lined up along the left and right edges. Due to the length of the bolts, the laser scanner sensor was moved to the lower front. For mapping, testing took place in both indoor and outdoor environments. For the indoor environment test, CHAP navigation was tested at the Sensor and Automation Laboratory and the whole building where the laboratory is located. The outdoor mapping test was conducted on the field with five rows.
2.7. Performance Evaluation
The performance of the robot in cotton harvesting was first evaluated in the laboratory in terms of how effective the harvester suctioned the cotton bolls and how close they should be to the nozzle. These tests will help calibrate the positioning of the robot relative to the plant and the positioning of the nozzle during the actual field harvesting. Two rows in the field were initially identified as the sampling rows. Ten cotton plant samples per row were taken to the lab. Each plant’s stem was cut above ground with all other parts of the plant intact. Plant samples were taken approximately two weeks after defoliation.
2.7.1. Lab Tests for Effective Suctioning Distance
Ten random cotton bolls per row were selected from the plant samples. Each cotton boll had about 4 to 5 locks. The nozzle was clamped to a vise grip, and a ruler was placed alongside its front opening to determine the suction distance. The blower motor was activated manually before individual cotton bolls were hand-drawn closer to the nozzle until they were suctioned. The distance between the nozzle’s tip and the edge of the cotton boll facing the nozzle was then measured and recorded.
2.7.2. Lab Tests for Effective Suctioning Distance
Ten random cotton bolls per row were selected from the plant samples. Each cotton boll had about 4 to 5 locks. The nozzle was clamped to a vise grip and a ruler placed alongside its front opening to determine the suction distance. The blower motor was activated manually before individual cotton bolls were hand-drawn closer to the nozzle until it was suctioned. The distance between the nozzle’s tip and edge of the cotton boll facing the nozzle was then measured and recorded.
2.7.3. Lab Tests for Suctioning Locks per Boll
A lab setup that simulated actual field harvesting was conducted. Plants were lined up and mounted in a makeshift rack inside the lab. Ten random cotton bolls per row were selected from the plant samples. Bolls of each plant targeted for harvesting were all aligned along the traversal path of the nozzle. The robot was then programmed to traverse along the simulated plant row with the harvester activated at a traversal speed of 0.5 m/s. The number of locks successfully suctioned per boll per plant was recorded at the end of each robot’s pass. There were about five robot passes for each boll. On each pass, either the plant or the nozzle’s position was adjusted so that all the locks on a boll were tested for harvesting. Each boll was scored based on the ratio between the number of locks suctioned over the total number of locks for that boll.
2.7.4. Field Tests for Harvester Performance
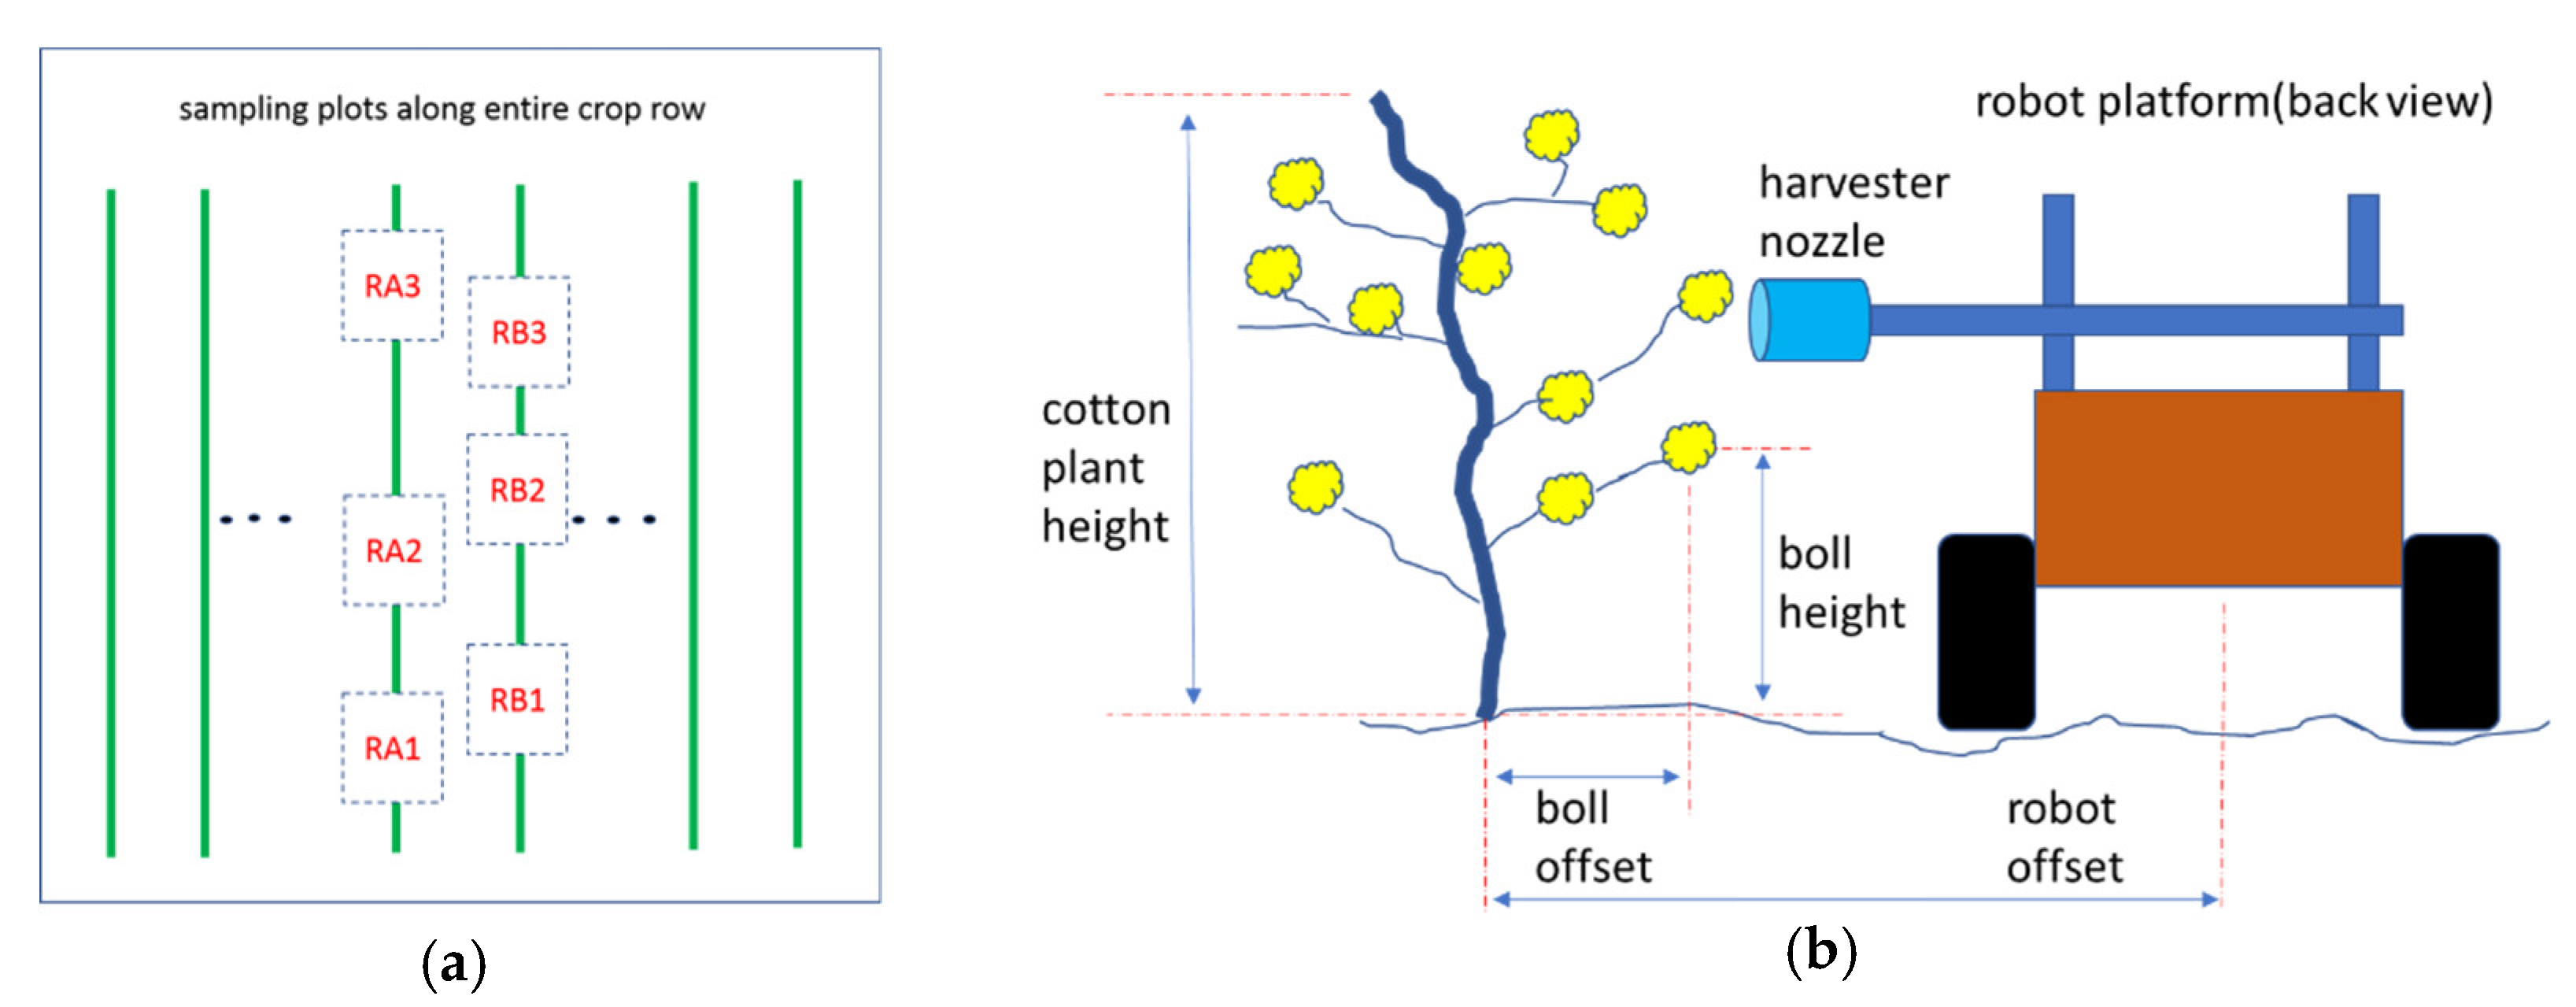
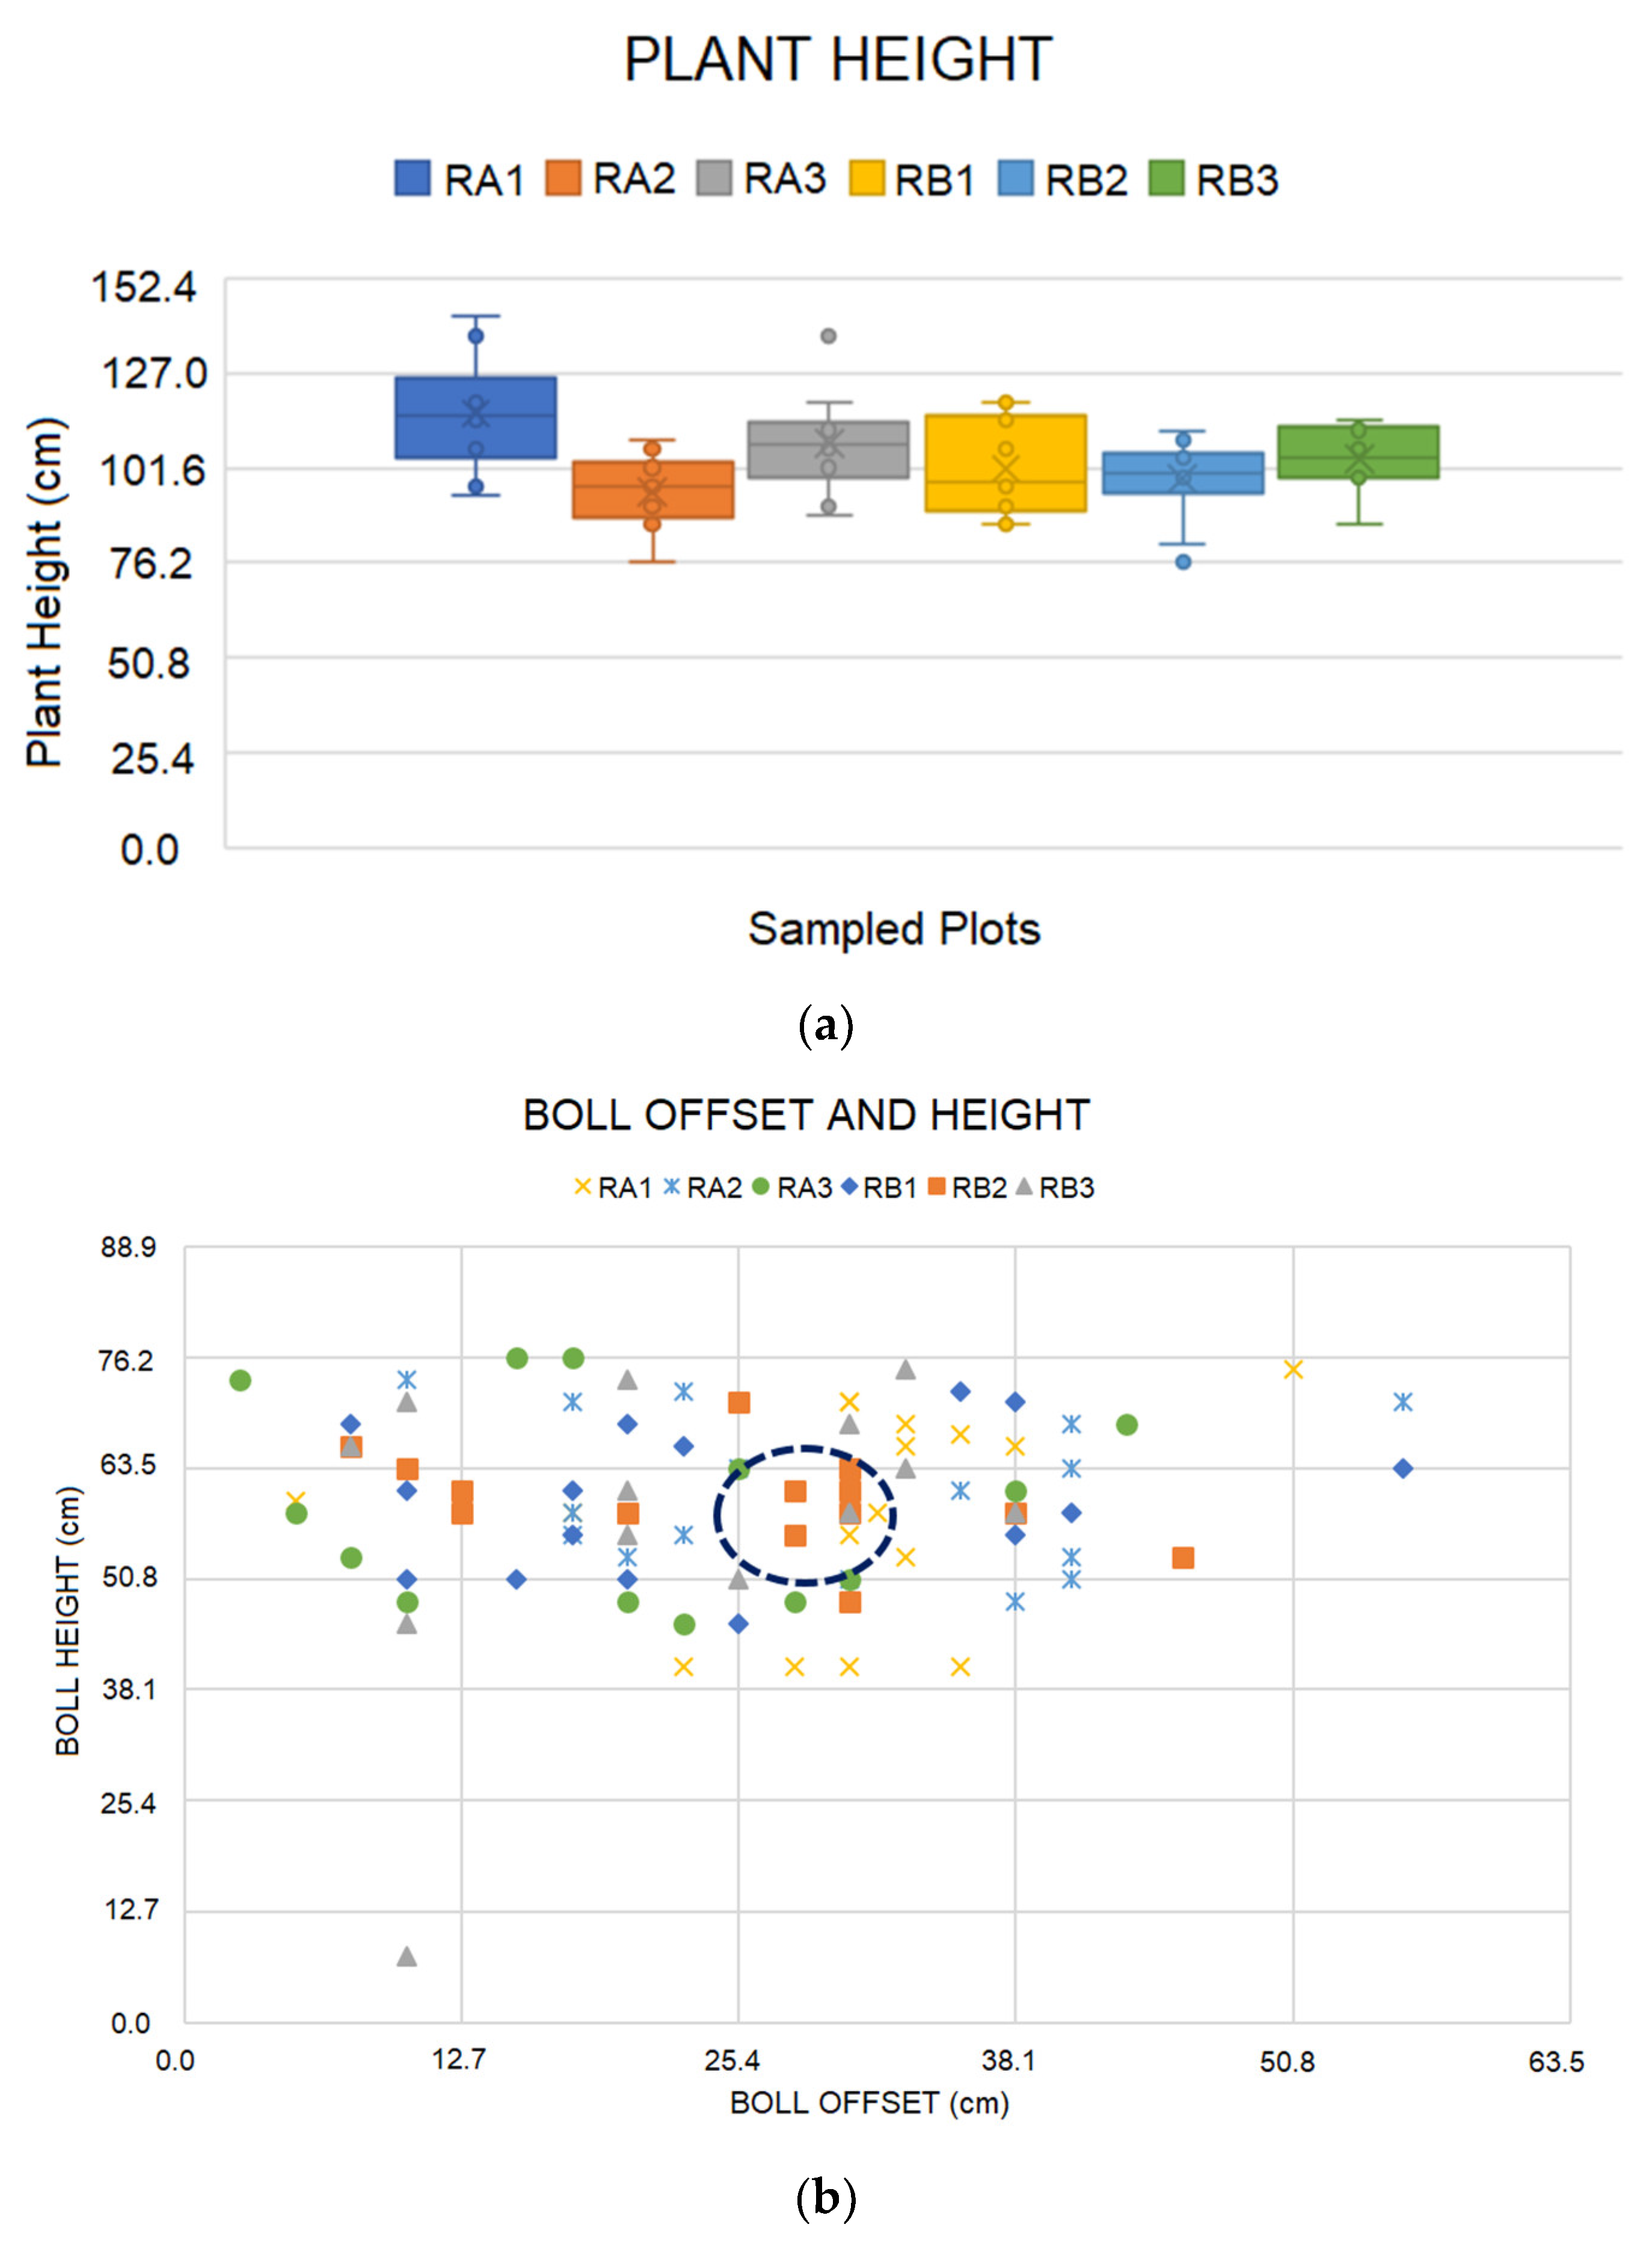
Cotton boll yield sampling based on Goodman et al. (2003) [38] was applied during the field tests. The yield estimate is based on the standard sample length of 3 m row. The bolls were then picked in the 3 m row and weighed to obtain better result. However, an assumption can be made about the weight of the bolls (~4 g) and so picking the number of bolls with the assumption that each boll weighs 4 g is sufficient to predict the yield. In our case, we were interested on how many bolls our suction system could harvest in a 3 m row. Note that since we only had one suction cap, the number of cotton bolls that could be harvested would be limited to that particular location. Two 3 m row (RA and RB) sampling locations were selected and then subdivided into three subplots. The subplots were labeled RA1 to RA3 and RB1 to RB3, as shown in Figure 12a. Each subplot had 10 consecutive cotton plants. The 3 m row was subdivided into subplots to account for the variabilities observed at the time of the measurements. Differences in plant height and cotton boll opening along the row were visually observed. To determine the position of the cotton bolls on each plant, measurements were made on the plant height, boll distance from stem (boll offset), and boll height above ground. These measurements were used to calibrate the position of the harvester nozzle targeting where most of the bolls are located as shown in Figure 12b. Measurements were all done two to three weeks after defoliation. The robot′s harvesting performance was evaluated by counting the number of cotton bolls that were harvested on the sampled rows.
3. Results
3.1. GPS and Laser Scanner Testing and Mapping
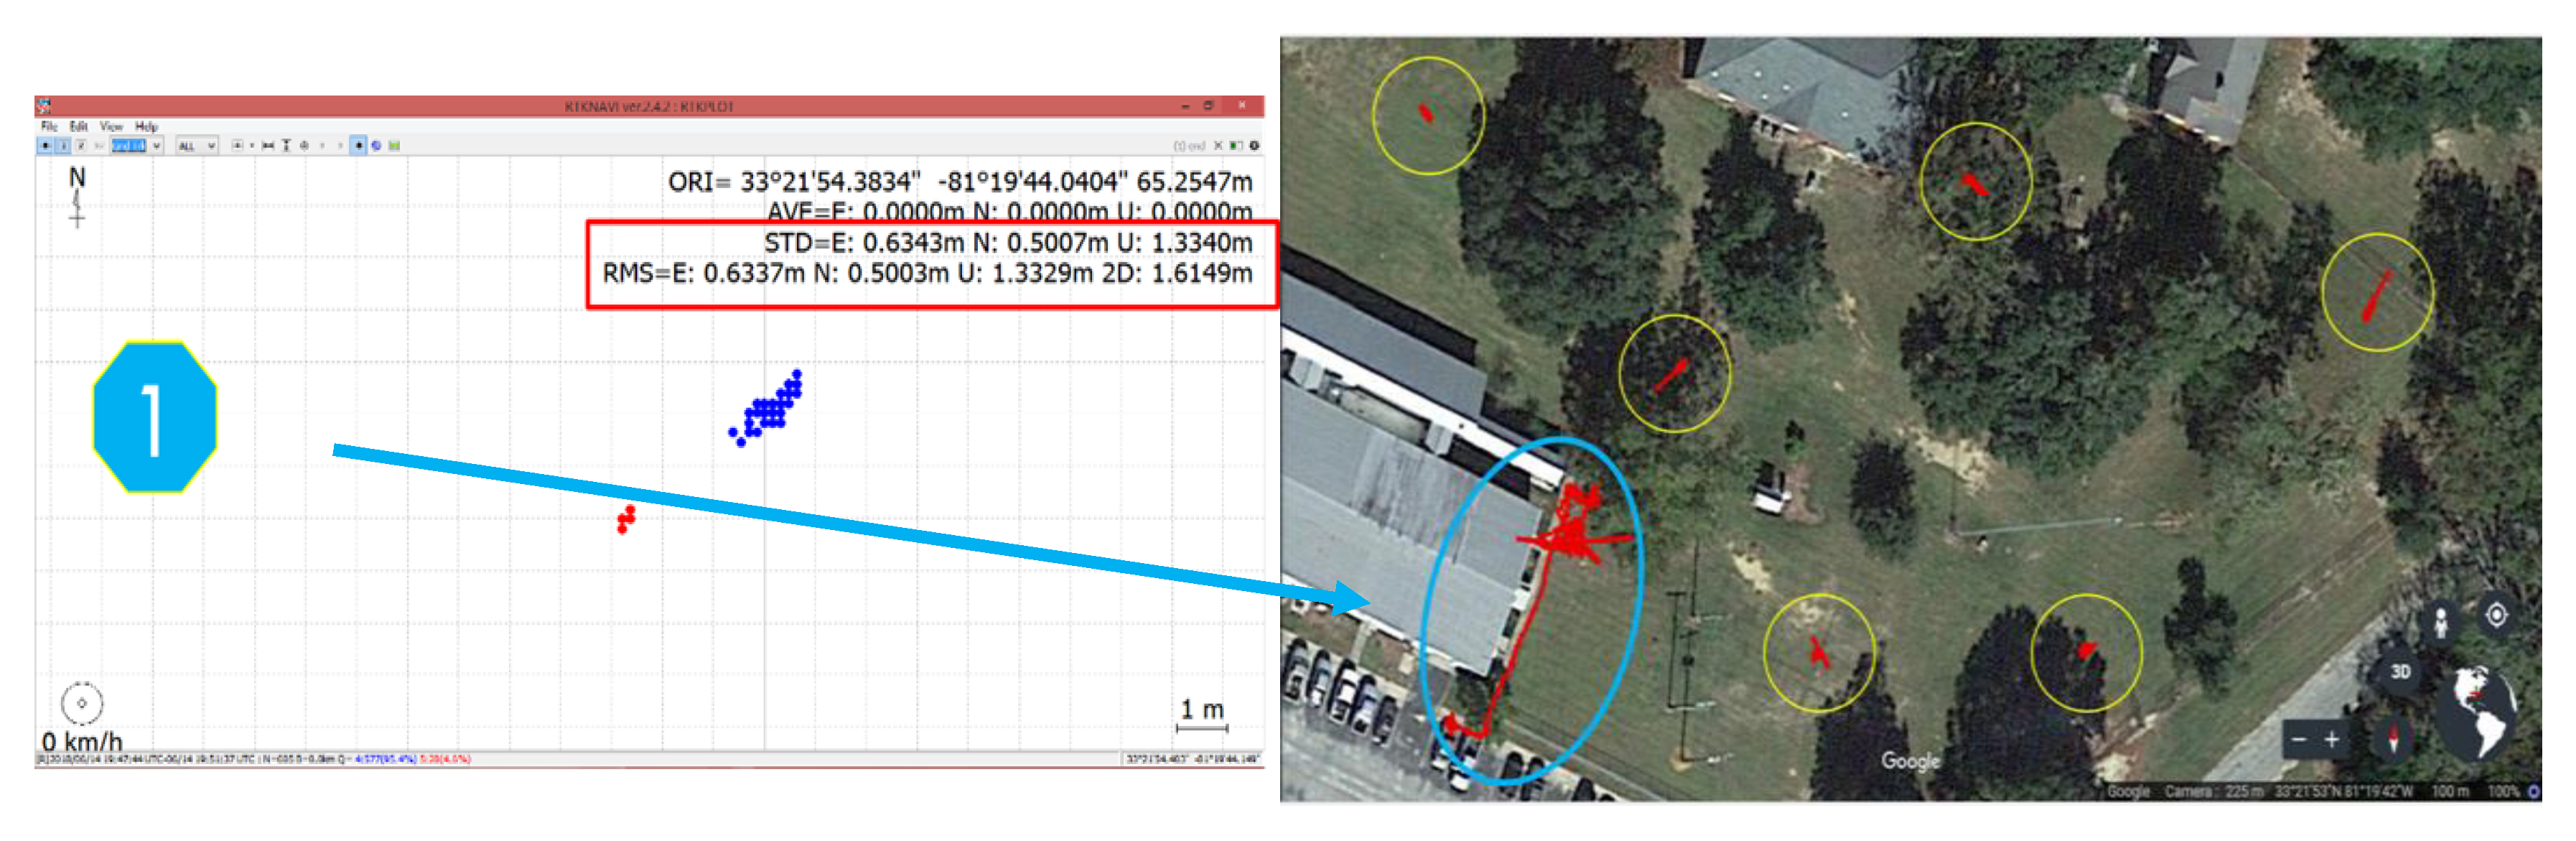
The onboard GPS accuracy was tested in seven sampling sites with varying field conditions and with the results are shown in Figure 13. The red markings inside the yellow circles are the GPS position readings for that sampling site. On average, a 0.6 m positional error for both easting and northing measurements was observed except for the first sampling site (blue markings). The GPS accuracy results showed more than half a meter average error on the longitude and latitude readings of the waypoints measured. This error is significant when the robot navigates in narrow rows. However, the issue was addressed by fusing the GPS, IMU, and odometry readings using filters.
The laser scanner’s resolution test showed that it was possible to detect the cotton plant′s stem as the bolts of 6.25 mm diameter were all detected. The cotton stem’s diameter is known to be much more significant after defoliation. The results of this test are shown in Figure 14.
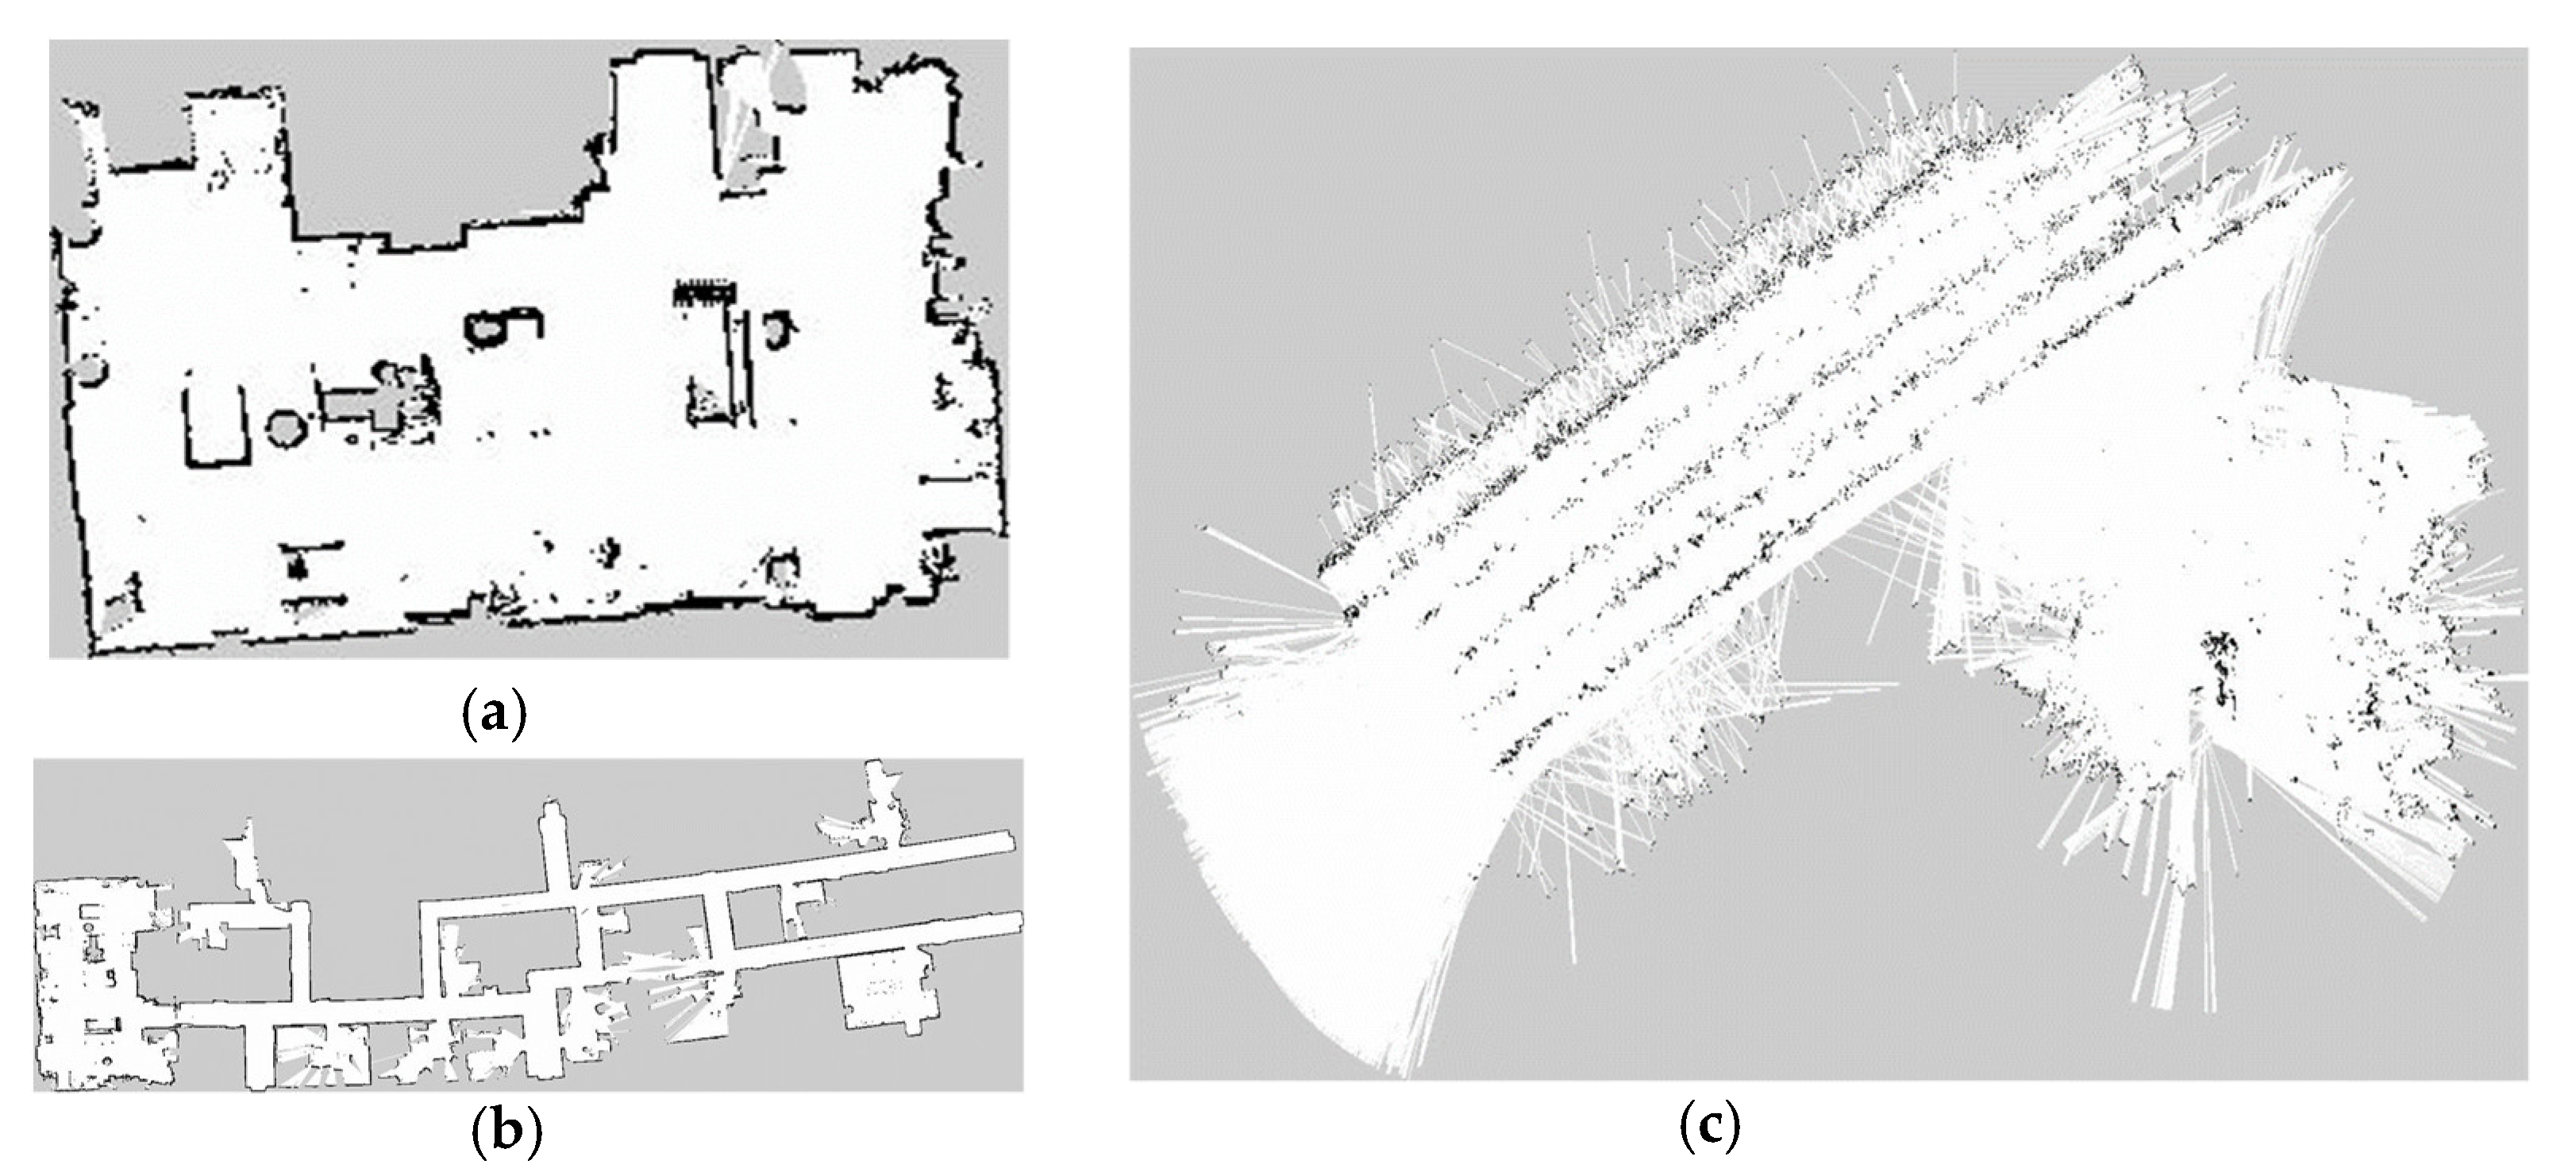
The mapping test used a mapping program, GMapping, where the indoor test was done in the Sensor and Automation Laboratory and the Edisto Research and Education Center hallway, while the outdoor mapping test was done in one of the fields of the center (33.358668° N, 81.313234° W). Results for the indoor map test are shown in Figure 15a,b and the cotton field map in Figure 15c. An implementation of the navigation is available at the Supplementary Materials Section.
3.2. Laboratory Tests for Effective Suctioning Distance
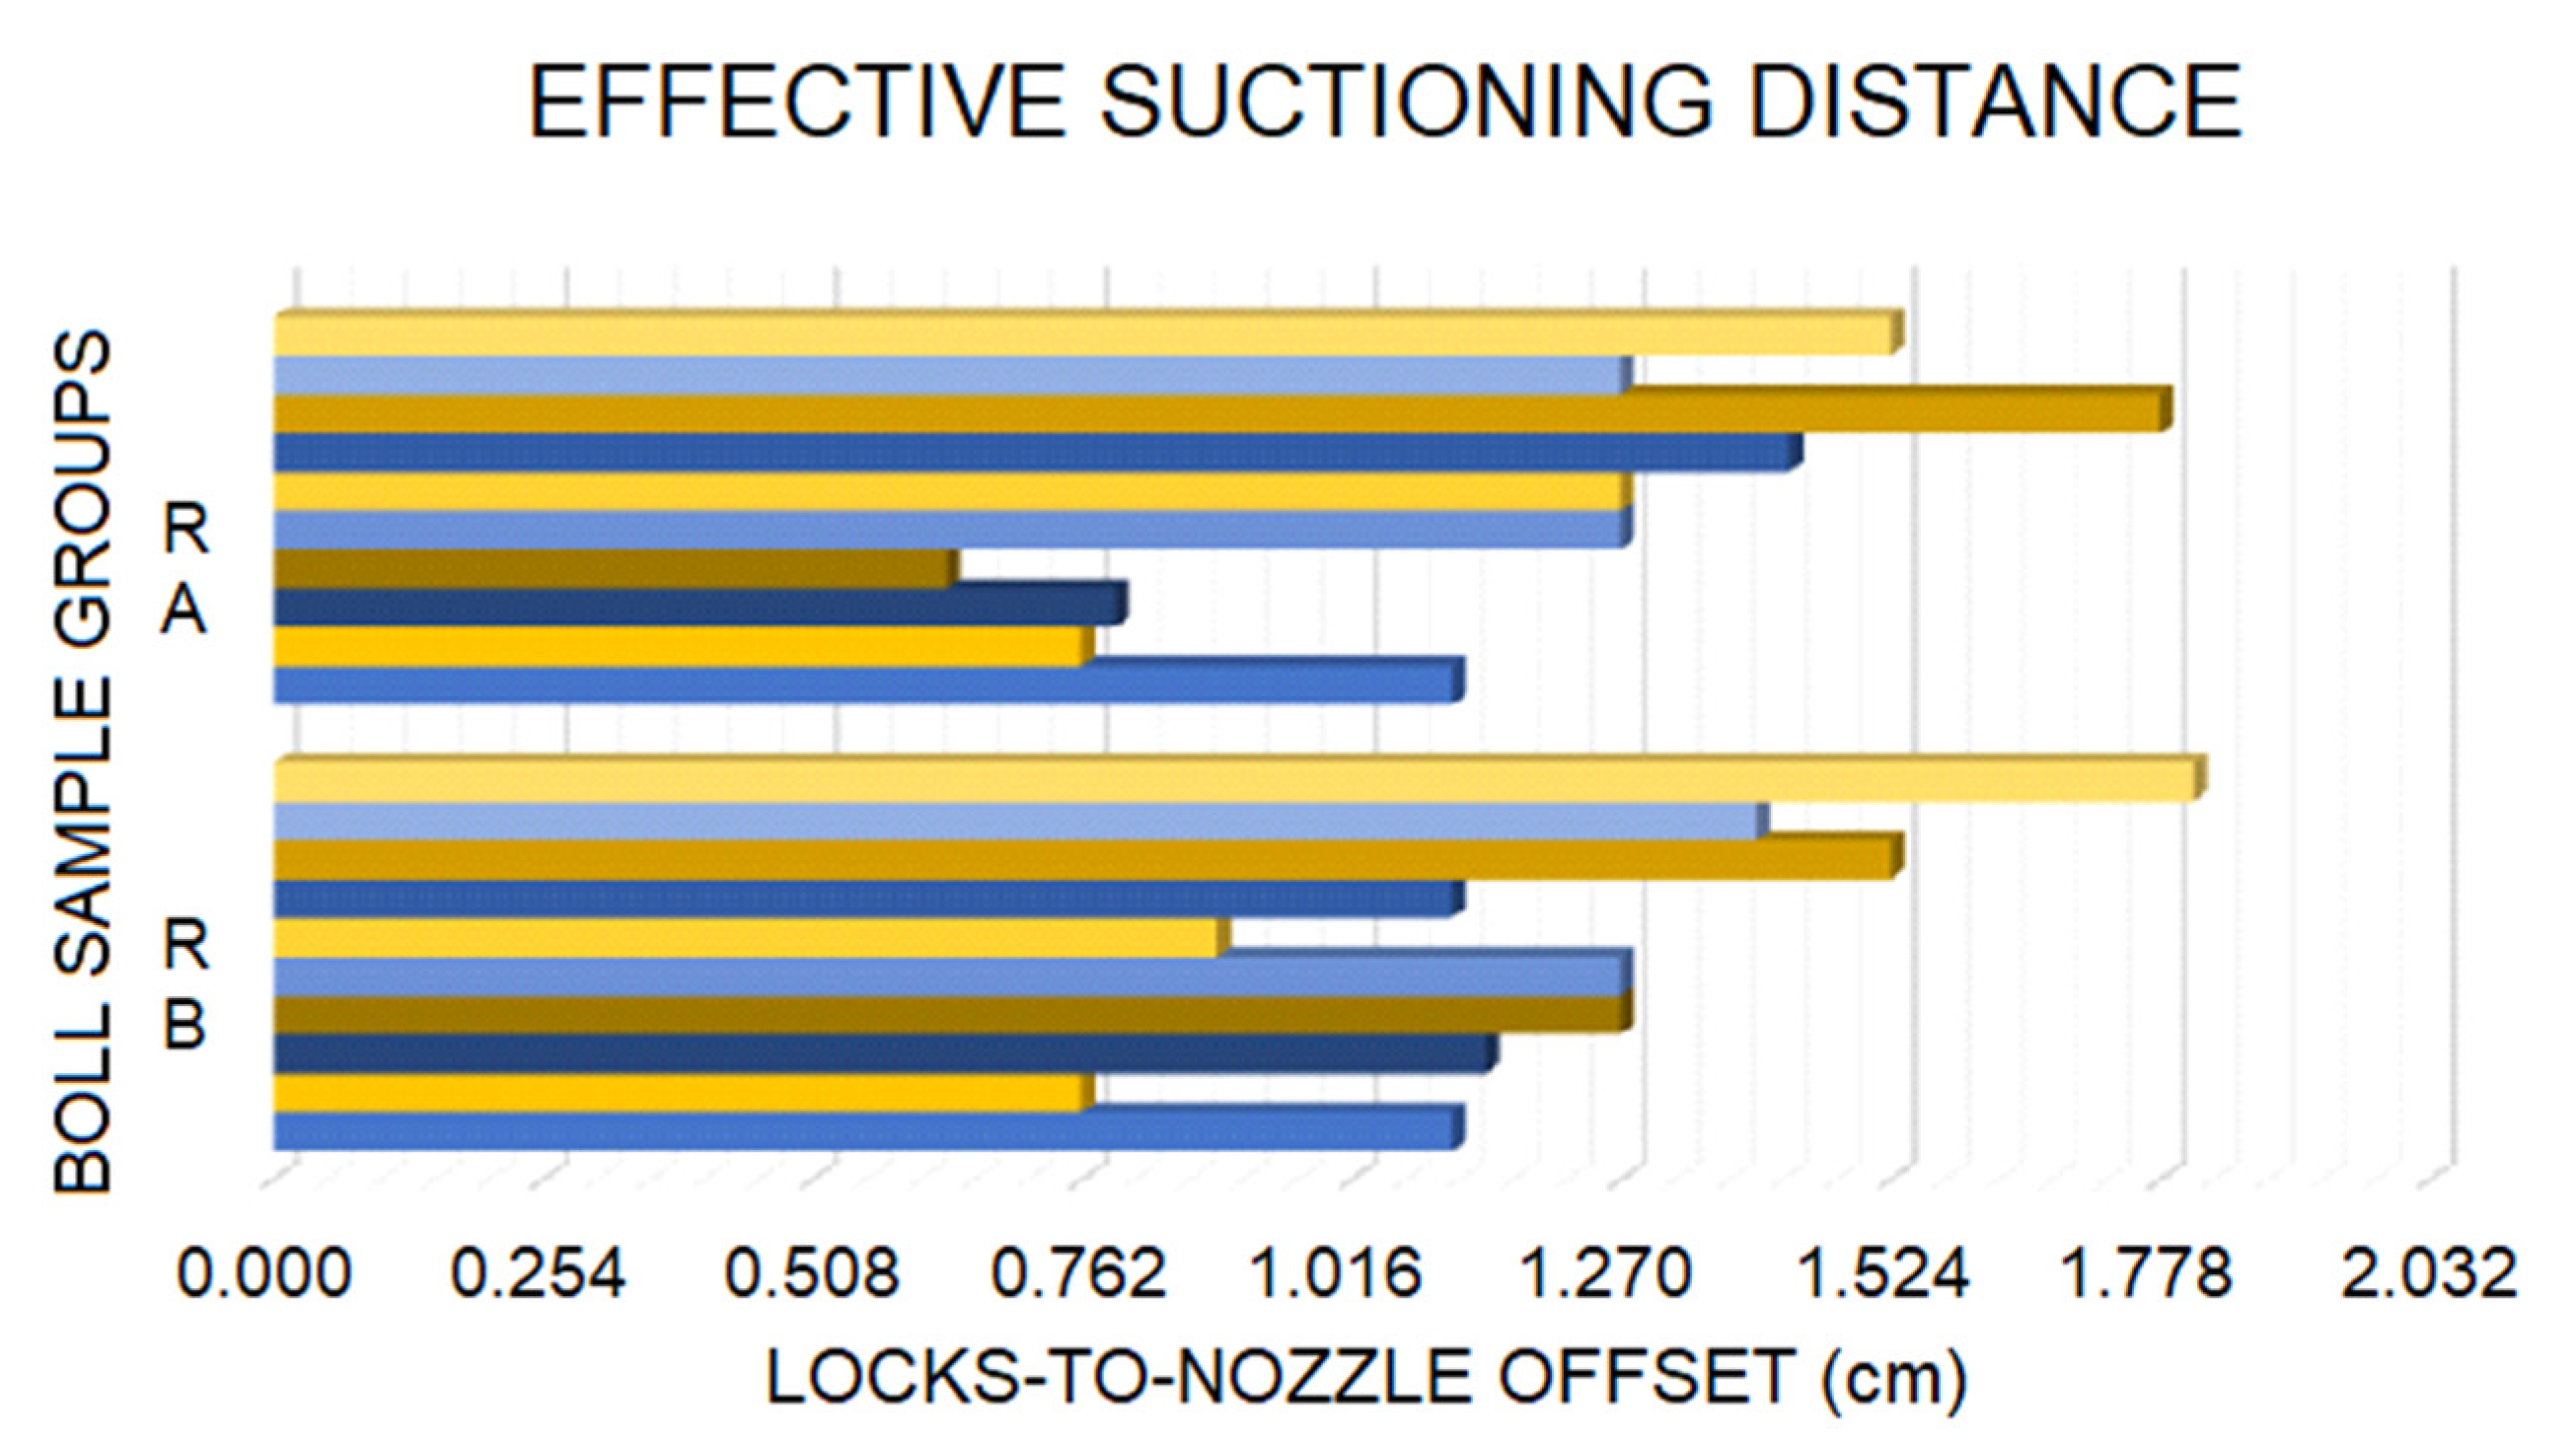
Most of the locks were suctioned-off the boll 1.27 cm away from the nozzle for the developed suction system. Figure 16 shows the average offset distance of 12 mm and 11.6 mm for rows A and B, respectively. Results indicate that the developed harvester does not have enough vacuum power to suction the entire boll; however, it is strong enough to suction the locks on each boll. Typically, only one lock is suctioned from each boll. In some instances, two locks were suctioned when both locks were close to the nozzle.
3.3. Lab Test for Suctioning Locks per Boll
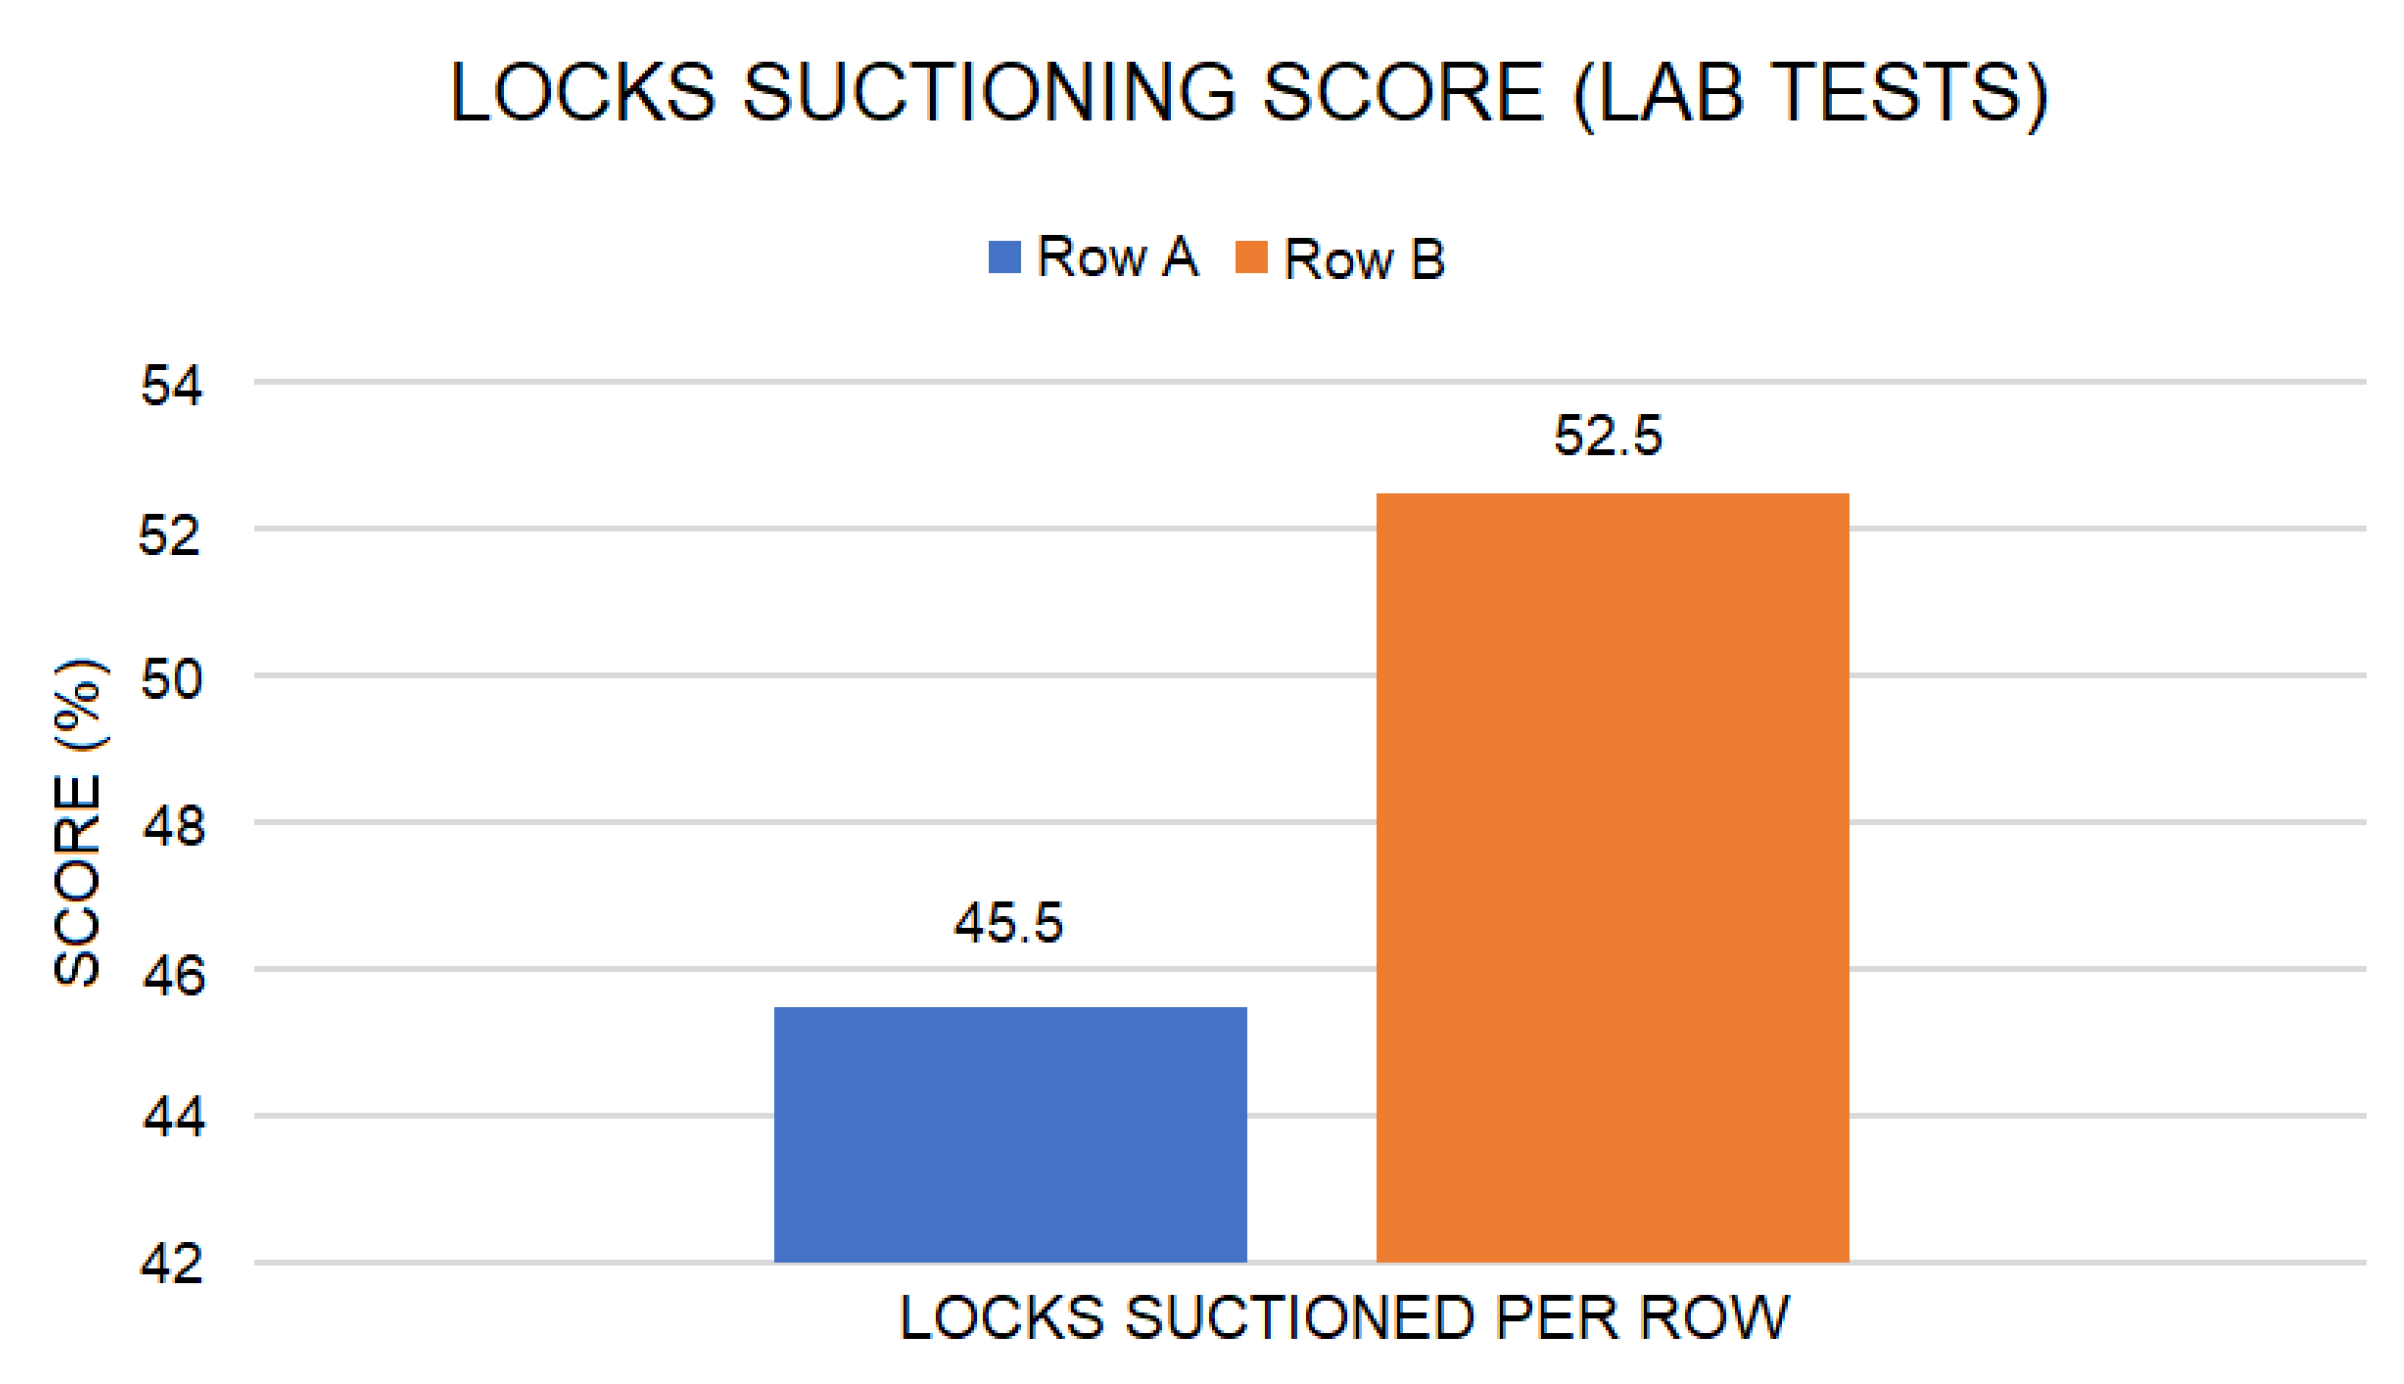
Figure 17 shows that Row B performed better with 52.5% of the locks suctioned than 45.5% of Row A. Averaging both performances resulted in 49% harvesting performance in the lab test conducted. Locks on Row A were observed to have more partially opened (immature bolls) compared to those of Row B, where most bolls were fully opened (matured). The partially opened bolls grip the locks more inside the bur, making it difficult for the harvester to suction.
3.4. Field Tests for Harvester Performance
Results show that the average plant height in all subplots was 103.9 ± 11.9 cm, as shown in Figure 18a. The average boll offset was 26.4 ± 11.5 cm, and boll height was 59.5 ± 10.4 cm as shown in Figure 18b. The boll offset and boll height results indicated the region where most of the bolls are located and where the nozzle should be positioned. However, due to design constraints, the nozzle could only be adjusted vertically 45.7~68.6 cm in the vertical direction. We observed that there were approximately 4.5 bolls per subplot on an average per plant in this adjustment range. With 30 plants per row, a total of 135 bolls were possibly harvestable.
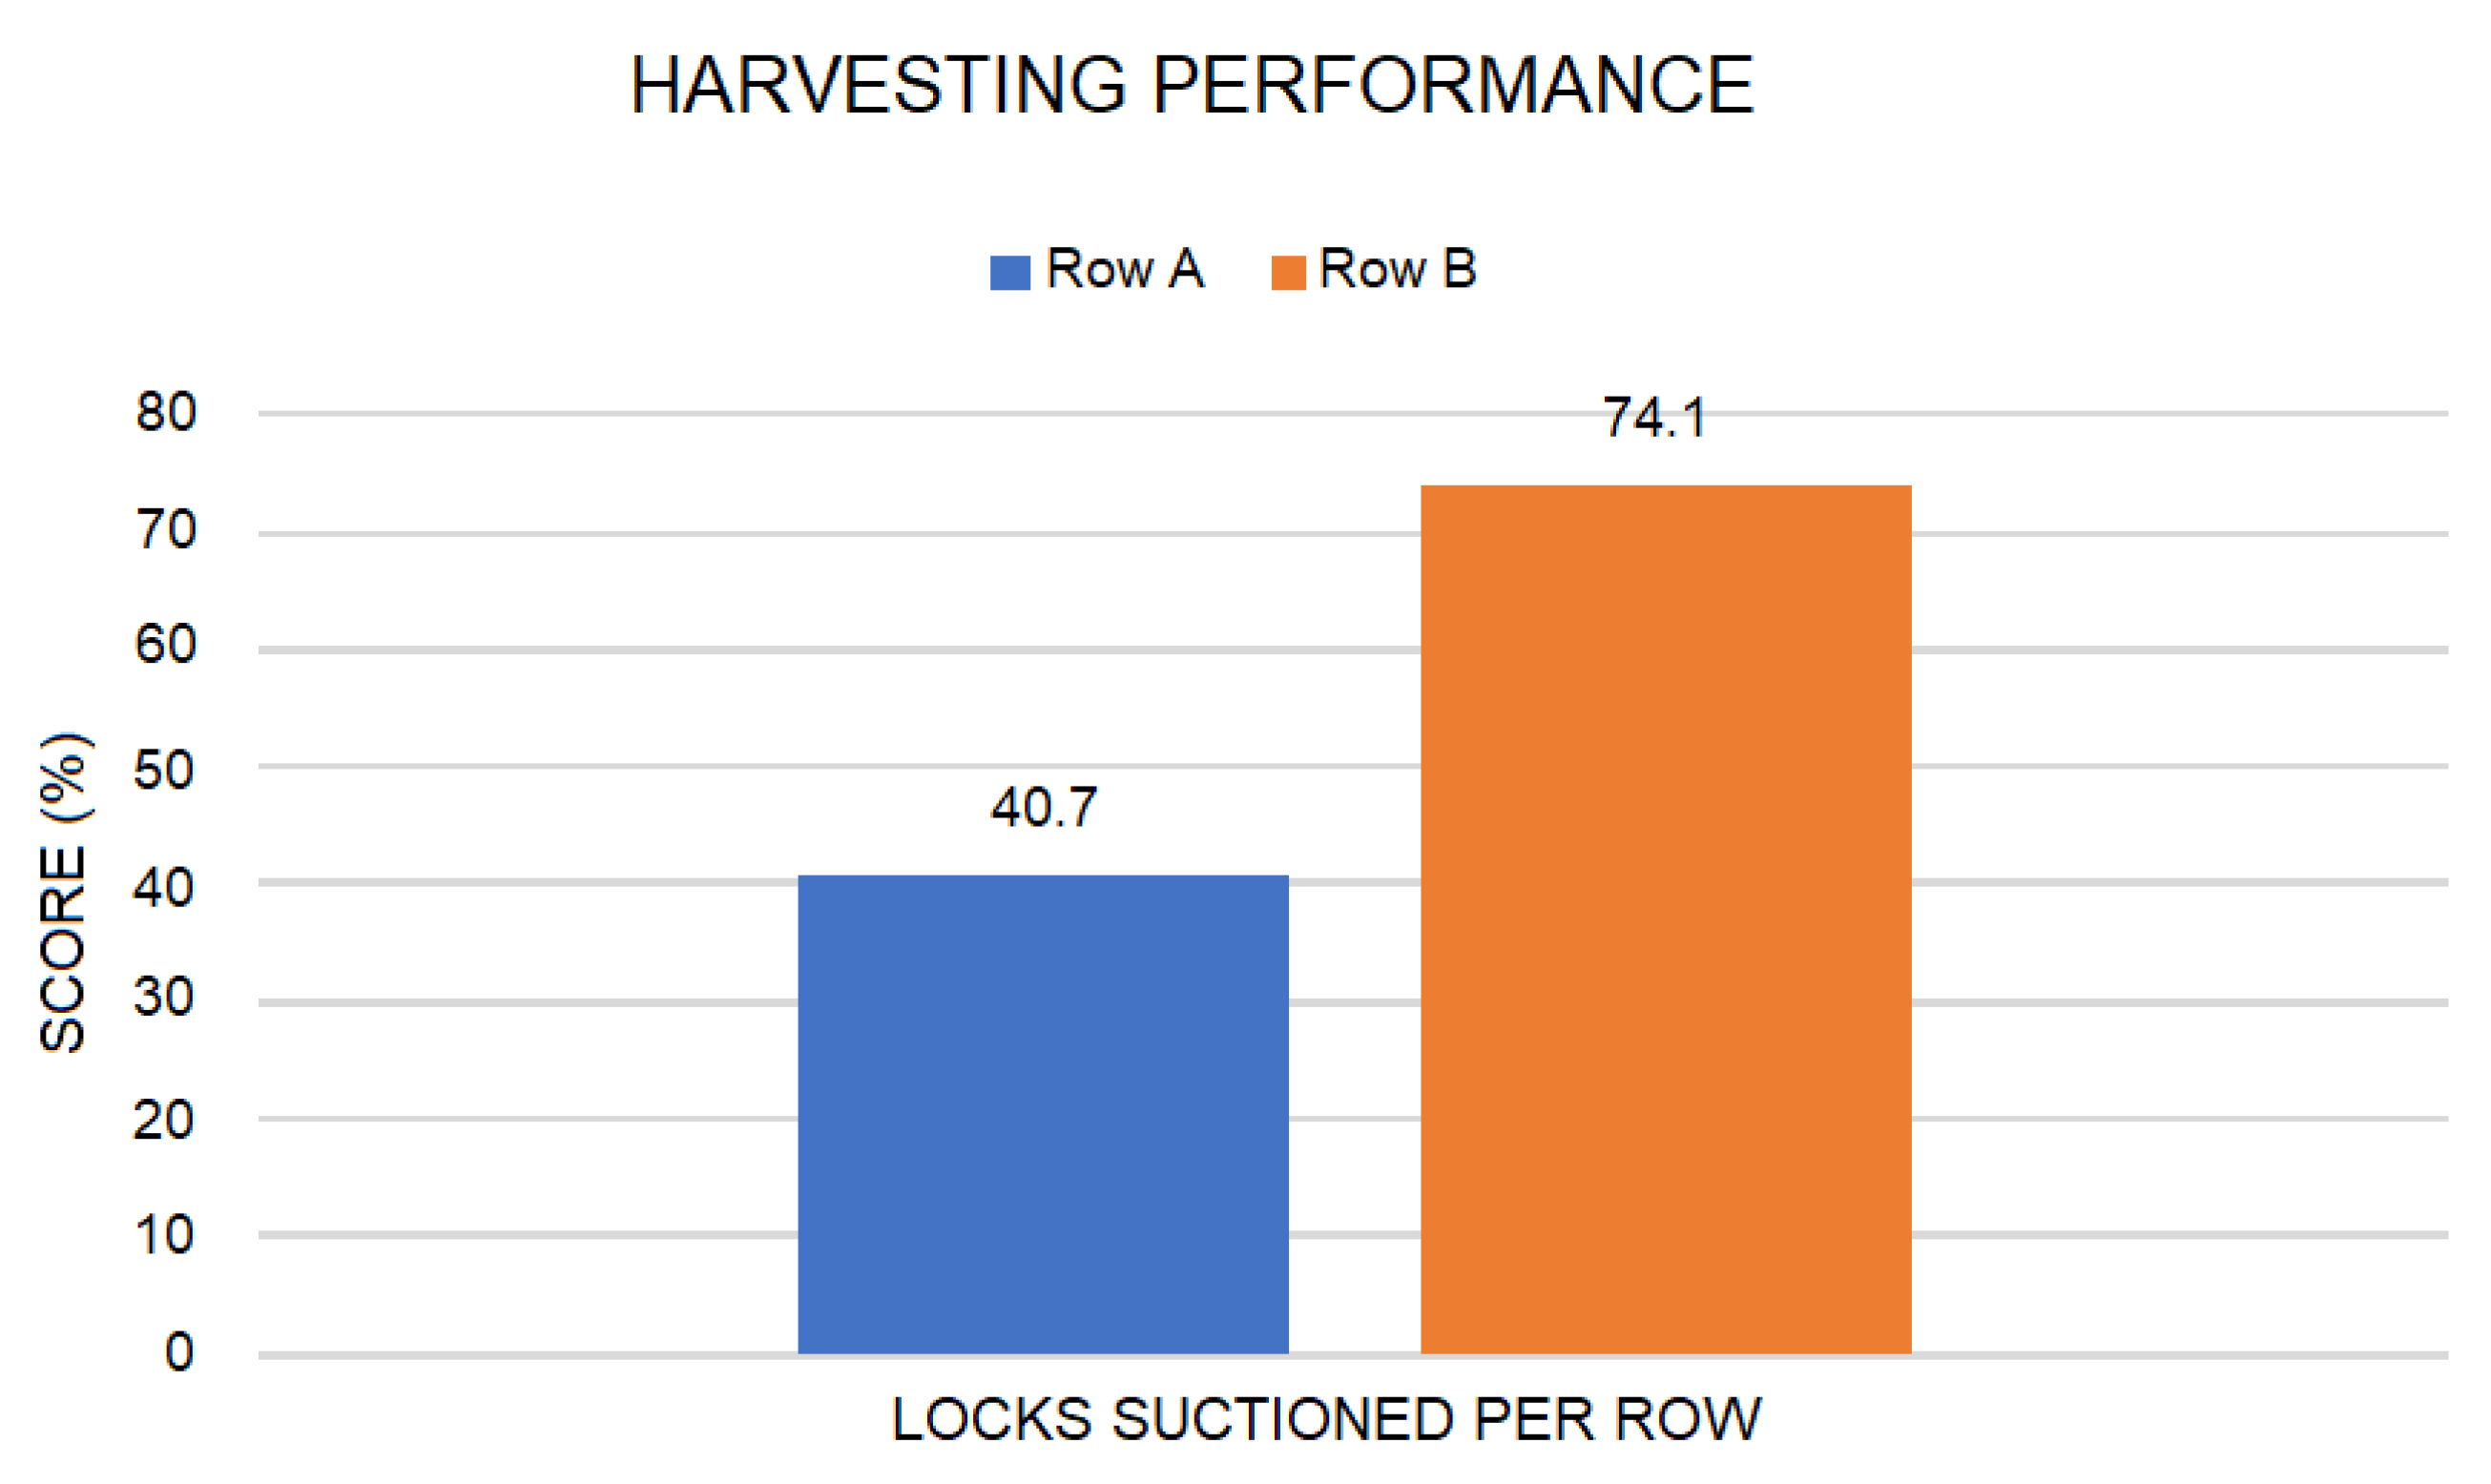
Out of 135 bolls, approximately 20% of them are in the nozzle’s linear movement′s direct path as it passes the plants. Hence, 27 bolls were expected to be harvested per row. However, based on the lab test conducted, the harvester′s current configuration only allowed one lock per boll to be suctioned. Therefore, 27 locks were expected instead of 27 bolls. Results showed that Row A had 11 locks (40.7%), and Row B 20 locks (74.1%) harvested in total as shown in Figure 19. The average weight of each lock was 765 and 850 mg for Rows A and B, respectively. More locks per boll were harvested in Row B since in this row the plants have more fully opened/mature bolls compared to Row A. The field tests results agreed with the results conducted in the lab tests where Row B performed better.
4. Discussion
4.1. Airflow and Suction Performance
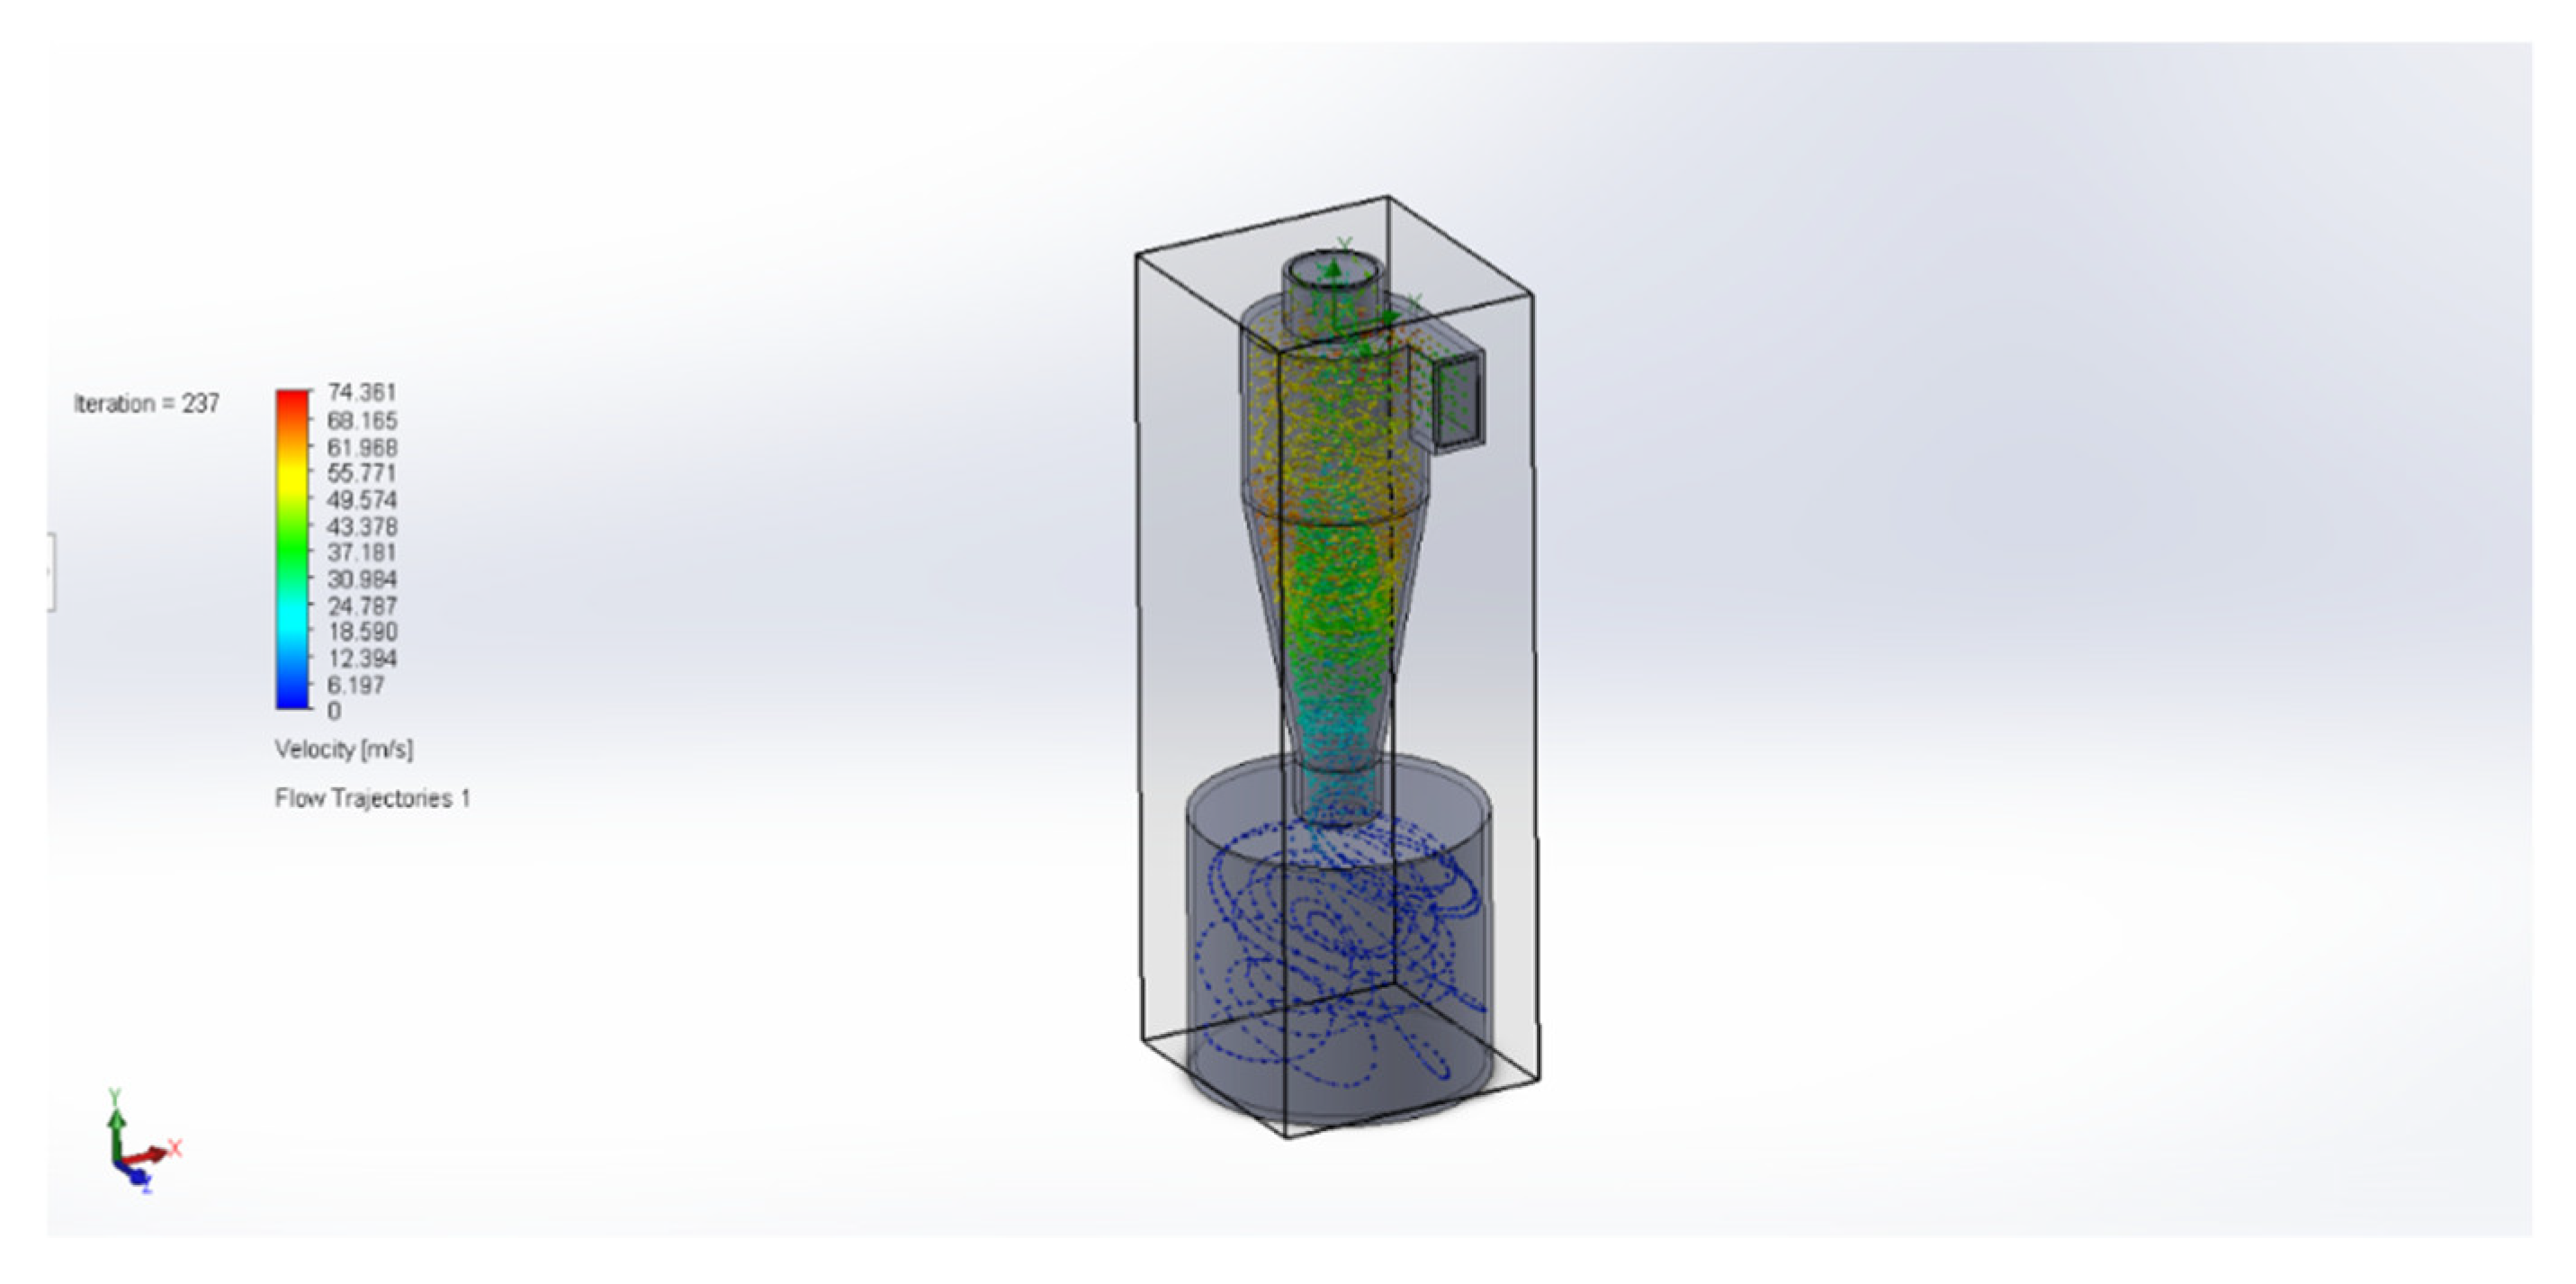
The original inspiration for a collection device for the cotton bolls was that of a cyclone separator. This device uses centripetal force to convert a linear stream of air to a rotational one. Thus, suspended particles move to the outside of the cyclone, where the boundary flow layer helps the particles drop down out of the cyclone into a collection device. As a proof-of-concept, a preliminary fluid simulation was performed on a separator sized to fit the robot, the results of which are shown in Figure 20. The simulation was performed using the computational fluid dynamics (CFD) package SolidWorks 2017 Flow Simulation add-in. Two boundary conditions and the geometry of the separator defined the simulation. The inlet port pressure boundary condition was at atmospheric pressure. The outlet port boundary condition was set to a flow volume of 250 CFM, which is the blower’s rated flow volume. This flow volume is an ideal case since the separator will add static pressure resistance, decreasing the flow volume. The blower′s pump curve was unknown, so the flow was taken to be an ideal 250 CFM. Using these conditions, the CFD add-in can solve the Navier–Stokes equations to estimate fluid velocity and pressure inside of the 3D model [39]. The average velocity was found to be 16.5 m/s with an assumed wall roughness of 100 μM.
Because of manufacturing constraints, as well as the size of cotton bolls, they would not be collected by the separator. Thus a simpler form of the storage bin was developed instead, using a 19 L bucket and 3D printed attachments described in Section 2.1. The general principle is similar to the cyclone separator where the particulates are meant to be diverted out of the airstream being suctioned to the blower. The less certain method of particulate separation was the motivation for an open-cell foam filter to be used on the suction port to the blower; to prevent cotton from going into the blower and being expelled. This filter undoubtedly caused a pressure drop (head loss) that impeded the collection of cotton bolls at the suction ports. A potential solution could be to test the blower’s durability when it directly suctions cotton bolls, thus eliminating the filter. Further evaluation of a prototype cyclone separator for this application could also be investigated to determine its feasibility with regard to cost and effectiveness.
4.2. The Harvesting Design
Although there were different implementations of harvesting cotton in the real world (hand/machine picking, stripping, and pickers machine), our proof of concept used a suction cap as a harvesting mechanism. Moreover, our focus was to provide a faster harvesting process. Thus, we focus on finding the cotton bolls′ locations and fixed our suction cap to that distance above the ground. The main idea was for our mobile platform to prioritize the navigation and simply turn on the suction motor. This provides a faster harvesting rate as compared to spending more time locating the cotton bolls. We know of other works [33] where the focus was to localize the cotton bolls and harvest. Our work’s main disadvantage is that it does not take into account all the cotton bolls on the plant but instead focuses entirely on how the rows of cotton bolls were distributed. Our work’s advantage is that our mobile platform can move around the field and pick cotton quicker.
5. Conclusions
This paper presents an autonomous map-based robot, CHAP, for a cotton-selective harvesting proof of concept. The robot was retrofitted with a vacuum-type system with a small storage bin. Performance evaluation for the cotton harvesting was performed in terms of how effective the harvester suctions the cotton bolls and the effective distance. Several tests were conducted on its important sensors to achieve safe navigation. The GPS accuracy results showed more than half a meter average error on the longitude and latitude readings of the waypoints measured. This error is significant when the robot navigates in narrow rows. However, the issue was addressed by fusing the GPS, IMU and odometry readings using filters. The laser scanner’s resolution test showed that it was possible to detect the stem of the cotton plant as the bolts of 6.25 mm diameter were all detected. The cotton stem’s diameter is known to be much larger after defoliation.
Preliminary results on the developed mobile robot platform′s performance for cotton harvesting show an average of 57.4% success rate in harvesting locks about 1.27 cm close to the harvester nozzle. Field test results show that the average plant height is 103.9 ± 11.9 cm while the average boll offset is 26.4 ± 11.5 cm and the average boll height is 57.2 cm. For lab tests, results revealed that the average suction distance of the boll/locks to the harvester nozzle was 59.5 ± 10.2 cm and a 49% harvesting performance in laboratory tests. Further improvements in the design and implementation of navigation and harvester systems are needed to make it suitable for farm applications. More efficient navigation algorithms, more advanced sensors, and actuators are to be integrated to improve the robot platform′s harvesting performance.
Supplementary Materials
Video 1: CHAP harvesting run on the cotton field (https://youtu.be/bxYmVBFGJzw accessed on 4 April 2021), and Video 2: CHAP navigation used for weeding purposes (https://youtu.be/_PDpEA4uHqQ accessed on 4 April 2021).
Author Contributions
Conceptualization, J.M.M., M.P., and M.E.B.; methodology, J.M.M. and M.E.B.; software, M.E.B.; validation, J.M.M., M.P., and M.E.B.; formal analysis, M.P., and M.E.B.; investigation, M.P. and M.E.B.; resources, J.M.M. and E.B.; data curation, M.P., and M.E.B.; writing—original draft preparation, J.M.M.; writing—review and editing, J.M.M., M.P., M.E.B., and E.B.; visualization, M.P. and M.E.B.; supervision, J.M.M. and E.B.; project administration, J.M.M., and E.B.; funding acquisition, J.M.M. and E.B. All authors have read and agreed to the published version of the manuscript.
Funding
This work was partially supported by a grant from the Cotton Inc. Project No. 17-029 and is based on work supported by NIFA/USDA under project numbers SC-1700540 and SC-1700543. The authors express their gratitude to Clemson University Professional Internship and Co-op Program (UPIC). Student engagement is one of Clemson University’s areas of investment. To meet this goal Clemson developed an on-campus internship and co-op program (UPIC) in 2012 to offer students the opportunity to work closely with a member or members of Clemson’s faculty or administration in an on-campus or Clemson affiliated position.
Institutional Review Board Statement
Not Applicable.
Informed Consent Statement
Not Applicable.
Data Availability Statement
Not Applicable.
Acknowledgments
The authors would like to thank Christina Chui and Nicole Inabinet for their support and assistance in this project.
Conflicts of Interest
The authors declare no conflict of interest.
References
- Meyer, L.A. Cotton and Wool Outlook. CWS-20k, USDA Economic Research Service 2020. Available online: https://usda.library.cornell.edu/concern/publications/n870zq801?locale=en (accessed on 17 December 2020).
- Hughs, S.E.; Valco, T.D.; Williford, J.R. 100 Years of Cotton Production, Harvesting, and Ginning Systems Engineering: 1907–2007. Trans. ASABE 2008, 51, 1187–1198. [Google Scholar] [CrossRef]
- Wanjura, J.D.; Barnes, E.M.; Kelley, M.S.; Boman, R.K. Harvesting in Cotton, 2nd ed.; Fang, D.D., Percy, R.G., Eds.; Agronomy Monograph: Hoboken, NJ, USA, 2015. [Google Scholar]
- Meyer, L.A. The World and U.S. Cotton Outlook for 2016/17. Interagency Commodity Estimates Committee, Agricultural Outlook Forum, USDA 2016. Office of the Chief Economist. Available online: https://www.usda.gov/oce/forum/2016_speeches/meyer.pdf (accessed on 12 December 2020).
- Norsworthy, J.K.; Schwartz, L.M.; Barber, L.T. The Incidence and Ramifications of Glyphosate Resistance in Cotton. Outlooks on Pest Management–February 2016. Research Information Ltd., 2016; pp. 31–35. Available online: http://www.researchinformation.co.uk/pest/sample/S7.pdf (accessed on 10 December 2020).
- Fleisch, R.; Entner, D.; Prante, T.; Pfefferkorn, R.; Andres-Perez, E. Evolutionary and Deterministic Methods for Design Optimization and Control with Applications to Industrial and Societal Problems. Comput. Methods Appl. Sci. 2019, 49, 339–354. [Google Scholar]
- Martin, J.; Casquero, O.; Fortes, B.; Marcos, M. A generic multi-layer architecture based on ROS-JADE integration for autonomous transport vehicles. Sensors 2019, 19, 69. [Google Scholar] [CrossRef] [PubMed] [Green Version]
- Krueger, V.; Rovida, F.; Grossman, B.; Petrick, R.; Crosby, M.; Charzoule, A.; Garcia, G.M.; Bhenke, S.; Toscano, C.; Veiga, G. Testing the vertical and cyber-physical integration of cognitive robots in manufacturing. Robot. Comput. Integr. Manuf. 2018, 57, 213–229. [Google Scholar] [CrossRef]
- Levratti, A.; Riggio, G.; Fantuzzi, C.; Vuono, A.D.; Sechhi, C. TIREBOT: A collaborative robot for the tire workshop. Robot. Comput. Integr. Manuf. 2019, 57, 129–137. [Google Scholar] [CrossRef]
- Hu, L.; Miao, Y.; Wu, G.; Hassan, M.; Humar, I. iRobot-Factory: An intelligent robot factory based on cognitive manufacturing and edge computing. Future Gener. Comput. Syst. 2019, 90, 569–577. [Google Scholar] [CrossRef]
- Zielinska, T. History of service robots and new trends. In Novel Design and Applications of Robotics Technologies; IGI Global: Hershey, PA, USA, 2019; pp. 158–187. [Google Scholar]
- Sistler, F.E. Robotics and Intelligent Machines in Agriculture. IEEE J. Robot. Autom. 1987, 3, 3–6. [Google Scholar] [CrossRef]
- Salfer, J.; Endres, M.; Lazarus, W.; Minegishi, K.; Berning, B. Dairy Robotic Milking Systems–What are the Economics? DAIReXNET. 2019. Available online: https://dairy-cattle.extension.org/2019/08/dairy-robotic-milking-systems-what-are-the-economics/ (accessed on 5 November 2020).
- Westwood, J.H.; Charudattan, R.; Duke, S.O.; Fennimore, S.A.; Marrone, P.; Slaughter, D.C.; Swanton, C.; Zollinger, R. Weed Management in 2050: Perspectives on the Future of Weed Science. Weed Science 2018; Cambridge University Press: Cambridge, UK, 2018. [Google Scholar]
- Schielack, V.P.; Thomasson, J.A.; Sui, R.; Ge, Y. Harvester-based sensing system for cotton fiber-quality mapping. J. Cotton Sci. 2016, 20, 386–393. [Google Scholar]
- Xu, R.; Li, C.; Velni, J.M. Development of an autonomous ground robot for field high throughput phenotyping. IFAC Pap. Online 2018, 51, 70–74. [Google Scholar] [CrossRef]
- Jung, J.; Maeda, M.; Chang, A.; Landivar, J.; Yeom, J.; McGinty, J. Unmanned aerial system assisted framework for the selection of high yielding cotton genotypes. Comput. Electron. Agric. 2018, 152, 74–81. [Google Scholar] [CrossRef]
- Jiang, Y.; Li, C.; Paterson, A.H. High throughput phenotyping of cotton plant height using depth images under field conditions. Comput. Electron. Agric. 2016, 130, 57–68. [Google Scholar] [CrossRef]
- Haghverdi, A.; Washington-Allen, R.; Leib, B. Prediction of cotton lint yield from phenology of crop indices using artificial neural networks. Comput. Electron. Agric. 2018, 152, 186–197. [Google Scholar] [CrossRef]
- Zang, S.; Wang, Y.; Zhu, Z.; Li, Z.; Du, Y.; Mao, E. Tractor path tracking control based on binocular vision. Inf. Process. Agric. 2018, 5, 422–432. [Google Scholar]
- Huang, P.; Zhang, Z.; Luo, X.; Zhang, J.; Huang, P. Path tracking control of a differential-drive tracked robot based on look-ahead distance. IFAC Pap. Online 2018, 51, 112–117. [Google Scholar] [CrossRef]
- Chen, R.; Chu, T.; Landivar, J. Monitoring cotton (Gossypium hirsutum L.) germination using ultrahigh-resolution UAS images. Precis. Agric. 2018, 19, 161–177. [Google Scholar] [CrossRef]
- Sjolander, A.J.; Thomasson, J.A.; Sui, R.; Ge, Y. Wireless tracking of cotton modules. Part 2: Automatic machine identification and system testing. Comput. Electron. Agric. 2011, 75, 34–43. [Google Scholar] [CrossRef]
- Maja, J.M.; Campbell, T.; Neto, J.C.; Astillo, P. Predicting cotton yield of small field plots in a cotton breeding program using UAV imagery data. In Proceedings of the Autonomous Air and Ground Sensing Systems for Agricultural Optimization and Phenotyping; SPIE: Bellingham, WA, USA, 2016; Volume 9866. [Google Scholar]
- Sui, R.; Thomasson, J.A.; Mehrle, R.; Dale, M.; Perry, C.; Rains, G. Mississippi cotton yield monitor: Beta test for commercialization. Comput. Electron. Agric. 2004, 42, 149–160. [Google Scholar] [CrossRef]
- Wallace, T.P. Small plot evaluation of an electro-optical cotton yield monitor. Comput. Electron. Agric. 1999, 23, 1–8. [Google Scholar] [CrossRef]
- Ntogkoulis, P.A.; Bochtis, D.D.; Fountas, S.; Berruto, R.; Gemtos, T.A. Performance of cotton residue collection machinery. Biosyst. Eng. 2014, 119, 25–34. [Google Scholar] [CrossRef]
- Daystar, J.; Barnes, E.; Hake, K.; Kurtz, R. Sustainability Trends and Natural Resource Use. U.S. Cotton Production. Bioresources, North America. 2016. Available online: http://Ojs.Cnr.Ncsu.Edu/Index.Php/Biores/Article/View/Biores_12_1_362_Daystar_Sustainability_Trends_Cotton_Production (accessed on 10 December 2020).
- Bangert, W.; Kielhorn, A.; Rahe, F.; Albert, A.; Biber, P.; Grzonka, S. Field-Robot-Based Agriculture: “RemoteFarming.1″ and “BoniRob-Apps”. In AgEng, Internationale Tagung Land.Technik; VDI-Verlag: Düsseldorf, Germany, 2013; pp. 439–445. [Google Scholar]
- Shafiekhani, A.; Kadam, S.; Fritschi, B.F.; DeSouza, G.N. Vinobot and vinoculer: Two robotic platforms for high-throughput field phenotyping. Sensors 2017, 17, 214. [Google Scholar] [CrossRef] [PubMed]
- Young, S.; Kayacan, E.; Peschel, J. Design and field evaluation of a ground robot for high-throughput phenotyping of energy sorghum. Precis. Agric. 2019, 20, 697–722. [Google Scholar] [CrossRef] [Green Version]
- Fue, K.; Porter, W.; Barnes, E.; Li, C.; Rains, G. Center-Articulated Hydrostatic Cotton Harvesting Rover Using Visual-Servoing Control and a Finite State Machine. Electronics 2020, 9, 1226. [Google Scholar] [CrossRef]
- Ristorto, G.; Gallo, R.; Gasparetto, A.; Scalera, L.; Vidoni, R.; Mazzetto, F. A mobile laboratory for orchard health status monitoring in precision farming. Chem. Eng. Trans. 2017, 58, 661–666. [Google Scholar]
- Iqbal, J.; Xu, R.; Sun, S.; Li, C. Simulation of an Autonomous Mobile Robot for LiDAR-Based In-Field Phenotyping and Navigation. Robotics 2020, 9, 46. [Google Scholar] [CrossRef]
- Clearpath Robotics Husky Unmanned Ground Vehicle. 2020. Available online: https://www.clearpathrobotics.com/husky-unmanned-ground-vehicle-robot/ (accessed on 10 December 2020).
- Grisetti, G.; Stachniss, C.; Burgard, W. Improving Grid-based SLAM with Rao-Blackwellized Particle Filters by Adaptive Proposals and Selective Resampling. In Proceedings of the IEEE International Conference on Robotics and Automation, Barcelona, Spain, 18–22 April 2005. [Google Scholar]
- Grisetti, G.; Stachniss, C.; Burgard, W. Improved Techniques for Grid Mapping with Rao-Blackwellized Particle Filters. IEEE Trans. Robot. 2007, 23, 34–46. [Google Scholar] [CrossRef] [Green Version]
- Goodman, B.; Monks, C.D. A farm demonstrations method for estimating cotton yield in the field for use by extension agents and specialists. J. Ext. 2003, 41, 6. [Google Scholar]
- Jonuskaite, A. Flow Simulation with SolidWorks. Arcada University Thesis 2017. Available online: https://www.theseus.fi/handle/10024/133447 (accessed on 18 February 2021).
Figure 1.
Mobile robot platform used in this project.

Figure 2.
Revised design of cotton-harvesting autonomous platform (CHAP).

Figure 3.
3D printed parts for the bucket; (a) lid with outlet fitting, (b) bottom of lid with filter material, (c) inlet to bucket design to divert cotton downwards, (d) inlet port viewed from the inside bucket, and (e) the complete collection bucket.
Figure 3.
3D printed parts for the bucket; (a) lid with outlet fitting, (b) bottom of lid with filter material, (c) inlet to bucket design to divert cotton downwards, (d) inlet port viewed from the inside bucket, and (e) the complete collection bucket.

Figure 4.
(a) Blower mount to an aluminum extrusion, (b) three suction ports, and (c) single suction port.
Figure 4.
(a) Blower mount to an aluminum extrusion, (b) three suction ports, and (c) single suction port.

Figure 5.
The controller circuit board to control the vacuum motor and blinker; (a) base and enclosure, (b) Lithium-Ion Polymer (LIPO) battery, and (c) low-power indicator.
Figure 5.
The controller circuit board to control the vacuum motor and blinker; (a) base and enclosure, (b) Lithium-Ion Polymer (LIPO) battery, and (c) low-power indicator.

Figure 6.
The mobile platform with the harvester module.

Figure 7.
Robot′s kinematics to determine its current position.

Figure 8.
The Robot Operating System (ROS) navigation stack.

Figure 9.
Screenshot of simulated navigation showing unmanned ground vehicle’s (UGV) path and movement.
Figure 9.
Screenshot of simulated navigation showing unmanned ground vehicle’s (UGV) path and movement.

Figure 10.
Hardware and software components for UGVs navigation.

Figure 11.
Relative positions of harvester nozzle versus cotton bolls with respect to robot base and plant location under a common reference coordinate.
Figure 11.
Relative positions of harvester nozzle versus cotton bolls with respect to robot base and plant location under a common reference coordinate.

Figure 12.
Random sampling plot design for cotton boll harvesting in (a) and sampling measurements for boll position to determine the position of the fixed nozzle in (b).
Figure 12.
Random sampling plot design for cotton boll harvesting in (a) and sampling measurements for boll position to determine the position of the fixed nozzle in (b).

Figure 13.
Results of GPS accuracy measurements.

Figure 14.
Simulated plant rows using bolts.

Figure 15.
Map of (a) Sensor and Automation Laboratory, (b) Edisto-REC hallways, and (c) cotton field showing five crop rows.
Figure 15.
Map of (a) Sensor and Automation Laboratory, (b) Edisto-REC hallways, and (c) cotton field showing five crop rows.

Figure 16.
Results of how close the locks/boll should be to the nozzle for suctioning.

Figure 17.
Percentage of locks successfully suctioned per sampled row.

Figure 18.
Results of the plant height (a), boll offset and boll height (b).

Figure 19.
Field performance result of the mobile robot platform.

Figure 20.
Fluid simulation of cyclone separator.

Publisher’s Note: MDPI stays neutral with regard to jurisdictional claims in published maps and institutional affiliations. |
© 2021 by the authors. Licensee MDPI, Basel, Switzerland. This article is an open access article distributed under the terms and conditions of the Creative Commons Attribution (CC BY) license (https://creativecommons.org/licenses/by/4.0/).
Share and Cite
MDPI and ACS Style
Maja, J.M.; Polak, M.; Burce, M.E.; Barnes, E. CHAP: Cotton-Harvesting Autonomous Platform. AgriEngineering 2021, 3, 199-217. https://0-doi-org.brum.beds.ac.uk/10.3390/agriengineering3020013
AMA Style
Maja JM, Polak M, Burce ME, Barnes E. CHAP: Cotton-Harvesting Autonomous Platform. AgriEngineering. 2021; 3(2):199-217. https://0-doi-org.brum.beds.ac.uk/10.3390/agriengineering3020013
Chicago/Turabian StyleMaja, Joe Mari, Matthew Polak, Marlowe Edgar Burce, and Edward Barnes. 2021. "CHAP: Cotton-Harvesting Autonomous Platform" AgriEngineering 3, no. 2: 199-217. https://0-doi-org.brum.beds.ac.uk/10.3390/agriengineering3020013