
Dicamba Injury on Soybean Assessed Visually and with Spectral Vegetation Index


Umuarama Campus, Institute of Agricultural Sciences, Federal University of Uberlândia, Uberlândia 38410-337, Brazil
*
Author to whom correspondence should be addressed.
AgriEngineering 2021, 3(2), 240-250; https://0-doi-org.brum.beds.ac.uk/10.3390/agriengineering3020016
Submission received: 14 April 2021
/
Revised: 28 April 2021
/
Accepted: 1 May 2021
/
Published: 3 May 2021
(This article belongs to the Special Issue Novel Approaches for Unmanned Aerial Vehicle)
Abstract
:The recent availability of soybean cultivars with resistance to dicamba herbicide has increased the risk of injury in susceptible cultivars, mainly as a result of particle drift. To predict and identify the damage caused by this herbicide requires great accuracy. The objective of this work was to evaluate the injury caused by the simulated drift of dicamba on soybean (nonresistant to dicamba) plants assessed visually and using the Triangular Greenness Index (TGI) from images obtained from Remotely Piloted Aircraft (RPA). The study was conducted in a randomized complete block design with four replications during the 2019/2020 growing season, and the treatments consisted of the application of six doses of dicamba (0, 0.28, 0.56, 5.6, 28, and 112 g acid equivalent dicamba ha−1) on soybean plants at the third node growth stage. For the evaluation of treatments using the TGI technique, spectral data acquired through a Red Green Blue (RGB) sensor attached to an RPA was used. The variables studied were the visual estimation of injury, TGI response at 7 and 21 days after application, plant height, and crop yield. The exposure to the herbicide caused a reduction in plant height and crop yield. Vegetation indices, such as TGI, have the potential to be used in the evaluation of injury caused by dicamba, and may be used to cover large areas in a less subjective way than visual assessments.
1. Introduction
The availability of soybean cultivars with resistance to dicamba herbicide can allow for the effective control of dicotyledonous weeds that present some level of herbicide resistance [1,2]. However, the use of dicamba raises concerns for Brazil, which is one of the largest soybean producers in the world, due to herbicide drift to nontarget crops, since low herbicide concentrations are sufficient to cause injury in sensitive plants such as soybeans nonresistant to dicamba [3,4].
The symptoms of dicamba phytotoxicity in soybean (nonresistant to dicamba) are variable. They include leaf curling and wrinkling, chlorosis of younger leaves, epinasty, reductions in plant height, death of the apical meristem, and plant death [5]. Some effects of dicamba subdoses on susceptible crops have been reported [6]; however, there is a lack of information in tropical conditions.
The evaluation of dicamba injury is mainly conducted by visual analysis of the symptoms. This method is not particularly robust; it is laborious, time-consuming, and very subjective. Thus, the visual analysis of herbicide symptoms does not allow for an accurate estimation of the extension of the damage, the herbicide dose that the plants were exposed to, or the possible reduction in yield [7,8,9]. Moreover, early detection of symptoms is not always possible, and field injury can occur in large heterogeneous areas, which makes the quality of the visual analysis even more difficult.
Solomom and Bradley [10] reported that 0.03 g ha−1 of dicamba, equivalent to 0.005% of the dose used, is sufficient to cause visible symptoms of injury in soybean plants. However, visible injury is not an adequate parameter to estimate losses in soybean yield because it is a subjective and highly variable characteristic [7]. Everitt and Keeling [11] evaluated the development and yield of cotton submitted to simulated dicamba drift and concluded that the visual assessment of the injury overestimates the damage to yield.
The interest in remote sensing agriculture has grown intensely with the increased accessibility of Remotely Piloted Aircrafts (RPA) [12]. The implement of RPAs allows for the frequent collection of information from large areas and has been used in agriculture in several applications, including the detection and evaluation of injury caused by herbicides [13,14].
The information collected by an RPA (images) can be used to generate Spectral Vegetation Indices (SVI), which are mathematical combinations of different spectral bands and can be used to distinguish vegetation from other targets. Furthermore, SVIs can indicate plant vigor and detect vegetation under stress conditions [15]. The use of SVIs has the potential to replace the visual evaluation of herbicide injuries, as it is a faster and a more cost-effective method.
Duddu et al. [16] demonstrated that high-throughput RPA image-based methods may replace visual ratings, especially for canopy-scale measurements. According to the authors, the lack of repeatability between the replications is the main reason for the poor performance of the visual rating method. In this sense, Huang et al. [17] demonstrated that hyperspectral remote sensing has potential in the early detection of soybean injury from exposure to off-target dicamba drift at sub-lethal rates in the field.
Some SVIs are based solely on the visible range (RGB—red, green, blue) of the electromagnetic spectrum, and are, therefore, a low-cost alternative. In the case of the Normalized Difference Vegetation Index (NDVI), the near-infrared band is necessary for its composition [18,19,20], and thus, requires more expensive digital cameras. The Triangular Greenness Index (TGI) is an RGB index that can be obtained with broadband sensors. This index has a good correlation with the leaf chlorophyll content [21].
Considering the information presented, the objectives of this study were to evaluate the injury caused in soybean (nonresistant to dicamba) by the simulated dicamba drift and correlate these evaluations with the use of TGI vegetation index obtained with an RGB sensor attached to an RPA.
2. Materials and Methods
The study was conducted during the 2019/2020 season at the Capim Branco Experimental Farm of the Federal University of Uberlândia (UFU), in Uberlândia, Minas Gerais state, Brazil. The area was located at 18°53′13.6″ S latitude and 48°20′36.0″ W longitude, 842 m above sea level. It is characterized by a flat topography and an Aw climate type (tropical humid with dry winter).
The soybean cultivar NS 6906 IPRO (nonresistant to dicamba, super-precocious, and of indeterminate growth) was sown to reach 350,000 plants ha−1. Fertilization was performed at sowing using 320 kg ha−1 of N-P2O5-K2O (02-25-10). The side-dress fertilization was performed using 250 kg ha−1 of KCl. Herbicide, fungicide, and insecticide applications were performed as guided by the data obtained during crop monitoring.
2.1. Treatments
This study was conducted in a Randomized Complete Block Design (RCBD) with four replications and six doses of dicamba herbicide (treatments) applied at the V3 soybean stage (three nodes on the main steam with fully developed leaves beginning with the unifoliolate nodes). At this stage, the weeds are normally in the early stages of their infestation and eradication is more likely. Control is economical when carried out early, rather than waiting until the weed infestation has spread and become established [22]. The dicamba doses studied were 0, 0.28, 0.56, 5.6, 28, and 112 g acid equivalent of dicamba per hectare. These doses represent 0, 0.05, 0.1, 1, 5, and 20% of the recommended dose of 560 g dicamba acid equivalent (a.e.) per hectare, respectively. The herbicide Atectra® (BASF, São Paulo, Brazil) was used (diglycolamine salt—480 g e.a. dicamba L−1).
The experimental plots consisted of four sowing lines: 5 m in length, sown at a 0.5 m spacing, with a total area of 10 m2. Each experimental plot was separated by 0.5 m. In order to avoid drift during applications, a physical plastic barrier was used as protection around the experimental plot.
The dicamba doses were applied using a backpack sprayer of constant CO2 pressure with a spray boom holding four tips (flat-fan deflector with air induction, TTI 110015—Teejet Technologies Spraying Systems Co., Glendale Heights, IL, USA) spaced by 0.5 m. The rate of application was 150 L ha−1 at a pressure of 200 kPa and a speed of 3.8 km h−1. According to the nozzle manufacturer, ultra-coarse droplet classification is produced at this pressure. Weather conditions were monitored during the application with thermo-hygro-anemometer (Kestrel, Boothwyn, PA, USA). The temperature, relative humidity, and wind speed ranged between 22.7 and 24.5 °C, 74.9 to 76.3%, and 1.0 to 6.5 km h−1, respectively.
2.2. Evaluations
Visual assessments of dicamba injury on soybean plants and spectral data collection were performed at 7 and 21 days after the application (DAA) of the dicamba treatments. The visual evaluations of dicamba injury were based on notes from 0 (plant without symptoms) to 100% (dead plant), according to a scale proposed by Behrens and Lueschen [23].
To evaluate dicamba treatments, a multispectral image was acquired using an RGB sensor attached to a remotely piloted aircraft. The RPA system consisted of a Phantom 4® quadcopter (SZ DJI Technology Co., Shenzhen, China) with an RGB sensor model DJI FC330 (12.4 megapixels digital camera with CMOS sensor). A single image that covered the entire experimental area (Ground Sample Distance = 0.71 cm pixel−1, 26 m of height) was used in each evaluation (7 and 21 DAA).
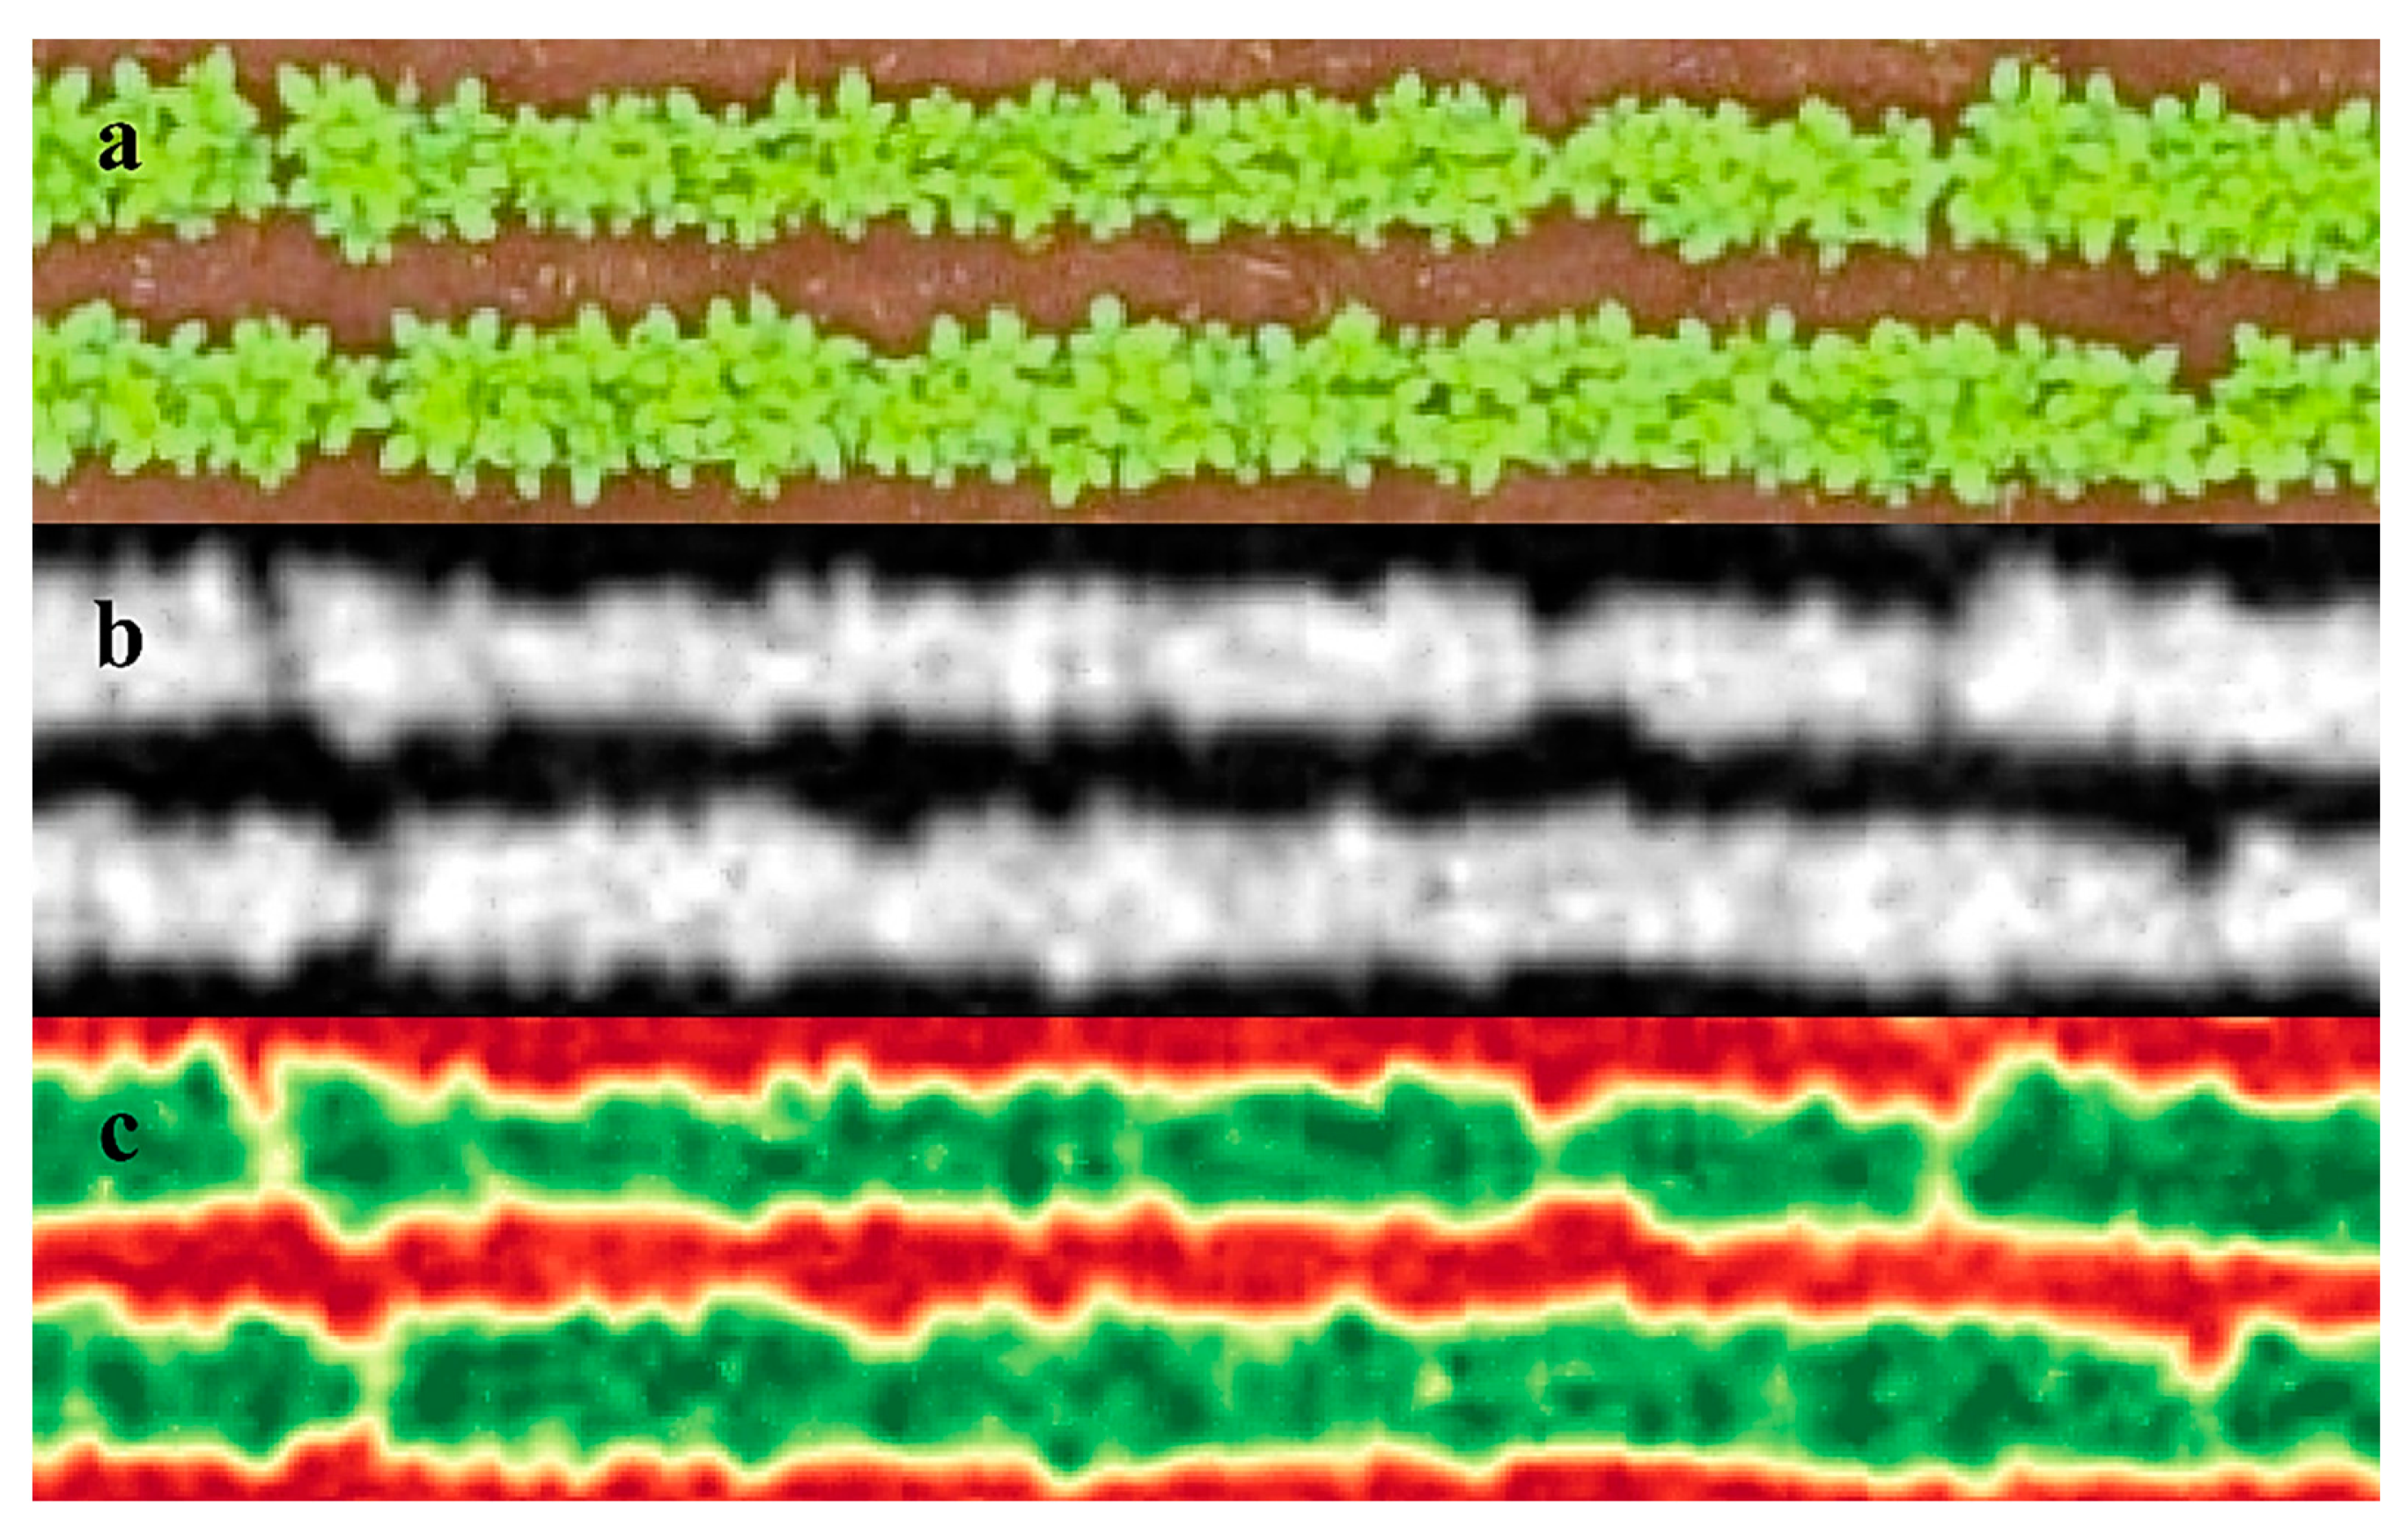
The image that represented the entire experimental area was segmented into several images that represented the useful area of each of the plots (two central lines of the plot). Then, the image of each plot was processed individually for the application of the triangular greenness index (Equation (1)) [24]. The TGI image was generated using the Band Math tool in the Environment for Visualizing Images software (ENVI v. 5.1, Excelis Visual Information Solutions, Boulder, CO, USA). The standard image generated after TGI application was in grayscale (Figure 1A,B), but to assist the visualization a red–green palette was applied (Figure 1C), with red representing the lowest TGI values and green the highest values for the index. The Raster Color Slices and Statistics for All Colors Slices tools were used to obtain the arithmetic mean of the vegetation index values of the pixels contained within the useful area (5 m2) of each experimental plot.
where TGI is the triangular greenness index, RGREEN is the reflectance measured in the spectral range of green, RRED is the reflectance measured in the spectral range of red, and RBLUE is the reflectance measured in the spectral range of blue.
Plant height was measured at the R8 (complete maturation) soybean crop stage. The measurements were taken with the aid of a tape ruler and were averages of three plants representing the plot.
The soybean yield was evaluated considering the plants from the two central lines disregarding 1 m at the beginning and end of each plot. The harvest was manual and was followed by the mechanical thrashing process (105 days after sowing). The samples were cleaned before the mass assessment. Seed mass was standardized for 13% moisture content. The data obtained for each plot were extrapolated to yield in kg ha−1.
2.3. Statistical Analysis
Statistical analyses were performed using R software [25]. The normality of the residues was verified with the Shapiro–Wilk test. The homogeneity of variances was verified by the O’Neill and Mathews test. The additivity among blocks was tested with the Tukey test for additivity.
After the presuppositions (p > 0.01), the data were submitted to the ANOVA (F test) and, when differences among treatments were observed, regressions were adjusted (p < 0.05). After obtaining the regressions, the graphs were generated using the SigmaPlot v. 12.0 software (Systat Software Inc., Chicago, IL, USA). The correlation analysis between the variables was performed with Pearson’s correlation.
3. Results and Discussion
Significant differences (p < 0.05) were observed among treatments for all variables studied: visual analysis of dicamba injury (7 and 21 DAA), TGI response (7 and 21 DAA), plant height (cm) and yield (kg ha−1) (Table 1).
Nonlinear regression models were adjusted for the effects of dicamba doses on all variables and assessment periods (Table 2). The visual analysis (7 and 21 DAA) fitted in a model of power regression, while TGI (7 and 21 DAA), plant height, and yield fitted in a model of exponential regression. The best model adjustments (R2 > 90.0) were obtained for visual analysis (7 and 21 DAA), TGI (21 DAA), and yield.
3.1. Leaf Injury Visual Analysis
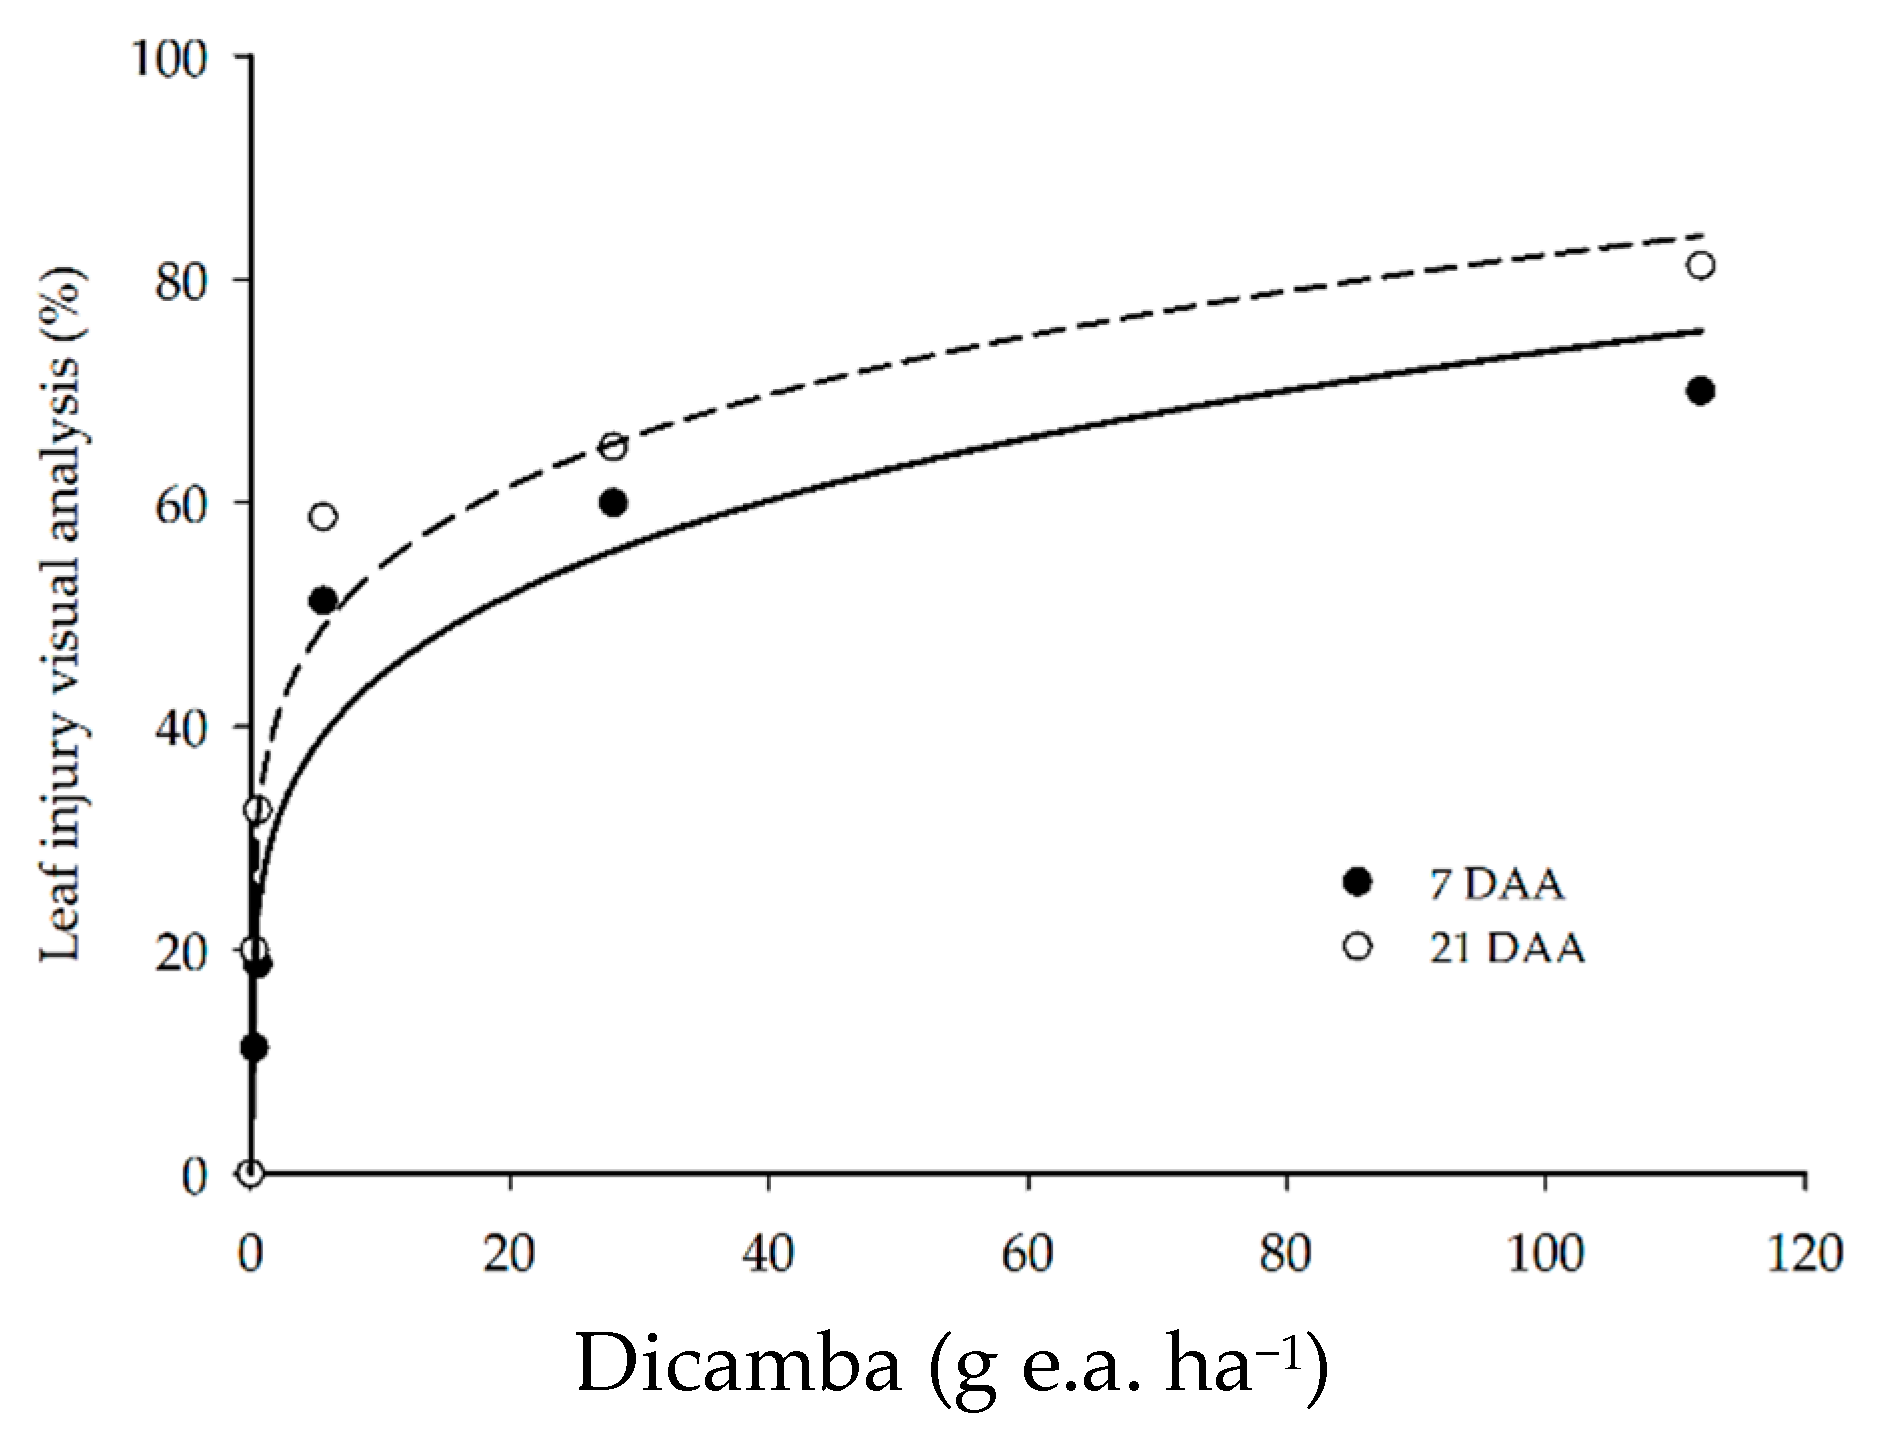
Visual symptoms of dicamba injury in soybean plants were detected for all doses applied. The injury scores ranged from 11.3 to 70.0% at 7 DAA, and from 20.0 to 81.3% at 21 DAA, and the dicamba dose increased from 0.28 to 112 g ha−1 (Figure 2). The herbicide injury became more intense with the increase in dicamba dose and during the period of evaluation.
Dicamba is a systemic herbicide, absorbed and translocated to growth points in the plant. The phytotoxic symptoms usually arise at approximately 7 DAA and tend to increase up to 21 to 28 DAA [26,27]. The main symptoms observed were the curling and wrinkling of younger leaves. At higher doses, reductions in plant height were found, and, at the highest dose (112 g e.a. ha−1), stem twist and death of the apical meristem were observed.
Other studies reported similar results, since the application of extremely low dicamba doses (<1 g e.a. ha−1) are capable of causing visible injury in soybean plants [4,28]. These results corroborate the meta-analysis conducted by Kniss [8], who estimated the dose of 0.038 g ha−1 dicamba as the lowest dose to cause 5% visual injury in soybean.
It is important to highlight that visual injury does not always predict yield loss [29], i.e., it sometimes overestimates damage to productivity and is subjective and operator dependent.
3.2. Spectral Vegetation Responses
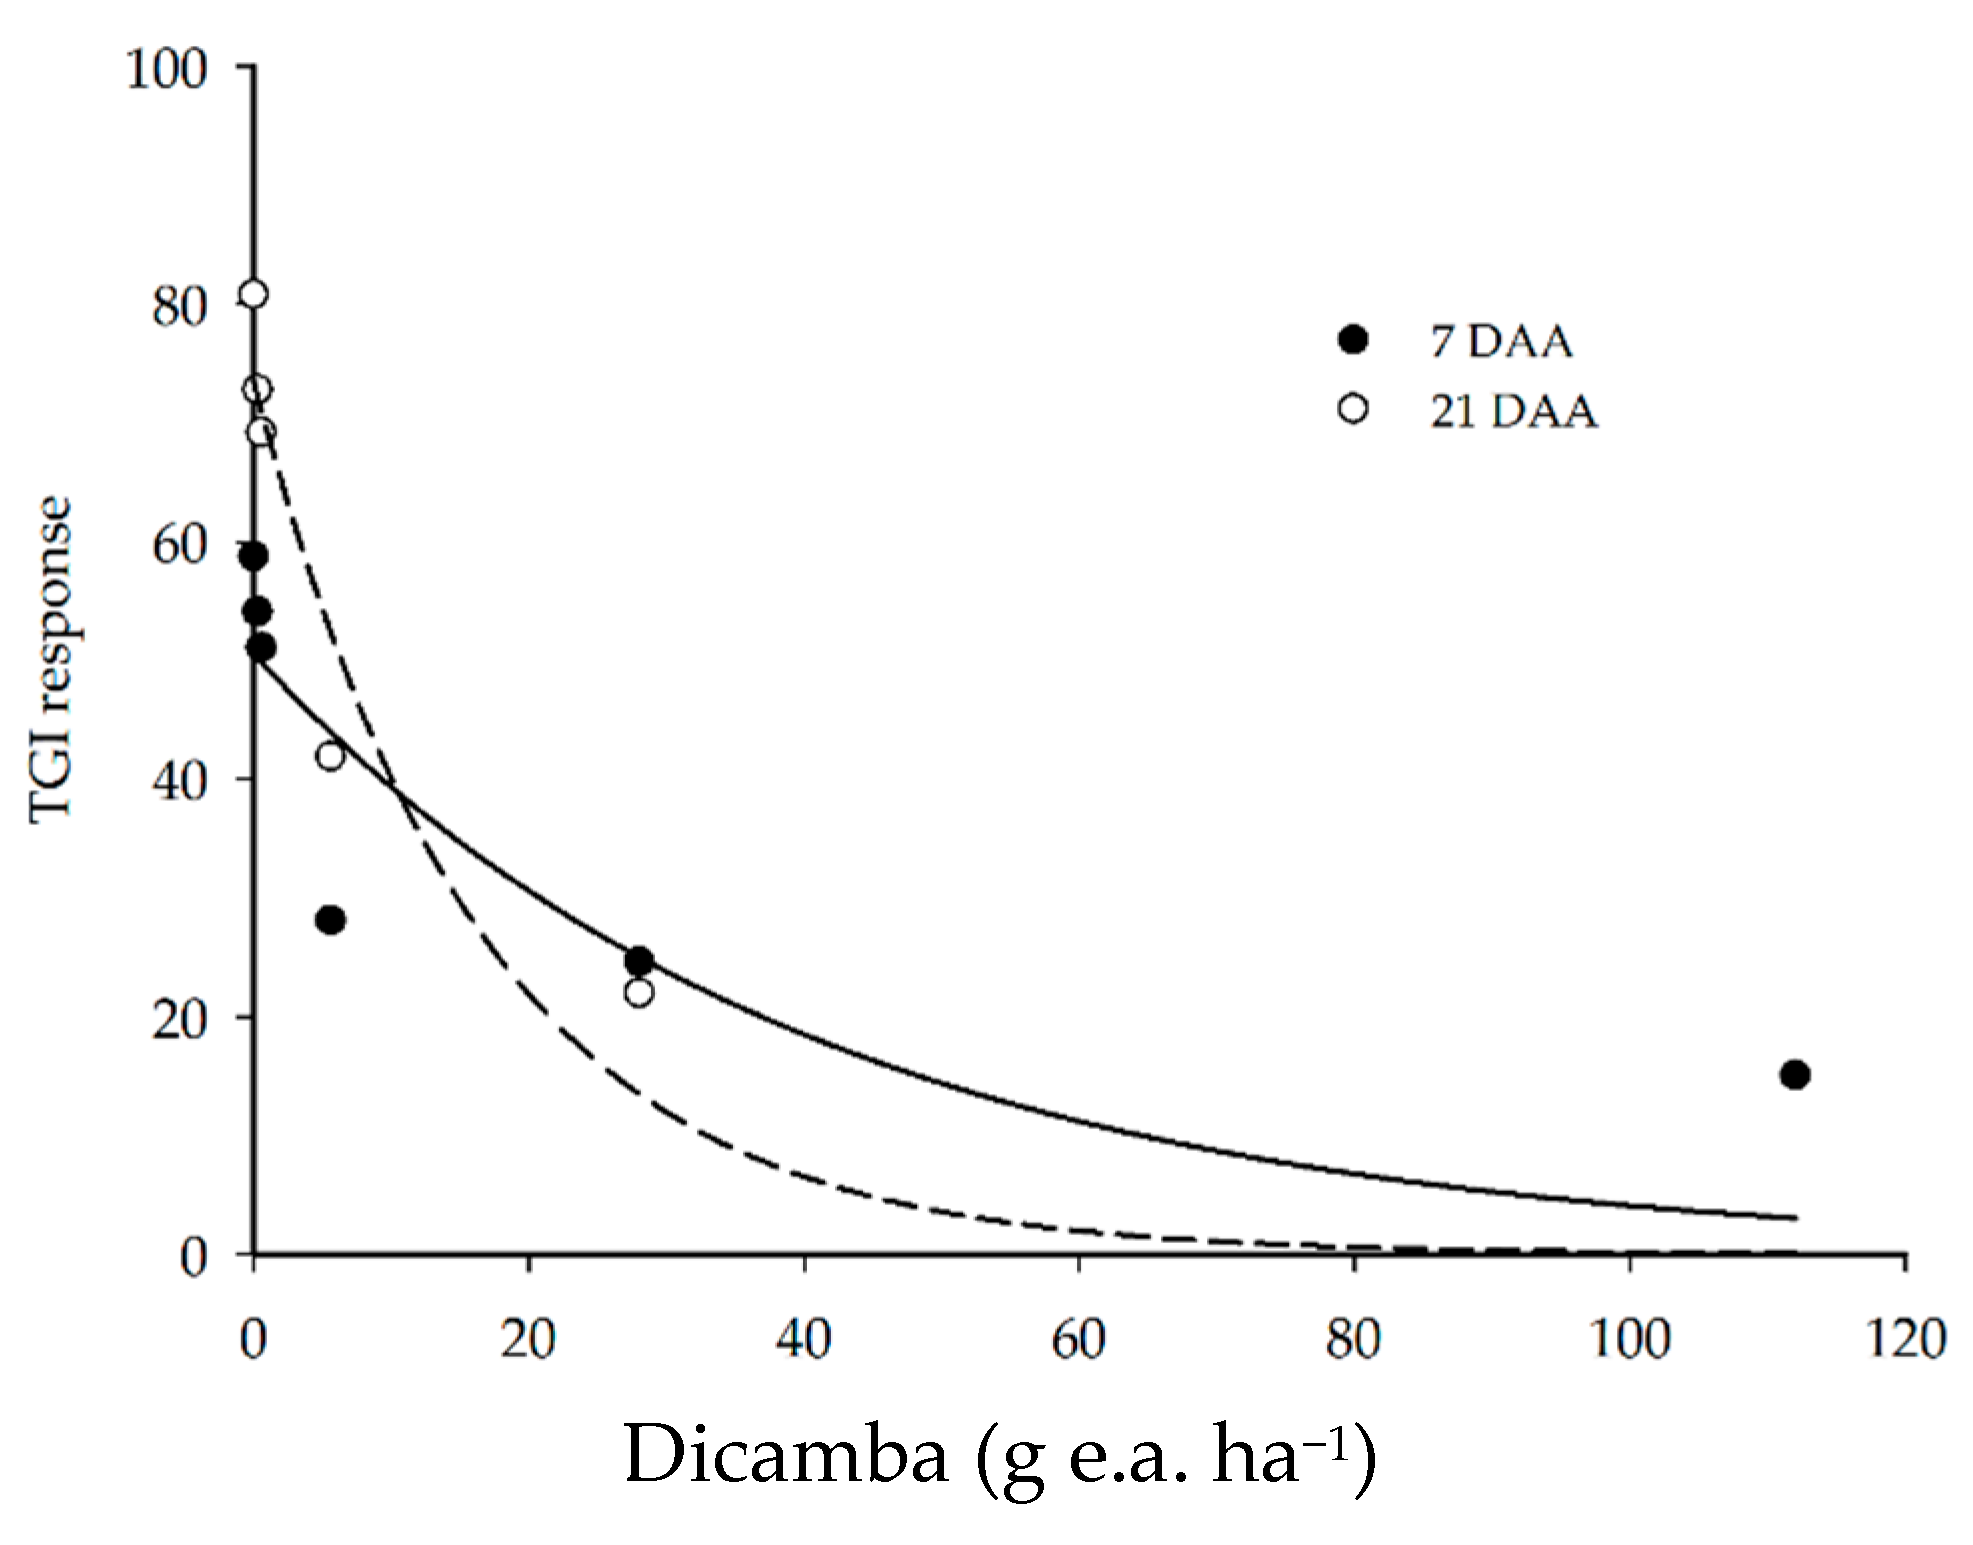
The TGI response of the plots was reduced as the dose of dicamba herbicide increased (Figure 3). The application of up to 0.56 g e.a. ha−1 reduced the index response by a maximum of 14% as compared to the control at 7 and 21 DAA. However, the application of 5.6 g e.a. ha−1 at 7 DAA reduced the vegetation index response by 52%, reaching a reduction of 58 and 74% with 28 and 112 g e.a. ha−1 of dicamba, respectively.
On the other hand, the application of up to 5.6 g e.a. ha−1 of dicamba at 21 DAA generated higher TGI values, as compared to 7 DAA, indicating plant development and recovery from the injury caused by the herbicide. The application of 28 and 112 g e.a. ha−1 of dicamba at 21 DAA further decreased the TGI responses, with reductions of 73 and 110% as compared to the control (0 g e.a. ha−1 of dicamba), respectively.
The TGI response was able to demonstrate the difference in plant development between the two evaluations and the effect of the herbicide, which was most observed in the 21 DAA evaluation due to the characteristics of the dicamba. As compared with the visual analysis, although the stage of development of the plants influences the response of the index, the effect of the herbicide could be observed in a similar way in the two types of evaluation. This indicates that injury assessment using vegetation indices, such as TGI, can be used as another tool in the assessment of injury by dicamba.
The evaluation of herbicide injuries in crops using remote sensing has been a reality for years. The use of remoting sensing is helpful in crop management in areas that were subjected to herbicide damage (e.g., localized application of fertilizers to assist in crop recovery) [14,30]. Therefore, the use of remotely piloted aircraft and regular digital cameras can be important for monitoring injuries caused by dicamba herbicide, whether by drift during application, by vapor drift, or by spray tank contamination.
In this sense, Huang et al. [31] assessed soybean injury from glyphosate using airborne multispectral remote sensing. They stated that early detection of crop injury from herbicide is important for farmers to know the injury potential before the symptoms become visible, so that they can take timely corrective actions to prevent yield losses. Studies have indicated that crop injury from glyphosate, for example, could be detected from 24 h after treatment for soybean [32].
The plant exposure to dicamba herbicide can cause changes in the plant pigments, such as chlorophyll, carotenoids, and anthocyanins. These changes interfere with the spectral response of the plant leaves and can be used as indicators of dicamba-induced injuries [17]. During the action of synthetic auxins, such as dicamba, there is the production and accumulation of reactive oxygen species that cause the peroxidation of lipids in the cell membranes and chloroplast disruption. These reactions cause the progressive destruction of chlorophyll, plant wilting, necrosis of plant structures, and, ultimately, plant death [33,34].
The TGI was developed based on the triangle formed by the spectral response of vegetation to the red, green, and blue (RGB) wavelengths, and a very sensitive spectral index to the chlorophyll content. Starting with the red vertex for convenience, TGI is formulated using 10 nm wide bands centered at 670, 550, and 480 nm. These three wavelengths were selected to approximate the definite integral of the chlorophyll spectrum from a 480 to 670 nm wavelength [21].
This index can be used to evaluate other vegetation-related issues, such as insect-pest attack, diseases, and nutritional disorders, which may be indirectly linked to the chlorophyll content. It is also sensitive to other factors, such as the leaf area index, vegetation coverage, and soil reflectance [19].
RGB vegetation indices such as TGI are important tools for crop monitoring as they do not need more complex sensors, and therefore, guarantee more accessibility and flexibility for data acquisition by RPAs [18]. Vegetation indices obtained from conventional cameras (broadband sensors) are a feasible alternative for crop research in contrast to SVIs that require specific cameras (e.g., multispectral and hyperspectral) such as NDVI [35].
Therefore, these RGB indices can help in the evaluation of the impact caused by dicamba, because visual injury alone may not be sufficient to predict the yield losses as it is a subjective method [7]. Crop monitoring by vegetation indices allows for the evaluation of large areas because RPA, or satellites, can obtain the images; moreover, crop monitoring allows for a better assessment of areas that have suffered from heterogeneous herbicide applications.
3.3. Plant Height
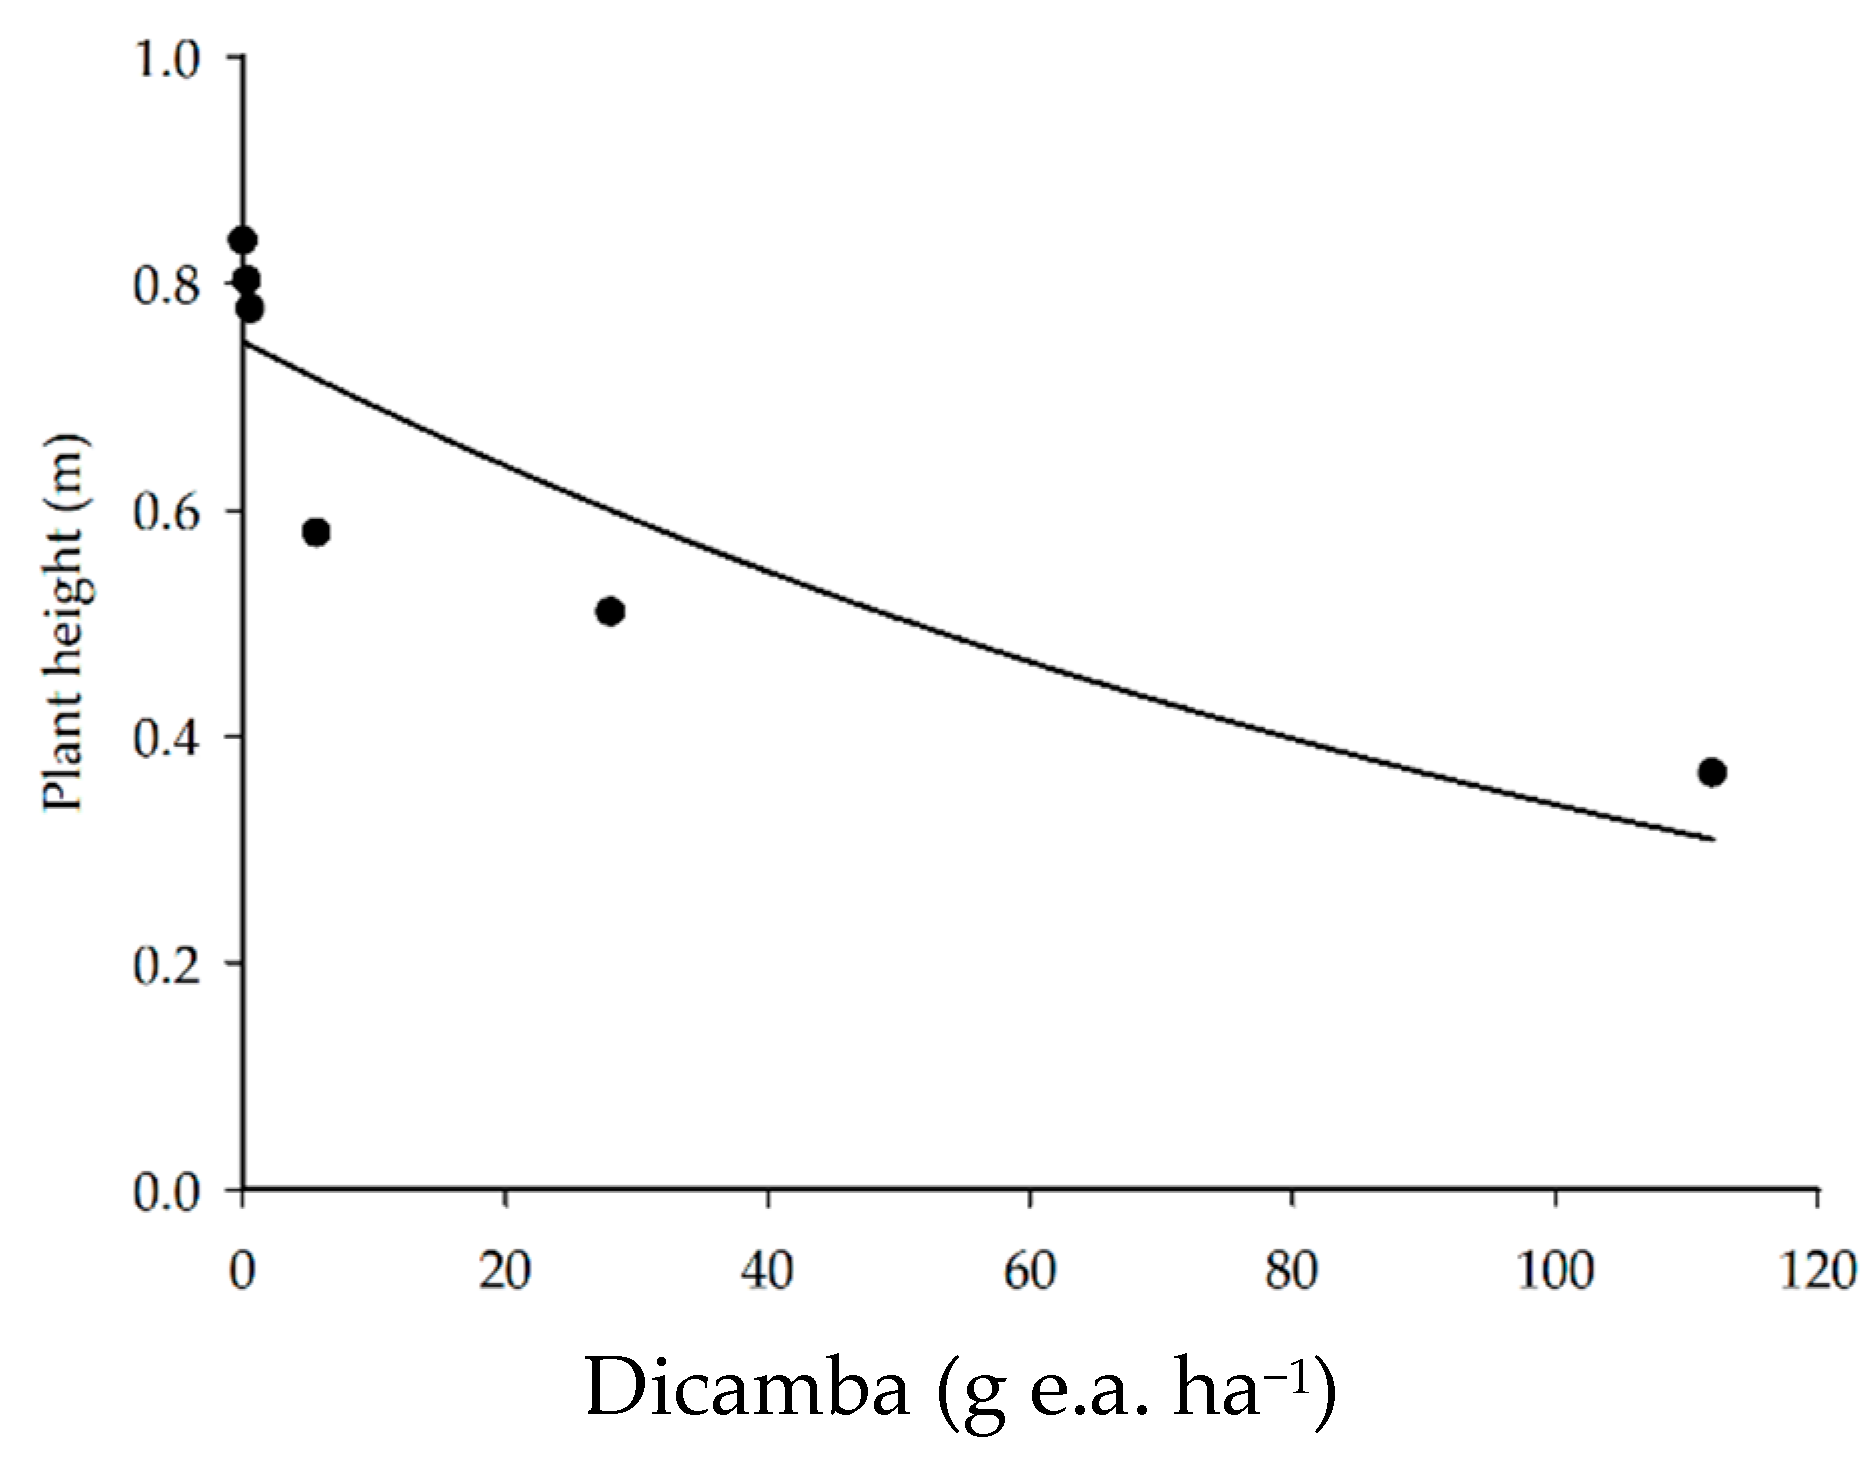
The application of dicamba herbicide reduced soybean plant height (Figure 4) more pronouncedly as the dicamba doses exceeded 0.56 g e.a. ha−1. There was a 31, 39, and 56% reduction in soybean plant height with the application of 5.6, 28, and 112 g e.a. ha−1, respectively, as compared to the control.
The reductions in soybean plant height caused by dicamba phytotoxicity occur due to the decrease in the growth of the apical meristem, petioles, and leaves. These reductions negatively affected the leaf area available for photosynthesis, which leads to reductions in crop yield [4,36]. Schneider et al. [27] evaluated the effect of dicamba doses on soybean growth and observed a reduction of 77 and 27% in plant height with the application of 28 g e.a. ha−1 of dicamba in the V3 and R2 phenological stages, respectively. This reduction demonstrates that the negative effect of herbicide injury on plant height is more pronounced in conditions in which dicamba drift occurred at the beginning of the vegetative stage. According to the authors, this finding is mostly due to the stature of the soybean plants at the time of application, i.e., in the R2 stage, plant growth was practically complete; contrarily, in the V3 phase, the soybean still needed to increase in stature.
3.4. Crop Yield
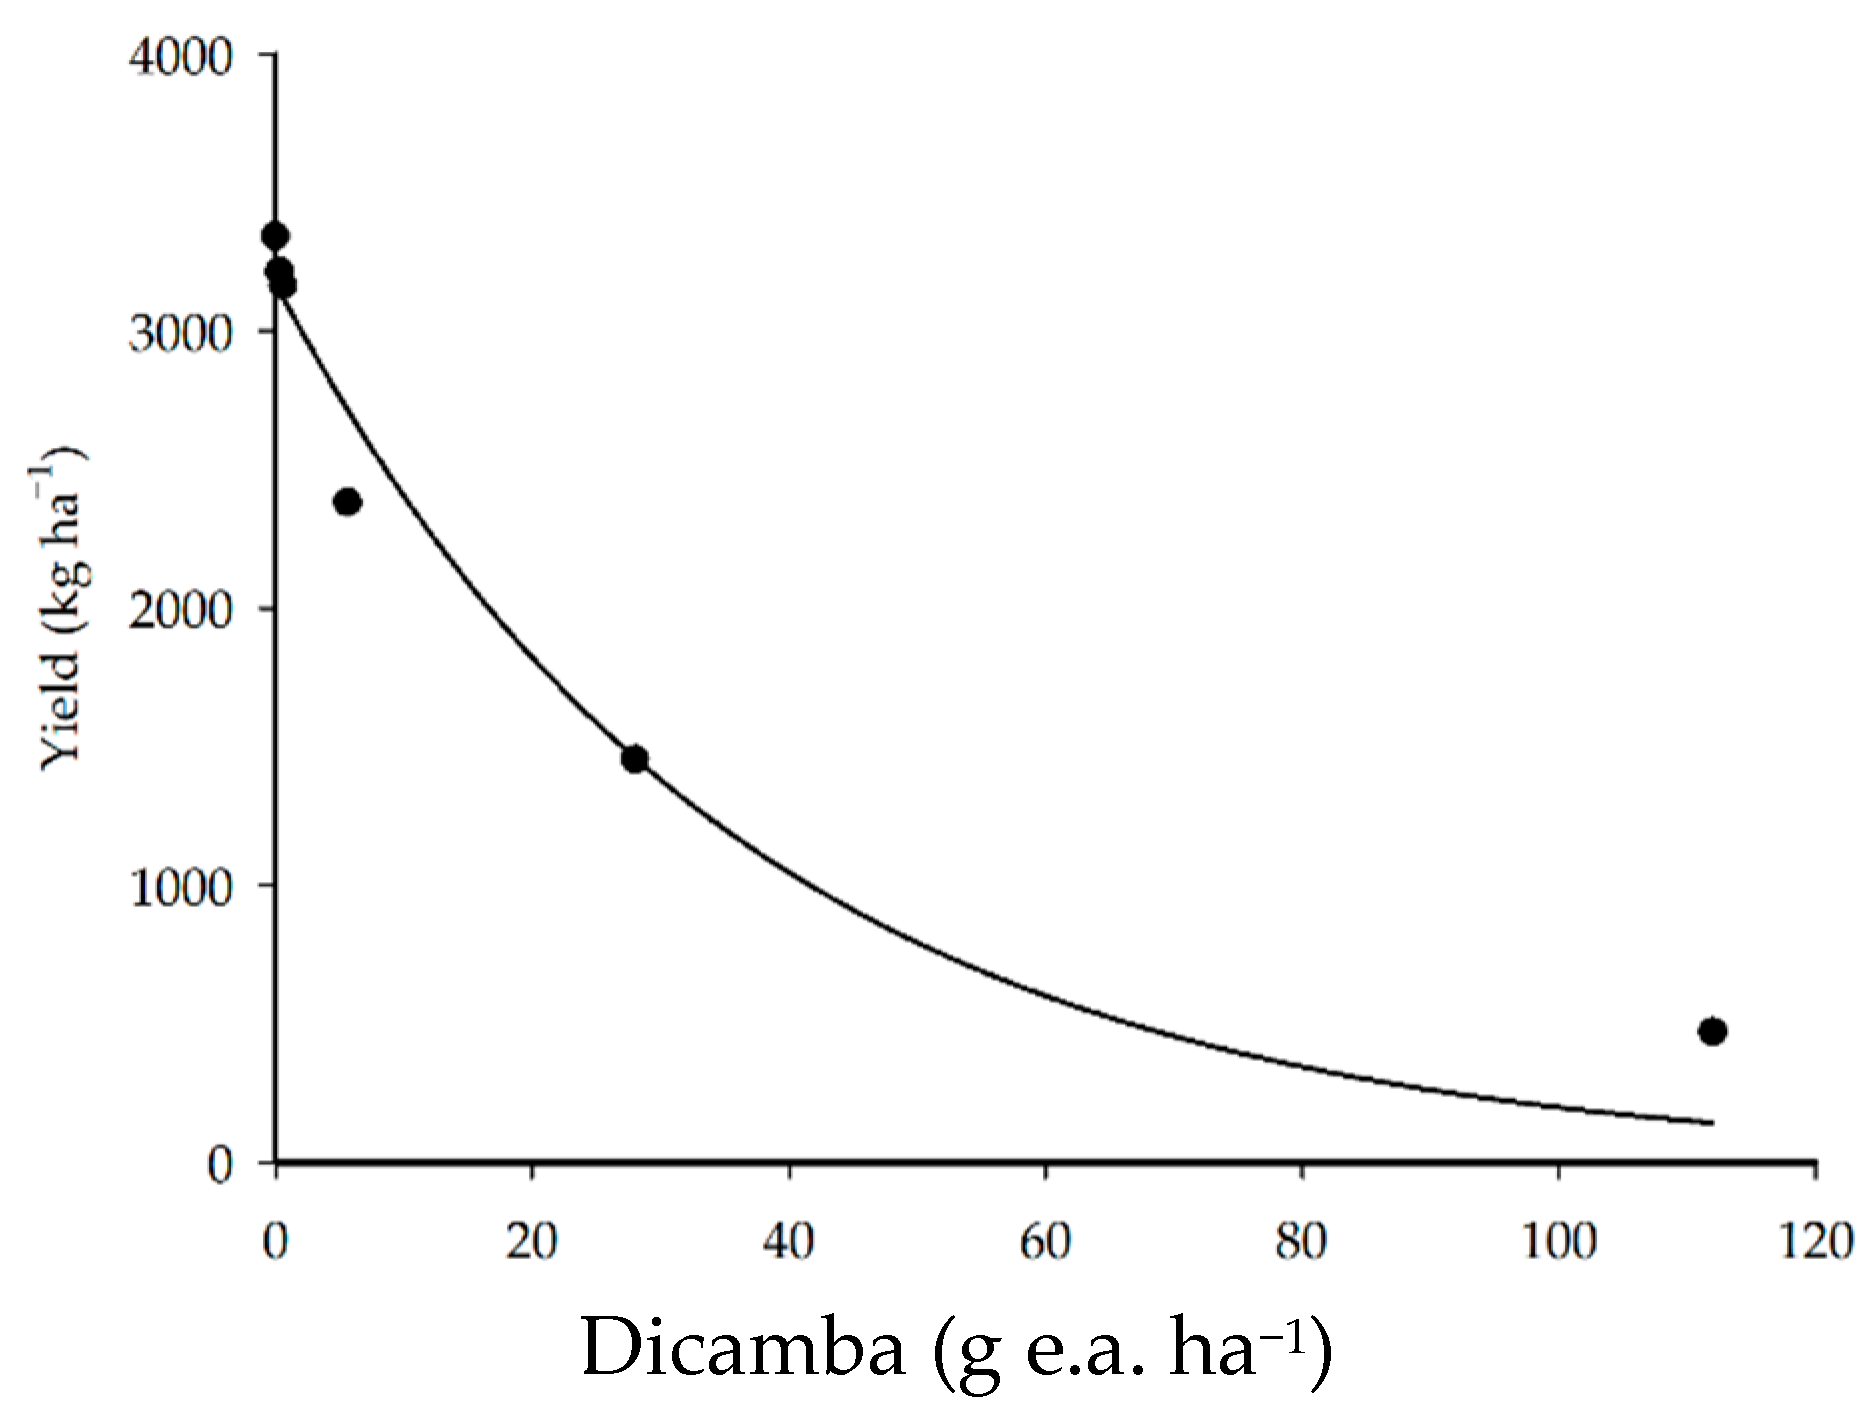
The application of doses of dicamba herbicide reduced crop yield in all treatments (Figure 5). The application of 5.6, 28, and 112 g e.a. ha−1 resulted in 29, 57, and 86% reductions in yield (kg ha−1), respectively. A study conducted by Andersen et al. [5] found that the application of 5.6, 11.2, and 56.0 g e.a. ha−1 of dicamba in the V3 soybean phenological stage resulted in 24, 28, and 77% reductions in yield, respectively.
The application of lower doses (0.28 and 0.56 g e.a. ha−1) resulted in a maximum of a 5% reduction in crop yield. The meta-analysis reported by Kniss [8] estimated that the dicamba dose needed to reduce soybean yield by 5% was 1.9 g e.a. ha−1 for the V1–V3 phenological stage, a higher dicamba dose than that found in the present study (0.56 g e.a. ha−1). The difference observed between these doses may be due to several factors, including the plant cultivar used, the physiological condition of the plants, and the weather conditions [26,27].
Yield loss following dicamba exposure is influenced by the herbicide rate and growth stage during exposure; however, some research indicates that cultivar selection affects soybean recovery from herbicide injury. Furthermore, the plasticity of soybean makes it difficult to generalize concerning the effects of dicamba. These effects are dependent of the cultivar [26,29].
3.5. Correlations
All pairs of variables studied presented a significant Pearson correlation (p < 0.05) (Table 3). Most correlation coefficients observed between the variables were classified as very strong (>0.9), except for correlations between the TGI response with 7 DAA and yield, and between visual analysis at 21 DAA and yield, which had coefficients that are considered as strong (0.6 to 0.9) [37]. Similarly, Huang et al. [17] reported difficulty in correlating the responses of vegetation indices with increasing doses of dicamba in soybean soon after the applications (24, 48, and 72 h after application). However, they obtained a good correlation with 14 DAA.
In general, both the visual evaluation and the evaluation by the TGI index produced good correlations with plant height and crop yield, indicating the use of vegetation index to be feasible for dicamba-injury assessments, whether they came from the herbicide drift or the contamination of the sprayer tank. The use of an RGB-based index (TGI) is less subjective, faster, and covers larger areas, which is attractive for researchers and farmers.
4. Conclusions
The findings of this study can be useful to understand the effect of dicamba drift on nontolerant soybean crops. Nonlinear regression models were adjusted to explain the effects of dicamba doses on leaf injury, plant height, and yield. Subdoses promoted injuries and reduced yield in nontolerant soybean plants, highlighting the need for intelligent management when using this herbicide.
Monitoring with vegetation indices such as TGI is another potential tool for the evaluation of injury by dicamba herbicide. It can be used to assess large areas and is less subjective than visual assessments. Field implementation by farmers is not complex and is economically feasible. Furthermore, crop planners may use these results to predict yield loss ahead of time and benefit from corrective actions.
This study was conducted with one cultivar and six doses. Future studies should include very low dicamba doses and other cultivars, as the physiological responses may be different and interfere with the vegetation index responses.
Author Contributions
Conceptualization, M.G.M., J.P.A.R.d.C. and E.M.L.; methodology, M.G.M., J.P.A.R.d.C. and E.M.L.; software, M.G.M., J.P.A.R.d.C. and E.M.L.; validation, M.G.M., J.P.A.R.d.C. and E.M.L.; formal analysis, M.G.M., J.P.A.R.d.C. and E.M.L.; investigation, M.G.M., J.P.A.R.d.C. and E.M.L.; resources, M.G.M., J.P.A.R.d.C. and E.M.L.; data curation, M.G.M. and J.P.A.R.d.C.; writing—original draft preparation, M.G.M. and J.P.A.R.d.C.; writing—review and editing, E.M.L..; visualization, M.G.M. and J.P.A.R.d.C.; supervision, J.P.A.R.d.C.; project administration, J.P.A.R.d.C.; funding acquisition, J.P.A.R.d.C. All authors have read and agreed to the published version of the manuscript.
Funding
This research was funded partially by Coordenação de Aperfeiçoamento de Pessoal de Nível Superior—Brasil (CAPES)—Finance Code 001, Fundação de Amparo a Pesquisa do Estado de Minas Gerais—Brazil (FAPEMIG) and Conselho Nacional de Desenvolvimento Científico e Tecnológico—Brazil (CNPq), Finance Code 304353/2017-5.
Institutional Review Board Statement
Not applicable.
Informed Consent Statement
Not applicable.
Data Availability Statement
Data sharing not applicable.
Acknowledgments
The authors would like to thank Lamec/UFU Team for their support and assistance in this project.
Conflicts of Interest
The authors declare no conflict of interest.
References
- Behrens, M.R.; Mutlu, N.; Chakraborty, S.; Dumitru, R.; Jiang, W.Z.; Lavallee, B.J.; Herman, P.L.; Clemente, T.E.; Weeks, D.P. Dicamba resistance: Enlarging and preserving biotechnology-based weed management strategies. Science 2007, 316, 1185–1188. [Google Scholar] [CrossRef] [PubMed] [Green Version]
- Byker, H.P.; Soltani, N.; Robinson, D.; Tardif, F.J.; Lawton, M.B.; Sikkema, P.H. Control of glyphosate-resistant horseweed (conyza canadensis) with dicamba applied preplant and postemergence in dicamba-resistant soybean. Weed Technol. 2013, 27, 492–496. [Google Scholar] [CrossRef]
- Egan, J.F.; Mortensen, D.A. Quantifying vapor drift of dicamba herbicides applied to soybean. Environ. Toxicol. Chem. 2012, 31, 1023–1031. [Google Scholar] [CrossRef]
- Osipitan, O.A.; Scott, J.E.; Knezevic, S.Z. Glyphosate-resistant soybean response to micro-rates of three dicamba-based herbicides. Agrosyst. Geosci. Environ. 2019, 2. [Google Scholar] [CrossRef] [Green Version]
- Andersen, S.M.; Clay, S.A.; Wrage, L.J.; Matthees, D. Soybean foliage residues of dicamba and 2,4-d and correlation to application rates and yield. Agron. J. 2004, 96, 750–760. [Google Scholar] [CrossRef]
- Foster, M.R.; Griffin, J.L. Changes in soybean yield components in response to dicamba. Agrosyst. Geosci. Environ. 2019, 2. [Google Scholar] [CrossRef] [Green Version]
- Foster, M.R.; Griffin, J.L.; Copes, J.T.; Blouin, D.C. Development of a model to predict soybean yield loss from dicamba exposure. Weed Technol. 2019, 33, 287–295. [Google Scholar] [CrossRef]
- Kniss, A.R. Soybean response to dicamba: A meta-analysis. Weed Technol. 2018, 32, 507–512. [Google Scholar] [CrossRef]
- Zhang, J.; Huang, Y.; Reddy, K.N.; Wang, B. Assessing crop damage from dicamba on non-dicamba-tolerant soybean by hyperspectral imaging through machine learning. Pest Manag. Sci. 2019, 75, 3260–3272. [Google Scholar] [CrossRef]
- Solomom, C.B.; Bradley, K.W. Influence of application timings and sublethal rates of synthetic auxin herbicides on soybean. Weed Tech. 2014, 28, 454–464. [Google Scholar] [CrossRef]
- Everitt, J.D.; Keeling, J.W. Cotton growth and yield response to simulated 2,4-D and dicamba drift. Weed Tech. 2009, 23, 503–506. [Google Scholar] [CrossRef]
- Hunt, E.R.; Daughtry, C.S.T. What good are unmanned aircraft systems for agricultural remote sensing and precision agriculture? Int. J. Remote Sens. 2018, 39, 5345–5376. [Google Scholar] [CrossRef] [Green Version]
- Atzberger, C. Advances in remote sensing of agriculture: Context description, existing operational monitoring systems and major information needs. Remote Sens. 2013, 5, 949–981. [Google Scholar] [CrossRef] [Green Version]
- Henry, W.B.; Shaw, D.R.; Reddy, K.R.; Bruce, L.M.; Tamhankar, H.D. Remote sensing to detect herbicide drift on crops. Weed Technol. 2004, 18, 358–368. [Google Scholar] [CrossRef]
- Xue, J.; Su, B. Significant remote sensing vegetation indices: A review of developments and applications. J. Sens. 2017, 2017, 1353691. [Google Scholar] [CrossRef] [Green Version]
- Duddu, H.S.N.; Johnson, E.N.; Willenborg, C.J.; Shirtliffe, S.J. High-throughput UAV image-based method is more precise than manual rating of herbicide tolerance. Plant Phenomics 2019, 2019, 6036453. [Google Scholar] [CrossRef] [Green Version]
- Huang, Y.; Yuan, L.; Reddy, K.N.; Zhang, J. In-situ plant hyperspectral sensing for early detection of soybean injury from dicamba. Biosyst. Eng. 2016, 149, 51–59. [Google Scholar] [CrossRef]
- Freire-Silva, J.; Paz, Y.E.; Lima-Silva, P.P.; Pereira, J.A.S.; Candeias, A.L.B. Índices de vegetação do sensoriamento remoto para processamento de imagens na faixa do visível (RGB). J. Hyperspectr. Remote Sens. 2019, 9, 228–239. [Google Scholar] [CrossRef]
- Hunt, E.R.; Doraiswamy, P.C.; McMurtrey, J.E.; Daughtry, C.S.; Perry, E.M.; Akhmedov, B. A visible band index for remote sensing leaf chlorophyll content at the canopy scale. Int. J. Appl. Earth Obs. Geoinf. 2013, 21, 103–112. [Google Scholar] [CrossRef] [Green Version]
- Netto, A.F.A.; Martins, R.N.; Souza, G.S.A.; Santos, F.F.L.; Rosas, J.T.F. Evaluation of a low-cost camera for agricultural applications. J. Exp. Agric. Int. 2019, 32, 1–9. [Google Scholar] [CrossRef]
- Hunt, E.R.; Daughtry, C.S.T.; Eitel, J.U.; Long, D.S. Remote sensing leaf chlorophyll content using a visible band index. Agron. J. 2011, 103, 1090–1099. [Google Scholar] [CrossRef] [Green Version]
- State of New South Wales. New South Wales Weed Control Handbook, NSW. 2018. Available online: https://www.dpi.nsw.gov.au/__data/assets/pdf_file/0017/123317/weed-control-handbook.pdf (accessed on 26 April 2021).
- Behrens, R.; Lueschen, W.E. Dicamba volatility. Weed Sci. 1979, 27, 486–493. [Google Scholar] [CrossRef]
- Starý, K.; Jelínek, Z.; Kumhálová, J.; Chyba, J.; Balázová, K. Comparing RGB—based vegetation indices from UAV imageries to estimate hops canopy area. Agron. Res. 2020, 18, 2592–2601. [Google Scholar]
- R Core Team. R: A Language and Environment for Statistical Computing; R Foundation for Statistical Computing: Vienna, Austria, 2019. [Google Scholar]
- McCown, S.; Barber, T.; Norsworthy, J.K. Response of non–dicamba-resistant soybean to dicamba as influenced by growth stage and herbicide rate. Weed Technol. 2018, 32, 513–519. [Google Scholar] [CrossRef]
- Schneider, T.; Rizzardi, M.A.; Rockenbach, A.P.; Peruzzo, S.T. Subdoses of dicamba herbicide on yield componentes in function of the soybean growth stage. J. Agric. Sci. 2019, 11, 407–415. [Google Scholar] [CrossRef]
- Costa, E.M.; Jakelaitis, A.; Zuchi, J.; Pereira, L.S.; Ventura, M.V.A.; Oliveira, G.S.; Sousa, G.D.; Silva, J.N. Simulated drift of dicamba and 2,4-D on soybeans: Effects of application dose and time. Biosci. J. 2020, 36, 857–864. [Google Scholar] [CrossRef]
- Weidenhamer, J.D.; Triplett, G.B.; Sobotka, F.E. Dicamba injury to soybean. Agron. J. 1989, 81, 637–643. [Google Scholar] [CrossRef]
- Hickman, M.V.; Everitt, J.H.; Escobar, D.E.; Richardson, A.J. Aerial photography and videography for detecting and mapping dicamba injury patterns. Weed Technol. 1991, 5, 700–706. [Google Scholar] [CrossRef]
- Huang, Y.; Reddy, K.N.; Thomson, S.J.; Yao, H. Assessment of soybean injury from glyphosate using airborne multispectral remote sensing. Pest Manag. Sci. 2015, 71, 545–552. [Google Scholar] [CrossRef]
- Huang, Y.; Thomson, S.J.; Molin, W.T.; Reddy, K.N.; Yao, H. Early detection of soybean plant injury from glyphosate by measuring chlorophyll reflectance and fluorescence. J. Agric. Sci. 2012, 4, 117–124. [Google Scholar] [CrossRef]
- Grossmann, K. Auxin herbicide action: Lifting the veil step by step. Plant Signal. Behav. 2007, 2, 421–423. [Google Scholar] [CrossRef] [PubMed] [Green Version]
- Grossmann, K. Auxin herbicides: Current status of mechanism and mode of action. Pest Manag. Sci. 2009, 66, 113–120. [Google Scholar] [CrossRef] [PubMed]
- Fuentes-Peailillo, F.; Ortega-Farias, S.; Rivera, M.; Bardeen, M.; Moreno, M. Comparison of vegetation indices acquired from RGB and multispectral sensors placed on UAV. In Proceedings of the IEEE International Conference on Automation, Concepcion, Chile, 17–19 October 2018. [Google Scholar]
- Robinson, A.P.; Simpson, D.M.; Johnson, W.G. Response of glyphosate-tolerant soybean yield components to dicamba exposure. Weed Sci. 2013, 61, 526–536. [Google Scholar] [CrossRef]
- Callegari-Jacques, S.M. Bioestatística: Princípios e Aplicações; Artmed: Porto Alegre, Brazil, 2009. [Google Scholar]
Figure 1.
(a) Original image of an experimental plot. (b) Triangular greenness index image of an experimental plot. (c) Triangular greenness index image with red–green palette applied.
Figure 1.
(a) Original image of an experimental plot. (b) Triangular greenness index image of an experimental plot. (c) Triangular greenness index image with red–green palette applied.

Figure 2.
Visual analysis of soybean leaf injury at 7 and 21 DAA of dicamba doses.

Figure 3.
Soybean TGI responses at 7 and 21 DAA of dicamba doses.

Figure 4.
Soybean plant height as a function of the application of dicamba doses.

Figure 5.
Soybean yield as a function of the application of dicamba doses.


Table 1.
Summary of the analysis of variance.
| Source of Variation | df | Visual Analysis | TGI | Plant Height | Yield | ||
|---|---|---|---|---|---|---|---|
| 7 DAA | 21 DAA | 7 DAA | 21 DAA | ||||
| FC Test (p Value) | |||||||
| Dicamba | 5 | 1116.35 | 146.61 | 29.38 | 111.13 | 62.92 | 70.66 |
| (<0.001) | (<0.001) | (<0.001) | (<0.001) | (<0.001) | (<0.001) | ||
| Block | 3 | ||||||
| Error | 15 | ||||||
| CV (%) | 4.91 | 11.78 | 17.42 | 14.15 | 7.38 | 11.80 | |
| SW | 0.2436 + | 0.3547 + | 0.8041 + | 0.7992 + | 0.8388 + | 0.0289 + | |
| O&M | 0.5613 + | 0.1863 + | 0.4307 + | 0.0867 + | 0.4286 + | 0.8870 + | |
| T | 0.4927 + | 0.1624 + | 0.9643 + | 0.9643 + | 0.9467 + | 0.8759 + | |
TGI: Triangular greenness index. FC: calculated F values. CV (%): coefficient of variation. SW: residue normality by Shapiro–Wilk. O&M: variance homogeneity by O’Neill and Mathews. T: block additivity by Tukey. + presumption attendance (p > 0.01). Yield: soybean crop yield.
Table 2.
Models of regression adjustments of visual analysis of soybean leaf injury, TGI vegetation index, plant height, and crop yield (ŷ) as a function of dicamba dose (x).
Table 2.
Models of regression adjustments of visual analysis of soybean leaf injury, TGI vegetation index, plant height, and crop yield (ŷ) as a function of dicamba dose (x).
| Variable | Function | R2 | FC | p Value | |
|---|---|---|---|---|---|
| visual analysis | 7 DAA | ŷ = 26.9312 x0.2181 | 92.78 | 51.4210 | 0.0020 |
| 21 DAA | ŷ = 35.8384 x0.1803 | 96.23 | 102.1533 | 0.0005 | |
| TGI | 7 DAA | ŷ = 50.5499 e−0.0252x | 71.18 | 9.8811 | 0.0347 |
| 21 DAA | ŷ = 73.5128 e−0.0606x | 94.89 | 74.2232 | 0.0010 | |
| Plant height | ŷ = 0.7482 e−0.0079x | 76.46 | 12.9927 | 0.0227 | |
| Yield | ŷ = 3172.6639 e−0.0278x | 96.24 | 102.3146 | 0.0005 | |
TGI: Triangular greenness index. R2: coefficient of determination. Fc: calculated F values.
Table 3.
Pearson correlation (r) among evaluated variables.
| V.A. 7 DAA | V.A. 21 DAA | TGI 7 DAA | TGI 21 DAA | Plant Height | Yield | |
|---|---|---|---|---|---|---|
| V.A. 7 DAA | 1 | 0.975 * | −0.951 * | −0.941 * | −0.955 * | −0.911 * |
| V.A. 21 DAA | 1 | −0.918 * | −0.920 * | −0.936 * | −0.890 * | |
| TGI 7 DAA | 1 | 0.932 * | 0.950 * | 0.883 * | ||
| TGI 21 DAA | 1 | 0.972 * | 0.952 * | |||
| Plant height | 1 | 0.950 * | ||||
| Yield | 1 |
V.A.: visual analysis. TGI: Triangular greenness index. Yield: soybean crop yield. * significant Person correlation (p < 0.01).
Publisher’s Note: MDPI stays neutral with regard to jurisdictional claims in published maps and institutional affiliations. |
© 2021 by the authors. Licensee MDPI, Basel, Switzerland. This article is an open access article distributed under the terms and conditions of the Creative Commons Attribution (CC BY) license (https://creativecommons.org/licenses/by/4.0/).
Share and Cite
MDPI and ACS Style
Marques, M.G.; da Cunha, J.P.A.R.; Lemes, E.M. Dicamba Injury on Soybean Assessed Visually and with Spectral Vegetation Index. AgriEngineering 2021, 3, 240-250. https://0-doi-org.brum.beds.ac.uk/10.3390/agriengineering3020016
AMA Style
Marques MG, da Cunha JPAR, Lemes EM. Dicamba Injury on Soybean Assessed Visually and with Spectral Vegetation Index. AgriEngineering. 2021; 3(2):240-250. https://0-doi-org.brum.beds.ac.uk/10.3390/agriengineering3020016
Chicago/Turabian StyleMarques, Matheus Gregorio, João Paulo Arantes Rodrigues da Cunha, and Ernane Miranda Lemes. 2021. "Dicamba Injury on Soybean Assessed Visually and with Spectral Vegetation Index" AgriEngineering 3, no. 2: 240-250. https://0-doi-org.brum.beds.ac.uk/10.3390/agriengineering3020016