
A Mobile-Based System for Detecting Plant Leaf Diseases Using Deep Learning


Department of Computer Science, Prairie View A&M University, Prairie View, TX 77446, USA
*
Author to whom correspondence should be addressed.
AgriEngineering 2021, 3(3), 478-493; https://0-doi-org.brum.beds.ac.uk/10.3390/agriengineering3030032
Submission received: 2 May 2021
/
Revised: 8 June 2021
/
Accepted: 25 June 2021
/
Published: 1 July 2021
Abstract
:Plant diseases are one of the grand challenges that face the agriculture sector worldwide. In the United States, crop diseases cause losses of one-third of crop production annually. Despite the importance, crop disease diagnosis is challenging for limited-resources farmers if performed through optical observation of plant leaves’ symptoms. Therefore, there is an urgent need for markedly improved detection, monitoring, and prediction of crop diseases to reduce crop agriculture losses. Computer vision empowered with Machine Learning (ML) has tremendous promise for improving crop monitoring at scale in this context. This paper presents an ML-powered mobile-based system to automate the plant leaf disease diagnosis process. The developed system uses Convolutional Neural networks (CNN) as an underlying deep learning engine for classifying 38 disease categories. We collected an imagery dataset containing 96,206 images of plant leaves of healthy and infected plants for training, validating, and testing the CNN model. The user interface is developed as an Android mobile app, allowing farmers to capture a photo of the infected plant leaves. It then displays the disease category along with the confidence percentage. It is expected that this system would create a better opportunity for farmers to keep their crops healthy and eliminate the use of wrong fertilizers that could stress the plants. Finally, we evaluated our system using various performance metrics such as classification accuracy and processing time. We found that our model achieves an overall classification accuracy of 94% in recognizing the most common 38 disease classes in 14 crop species.
1. Introduction
Plant diseases [1], pest infestation [2], weed pressure [3], and nutrient deficiencies [4] are some of the grand challenges for any agricultural producer, at any location and for whatever commodities or size of the operation is dealing daily. It is crucial that farmers would know the existence of such challenges in their operations on a timely basis. Nevertheless, it would be tremendously helpful to agricultural producers to have access to readily available technology to instruct them on how to deal with each of these threats for agricultural production to enhance crop production and operation profitability.
For instance, in the United States, plant disease causes losses of between 20 and 40 percent of the agricultural crop production annually [5]. Therefore, farmers must promptly diagnose the different types of plant diseases to stop their spread within their agricultural fields. Traditionally, underserved farmers try to diagnose plant diseases through optical observation of plant leaves’ symptoms, which incorporates a significantly high degree of complexity [6]. Any misdiagnosis of crop decreases will lead to the use of the wrong fertilizers that could stress the plants and lead to nutrient deficiencies in the agricultural field.
Machine Learning (ML) coupled with computer vision [7,8] have already enabled game-changing precision agriculture capabilities by providing the ability to optimize farm returns [9], preserve natural resources [10], reduce unnecessary use of fertilizers [1], and identify disease in crops and animals from remotely sensed imagery [11]. Imagine a smart mobile-based system that farmers can use to identify the different types of plant diseases with high accuracy. Such systems would help both small- and large-scale farmers to make the right decisions on which fertilizers to use to confront plant diseases in their crops.
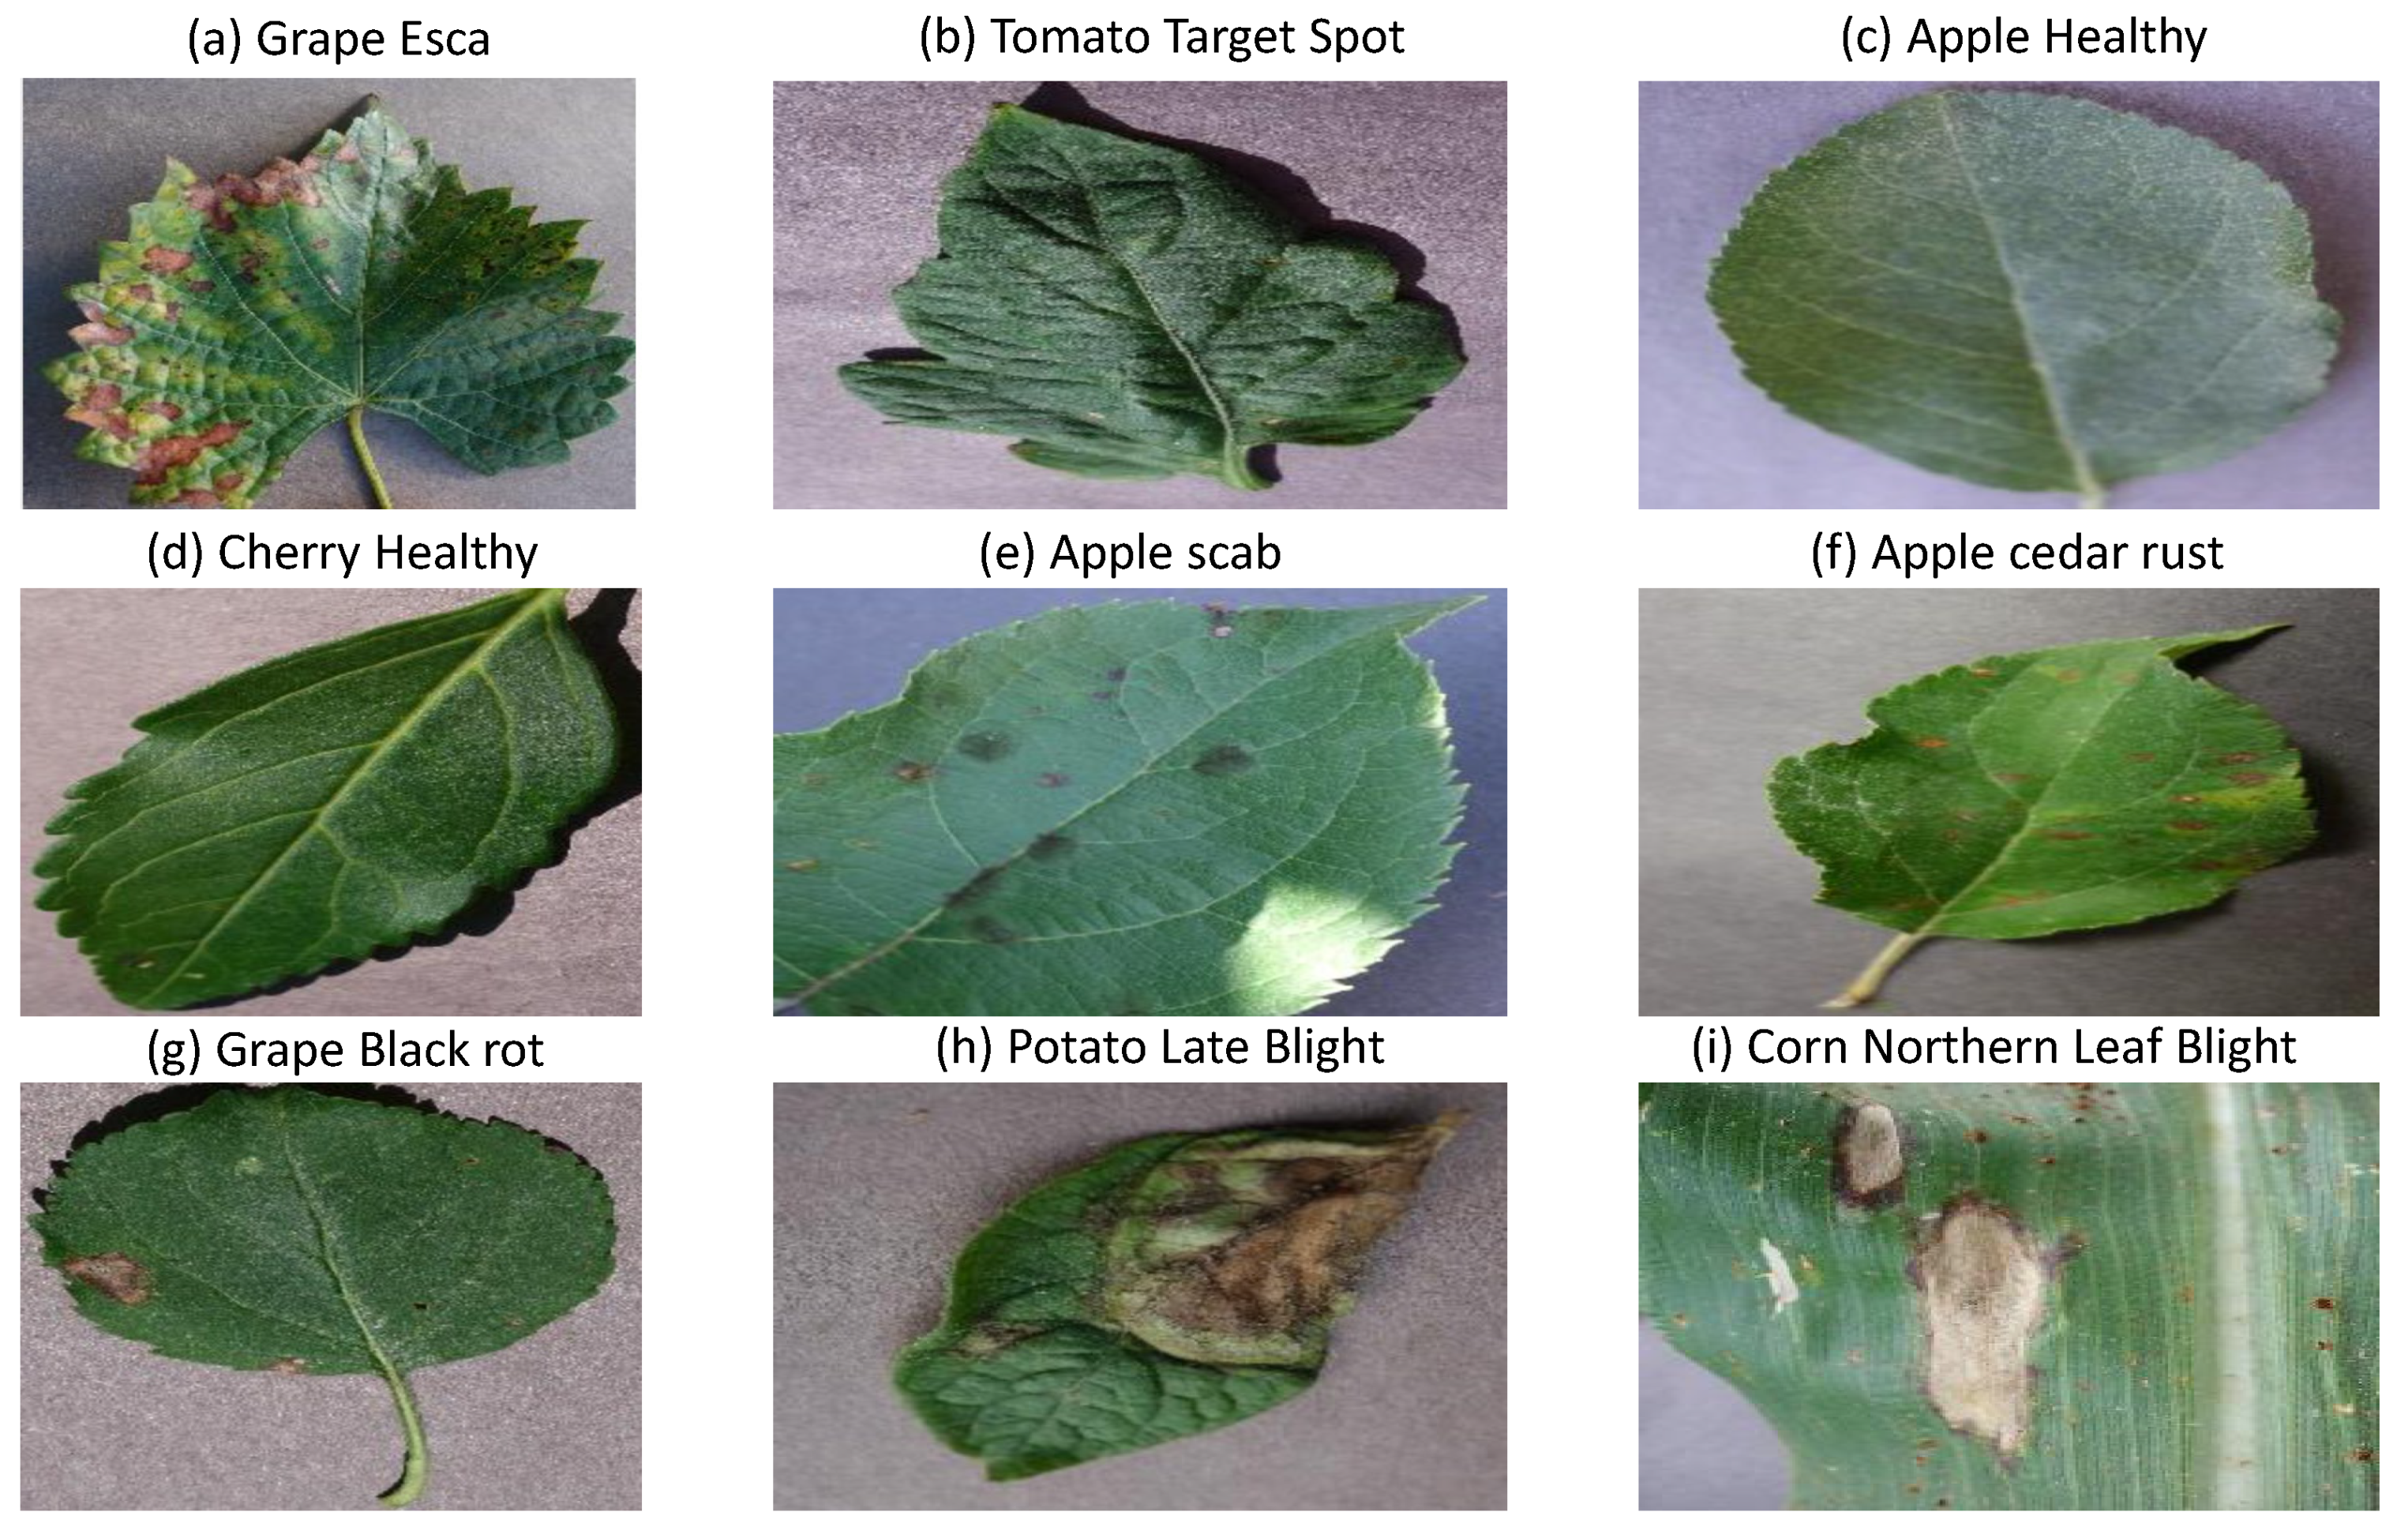
This paper presents a mobile-based system for detecting plant leaf diseases using Deep Learning (DL) in realtime. In particular, we developed a distributed system that is organized with parts executing on centralized servers on the cloud and locally on the user’s mobile devices. We created a dataset that consists of more than 96 k images for the most common 38 plant disease categories in 14 crop species, including apple scab, apple black rot, cherry powdery mildew, corn common rust, grape leaf blight, and many others. Figure 1 shows some examples of various types of healthy and infected plant leaves from our imagery dataset.
At the cloud side, we created a Convolutional Neural Network (CNN) model [12] that can feed images directly from farmers’ mobile devices. The model then performs object detection and semantic segmentation, and displays the disease category along with the confidence percentage and classification time have taken to process the image. We developed an Android mobile app to allow limited-resources farmers to capture a photo of the diseased plant leaves. The mobile app runs on top of the CNN model on the user side. Also, the application displays the confidence percentage and classification time taken to process the image.
The contributions of this paper are threefold. First, we propose a distributed ML-powered platform that is organized with two parts executing on the mobile user devices at the agricultural field and high-performance servers hosted in the cloud. Second, the proposed system is capable of capturing, processing, and visualizing large imagery agrarian datasets. Third, we developed a user-friendly interface on top of the CNN model to allow farmers to interact with the disease detector conveniently on the mobile side.
The rest of the paper is organized as follows: Section 2 presents related work. Section 3 and Section 4 present the design and prototype implementation of the system, respectively. Section 5 experimentally evaluates the developed model in terms of classification time and accuracy. Finally, Section 6 summarizes the results of this work.
2. Related Work
Recent developments in machine learning approaches in the agriculture sector are up-and-coming. They have been receiving significant interest from academia [2,3,6,7], industries [1,10], and governments [13,14]. This section reviews some of the existing work supporting the detection of crop diseases using different machine learning approaches.
Since plant diseases cause significant crop production losses worldwide, tremendous research efforts have been conducted to make crop monitoring and disease diagnosis processes more efficient. For instance, in [15], the authors presented a deep learning model to identify foliar symptoms of diseases in cassava. A CNN model was trained using an imagery dataset of 720 diseased leaflets in an agricultural field in Tanzania. The developed model could detect seven classes of healthy and infected cassava leaflets, namely, healthy, brown streak disease, mosaic disease, green mite damage, red mite damage, brown leaf spot, and nutrient deficiency. However, the developed system suffers from a low classification rate when used to detect cassava diseases in real-world images.
Chen et al. [7] used a combination of the Internet of Things (IoT) and Artificial Intelligence (AI) technologies to detect the rice blast disease in its early stages. An IoT platform, called RiceTalk, was developed to detect rice blast utilizing non-image IoT devices, which generate sensing data from soil cultivation. The sensed data could be automatically trained and analyzed by a CNN model in realtime. RiceTalk achieved an average prediction accuracy of 89.4% for detecting a rice blast disease in the natural agricultural field.
Another DL-based platform for detecting crop diseases and insect pests is proposed in [2]. Similar to [7], the authors used CNN as an underlying DL engine to identify 27 crop diseases located in the harsh mountainous environment in China. The user interface was implemented as a Java applet, which enables Chinese farmers to use the system conveniently. The authors conducted a set of experiments that showed the overall recognition accuracy to be 86.1%.
Jiang et al. [6] proposed an apple leaf disease detection approach based on the Mask Region-based CNN (R-CNN) model [8]. R-CNN is a DL model for object instance segmentation that can detect interest objects in an image while generating a segmentation mask for each instance. A dataset containing 2029 images of diseased apple leaves is used to train a CNN model for detecting the common apple diseases. The developed model could detect five disease classes: Alternaria leaf spot, brown spot, mosaic, grey spot, and rust. Given the relatively small dataset used for training the CNN model, the classification accuracy was calculated to be 78.8%.
In [3] the authors developed a DL-based approach for detecting the citrus disease severity. A dataset consists of 5406 images of infected citrus leaves used to train six DL models, namely AlexNet, DenseNet-169, Inception-v3, ResNet-34, SqueezeNet-1.1, and VGG13. In addition to the original training dataset, a data augmentation technique was implemented to increase the dataset size, which helped in improving the models’ learning performance. The authors compared the performance of these six models to determine which models are more suitable to detect the severity of citrus diseases. The best classification achieved was 92.60% using the Inception-v3 model.
The benefits of hyper-spectral imaging for plant disease detection and plant protection are discussed in [4]. Thomas et al. described the basic principles of hyperspectral measurements along with its available sensors in the market on different scales —from the tissue level to the canopy level— and external factors, such as light, wind, viewing angle, etc. The authors found that the camera spatial resolution and the number of mixed pixels are essential factors influencing hyper-spectral images’ information content. This parameter highly depends on the distance between the sensor and the plant object.
In summary, the review of plant disease detection using machine learning [7] and computer vision [4] shows that most of these approaches focus on particular disease classes [6,15], crop species [3], geographical regions or countries [2,15]. Moreover, most DL-based models are designed to work offline, which is not appropriate for real-time crop disease detection. Furthermore, to the best of our knowledge, none of the current DL-based approaches can be deployed on mobile devices due to their limited computational capabilities, which precludes minimizing the communication delays and enhancing the farmer experience in using the system.
3. System Design
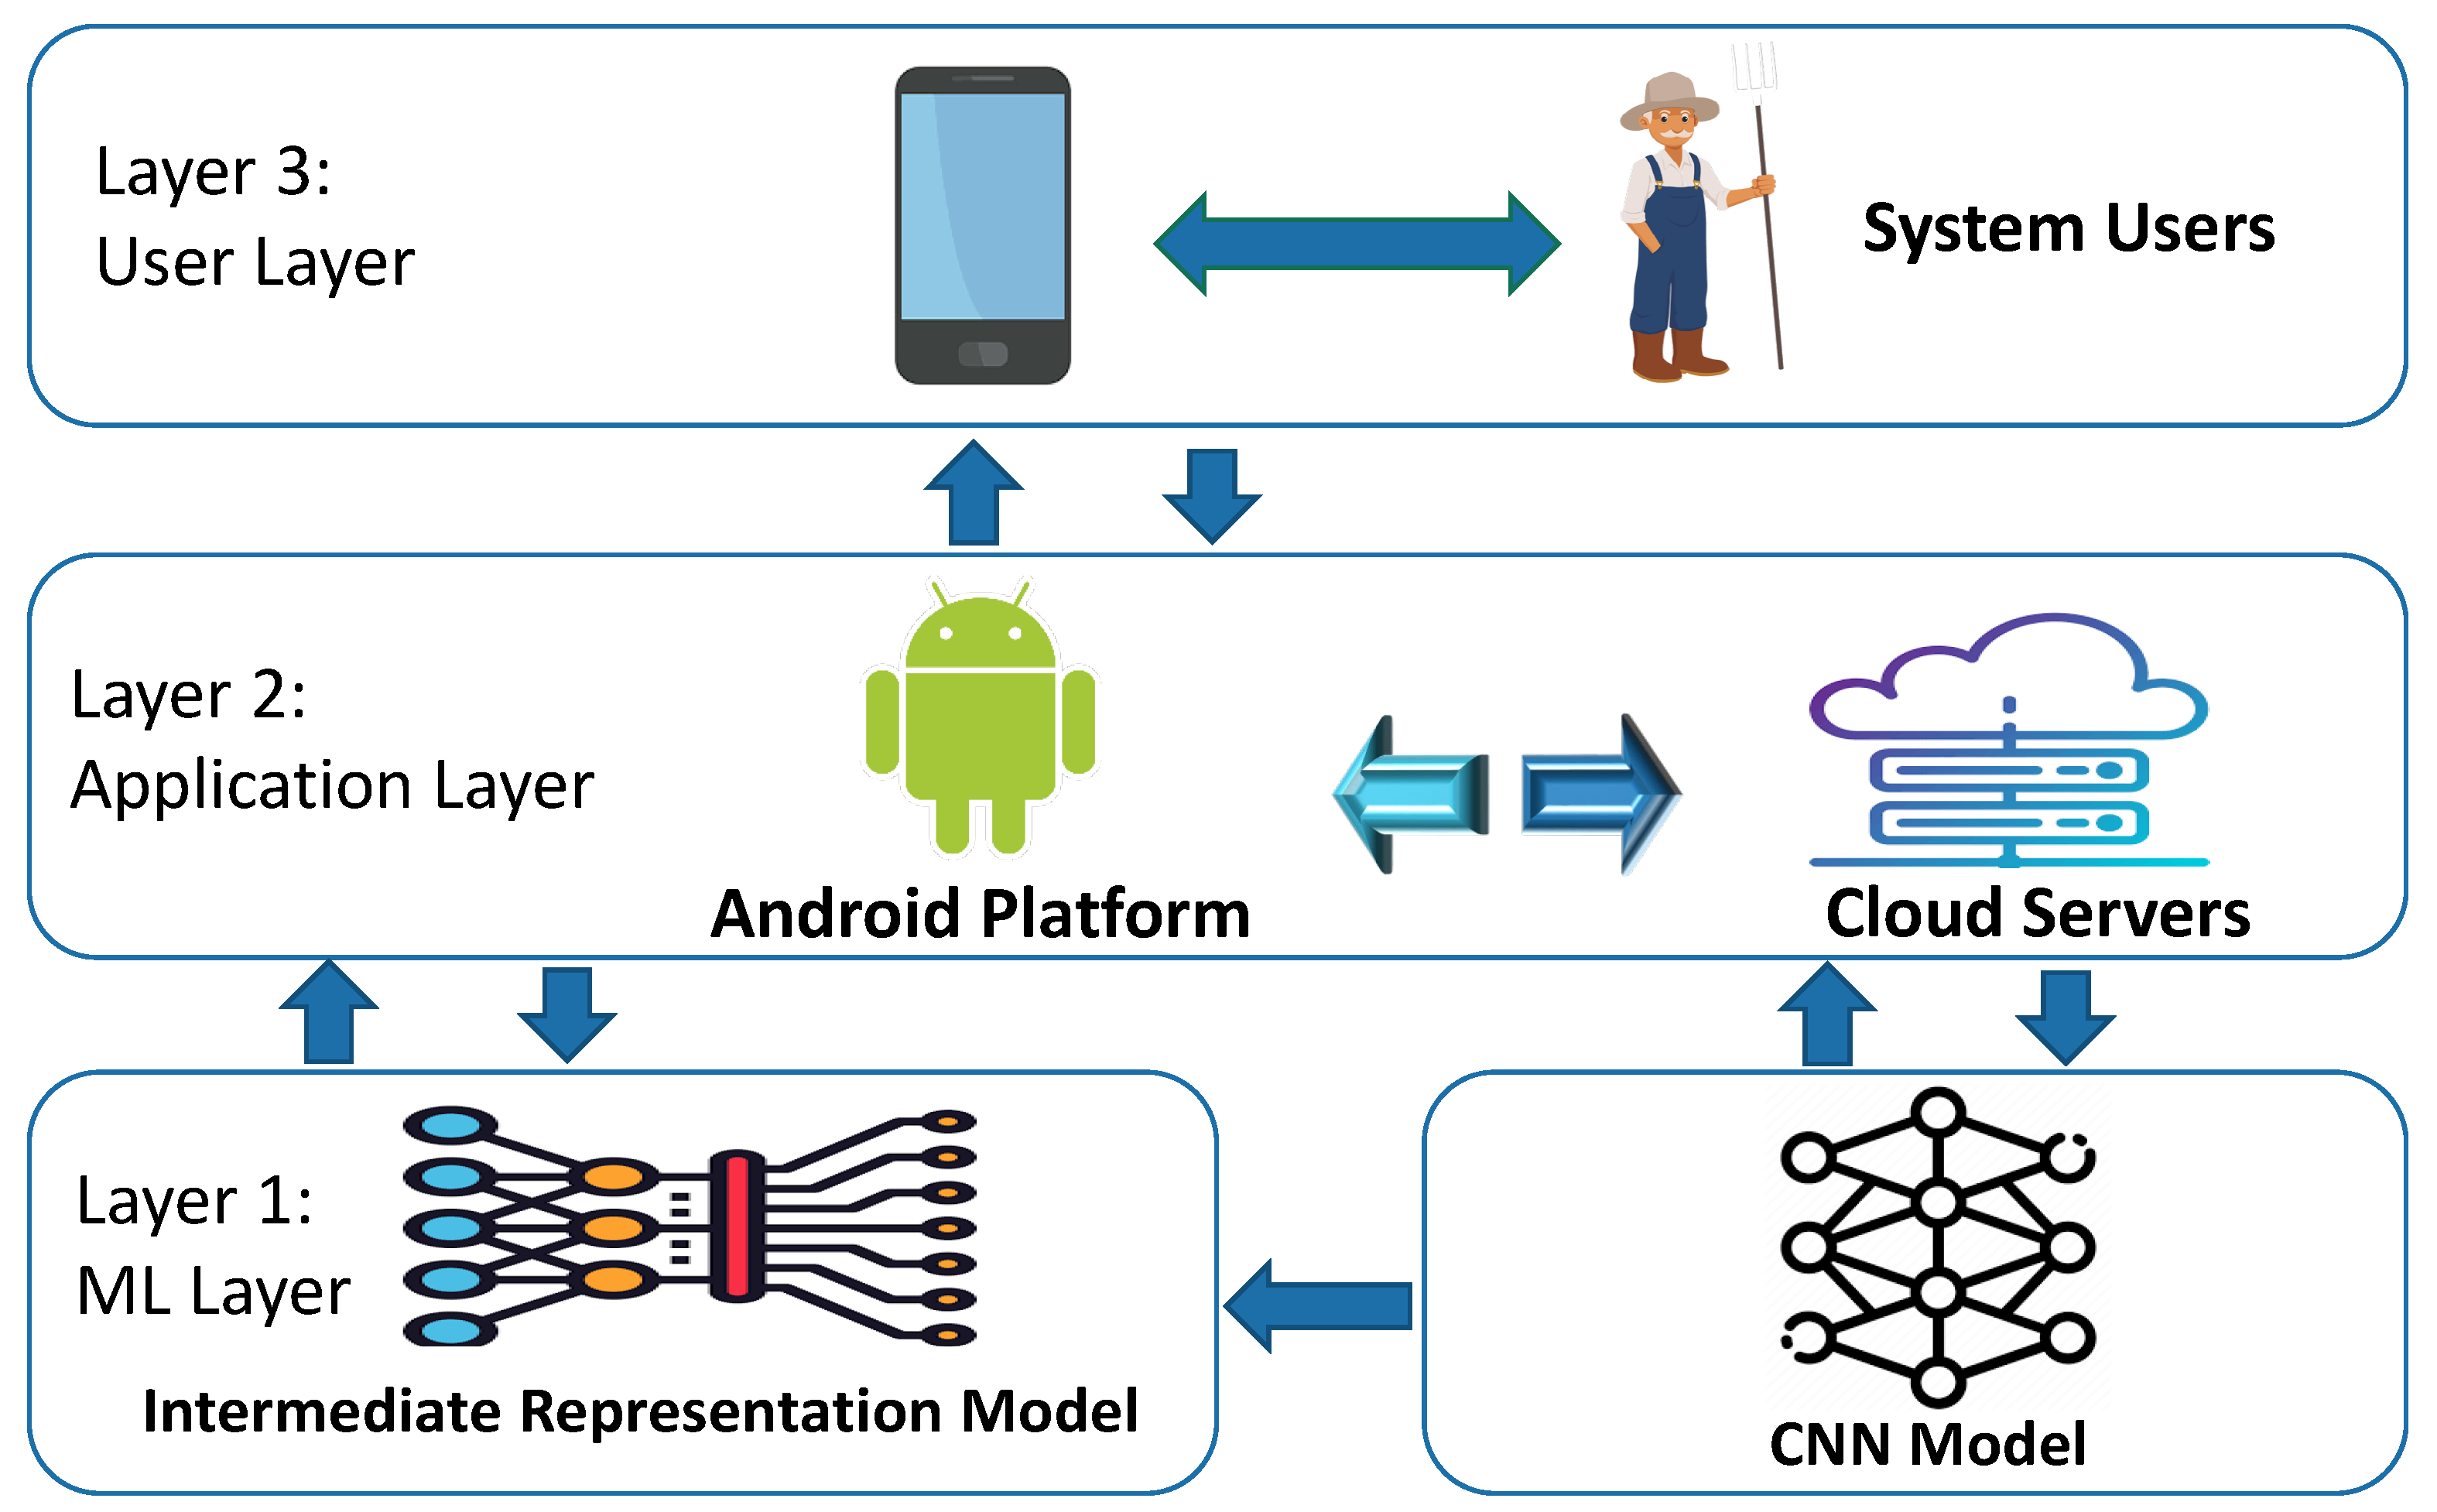
As illustrated in Figure 2, the distributed run-time system for the plant disease detector is organized with parts executing on mobile devices at the user side, as well as on centralized servers at the cloud side. Layer 1 describes the deep learning model used in the system (i.e., CNN) and the Intermediate Representation (IR) model that runs on the mobile device. Layer 2 illustrates the user interface, which is developed as an Android app to enable systems users (shown in layer 3) to interact with the system conveniently.
3.1. CNN Structure
We trained a CNN model with 2 convolutional layers, one input layer and one output layer. and represent the input and output vectors, respectively, where r represents the number of elements in the input feature set and h is the number of classes. The main objective of the network is to learn a compressed representation of the dataset. In other words, it tries to approximately learns the identity function F, which is defined as:
where W and B are the whole network weights and biases vectors.
A log sigmoid function is selected as the activation function f in the hidden and output neurons. The log sigmoid function s is a special case of the logistic function in the t space, which is defined by the formula:
The weights of the CNN network create the decision boundaries in the feature space, and the resulting discriminating surfaces can classify complex boundaries. During the training process, these weights are adapted for each new training image. In general, feeding the CNN model with more images can recognize the plant diseases more accurately. We used the back-propagation algorithm, which has a linear time computational complexity, for training the CNN model.
The input value going into a node i in the network is calculated by the weighted sum of outputs from all nodes connected to it, as follows:
where is the weight on the connections between neuron j to i; is the output value of neuron j; and is a threshold value for neuron i, which represents a baseline input to neuron i in the absence of any other inputs. If the value of is negative, it is tagged as inhibitory value and excluded because it decreases net input.
The training algorithm involves two phases: forward and backward phases. During the forward phase, the network’s weights are kept fixed, and the input data is propagated through the network layer by layer. The forward phase is concluded when the error signal computations converge as follows:
where and are the desired (target) and actual outputs of ith training image, respectively.
In the backward phase, the error signal is propagated through the network in the backward direction. During this phase, error adjustments are applied to the CNN network’s weights for minimizing .
We used the gradient descent first-order iterative optimization algorithm to calculate the change of each neuron weight , which is defined as follows:
where is the intermediate output of the previous neuron n, is the learning rate, and is the error signal in the entire output. is calculated as follows:
The CNN network has two types of layers: convolution and pooling. Each layer has a group of specialized neurons that perform one of these operations. The convolution operation means detecting the visual features of objects in the input image such as edges, lines, color drops, etc. The pooling process helps the CNN network to avoid learning irrelevant features of objects by focusing only on learning the essential ones. The pooling operation is applied to the output of the convolutional layers to downsampling the generated feature maps by summarizing the features into patches. Two common pooling methods are used: average-pooling and max-pooling. In this paper, we used the max-pooling method, which calculates the maximum value for each patch of the feature map as the dominant feature.
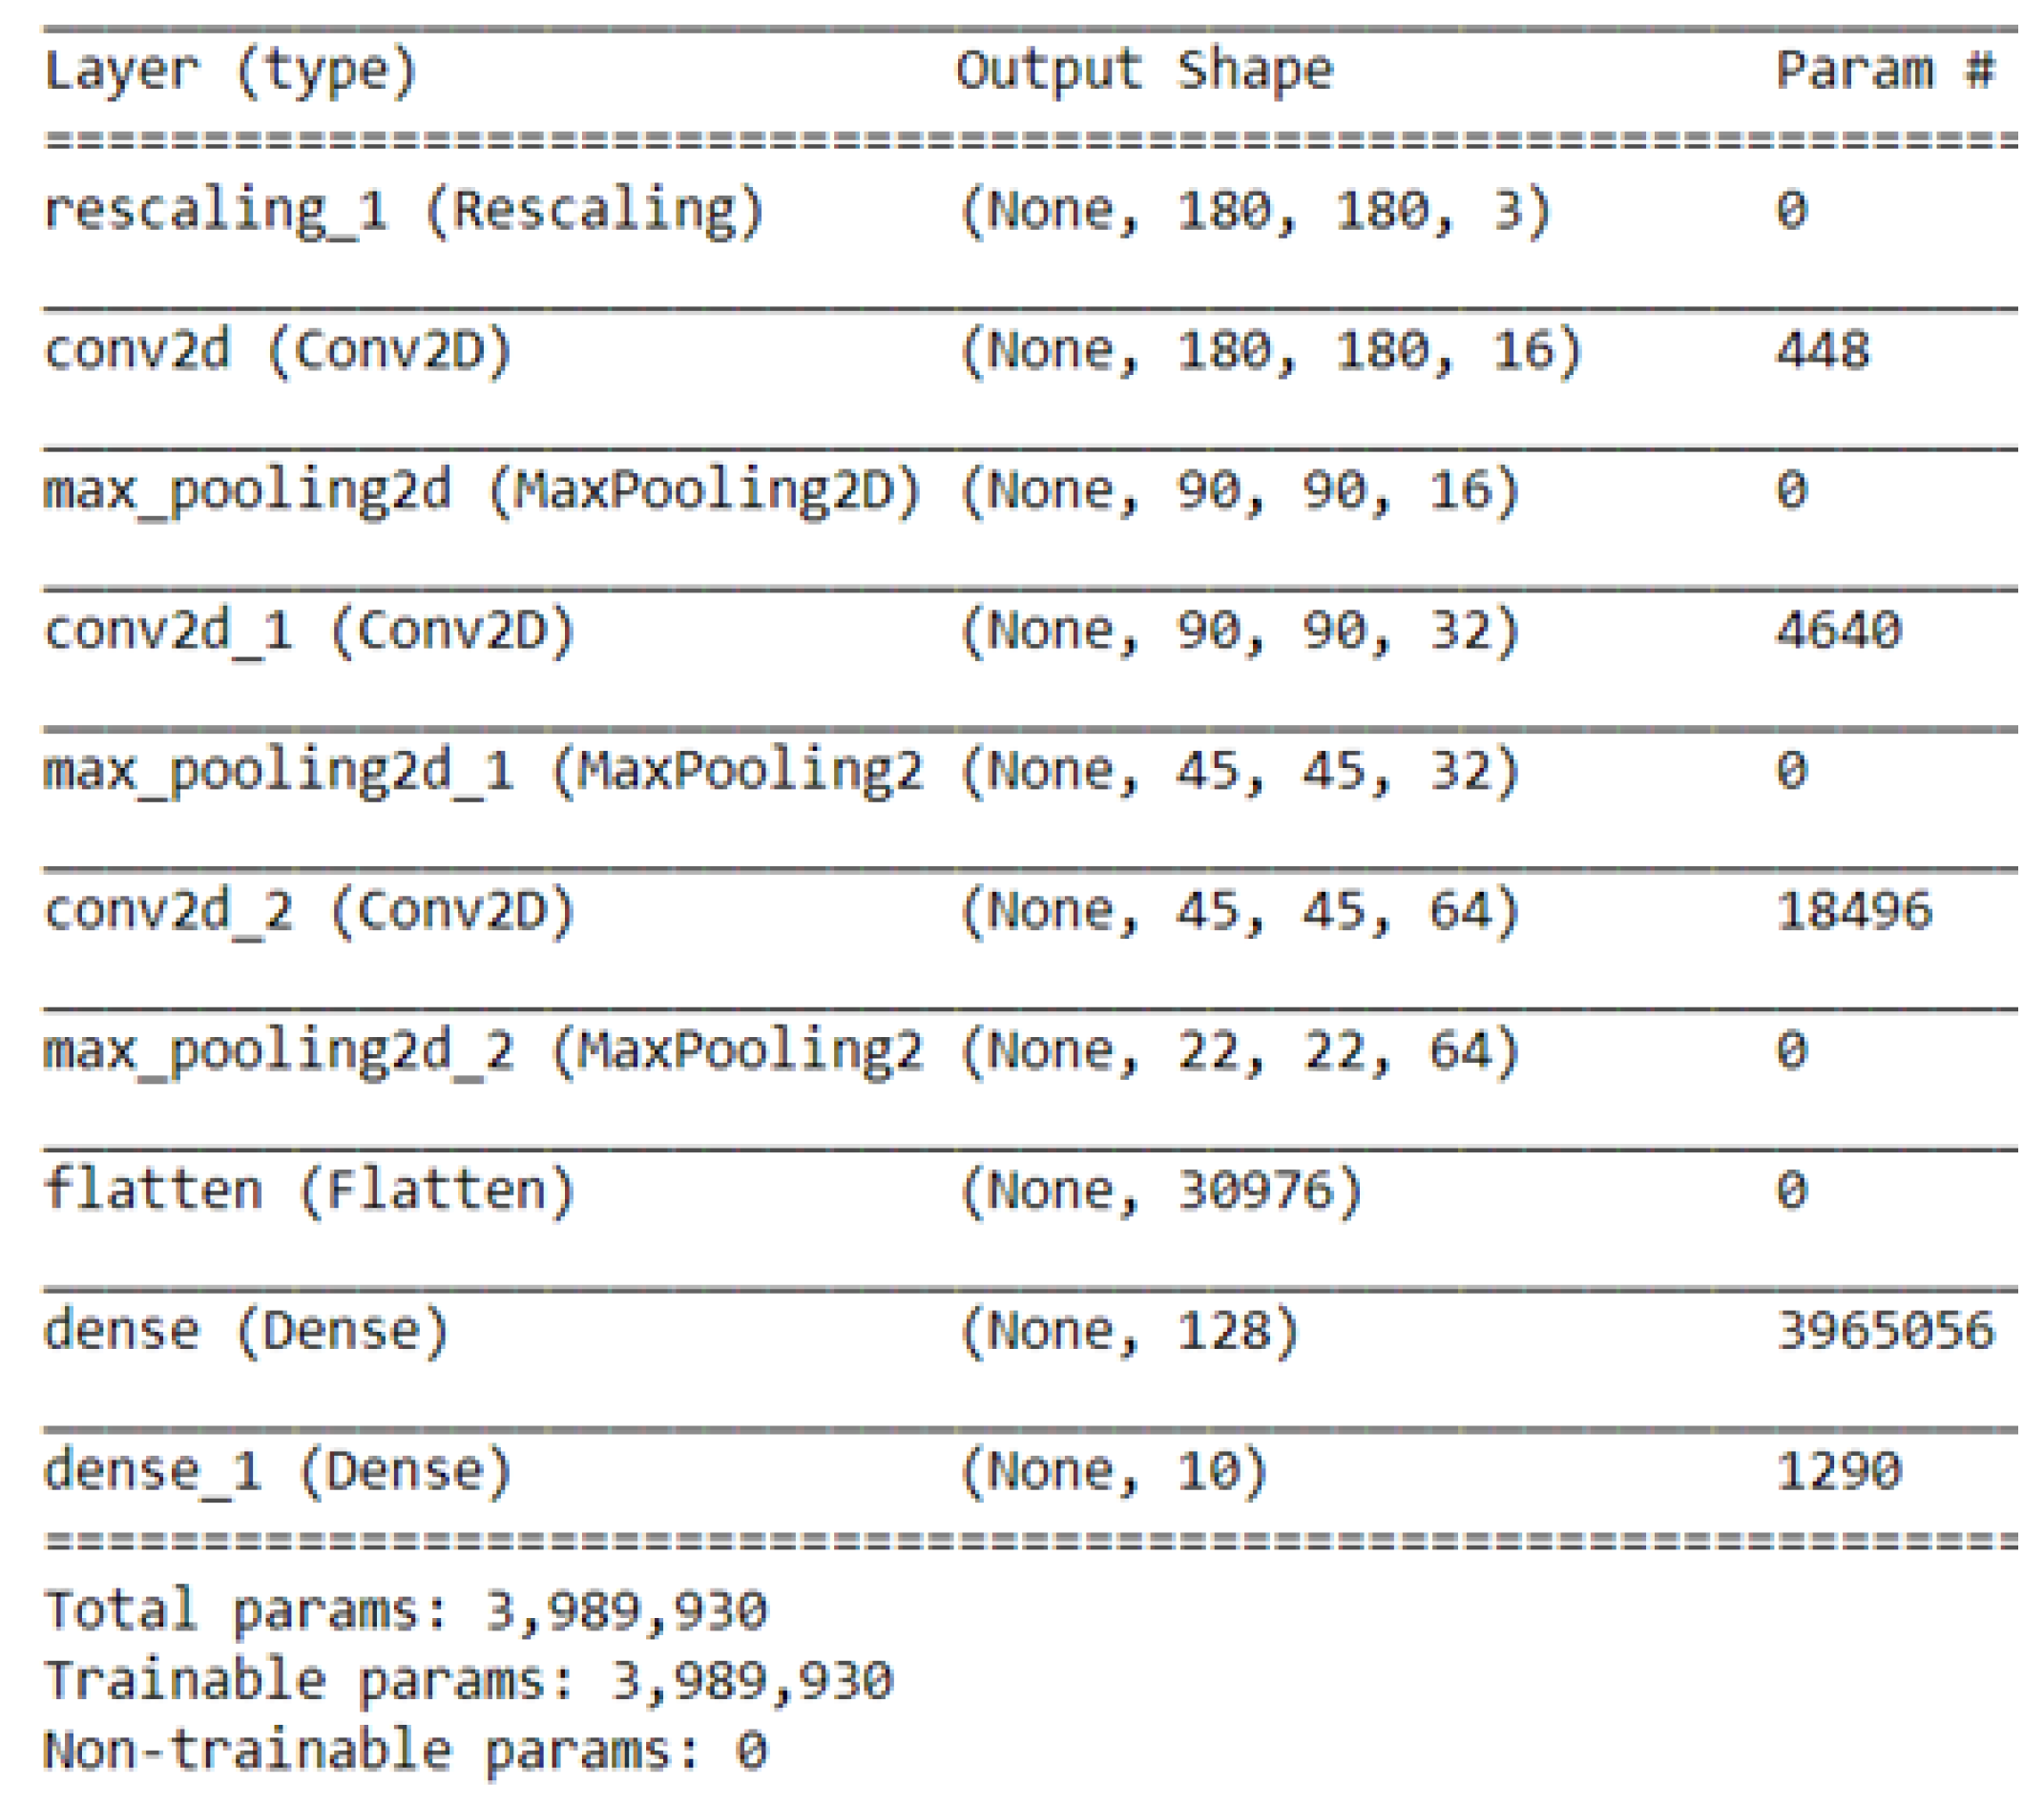
As shown in Figure 3, the output of every Conv2D and MaxPooling2D layer is a 3D form tensor (height, width, channels). The width and height dimensions tend to shrink as we go deeper into the network. The third argument (e.g., 16, 32 or 64) controls the number of output channels for each Conv2D layer. During the training phase, the CNN model generated around 4 million trainable parameters.
Before moving the trained CNN model to the mobile device, we converted it into an optimized IR model based on the trained network topology, weights, and biases values. We used the Intel OpenVINO toolkit [16] to generate the IR model, which is the only format that the inference engine on the Android platform accepts and understands. The conversion process involved removing the convolution and pooling layers that are not relevant to the mobile device’s inference engine. In particular, OpenVINO splits the trained model into two types of files: XML and Bin extension. The XML files contain the network topology, while the BIN files contain the weights and biases binary data.
3.2. Dataset
Although standard object detection datasets (e.g., Microsoft COCO [17]) exhibit volume and variety of examples, they are not suitable for plant disease detection as they annotate a set of object categories not include plant diseases. Therefore, we collected more than labeled 96k images of healthy and infected plant leaves for training the CNN model from different sources such as Kaggle [18], Plant Village [19] and Google Web Scraper [20]. Many images in our dataset are in their natural environments because object detection is highly dependent on contextual information.
Our dataset is divided into three parts: training, validation and testing. Table 1 shows the number of images used in the three phases across the 38 disease classes in 14 crop species. The number of images in each phase is determined based on the fine-tuned hyperparameters and structure of the CNN model.
We conducted a set of controlled experiments to estimate the hyperparameters to improve the prediction accuracy and performance. In particular, we progressively tested random combinations of hyperparameter values until we achieved satisfactory results. Cross-validation optimizers were also used to find the best set of hyperparameters.
To increase the training accuracy and minimize training loss of the CNN model, we applied a series of image preprocessing transformations to the training dataset. Particularly, we altered the contrast of image colors, added Gaussian noise, and used image desaturation, which makes pixel colors more muted by adding more black and white colors. The primary purpose of these transformations is to weaken the influence of the background factor during the training process. This had a better effect on learning the 38 disease classes more effectively and increased our CNN model’s stability.
We had to normalize the range of pixel intensity values of leaf images in the dataset before training the CNN model. This step was necessary because all dimensions of feature vectors extracted from input images should be in the same intensity range. This made the convergence of our CNN model faster during the training phase. Image normalization was implemented by subtracting the input image’s mean value from each pixel’s value , and then dividing the result by the standard deviation of the input image. The distribution of the output pixel intensity values would resemble a Gaussian curve centered at zero. We used the following formula to normalize each image in our training set:
where I and O are the input and output images, respectively; and i and j are the current pixel indices to be normalized.
To avoid the overfitting issue of the CNN model, we augmented the number of images for a few disease classes that lack an insufficient training set and have a lot of background noise, such as tomato target spot, tomato septoria leaf spot, and tomato late blight. We used the geometric transformations method to eliminate the positional biases present in the training data. As shown in Figure 4, the geometric transformations applied to these classes were horizontal flipping, −45° to 45° rotation, 1.5× scaling, filling with nearest neighbor regions, zoom with range 0.2, width and height shifts with a relative scale of 0.3, and cropping some image manually.
4. Implementation
This section presents the implementation details of the plant disease detector at the cloud and mobile sides.
4.1. CNN Implementation
The CNN model is implemented using Keras development environment 2.4 [21]. Keras is an open-source neural network library written in Python, which uses TensorFlow 02 [22] as a back-end engine. Keras libraries running on top of TensorFlow make it relatively easy for developers to build and test deep learning models written in Python. For instance, we used the keras.preprocessing.image.ImageDataGenerator library to augment some images in our dataset via several geometric transformations; therefore, our model would never see twice the same image. This helps to avoid overfitting and helps the model generalize better.
The training images must have the same size before feeding them as input to the model. Our model was trained with colored (RGB) images with resized dimensions of 200 × 200 pixels. We set the batch size and number of epochs to be 150 images and 10 epochs, respectively. The model training was carried out using a server computer equipped with a 4.50 GHz Intel Core™ i7-16MB CPU processor, 16 GB of RAM, and RTX-3060 CUDA GPU 3584-cores with a base clock speed of 1320 MHz. The training phase took approximately 2 days to run 10 epochs. We took a snapshot of the trained weights every 2 epochs to monitor the progress. The training error and loss are calculated using this equation:
where M is the mean square error of the model, y is the predicted class calculated by the model, and x is the actual class. M represents the error in object detection.
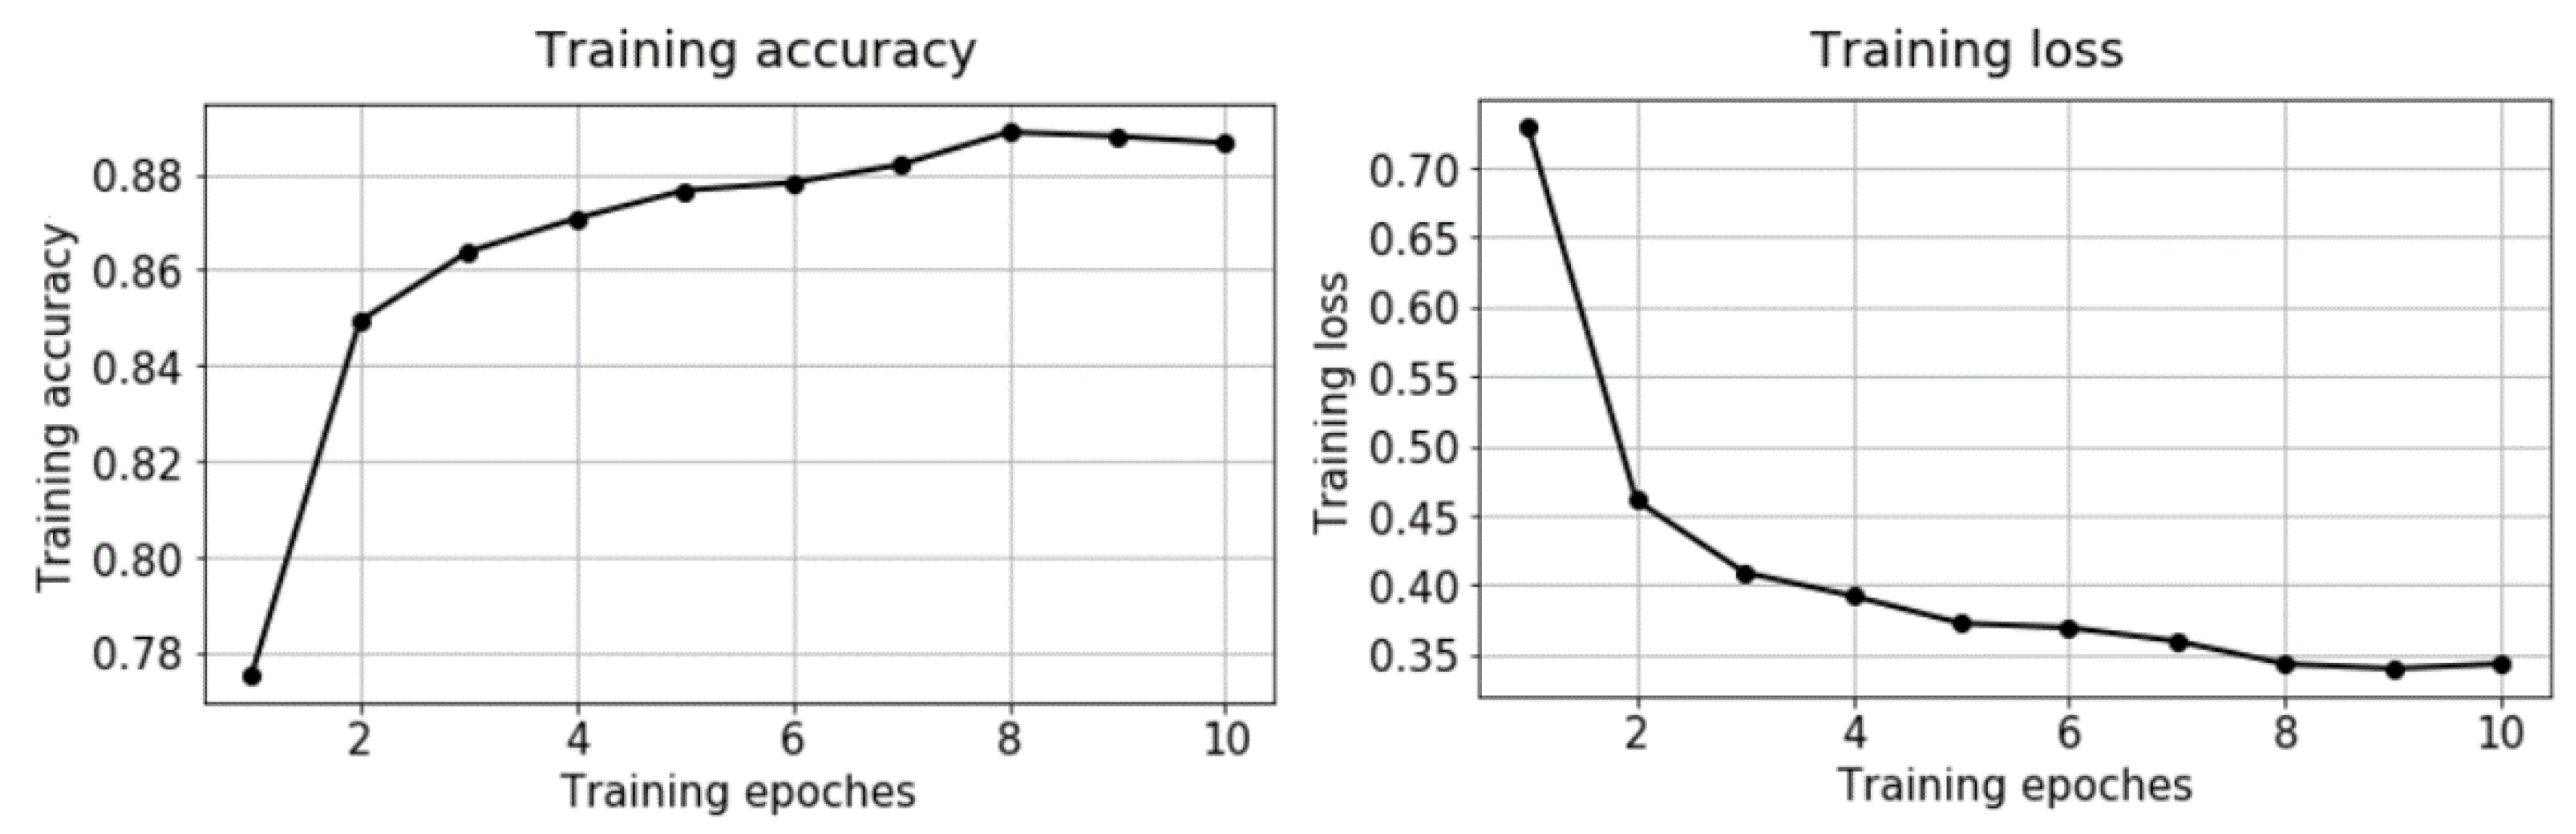
Given our plant disease detector model is considered a multi-class classification problem, where it classifies the input image as belonging to one or more of the 38 disease classes, we used the softmax activation function at the output layer cross-entropy as the loss function. Figure 5 illustrates the calculated training error and loss graphically. As shown in the figure, the mean squared error loss decreases over the ten training epochs, while the accuracy increases consistently. We can see that our model converged after the 8th epoch, which means that our dataset and the fine-tuned parameters were a good fit for the model.
4.2. Mobile App
The plant disease detector’s user interface is implemented as a self-contained mobile app developed using Kotlin Multiplatform Mobile [23]. Kotlin is a mobile framework that allowed us to write a single codebase for the system’s business logic, and then deploy it as an iOS or Android app. In this paper, we deployed the app as an Android app using the Android SDK (Software Development Kit) and XML (Extensible Markup Language) to build the front-end activities. We also built a middleware between the app and the cloud server using Python 3.9.
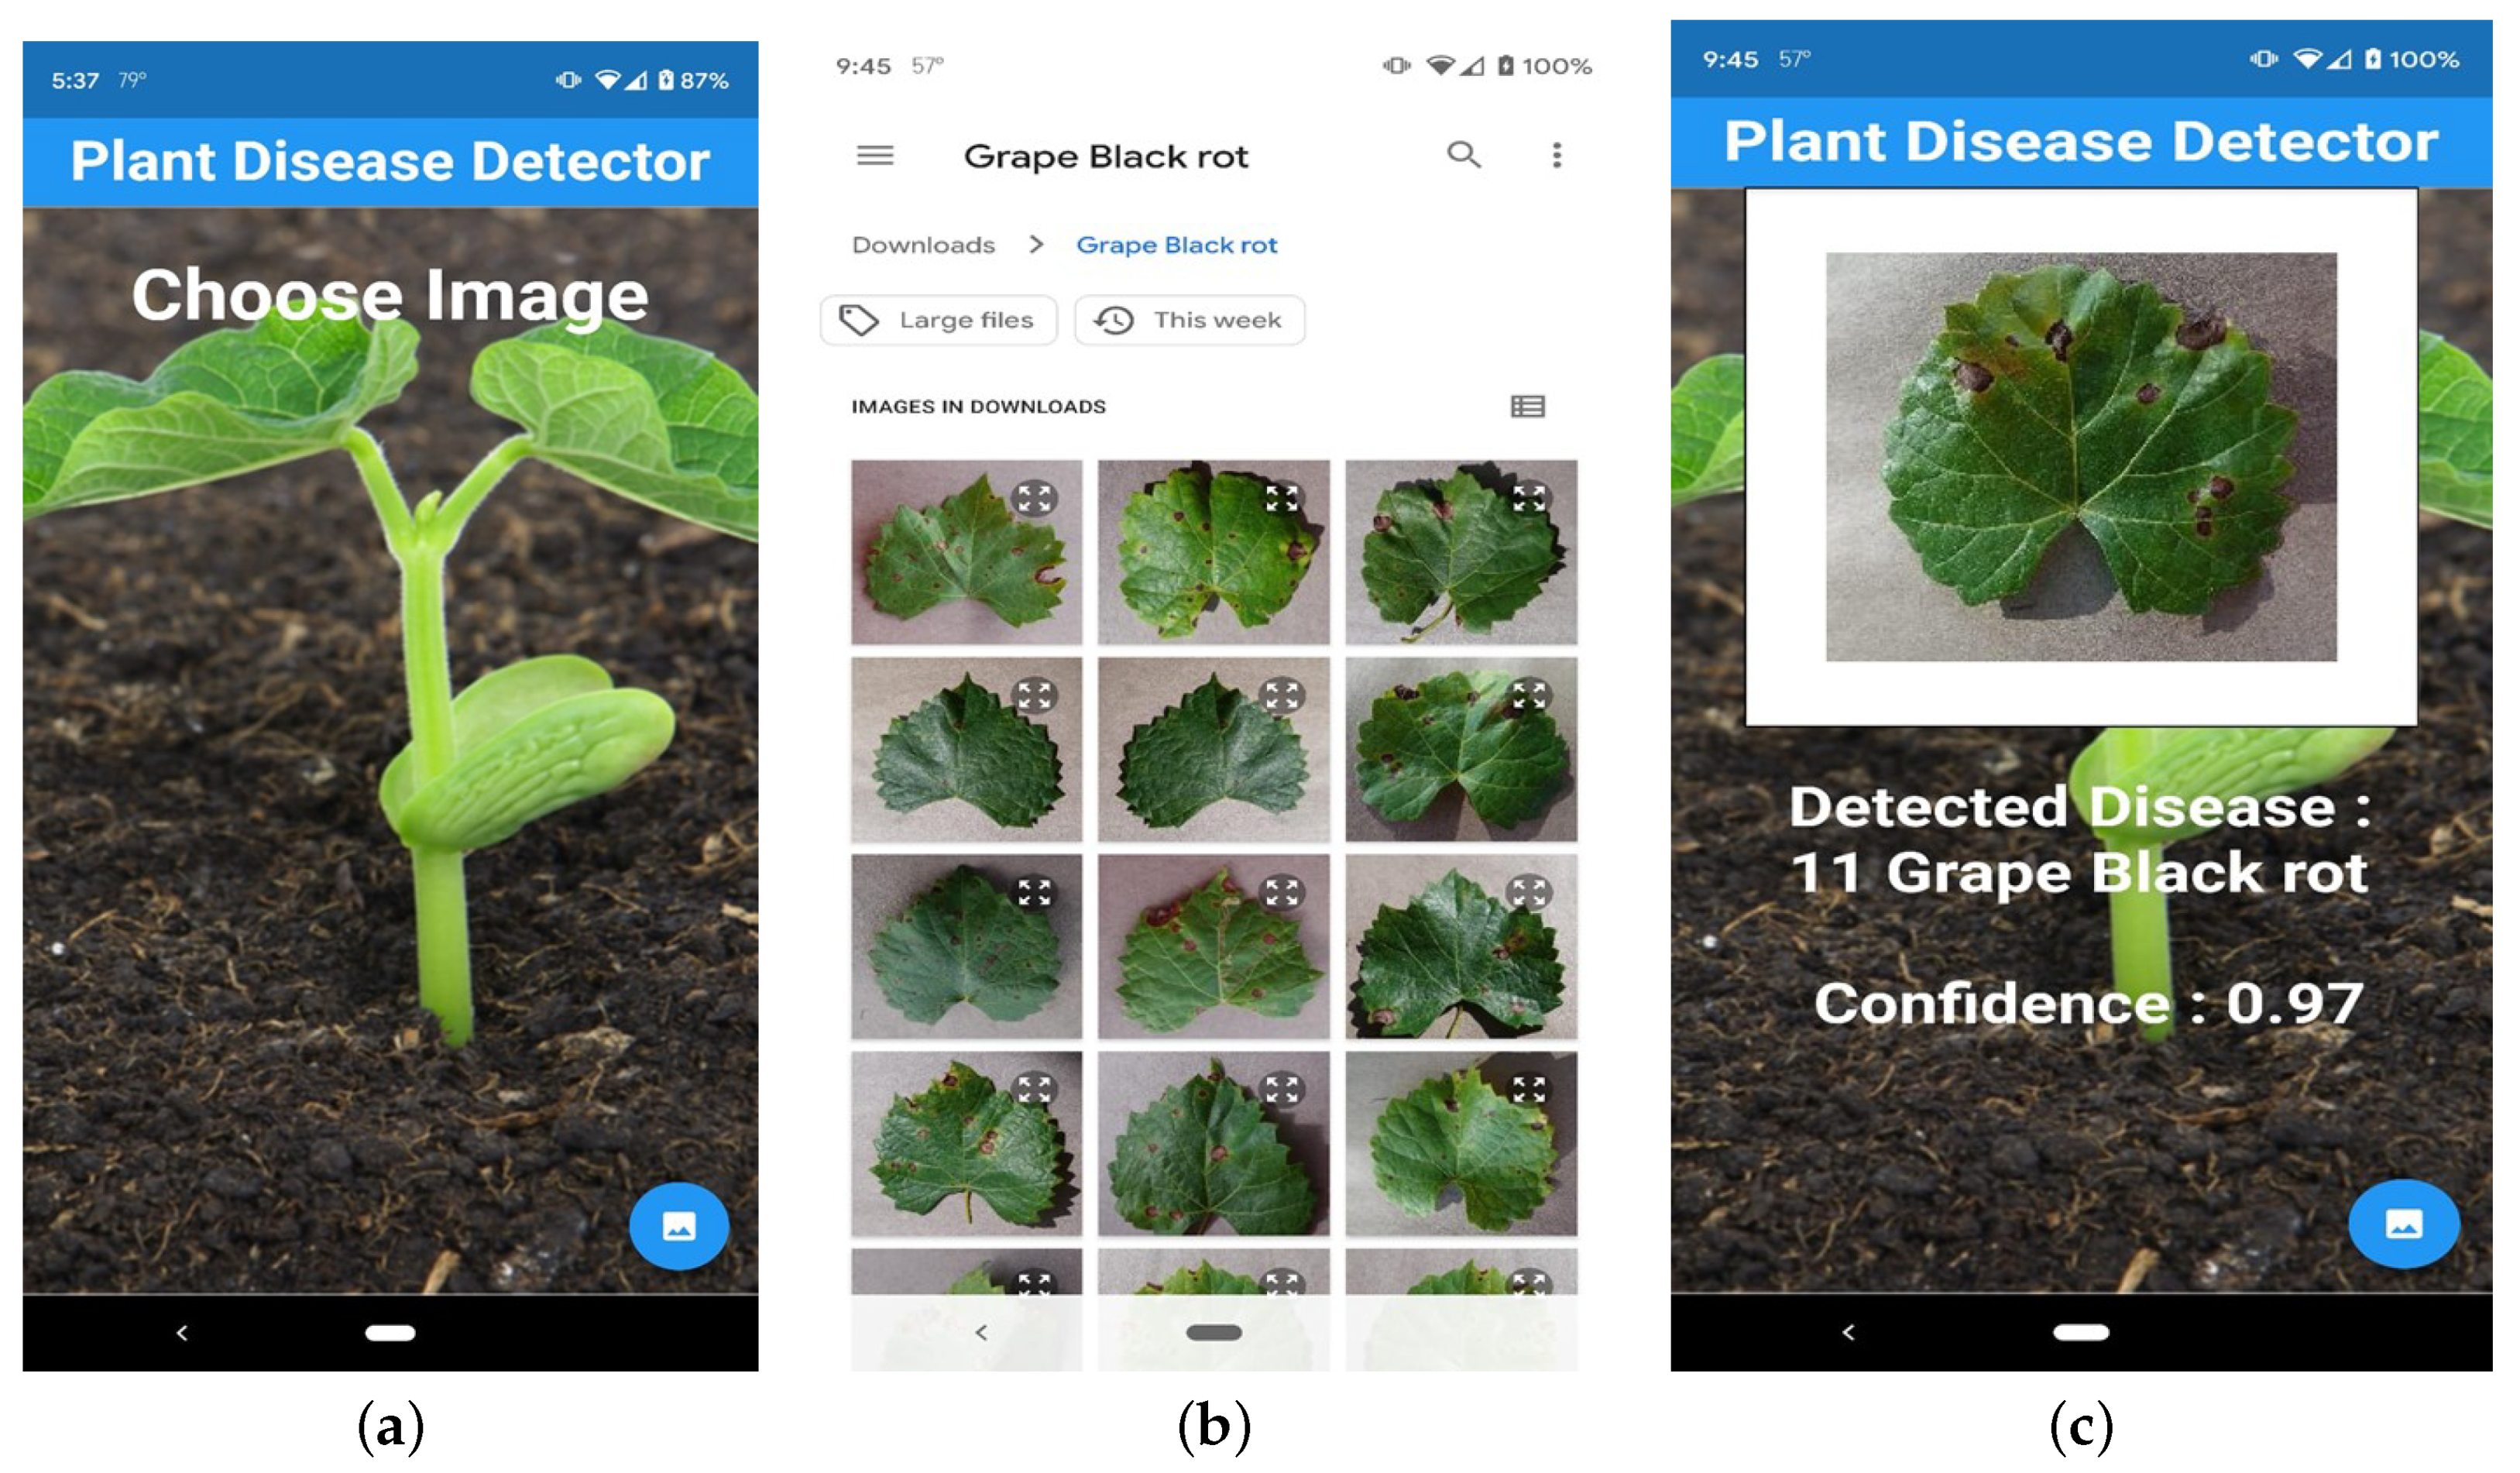
The mobile app allows farmers to capture a photo of the infected plants with proper alignment and orientation. The orientation handler, which runs as a background service thread in the mobile app, is responsible for correcting the tilt and camera angle of capturing the plant photo. Figure 6 shows some selective screenshots of the mobile app for detecting plant leaf diseases. Figure 6a shows a screenshot of the landing screen of the app, which allows farmers to either capture a photo of the diseased plant or upload an existing image on the phone (see Figure 6b).
Once the right image is captured, the app uploads it to a cloud server to detect the disease class(es) by applying our CNN model. The captured image is transferred to the cloud side via a REST (Representational State Transfer) service in the form of a JSON (JavaScript Object Notation) image object. Figure 6b illustrates an example of the inference result of the CNN model on the mobile app. The CNN model classified the grape black rot disease correctly with a confidence score of 97%. The operations of class prediction and displaying results took around 0.88 seconds, including the communication overheads. This shows that our system can be used as a plant disease detector in real-time at the edge.
5. Experimental Evaluation
We experimentally evaluated our prototype implementation regarding classification accuracy and performance. We installed instrumentation in the mobile app running on a smartphone to measure the processor time taken to perform various tasks, including photo capturing, image preprocessing, and disease recognition processes. Each experiment presented in this section is carried out for ten trials, then we took the average of these trials’ results.
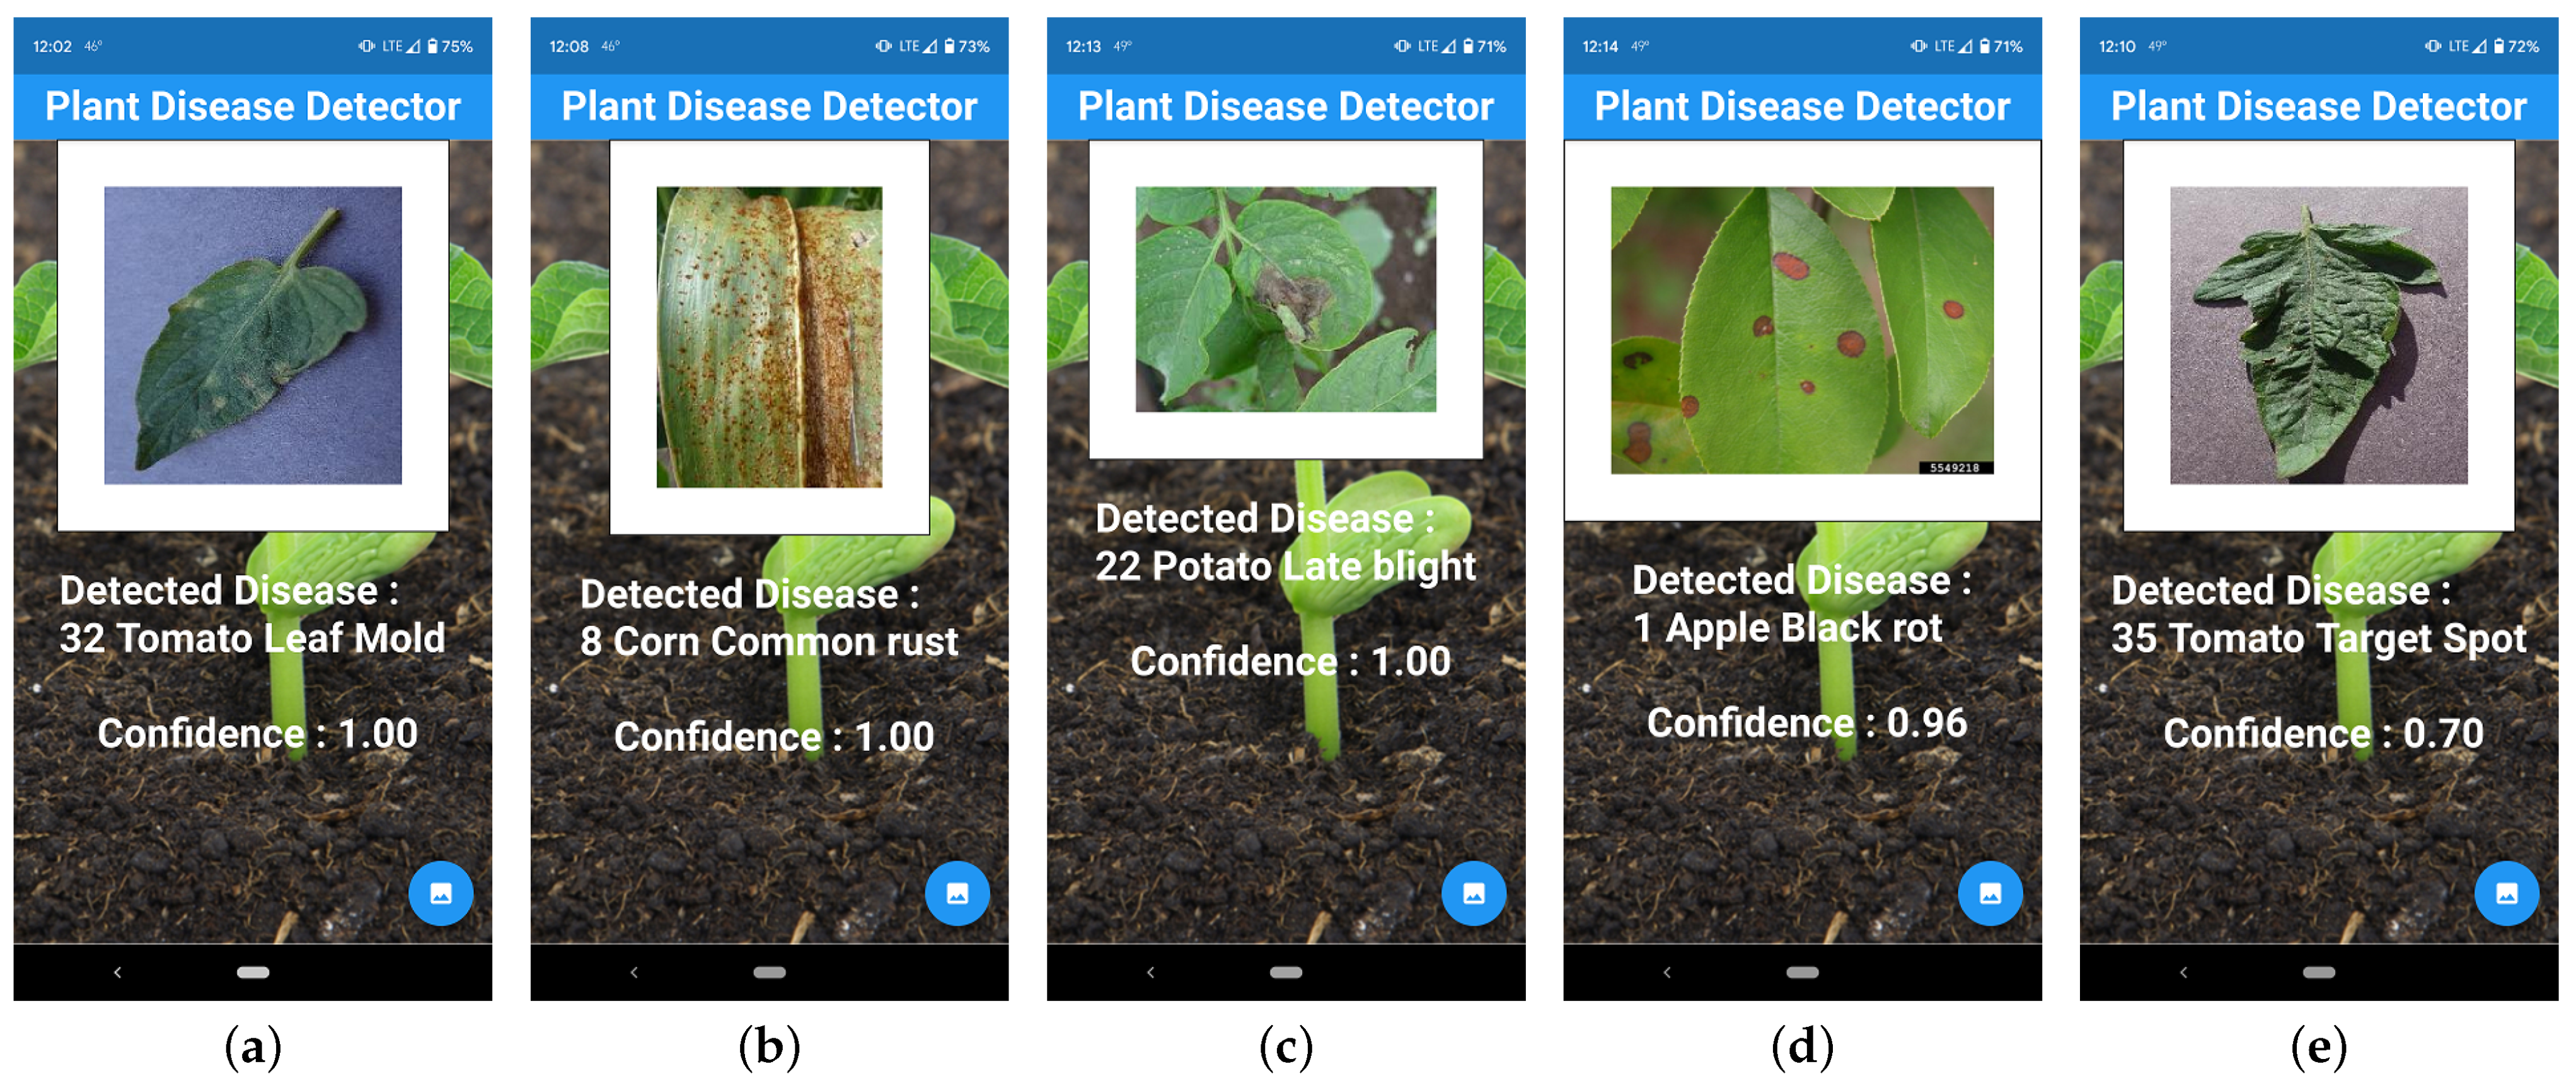
For classification accuracy, we observed that our system delivers good results in natural conditions even when the plant images are captures from different distances from the camera, orientations, and illumination conditions. Figure 7 shows some samples of the successful recognition of varying plant leaf diseases. Figure 7a through Figure 7d illustrate that our disease detector achieves a high classification rate for most of the classes in our testing dataset. However, sometimes the system fails to achieve such high confidence levels for some classes, such as some tomato diseases. For instance, Figure 7e illustrates an example of a 70% confidence ratio for detecting the tomato target spot disease. This may be justified by the lack of an insufficient training set or the existence of background noise for that particular class.
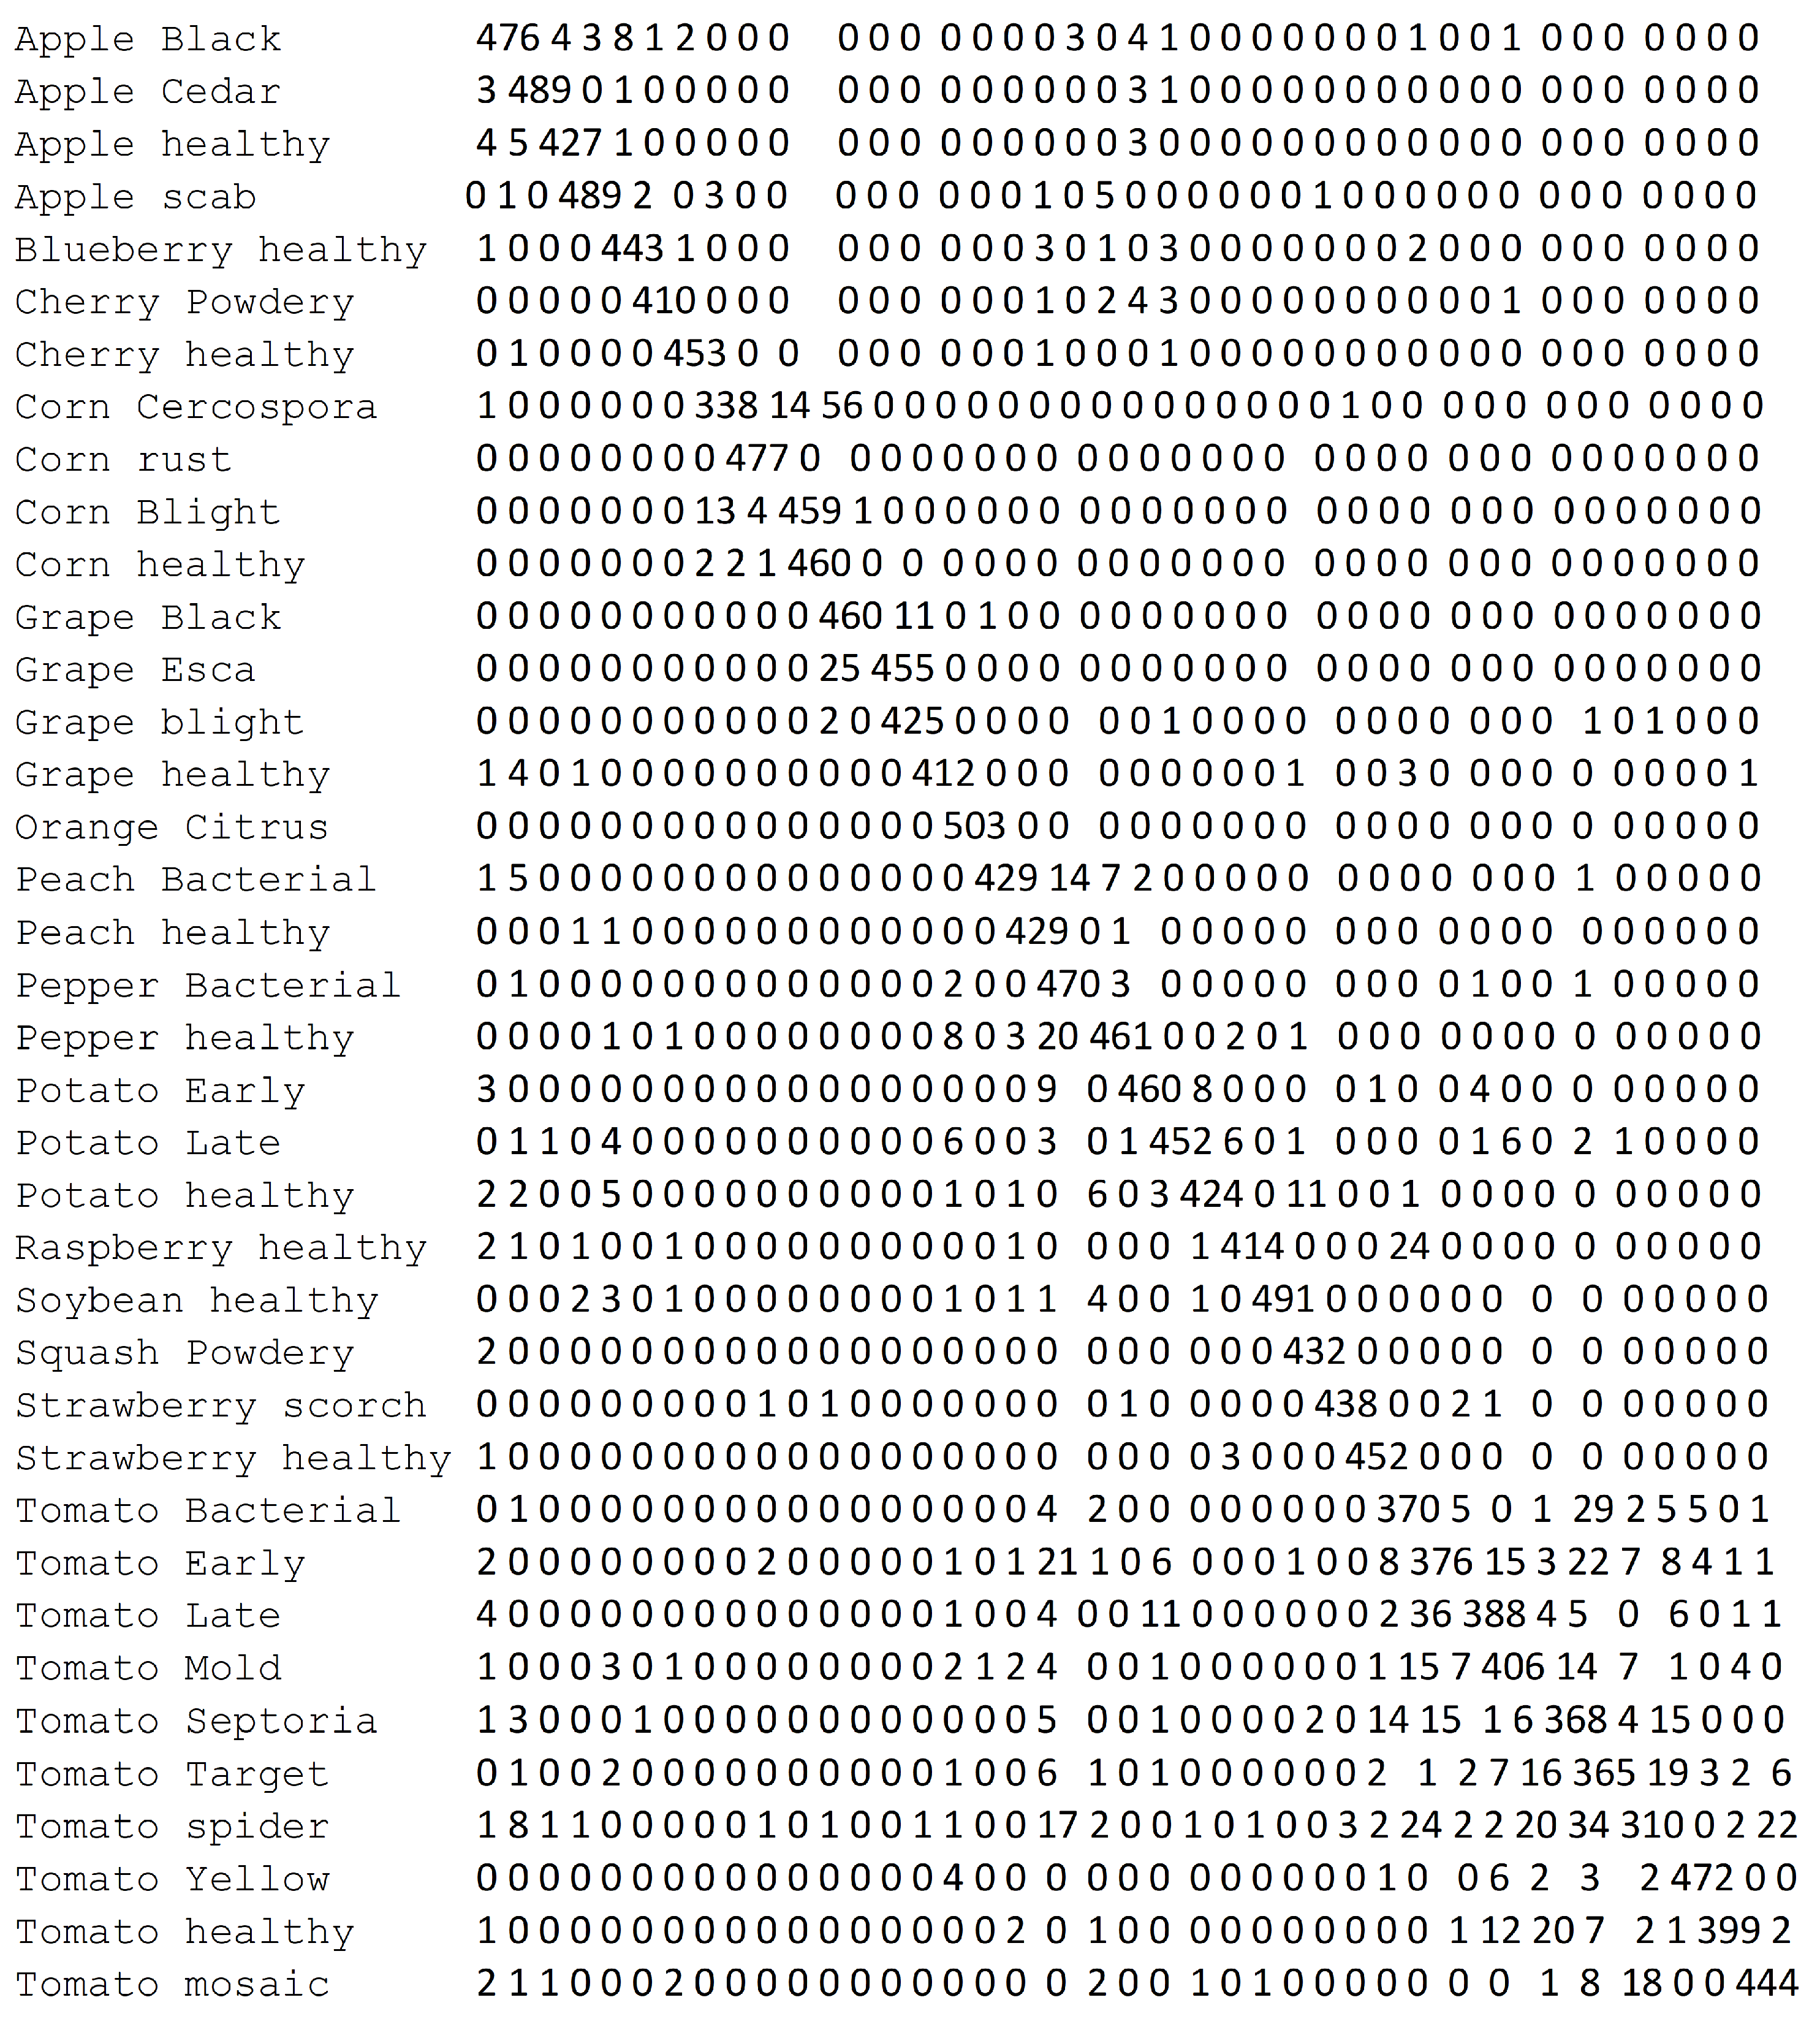
Figure 8 shows the confusion matrix for the CNN model that gives a detailed analysis of how the model performance changes for different disease classes. The matrix rows represent the actual (true) disease classes, and the columns correspond to the predicted classes. The diagonal cells show the proportion of the correct predictions of our CNN model, whereas the off-diagonal cells illustrate the error rate of our model.
The confusion matrix demonstrates that our model, in most cases, can differentiate between the disease classes and achieve high levels of prediction accuracy. For the three most common types of crop diseases, blight, scab and rot, the model achieves accuracies above 96%, 98% and 97% for corn blight, apple scab and grape black rot, respectively. We also noticed that the disease classes caused by fungi (e.g., rust and rot) appear easier to identify than the ones caused by bacteria (e.g., blight and scab) and viruses (e.g., mosaic and leaf curl). This seems to make sense as fungal diseases cause pronounced symptoms on the plant leaves that appear easier to identify than those with mild symptoms caused by bacterial and viral infections.
As shown in the confusion matrix, our model, in some cases, confuses between tomato and potato diseases because they have similar leaf phenology. A similar situation happens between the diseases within the same species (e.g., tomato diseases) as they share some common plant physiognomy attributes such as color, size and canopy structure. Note that the CNN model can still identify corn diseases quite well because of its discriminative features compared to the other classes in our dataset. Most notably, although blueberry and cherry plants are considered non-linearly separable classes because of their similar physiognomy properties, our model was able to separate them effectively.
The precision, recall and F1-score ratios, shown in Table 2, summarizes the trade-off between the true-positive rate and the positive predictive value for our CNN model using different probability thresholds. Precision represents the positive predictive value of our model, while recall is a measure of how many true positives are identified correctly, and F1-score takes into account the number of false positives and false negatives. As shown in the table, most of the precision vs. recall values tilts towards 1.0, which means that our CNN model achieves high accuracy while minimizing the number of false negatives.
The precision ratio describes the performance of our model at predicting the positive class. It is calculated by dividing the number of true positives by the sum of the true positives and false positives, as follows:
The recall ratio is calculated as the ratio of the number of true positives divided by the sum of the true positives and the false negatives, as follows:
F1-score ratio is calculated by a weighted average of both precision and recall, as follows:
Table 3 shows the classification accuracy and prediction time across the 38 disease classes. The CNN model achieved an overall average classification accuracy of 93.6%. The average prediction time of the model was measured to be 0.88 s. This is evident that farmers can diagnose any plant disease in their agricultural fields using a handy mobile app in less than one second. Furthermore, we noted that the prediction accuracy of many classes (e.g., squash cherry powdery mildew, powdery mildew, etc.) was 100%. This shows that our model is robust and can operate in real-time inference in the agricultural fields with high accuracy.
6. Conclusions and Future Work
Faced with growing demands, shrinking of natural resources, and more stringent regulations, the agriculture sector worldwide found refuge in AI through the use of smart and innovative IoT technologies to optimize production and minimize losses. Crop diseases are one of the critical factors behind the crop production losses in the United States. Therefore, correct disease diagnosis is one of the most important aspects of modern agriculture. Without proper identification of the disease, disease control measures can waste money and lead to further plant losses.
This paper presented the design and implementation of an ML-powered plant disease detector that enables farmers to diagnosis the most common 38 diseases in 14 species. We trained a CNN model using an imagery dataset consisting of 96,206 photos of healthy and diseased plant leaves, where crowded backgrounds, low contrast, and diverse illumination condition images are taken into consideration. To increase the system usability, we developed a mobile app that would create a better opportunity for limited-resources farmers to detect plant diseases in their early stages and eliminate the use of incorrect fertilizers that can hurt the health of both the plants and soil.
We carried out several sets of experiments for evaluating the performance and classification accuracy of our system, paying particular attention to the classification and processing time. On average, our model could process a plant image in its natural agricultural environment using a handy mobile app in less than one second. This proves that our system is suitable for real-time inference at the network edge with high prediction accuracy and response time.
We expect that this research would increase the open-source knowledge base in the area of computer vision and machine learning on the network edge by publishing the source code and dataset to the public domain. Both the source code and dataset are available online: https://github.com/ahmed-pvamu/Agro-Disease-Detector (accessed on 29 June 2021).
In on-going work, we are looking into opportunities for generalizing our approach to be deployed locally at Unmanned Arial Vehicles (UAV), where farmers can use to monitor their crops from the sky. This would give them a richer picture of their agricultural fields and reduce the time and costs associated with crop imagery data collection. Also, this will transform this system to be generic, making it applicable to different fields requiring real-time processing and using cameras such as in the transportation field. It will be useful for supporting the sensing needs of a wide range of researches [24,25,26,27,28,29,30,31,32,33] and applications [34,35,36,37,38,39,40,41,42]. Finally, experiments with more massive datasets are needed to study the robustness of our system at a large scale, and improve the prediction accuracy of the less performing disease classes.
Author Contributions
Conceptualization, A.A.A. and G.H.R.; methodology, A.A.A.; software, G.H.R.; validation, A.A.A. and G.H.R.; formal analysis, A.A.A.; investigation, A.A.A. and G.H.R.; resources, A.A.A.; data curation, G.H.R.; writing—original draft preparation, A.A.A. and G.H.R.; writing—review and editing, A.A.A.; visualization, G.H.R.; supervision, A.A.A.; project administration, A.A.A.; funding acquisition, A.A.A. All authors have read and agreed to the published version of the manuscript.
Funding
This research work is supported in part by the National Science Foundation (NSF) under grant # 2011330. Any opinions, findings, and conclusions expressed in this paper are those of the authors and do not necessarily reflect NSF’s views.
Institutional Review Board Statement
Not applicable.
Informed Consent Statement
Not applicable.
Data Availability Statement
The data and source code that support the findings of this study are openly available at: https://github.com/ahmed-pvamu/Agro-Disease-Detector (accessed on 29 June 2021).
Conflicts of Interest
The authors declare no conflict of interest.
References
- Sinha, A.; Shekhawat, R.S. Review of image processing approaches for detecting plant diseases. IET Image Process. 2020, 14, 27–39. [Google Scholar] [CrossRef]
- Ai, Y.; Sun, C.; Tie, J.; Cai, X. Research on recognition model of crop diseases and insect pests based on deep learning in harsh environments. IEEE Access 2020, 8, 686–693. [Google Scholar] [CrossRef]
- Zeng, Q.; Ma, X.; Cheng, B.; Zhou, E.; Pang, W. Gans-based data augmentation for citrus disease severity detection using deep learning. IEEE Access 2020, 8, 882–891. [Google Scholar] [CrossRef]
- Thomas, S.; Thomas, S.; Kuska, M.T.; Bohnenkamp, D.; Brugger, A.; Alisaac, E.; Wahabzada, M.; Behmann, J.; Mahlein, A.K. Benefits of hyperspectral imaging for plant disease detection and plant protection: A technical perspective. J. Plant Dis. Prot. 2018, 125, 5–20. [Google Scholar] [CrossRef]
- Crop Protection Network. 2021. Available online: https://cropprotectionnetwork.org/ (accessed on 25 June 2021).
- Jiang, P.; Chen, Y.; Liu, B.; He, D.; Liang, C. Real-time detection of apple leaf diseases using deep learning approach based on improved convolutional neural networks. IEEE Access 2019, 7, 69–80. [Google Scholar] [CrossRef]
- Chen, W.; Lin, Y.; Ng, F.; Liu, C.; Lin, Y. Ricetalk: Rice blast detection using internet of things and artificial intelligence technologies. IEEE Internet Things J. 2020, 7, 1001–1010. [Google Scholar] [CrossRef]
- He, K.; Gkioxari, G.; Dollár, P.; Girshick, R. Mask R-CNN. In Proceedings of the IEEE International Conference on Computer Vision, ser. ICCV ’17, Venice, Italy, 22–29 October 2017; pp. 2980–2988. [Google Scholar]
- Ahmed, A.A.; Omari, S.A.; Awal, R.; Fares, A.; Chouikha, M. A distributed system for supporting smart irrigation using iot technology. Eng. Rep. 2020, 1–13. [Google Scholar] [CrossRef]
- Sun, J.; Yang, Y.; He, X.; Wu, X. Northern maize leaf blight detection under complex field environment based on deep learning. IEEE Access 2020, 8, 79–688. [Google Scholar] [CrossRef]
- Su, J.; Yi, D.; Su, B.; Mi, Z.; Liu, C.; Hu, X.; Xu, X.; Guo, L.; Chen, W.H. Aerial visual perception in smart farming: Field study of wheat yellow rust monitoring. IEEE Trans. Ind. Inf. 2021, 17, 42–49. [Google Scholar] [CrossRef] [Green Version]
- Krizhevsky, A.; Sutskever, I.; Hinton, G.E. Imagenet classification with deep convolutional neural networks. In Advances in Neural Information Processing Systems; Pereira, F., Burges, C.J.C., Bottou, L., Weinberger, K.Q., Eds.; Association for Computing Machinery: New York, NY, USA, 2012; Volume 25, pp. 1097–1105. [Google Scholar]
- USDA. Plant Diseases That Threaten U.S. Agriculture. 2021. Available online: https://www.ars.usda.gov/crop-production-and-protection/plant-diseases/docs/npdrs/ (accessed on 25 June 2021).
- Government of Western Australia: Pests and Weeds Diseases. 2021. Available online: https://www.agric.wa.gov.au/pests-weeds-diseases/diseases/ (accessed on 25 June 2021).
- Ramcharan, A.; McCloskey, P.; Baranowski, E.A.K. A mobile-based deep learning model for cassava disease diagnosis. Front. Plant Sci. 2019, 10, 1–8. [Google Scholar] [CrossRef] [PubMed] [Green Version]
- Openvino: A Toolkit for Optimizing Deep Learning Models. 2021. Available online: https://software.intel.com/content/www/us/en/develop/tools/openvino-toolkit.html (accessed on 25 June 2021).
- Lin, T.; Maire, M.; Belongie, S.J.; Bourdev, L.D.; Girshick, R.B.; Hays, J.; Perona, P.; Ramanan, D.; Dollár, P.; Zitnick, C.L. Microsoft COCO: Common objects in context. In European Conference on Computer Vision; Springer: Cham, Switzerland, 2014. [Google Scholar]
- Kaggle: Machine Learning and Data Science Community. 2021. Available online: https://www.kaggle.com/ (accessed on 25 June 2021).
- Hughes, D.P.; Salathe, M. An open access repository of images on plant health to enable the development of mobile disease diagnostics. Comput. Soc. 2016, 11, 1–13. [Google Scholar]
- Google Web Scraper. 2021. Available online: https://chrome.google.com/webstore/detail/web-scraper/jnhgnonknehpejjnehehllkliplmbmhn?hl=en (accessed on 25 June 2021).
- Keras: A Python Deep Learning Api. 2021. Available online: https://keras.io/ (accessed on 25 June 2021).
- Tensorflow: A Machine Learning Platform. 2021. Available online: https://www.tensorflow.org/ (accessed on 25 June 2021).
- Kotlin: A Multiplatform Mobile Framework. 2021. Available online: https://kotlinlang.org/lp/mobile/ (accessed on 25 June 2021).
- Moamen, A.A.; Nadeem, J. ModeSens: An approach for multi-modal mobile sensing. In Proceedings of the 2015 ACM SIGPLAN International Conference on Systems, Programming, Languages and Applications: Software for Humanity, ser. SPLASH Companion 2015, Pittsburgh, PA, USA, 25–30 October 2015; pp. 40–41. [Google Scholar]
- Abdelmoamen, A. A modular approach to programming multi-modal sensing applications. In Proceedings of the IEEE International Conference on Cognitive Computing, ser. ICCC ’18, San Francisco, CA, USA, 2–7 July 2018; pp. 91–98. [Google Scholar]
- Moamen, A.A.; Jamali, N. An actor-based approach to coordinating crowd-sourced services. Int. J. Serv. Comput. 2014, 2, 43–55. [Google Scholar] [CrossRef]
- Moamen, A.A.; Jamali, N. CSSWare: A middleware for scalable mobile crowd-sourced services. In Proceedings of the MobiCASE, Berlin, Germany, 12–13 November 2015; pp. 181–199. [Google Scholar]
- Moamen, A.A.; Jamali, N. Supporting resource bounded multitenancy in akka. In Proceedings of the ACM SIGPLAN International Conference on Systems, Programming, Languages and Applications: Software for Humanity (SPLASH Companion 2016), Amsterdam, The Netherlands, 30 October–4 November 2016; pp. 33–34. [Google Scholar]
- Moamen, A.A.; Wang, D.; Jamali, N. Supporting resource control for actor systems in akka. In Proceedings of the International Conference on Distributed Computing Systems (ICDCS 2017), Atlanta, GA, USA, 5–8 June 2017; pp. 1–4. [Google Scholar]
- Abdelmoamen, A.; Wang, D.; Jamali, N. Approaching actor-level resource control for akka. In Proceedings of the IEEE Workshop on Job Scheduling Strategies for Parallel Processing, ser. JSSPP ’18, Vancouver, BC, Canada, 25 May 2018; pp. 1–15. [Google Scholar]
- Moamen, A.M.A.; Hamza, H.S. On securing atomic operations in multicast aodv. Ad Hoc Sens. Wirel. Netw. 2015, 28, 137–159. [Google Scholar]
- Moamen, A.A.; Jamali, N. ShareSens: An approach to optimizing energy consumption of continuous mobile sensing workloads. In Proceedings of the 2015 IEEE International Conference on Mobile Services (MS’15), New York, NY, USA, 27 June–2 July 2015; pp. 89–96. [Google Scholar]
- Moamen, A.A.; Jamali, N. Opportunistic sharing of continuous mobile sensing data for energy and power conservation. IEEE Trans. Serv. Comput. 2020, 13, 503–514. [Google Scholar] [CrossRef]
- Moamen, A.A.; Jamali, N. CSSWare: An actor-based middleware for mobile crowd-sourced services. In Proceedings of the 2015 EAI International Conference on Mobile and Ubiquitous Systems: Computing, Networking and Services (Mobiquitous’15), Coimbra, Portugal, 22–24 July 2015; pp. 287–288. [Google Scholar]
- Ahmed, A.A.; Olumide, A.; Akinwa, A.; Chouikha, M. Constructing 3D maps for dynamic environments using autonomous uavs. In Proceedings of the 2019 EAI International Conference on Mobile and Ubiquitous Systems: Computing, Networking and Services (Mobiquitous’19), Houston, TX, USA, 12–14 November 2019; pp. 504–513. [Google Scholar]
- Moamen, A.A.; Jamali, N. An actor-based middleware for crowd-sourced services. EAI Endorsed Trans. Mob. Commun. Appl. 2017, 3, 1–15. [Google Scholar]
- Abdelmoamen, A.; Jamali, N. A model for representing mobile distributed sensing-based services. In Proceedings of the IEEE International Conference on Services Computing, ser. SCC’18, San Francisco, CA, USA, 2–7 July 2018; pp. 282–286. [Google Scholar]
- Ahmed, A.A. A model and middleware for composable iot services. In Proceedings of the International Conference on Internet Computing & IoT, ser. ICOMP’19, Las Vegas, NV, USA, 29 July–1 August 2019; pp. 108–114. [Google Scholar]
- Ahmed, A.A.; Eze, T. An actor-based runtime environment for heterogeneous distributed computing. In Proceedings of the International Conference on Parallel & Distributed Processing, ser. PDPTA’19, Las Vegas, NV, USA, 29 July–1 August 2019; pp. 37–43. [Google Scholar]
- Moamen, A.A.; Hamza, H.S.; Saroit, I.A. Secure multicast routing protocols in mobile ad-hoc networks. Int. J. Commun. Syst. 2014, 27, 2808–2831. [Google Scholar] [CrossRef]
- Ahmed, A.A. A privacy-preserving mobile location-based advertising system for small businesses. Eng. Rep. 2021, 1–15. [Google Scholar] [CrossRef]
- Ahmed, A.A.; Echi, M. Hawk-eye: An ai-powered threat detector for intelligent surveillance cameras. IEEE Access 2021, 9, 63283–63293. [Google Scholar] [CrossRef]
Figure 1.
Samples from our Imagery Dataset that Show Different Types of Healthy and Diseased Plant Leaves.
Figure 1.
Samples from our Imagery Dataset that Show Different Types of Healthy and Diseased Plant Leaves.

Figure 2.
System Architecture.

Figure 3.
The Structure of the CNN model.

Figure 4.
Dataset Augmentation.

Figure 5.
The Training Accuracy and Loss of the CNN Model.

Figure 6.
Screenshots of the Mobile App for Detecting Plant Leaf Diseases. (a) Landing Screen, (b) Image Selection Sceeen, (c) Inference Result of the CNN Model.
Figure 6.
Screenshots of the Mobile App for Detecting Plant Leaf Diseases. (a) Landing Screen, (b) Image Selection Sceeen, (c) Inference Result of the CNN Model.

Figure 7.
Examples of Successful Recognition of Different Plant Leaf Diseases in Natural Conditions. (a) Tomato Leaf Mold, (b) Corn Common rust, (c) Potato Late Blight, (d) Apple Black Rot, (e) Tomato Target Spot.
Figure 7.
Examples of Successful Recognition of Different Plant Leaf Diseases in Natural Conditions. (a) Tomato Leaf Mold, (b) Corn Common rust, (c) Potato Late Blight, (d) Apple Black Rot, (e) Tomato Target Spot.

Figure 8.
The Confusion matrix for the CNN Model.


Table 1.
The Number of Images used in the Training, Validation, and Testing Phases Across The Disease Classes.
Table 1.
The Number of Images used in the Training, Validation, and Testing Phases Across The Disease Classes.
| Class # | Plant Disease Classes | Training | Validation | Testing | Total |
|---|---|---|---|---|---|
| 1 | Apple scab | 2016 | 504 | 209 | 2819 |
| 2 | Apple Black rot | 1987 | 497 | 246 | 2730 |
| 3 | Apple Cedar apple rust | 1760 | 440 | 220 | 2420 |
| 4 | Apple healthy | 2008 | 502 | 187 | 2697 |
| 5 | Blueberry healthy | 1816 | 454 | 232 | 2502 |
| 6 | Cherry healthy | 1826 | 456 | 192 | 2282 |
| 7 | Cherry Powdery mildew | 1683 | 421 | 209 | 2214 |
| 8 | Corn Cercospora Gray leaf spot | 1642 | 410 | 162 | 2214 |
| 9 | Corn Common rust | 1907 | 477 | 234 | 2618 |
| 10 | Corn healthy | 1859 | 465 | 233 | 2557 |
| 11 | Corn Northern Leaf Blight | 1908 | 477 | 209 | 2594 |
| 12 | Grape Black rot | 1888 | 472 | 231 | 2591 |
| 13 | Grape Esca Black Measles | 1920 | 480 | 220 | 2620 |
| 14 | Grape healthy | 1692 | 423 | 198 | 2313 |
| 15 | Grape blight Isariopsis | 1722 | 430 | 220 | 2372 |
| 16 | Orange Citrus greening | 2010 | 503 | 253 | 2766 |
| 17 | Peach Bacterial spot | 1838 | 459 | 220 | 2517 |
| 18 | Peach healthy | 1728 | 432 | 231 | 2391 |
| 19 | Pepper bell Bacterial spot | 1913 | 478 | 220 | 2611 |
| 20 | Pepper bell healthy | 1988 | 497 | 242 | 2727 |
| 21 | Potato Early blight | 1939 | 485 | 231 | 2655 |
| 22 | Potato healthy | 1824 | 456 | 231 | 2511 |
| 23 | Potato Late blight | 1939 | 485 | 231 | 2655 |
| 24 | Raspberry healthy | 1781 | 445 | 209 | 2435 |
| 25 | Soybean healthy | 2022 | 505 | 253 | 2780 |
| 26 | Squash Powdery mildew | 1736 | 434 | 209 | 2379 |
| 27 | Strawberry healthy | 1824 | 456 | 242 | 2522 |
| 28 | Strawberry Leaf scorch | 1774 | 444 | 209 | 2427 |
| 29 | Tomato Bacterial spot | 1702 | 425 | 209 | 2336 |
| 30 | Tomato Early blight | 1920 | 480 | 242 | 2642 |
| 31 | Tomato healthy | 1926 | 481 | 231 | 2638 |
| 32 | Tomato Late blight | 1851 | 463 | 220 | 2534 |
| 33 | Tomato Leaf Mold | 1882 | 470 | 242 | 2594 |
| 34 | Tomato Septoria leaf spot | 1745 | 436 | 220 | 2401 |
| 35 | Tomato Two-spotted spider mite | 1741 | 435 | 143 | 2319 |
| 36 | Tomato Target Spot | 1827 | 457 | 220 | 2504 |
| 37 | Tomato mosaic virus | 1790 | 448 | 209 | 2447 |
| 38 | Tomato Yellow Leaf Curl Virus | 1961 | 490 | 220 | 2671 |
| Total | 70,295 | 17,572 | 8339 | 96,206 |
Table 2.
The Precision vs. Recall Values of the CNN Model for All Disease Classes.
| Class # | Plant Disease Classes | Precision | Recall | F1-score |
|---|---|---|---|---|
| 1 | Apple scab | 0.95 | 0.93 | 0.94 |
| 2 | Apple Black rot | 0.93 | 0.99 | 0.96 |
| 3 | Apple Cedar apple rust | 0.98 | 0.96 | 0.97 |
| 4 | Apple healthy | 0.97 | 0.96 | 0.96 |
| 5 | Blueberry healthy | 0.97 | 0.98 | 0.98 |
| 6 | Cherry healthy | 0.98 | 0.99 | 0.98 |
| 7 | Cherry Powdery mildew | 0.99 | 0.97 | 0.98 |
| 8 | Corn Cercospora Gray leaf spot | 0.96 | 0.86 | 0.91 |
| 9 | Corn Common rust | 0.98 | 1.00 | 0.99 |
| 10 | Corn healthy | 1.00 | 1.00 | 1.00 |
| 11 | Corn Northern Leaf Blight | 0.89 | 0.95 | 0.92 |
| 12 | Grape Black rot | 0.98 | 0.96 | 0.97 |
| 13 | Grape Esca Black Measles | 0.96 | 0.99 | 0.97 |
| 14 | Grape healthy | 1.00 | 0.99 | 0.99 |
| 15 | Grape blight Isariopsis | 0.99 | 1.00 | 0.99 |
| 16 | Orange Citrus greening | 0.98 | 1.00 | 0.99 |
| 17 | Peach Bacterial spot | 0.93 | 0.98 | 0.96 |
| 18 | Peach healthy | 0.94 | 1.00 | 0.97 |
| 19 | Pepper bell Bacterial spot | 0.90 | 0.97 | 0.93 |
| 20 | Pepper bell healthy | 0.96 | 0.94 | 0.95 |
| 21 | Potato Early blight | 0.98 | 0.96 | 0.97 |
| 22 | Potato healthy | 0.97 | 0.88 | 0.93 |
| 23 | Potato Late blight | 0.90 | 0.94 | 0.92 |
| 24 | Raspberry healthy | 0.96 | 0.99 | 0.97 |
| 25 | Soybean healthy | 0.94 | 0.97 | 0.95 |
| 26 | Squash Powdery mildew | 0.99 | 1.00 | 0.99 |
| 27 | Strawberry healthy | 0.99 | 0.93 | 0.96 |
| 28 | Strawberry Leaf scorch | 1.00 | 0.99 | 0.99 |
| 29 | Tomato Bacterial spot | 0.84 | 0.95 | 0.89 |
| 30 | Tomato Early blight | 0.90 | 0.68 | 0.78 |
| 31 | Tomato healthy | 0.92 | 0.93 | 0.92 |
| 32 | Tomato Late blight | 0.85 | 0.89 | 0.87 |
| 33 | Tomato Leaf Mold | 0.88 | 0.91 | 0.89 |
| 34 | Tomato Septoria leaf spot | 0.80 | 0.81 | 0.80 |
| 35 | Tomato Two-spotted spider mite | 0.88 | 0.81 | 0.84 |
| 36 | Tomato Target Spot | 0.77 | 0.76 | 0.76 |
| 37 | Tomato mosaic virus | 0.88 | 0.94 | 0.91 |
| 38 | Tomato Yellow Leaf Curl Virus | 0.99 | 0.92 | 0.96 |
| Overall Average Accuracy | 0.94 | |||
| Macro Average | 0.94 | 0.94 | 0.94 | |
| Weighted Average | 0.94 | 0.94 | 0.94 |
Table 3.
The Average Classification Accuracy and Prediction Time of the CNN Model.
| Class # | Plant Disease Classes | Accuracy | Prediction Time (s) |
|---|---|---|---|
| 1 | Apple scab | 92% | 0.99 |
| 2 | Apple Black rot | 92% | 1.01 |
| 3 | Apple Cedar apple rust | 99% | 0.77 |
| 4 | Apple healthy | 95% | 1.11 |
| 5 | Blueberry healthy | 96% | 0.76 |
| 6 | Cherry healthy | 98% | 0.74 |
| 7 | Cherry Powdery mildew | 100% | 0.75 |
| 8 | Corn Cercospora Gray leaf spot | 80% | 0.79 |
| 9 | Corn Common rust | 99% | 0.89 |
| 10 | Corn healthy | 100% | 1.02 |
| 11 | Corn Northern Leaf Blight | 88% | 1.06 |
| 12 | Grape Black rot | 98% | 1.31 |
| 13 | Grape Esca Black Measles | 97% | 0.75 |
| 14 | Grape healthy | 99% | 0.74 |
| 15 | Grape blight Isariopsis | 100% | 1.37 |
| 16 | Orange Citrus greening | 96% | 0.75 |
| 17 | Peach Bacterial spot | 99% | 0.76 |
| 18 | Peach healthy | 98% | 0.93 |
| 19 | Pepper bell Bacterial spot | 81% | 0.86 |
| 20 | Pepper bell healthy | 93% | 0.95 |
| 21 | Potato Early blight | 100% | 0.74 |
| 22 | Potato healthy | 98% | 0.88 |
| 23 | Potato Late blight | 87% | 0.75 |
| 24 | Raspberry healthy | 99% | 1.04 |
| 25 | Soybean healthy | 92% | 0.93 |
| 26 | Squash Powdery mildew | 100% | 0.84 |
| 27 | Strawberry healthy | 98% | 0.87 |
| 28 | Strawberry Leaf scorch | 99% | 0.74 |
| 29 | Tomato Bacterial spot | 92% | 0.73 |
| 30 | Tomato Early blight | 93% | 0.76 |
| 31 | Tomato healthy | 93% | 0.89 |
| 32 | Tomato Late blight | 90% | 0.75 |
| 33 | Tomato Leaf Mold | 83% | 0.77 |
| 34 | Tomato Septoria leaf spot | 83% | 1.04 |
| 35 | Tomato Two-spotted spider mite | 78% | 0.96 |
| 36 | Tomato Target Spot | 74% | 1.04 |
| 37 | Tomato mosaic virus | 92% | 0.75 |
| 38 | Tomato Yellow Leaf Curl Virus | 97% | 0.73 |
| Average | 93.6% | 0.88 |
Publisher’s Note: MDPI stays neutral with regard to jurisdictional claims in published maps and institutional affiliations. |
© 2021 by the authors. Licensee MDPI, Basel, Switzerland. This article is an open access article distributed under the terms and conditions of the Creative Commons Attribution (CC BY) license (https://creativecommons.org/licenses/by/4.0/).
Share and Cite
MDPI and ACS Style
Ahmed, A.A.; Reddy, G.H. A Mobile-Based System for Detecting Plant Leaf Diseases Using Deep Learning. AgriEngineering 2021, 3, 478-493. https://0-doi-org.brum.beds.ac.uk/10.3390/agriengineering3030032
AMA Style
Ahmed AA, Reddy GH. A Mobile-Based System for Detecting Plant Leaf Diseases Using Deep Learning. AgriEngineering. 2021; 3(3):478-493. https://0-doi-org.brum.beds.ac.uk/10.3390/agriengineering3030032
Chicago/Turabian StyleAhmed, Ahmed Abdelmoamen, and Gopireddy Harshavardhan Reddy. 2021. "A Mobile-Based System for Detecting Plant Leaf Diseases Using Deep Learning" AgriEngineering 3, no. 3: 478-493. https://0-doi-org.brum.beds.ac.uk/10.3390/agriengineering3030032