Article

Optimizing Soil Fertility Management Strategies to Enhance Banana Production in Volcanic Soils of the Northern Highlands, Tanzania

1
Department of Earth and Environmental Sciences, Division of Soil and Water Management, KU Leuven, Kasteelpark Arenberg 20, 3001 Heverlee, Belgium
2
Department of Sustainable Agriculture, Biodiversity and Ecosystems Management, Nelson Mandela African Institution of Science and Technology, Arusha P. O. Box 447, Tanzania
3
Department of Water and Environmental Sciences, Nelson Mandela African Institution of Science and Technology, Arusha P. O. Box 447, Tanzania
4
International Institute of Tropical Agriculture, Nelson Mandela African Institution of Science and Technology, Arusha P. O. Box 447, Tanzania
5
Department of Biosystems, Division Plant Biotechnics, KU Leuven, W. De Croylaan 42, 3001 Heverlee, Belgium
*
Author to whom correspondence should be addressed.
Submission received: 13 December 2019 / Accepted: 31 January 2020 / Published: 18 February 2020

Abstract

:
Banana is an important crop in high altitude areas of Tanzania, grown widely both as a food staple and as the main source of income. However, its production is constrained by low soil fertility, a result of gradual nutrient mining by the crop. Currently, soil fertility management in banana-based farming systems in the country relies mainly on applications of animal manure. However, the amount of manure produced in most farms is not enough to replenish soil fertility due to the small number of animals kept by smallholder resource-poor farmers who are the major producers in the country. Field experiments were conducted at three sites with varying soil types and contrasting weather conditions along the altitudinal gradients on the slopes of the volcanic mountains of Kilimanjaro and Meru, northern Tanzania to (1) investigate the effect of mineral nitrogen (mineral N) fertilizer applications on the growth and yield of Mchare banana (Musa spp., AA, a traditional East African highland cooking banana sub-group), at the four levels of 0, 77, 153, and 230 kg N ha−1 year−1 as a starter strategy to improve the current soil fertility management strategies, and (2) evaluate the effect of the combined use of inorganic and organic N sources on growth and banana fruit production as an alternative strategy to manage soil fertility and minimize animal manure requirements. The treatment factors were trial sites (Tarakea, Lyamungo, and Tengeru) as the main factor and N fertilization strategies (as urea alone, sole cattle manure, and in combination with urea, sole common bean (Phaseolus vulgaris L.) haulms as well as in combination with urea) as a sub factor. Bean haulms and cattle manure were applied each year for two years. Fertilization at 153 kg N ha−1 year−1 derived solely from urea significantly (p < 0.001) resulted in high yield increment of up to 42% relative to the control. However, the increase was highest (52%) with the same N dose derived from cattle manure in combination with urea at 50% substitution. Sole bean haulms resulted in a smaller yield increment, the same as the lowest N dose from the sole urea fertilization treatment. The study concludes that soil fertility management in smallholder banana-based farming systems should not solely rely on animal manure and mineral fertilizers.

1. Introduction

Banana is a major food staple and an important cash crop in highland areas of Tanzania [1,2], normally grown in association with the common bean [2] in homestead gardens with little or no fertilizer input [1,2] due to limited access to financial credit [2,3]. Bean grains play a significant role in household nutrition as a source of protein whereas residues (haulms) are animal fodder for indoor dairy cattle that serve as an important source of organic fertilizer for banana-homestead gardens [2,3]. However, the smallholder dairy cattle industry is constrained by the inadequate availability of fodders due to high population pressure on the land caused by high population densities of up to 345 residents per km2 with each household living on a farmstead of less than 0.5 ha [3]. Consequently, pasture plots have been converted to crop land to produce food to feed the ever increasing population [2,3]. As such, dairy cattle feed largely on crop residues (pseudostems, banana leaves, and haulms) produced in the farmstead [3] and it is common practice for livestock keepers to supplement these materials by buying from non-livestock keepers in the neighborhood. In this way, banana-homestead gardens owned by livestock keepers benefit from nutrient input brought in by the obtained manure at the expense of soil fertility in banana-homestead gardens owned by non-livestock keepers. In light of this, importation of additional fodders from low altitude areas should be considered, but transport costs of up to US $57 per trip of a 2.5 ton truck are too high for a resource-poor farmer. Banana ranks fourth after maize, cassava, and sweet potato in terms of the quantities produced [4] and is estimated to feed up to 30% of the total human population in the country [2]. Approximately 30% of the total produce is consumed at the homestead while the remaining 70% is sold in the local market [5], hence contributing significantly in food security and income stability. Nearly 80% of the cultivated bananas belong to the traditional East African highland cooking banana (EAHB), 10% are brewing bananas, 8% are dessert bananas, and 2% are plantains [2,6], indicating that they are of considerable cultural importance for the community.
The current banana fruit yields under the farmer’s conditions are low (7 t ha1) [4], only 10% of the potential yield in East Africa [7] primarily caused by low soil fertility due to continuous production without proper nutrient replenishment [2,3,8,9]. Previously, Baijukya et al. [3], Raeymaekers and Stevens [9], Mizota et al. [10], Kaihura et al. [11], Ndakidemi and Semoka [12], Pabst et al. [13], and Maro et al. [14] reported that soil N deficiency was amongst the main constraints to crop production in most areas of the country, inclusive of the study area. This nutrient is required by banana plants in large amounts, only second to K, and is a constituent of many plant cell components including amino and nucleic acids [15]. Therefore, in order to increase banana fruit yields, the current soil N levels need to be improved.
Crop nutrient requirements in banana-based farming systems are currently addressed via cattle manure only. However, in most farms, the quantity of manure produced by stall-fed dairy cows is not enough to maintain the soil fertility of the farms [2,3,8,9]. For instance, the average size of a banana homegarden in the study area is 0.8 ha [9]. If 20 kg of cattle manure (N = 0.48% [3]) mat1 year1 which is currently used by resource endowed farmers to fertilize the crop has to be applied as the sole source of N, then 25 t year1 of manure is needed. The average number of dairy cows kept per household is 3 [9], with the average production of 650 kg manure animal1 year1 [16], so the potential production is 2 t year1, which is only 8% of the total requirement. Supplementation with poultry, goat, and swine manure produced at the homestead or additional cattle manure from nomadic pastoralists in the lowlands should be considered. However, poultry, goat, and swine manure is produced in negligible quantities [9], while the transport costs of cattle manure of up to $52 USD per trip of a one ton pickup are too high. This explains the need to supplement organic with inorganic fertilizers, which are relatively cheap. For instance, the retail price of a 50 kg bag of urea, which is commonly available in most villages, ranges between $19 and $21 USD and can be found in the market throughout the year. The combined use of organic and inorganic fertilizer resources in turn will reduce the total reliance on animal manure while maintaining good soil fertility and high yield levels. Earlier studies by Chivenge et al. [17] and Ripoche et al. [18] indicated that combined applications of organic and inorganic fertilizers consistently resulted in the highest yields, relative to manure or mineral fertilizers alone. Nevertheless, banana growers in Tanzania do not use this strategy due to lack of knowledge on its appropriate use.
This paper aimed to improve our knowledge on the appropriate use of N fertilizer in terms of application rate and strategy as an alternative approach to manage soil N under highland conditions. Therefore, this study was conducted to (i) estimate the optimum N fertilizer application rate as a starter strategy to improve traditional soil fertility management practices in banana-based farming systems; (ii) understand the additive effect of integrating mineral and organic N resources on growth, plant nutrition, and banana fruit yield; and (iii) assess the contribution of common bean haulms to improve banana production.

2. Materials and Methods

2.1. Site Description, Experimental Field Establishment, and Soil Characterization

Field experiments were performed in 2016 to 2017 in three farms established at three sites with varying soil types and contrasting weather conditions located along the altitudinal gradients on the volcanic slopes of Mount Kilimanjaro and Mount Meru in the northern highlands, Tanzania. These included (i) Tarakea, at the farm of Tarakea secondary school (latitude 03°02′17.0″ S, longitude 037°35′24.9″ E; 1608 m.a.s.l.) in the Rombo district, Kilimanjaro region; (ii) Lyamungo, at the farm of Tanzania Coffee Research Institute (latitude 03°13′49.6″ S, longitude 037°14′55.9″ E; 1346 m.a.s.l.) in the Hai district, Kilimanjaro region; and (iii) Tengeru, at the farm of Nelson Mandela African Institution of Science and Technology (latitude 03°02′17.0″ S, longitude 037°35′24.9″ E; 1106 m.a.s.l.) in the Arumeru district, Arusha region. The first field was established in the high altitude agro-ecological zone, the second field in the mid altitude zone, and the third was established in the interflow zone between mid and low altitude agro-ecological zones. Precipitation was recorded at each trial site for the entire experimental period to evaluate its effect on banana fruit production.
A representative soil profile pit was dug with dimensions of 2 m depth, 2.5 m length, and 1 m width at each experimental site for soil characterization. Top soil samples (30 cm surface soil layer) were collected using an Edelman auger for fertility analysis. Soil pH was measured in water using a soil to water ratio of 1:2.5 [19]. Total C was determined according to the Walkley and Black wet oxidation method [20]. Soil total N was determined by the Kjeldahl wet digestion-distillation method [21] to obtain an overview of soil quality in the trial sites related to soil organic matter. Soil available P was extracted following the Bray-1 procedure [21]. Cation exchange capacity was determined by the ammonium saturation method [22]. Soil exchangeable (Ca, Mg, and K) was determined by atomic absorption spectrophotometry in a 1 M ammonium acetate extract buffered at pH 7 [22]. Then, particle size distribution was measured by the hydrometer method [23] and textural classes of the soils were determined according to the guidelines for soil description [24]. Soil classification was done using soil classification guidelines provided in the USDA Soil Taxonomy [25] and in the World Reference Base for Soil Resources (WRB) FAO [26]. Soil types varied from an Endo-Eutric Calcic Vitric Andosol (Aric, Clayic, Sideralic) in Tarakea to a Luvic, Rhodic Nitisol in Lyamungo, and a Phaeozem (Clayic, Humic, Geoabruptic) in Tengeru. The initial top soil properties ranged between 5.4 and 6.5 (pH), 1.0 and 2.2 g kg−1 (total N), 16 and 22.2 g kg−1 (total C), 6.3 and 7.9 mg kg−1 (P), 0.8 and 3.5 cmolc kg−1 (K), 1.6 and 4.8 cmolc kg−1 (Mg), 8.9 and 23.6 cmolc kg−1 (Ca), and 18.2 and 44.1 cmolc kg−1 (CEC) (Table 1). In general, soil C and N in Tarakea and Tengeru was low [27].

2.2. Experimental Design and Fertilization Treatments

The experiment involved a randomized complete block design and was replicated three times. Banana planting holes were dug 0.9 m long by 0.9 m wide by 0.7 m deep. Each experimental plot was 15 m long by 10 m wide and contained five rows spaced 3 m by 2 m, and a plot area measured 150 m2. Banana seedlings (Mchare AA, the traditional East African highland cooking banana (EAHB)) [6] were obtained from the Crop Bio-Science laboratory based in Arusha, Tanzania, as in vitro plants. Banana seedlings were planted at the onset of a long rainy season. Common bean (Phaseolus vulgaris L. var. “Lyamungo 90”, bush type) was planted as an intercrop in the respective treatment plots between banana mats in four rows spaced 0.2 m by 0.5 m in both the short and long rainy season in each year. Legume seeds were obtained from the Selian Agricultural Research Institute (SARI) based in Arusha, Tanzania.
The experiment consisted of eight fertilization treatments (Table 2). All fertilization treatments were applied in each year in all locations. Treatments 3, 5, and 6 were designed to equalize the total N contents derived from different amounts of urea and cattle manure. This was calculated on the basis of equal N amounts (153 kg N ha−1 year−1 equivalent to 92 g N mat−1 year−1 determined according to organic N traditionally applied by resource-endowed farmers). Fertilization treatments included (N rates expressed in kg ha−1 year−1): T1 = 0 N (control); T2 = 77 kg N (derived from urea, 50% below the N dose applied by resource-endowed farmers); T3 = 153 kg N (derived from urea, corresponding the traditional N rate derived from cattle manure); T4 = 230 kg N (derived from urea, 50% above the traditional N rate); T5 = 50% urea (containing 77 kg mineral N) + 50% cattle manure (containing 77 kg organic N); T6 = 100% cattle manure (containing 153 kg organic N, the current N rate applied by resource-endowed farmers); T7 = 50% urea (containing 77 kg mineral N) + bean haulms (containing 52 kg organic N); and T8 = 100% bean haulms (containing 52 kg organic N). In the first four treatments, we intended to estimate the optimum N fertilizer application rate as a starter strategy to improve the traditional soil fertility management practices in banana-based farming systems. On the other hand, T6 (100% cattle manure), which represents the traditional farmers practice, was used as the reference. Cattle manure was locally sourced from one farm and was found to contain 0.2% N, 0.3% P, and 1.2% K. Each banana mat in T5 received 23 kg (equivalent to 38 t ha−1) of cattle manure + 100 g (equivalent to 77 kg ha−1) of urea year−1. As for 100% cattle manure treatment (T6), each mat was amended with 46 kg (equivalent to 76 t ha−1) manure year−1. In addition, every banana mat in T8 received 1 kg (equivalent to 1.6 t ha−1) of dry common bean haulms year-1, while in T7, every banana mat received this amount in combination with the lowest dose of urea (Table 2). Bean haulms contained 3.1% N, 0.3% P, and 2.4% K. Mineral fertilizers used in this study were triple super phosphate (TSP, 46% P2O5), urea (46% N), and muriate of potash (MOP, 60% K2O) as a source of K. Cattle manure and TSP were applied once in every year. On the other hand, urea and MOP were applied in three splits (Table 3) in each year.

2.3. Growth and Yield Assessment

Growth and yield data were assessed on nine banana plants from central rows. Growth observations were made based on plant size and crop cycle. Plant size expressed in m3 was computed from measurements on (i) plant height from the soil level to the top of the plant where the petiole of the two youngest leaves come together, and (ii) stem girth at 100 cm above the soil using the formula given in Equation (1) below.
P l a n t   v o l u m e =   π h r 2
where r and h are the radius and height of the stem, respectively.
Growth measurement was done at flowering. The crop cycle was assessed as the period in number of days from planting to shooting. Yield and yield parameters included (i) crop maturity, (ii) fingers per bunch, (iii) finger length and girth, (iv) finger weight, (v) bunch weight, and (vi) yield ha−1 cycle−1. To obtain finger weight without peduncle, all hands were cut, weighed, and their weights subtracted from the respective bunch total weight. Average fruit weight was determined from three individual middle fingers of the second hand, as described by Alvarez et al. [28]. Duration to crop maturity was the period in number of days from planting to harvesting. Yield ha−1 cycle−1 was calculated using the formula given in Equation (2). At harvest, pseudostem and leaf residues were chopped into small pieces and left in the field for the recycling of nutrients.
Yield = bunch weight x number of bunches ha−1 cycle−1

2.4. Nutritional Status of Mchare Banana Leaves

Nutritional status of the banana leaves was assessed at nine months after planting (MAP) by analyzing a sub-sample of 10 cm by 20 cm collected from both sides of the midrib at the midpoint of the lamina of the third fully open leaf [29]. A composite sample consisted of leaves collected from nine plants grown in the central rows of each treatment plot. Samples were thoroughly washed with distilled water to remove dust and oven dried at 70 °C until constant weight. Dry samples were ground with an agate ball mill to less than 2 mm, digested by 2 mL, of concentrated nitric acid-analytical grade, and analyzed for P, K, Mg, Ca, B, Cu, Fe, Mn and Zn concentrations using Inductively coupled plasma optical emission spectrometry (ICP-OES). Total N was determined by subjecting Sn capsules to oxidative digestion under a controlled oxygen supply at around 1700 °C. Foliar macronutrient concentrations were evaluated with the norms obtained through compositional nutrient diagnosis (CND) for the EAHB as developed by Delstanche [30], who established 2.35–2.81, 0.13–0.18, 3.23–4.12, 0.32–0.45%, and 0.49–0.80as sufficiency ranges for N, P, K, Mg, and Ca, respectively. In addition, foliar micronutrient concentrations were compared with sufficiency ranges published in Reuter and Robinson [31], who identified 11, 9, 80, 25, and 18 mg kg−1 as critical concentrations for B, Cu, Fe, Mn, and Zn, respectively.

2.5. Total Nutrients Content in the Above Ground Biomass at Harvest

During harvesting, pseudostem, leaves, peduncle, and fruits were weighed separately. Thereafter, sub-samples were collected from each part and weighed for their fresh weight. Sample preparation and tissue analysis was done as described in Section 2.2. Tissue nutrient concentrations were then used to calculate the total nutrient contents in the above ground biomass using Equation (3). Nutrient content was calculated by multiplying the nutrient concentration in the tissue with the dry matter yield. This information was then used to calculate the internal and utilization efficiency of N fertilizer applied to the crop using Equations (4) and (5) given below [32].
T o t a l   n u t r i e n t   c o n t e n t s = t i s s u e   c o n c e n t r a t i o n   × t i s s u e   m a s s ,   f o r   a b o v e   g r o u n d   p a r t s
I n t e r n a l   e f f i c i e n c y = ( ( y i e l d   ( N   t r e a t m e n t ) y i e l d   ( c o n t r o l ) ) ÷ N   u p t a k e
U t i l i z a t i o n   e f f i c i e n c y   = 100 ( ( N   u p t a k e   ( N   t r e a t m e n t ) N   u p t a k e   ( c o n t r o l ) ) ÷ N   a p p l i e d

2.6. Statistical Analysis

Rainfall data collected in the experimental sites were analyzed by t-test (group by group) using STATISTICA software to compare variations among the experimental sites. Data on growth, foliar nutritional status, yield, total nutrient contents in the above ground biomass, and the efficiency N fertilizer applied to the crop were subjected to analysis of variance (ANOVA) using STATISTICA software to evaluate the performance of fertilization treatments and their interaction. Means across the study sites and within the site were separated using the Tukey test at the p = 0.05 level of significance. The relationship among the investigated parameters was determined by the Pearson’s correlation coefficient (r) at p = 0.05 level of significance.

3. Results

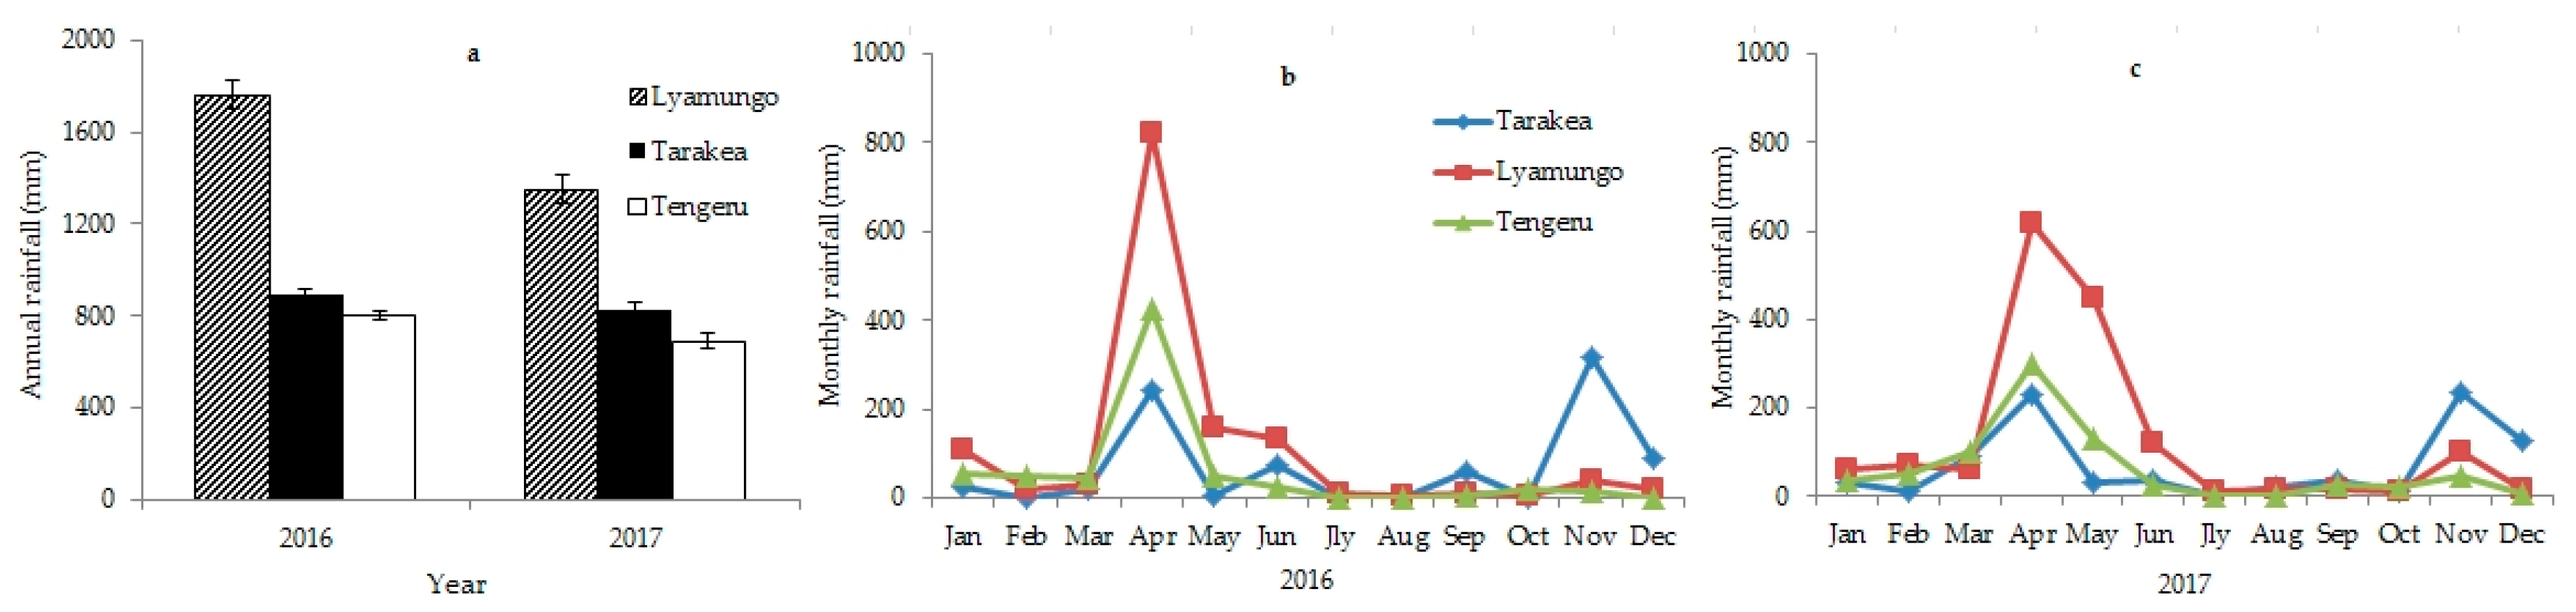
3.1. Variations in Weather Conditions among the Experimental Sites

Rainfall intensity during the experimental period varied widely (df = 3; t = 4.71; p = 0.00016) among the sites (Figure 1). Precipitation in Lyamungo exceeded 1300 mm year1, which was suitable for optimum growth and fruit production [33]. Rainfall in Tarakea and Tengeru was below the optimum [33]. In general, rainfall distribution in these sites followed a bimodal pattern with a long rainy season from March to July and short rainy season from October to January.

3.2. Effects of Weather Conditions and Fertilization Treatments on Plant Size, Crop Cycle, and Yield

3.2.1. Plant Size

Site characteristics significantly (p < 0.001) influenced plant size (Table 4). Banana plants under the higher rainfall conditions of Lyamungo were larger than those in Tarakea and Tengeru. Compared with the control, fertilization treatments significantly (p < 0.001) enhanced plant growth (Table 4). Applications of cattle manure alone (T6) or in combination with urea (T5) resulted in the largest plants, followed by urea only (in T3 and T4) or in combination with bean haulms (T7). Sole haulms fertilization treatment (T8) led to small plants as the lowest rate of urea alone (T2).

3.2.2. Crop Cycle

The crop cycle ranged between 356 and 462 days and the gap between the shortest and longest cycle was 106 days (approximately four months). Site characteristics had significant (p < 0.05) influence on crop cycle (Table 4). The shortest cycle was recorded under the rain intensive conditions of Lyamungo and the longest in the drier conditions of Tengeru. Furthermore, the results of this study demonstrate that all tested fertilization treatments (except sole bean haulms (T8)) significantly (p < 0.001) enhanced growth rate (Table 4). Applications of cattle manure alone (T6) or in combination with urea (T5) resulted in a shorter crop cycle than the sole urea treatments (T2–T4) or in combination with bean haulms (T7). Fertilization via haulms only (T8) resulted in the same long cycle as the control (T1).

3.2.3. Yield

Banana yield ranged between 24 and 51 t ha−1 and the gap between the lowest and the highest yield was 27 t ha−1 crop−1 equivalent to 53%. Site characteristics significantly affected (p < 0.001) the yield (Table 4), with the most humid site of Lyamungo having the highest yield (48 t ha−1 cycle−1) and the drier area of Tengeru producing 29 t ha−1 cycle−1. Fertilization treatments resulted in a significant (p < 0.001) increase in banana yield and the highest yield was attained in the cattle manure + urea treatment (T5), slightly producing more than the sole cattle manure treatment (T6). Sole urea treatments (T2–T4) also resulted in considerable yield with T3 producing more than the other two treatments. Bean haulms in combination with urea (T7) gave the same yield as T2. The sole haulms treatment (T8) resulted in the lowest yield compared with the other fertilization treatments. Yield levels attained in all fertilization treatments were significantly larger than those obtained under the farmer’s fields.

3.3. Effects of Fertilization Treatments on Nutrition Status of the Third Fully Open Leaf of 9 Month Old Mchare and Total Nutrient Contents in the Above Ground Biomass at Harvest

3.3.1. Foliar Nutritional Status

Nutrient concentrations in banana leaves differed significantly (p < 0.001 for Ca, Cu, Fe, and Zn; p < 0.01 for B and N; p < 0.05 for K) among the experimental sites with those in the most humid zone of Lyamungo containing the largest levels of N, P, Mg, Ca, and Cu (Table 5). Fertilization treatments had a significant influence (p < 0.001 for Ca; p < 0.01 for B, N, and Mn; p < 0.05 for K and Zn) on the nutrition status of the banana leaves. Foliar analyses revealed that banana leaves in all fertilization treatments contained insufficient concentrations of Cu and Zn. Moreover, tissue levels of K in the sole urea (T2–T4), bean haulms (T8), or in combination with urea (T7) were significantly smaller than the proposed optimum level for EAHB as in the control (T1).

3.3.2. Total Nutrient Contents in the Above Ground Biomass at Harvest

Nutrient contents in the above ground biomass differed significantly (p < 0.01 for N, K, Mn; p < 0.001 for P, Mg, Ca, S, B, Cu, Fe, and Zn) among the experimental sites (Table 6 and Table 7). Banana plants in the more humid zone of Lyamungo contained the largest quantities of the studied nutrients (except B and Zn). Additionally, fertilization treatments significantly affected (p < 0.01 for N, K, Mn; p < 0.001 for P, Mg, Ca, S, B, Cu, Fe, and Zn) the nutrient contents in the above ground plant organs (Table 6 and Table 7). Fertilization via cattle manure only (T6) or in combination with urea (T5) resulted in larger nutrient contents than urea alone (T2–T4), sole haulms (T8), or in combination with urea (T7). Plants in the sole bean haulms treatment (T8) contained the smallest nutrient quantities, second only to the control (T1). The results indicate further that total nutrient uptake by the above ground plant organs was in the order of K > N > Ca > Mg > P > S > Mn > Fe > Zn > B > Cu, which is almost similar to those recorded in Cavendish bananas (AAA) [34]. Nevertheless, the total nutrient distribution pattern in the above ground plant organs was realistic for N, P, Mg, S, and Cu compared with the other nutrients (data not presented).

3.4. Effects of Fertilization Treatments on Efficiency of N Fertilizer

Internal and utilization efficiency of the applied N fertilizers varied widely (p < 0.01) among the experimental sites (Table 8) with the highest efficiency in the more humid zone of Lyamungo. Significant (p < 0.01) differences were also observed among fertilization treatments (Table 8). Fertilization through sole cattle manure (T6) or in combination with urea resulted in the highest values of the aforementioned parameters. Combined application of cattle manure with urea (T5) improved internal efficiency by 15% against the sole cattle manure (T6). Sole urea fertilization treatments (T2–T4) and bean haulms (T7–T8) consistently resulted in the lowest values.

3.5. Correlation among the Investigated Variables

Precipitation correlated significantly, strongly, and positively with the total nutrient contents in the above ground biomass (Table 9), plant size, fingers per hand and per bunch, finger weight, and yield (Table 10). In addition, there was a significant, strong, and positive correlation between the total N contents in the above ground biomass and other nutrients (except Fe and Mn) (Table 8a). A similar trend was also observed between the yield and nutrient contents in the above ground biomass (Table 8a). Yield correlated significantly, strongly, and positively with plant size, number of hands and fingers per bunch, and finger weight (Table 8b).

4. Discussion

4.1. Effects of Initial Soil Characteristics and Weather Conditions on Crop Performance

The initial soil total C and N in Tarakea and Tengeru was too low to maintain good soil fertility and high banana yields [19]. In addition, our findings demonstrated a wide variation in plant size, yield, foliar nutrition, total nutrient contents in the above ground biomass, and efficiency of N fertilizer among the experimental sites. Large values of the aforementioned variables were obtained in the Nitisol of Lyamungo, followed by the Andosol in Tarakea, and the Phaeozem in Tengeru. The high crop performance in Lyamungo (Table 4) can partly be linked to the higher and better distributed rainfall (Figure 1). While banana requires about 1300 mm of precipitation year-1 for optimum growth and yield [29,33], the observed poor crop performance in Tarakea and Tengeru can be attributed to moisture deficit due to less rains in a shorter period (Figure 1). This confirms earlier results of other banana types where drought stress reduced yield by 65% [35,36,37,38].

4.2. Effect of Fertilization Treatments on Yields

Our findings revealed that an application of 153 kg mineral N ha−1 year−1 via urea only (T3) increased yield up to 41 t ha−1 cycle−1 (Table 4), which is significantly higher than any other mineral N fertilization treatment (T2 and T4). However, this can further be increased, for instance in our study, to 51 t ha−1 when the same amount of N comes from a mixture of cattle manure and urea at 50% each (T5). This is in agreement with many previous findings by Chivenge et al. [17], Ripoche et al. [18], Abd el Moniem et al. [39], Otinga et al. [40], Baijukya et al. [41], Wairegi and Van Asten [42], Vanlauwe et al. [43], Vanlauwe et al. [44], and Kihara et al. [45], where the combined use of organic and inorganic fertilizers resulted in the highest yields compared with inorganic or organic fertilizers alone. Therefore, this seems to be the best alternative strategyto manage soil fertility in banana-based farming systems in the study area, as expected. Organic/inorganic interactions not only release plant available nutrients, but also increase the soil OC stock, which improves the retention of the applied mineral fertilizer by the soil, therefore enhancing its utilization efficiency. Inorganic fertilizer also seems to stimulate microbial activities involved in the decomposition of organic materials [46], hence causing a fast release of nutrients relative to sole manure fertilization.
Fertilization with 153 kg N ha−1 year−1 through cattle manure alone (T6) resulted in a higher yield than with the same amount derived solely from urea (T3). Similarly, Teixeira et al. [47] attained higher banana yields with sewage sludge fertilization than in mineral N fertilizer. Unfortunately, this strategy requires larger quantities of manure, which are not available in most smallholder farms as reported in other parts of the country [3,8]. Consequently, a resource poor farmer applies too small quantities, which do not meet the crop nutrient requirements. Therefore, there is a need to supplement the scarcely available cattle manure with mineral fertilizers to improve the use efficiency of both resources while maintaining good soil quality and high yields in a sustainable manner.
Retaining haulms in the bean-intercrop plots as an organic fertilizer resulted in a substantial yield increment of up to 11% relative to the control. However, this increment was smaller than in any other fertilization treatment due to the limited biomass produced by the system. Similar trends were also published in Baijukya et al. [41] in maize, Banful et al. [48] in plantain, Bekunda et al. [49] in maize, and Tadesse et al. [50] in maize. This demonstrates that the amount of nutrients supplied by bean haulms at this small rate does not meet the crop nutrient requirements. Therefore, unless unrealistic amounts of legume biomass are generated, legume residues should be supplemented with mineral fertilizer to improve the efficiency of the former and soil quality.

4.3. Effects of Fertilization Treatments on Nutrition of the Third Fully Open Leaf of Nine Month Old Mchare and Total Nutrient Contents in the Above Ground Biomass at Harvest

4.3.1. Foliar Nutrition

Highest foliar nutrient concentrations were attained in the most humid zone of Lyamungo, suggesting that nutrient acquisition in the other two zones was negatively hampered by moisture stress. This supports earlier findings where drought stress reduced the concentration (%) of N by 44–51 and P by 39–48% in barley, corn, and big bluestem [51]. Foliar analyses revealed further that banana plants contained adequate concentrations of N, P, K, Mg, Ca, S, Fe, and Mn, but were deficient in B (in Lyamungo) and Cu and Zn (across the trial sites). In light of this, the formulation of site specific fertilizer programs that include deficient micronutrients should be given special attention. Previous studies in the lowlands by Moreira and Fageria [34], Yadav et al. [52], Krishnamoorthy and Hanif [53], Jegadeeswari et al. [54], and Bindu [55] indicate that the application of B, Cu, and Zn in combination with macronutrients always resulted in significant increases in banana yields.

4.3.2. Nutrient Contents in the Above Ground Biomass

Nutrient uptake by banana plants as reflected in the total nutrient contents in the above ground biomass (Table 6 and Table 7) followed similar trends as those in Section 4.3.1. Consistent with the observed decreases in foliar nutrient concentrations in the drier zones of Tengeru and Tarakea, total nutrient contents in the above ground biomass also decreased due to reduced uptake by the plants caused by moisture stress. Under moisture stress condition, a lower nutrient absorption can result from (1) a decrease in water uptake in the top surface soil layer in which nutrient fertilizers are often applied [56], (2) a decrease in microbial decomposition and mineralization of organic matter, thereby decreasing the amount of nutrients available for plant uptake [57,58], and/or (3) a decrease in root function by slowing down the activity of enzymes involved in nutrient assimilation [59]. Earlier, Bista et al. [51] indicated that drought stress decreased the uptake of N and P by 72 and 80% in corn and, 142 and 88% in barley, respectively. Similarly, drought stress was reported to reduce plant N and P by 3.73 and 9.18%, respectively [60], foliar N content in Coffea canephora [61], Ca in the above ground biomass of Quercus ilex [62], and Mg uptake by Spartina alterniflora plants [63]. Fertilization at 153 kg N ha−1 year−1 from cattle manure alone (T6) or in combination with urea (T5) resulted in larger nutrient contents in the above ground plant organs than the same dose from sole urea (T3), indicating that there were severe losses of the applied mineral N fertilizer, as reported earlier by Mizota et al. [10] and Funakawa et al. [64]. In light of this, we do not encourage the use of sole mineral fertilizers to manage soil fertility as it will lead to environmental pollution. On the other hand, larger nutrient contents in plants fertilized with cattle manure alone (T6) or in combination with urea (T5) can be linked to a (i) better nutrient retention by the soil conditioned by organic soil solids and surfaces from decomposing cattle manure, which in turn, minimizes the leaching losses of the applied mineral fertilizers, and (ii) the slow release of plant nutrients from decomposing manure allows plants to utilize the nutrients for a long time. Our findings are in broad agreement with those of Choudhary and Suri [65], who obtained the highest values for nutrient uptake in wheat and rice under a combined application of organic and inorganic fertilizers.
The findings of this study further demonstrated that one ton of the harvested banana bunches exported 1.7 kg N, 0.2 kg P, 6.3 kg K, 0.3 kg Mg, 0.1 kg Ca, 0.1 kg S, 2 g B, 1 g Cu, 10 g Fe, 2 g Mn, and 2 g Zn. This trend corresponds well with that reported earlier in the triploid lowland bananas [66]. High yielding plants, for instance in T5, exported up to 88 kg N, 12 kg P, 318 kg K, 15 kg Mg, 7 kg Ca, 6 kg S, 100 g B, 50 g Cu, 510 g Fe, 100 g Mn, and 100 g Zn ha−1 cycle−1 from the farm via harvested bunches. This indicates that nutrient removal from the farm by Mchare, a diploid highland banana via crop harvest can be as high as by triploid bananas like Cavendish [66]. Similarly, pseudostem and banana leaves all together accumulated up to 71 kg N, 13 kg P, 618 kg K, 45 kg Mg, 125 kg Ca, 9 kg S, 120 g B, 90 g Cu, 1 kg Fe, 1 kg Mn, and 120 g Zn ha−1 cycle−1. This implies that the management decision to remove or leave pseudostem and leaf residues in the field is crucial, as it should play a significant role in the recycling of nutrients to the soil stock following decomposition. While pseudostem and leaves were allowed to recycle in this study, these materials are normally used to feed zero grazed dairy cows due to high demand as fodder. As such, retaining pseudostem and leaf residues in the field limits the accessible amounts of fodder for stall-fed livestock and supplementation with additional fodders from the lower altitude zone or feed concentrate is too expensive. In light of the above, the current soil fertility management strategies in banana-based farming systems need to be optimized to ensure that nutrients exported via crop harvest are replenished as much as possible.

4.4. Effects of Fertilization Treatments on N Efficiency

Site characteristics had a significant influence on the internal and utilization efficiency of the N fertilizer applied to the crop. The highest values of the listed parameters were attained in the most humid zone of Lyamungo (Table 8). The value of N utilization in Lyamungo was comparable with that in the drier zone of Tarakea. This implies that drought affects the yields more than the total N uptake and that there was little translocation of the nutrient from the shoot to fingers. In addition, the values of the aforementioned parameters increased as the N rate increased up until 153 kg ha−1 year−1, and the increase was more prominent with the combined use of cattle manure and urea at 50% per each as such. We postulate a higher N efficiency in the integrated strategy to the increased nutrient uptake by shoot biomass, in addition to a better translocation to the banana fingers as conditioned by improved soil physical conditions.

4.5. Correlation among the Investigated Variables

Significant, high, and positive correlation coefficients (r) validated that high yield was linked to large precipitation volumes, plant size, more numerous and heavy fingers, total P, Mg, S, B, Cu, Fe, Mn, and Zn contents in the above ground plant biomass (Table 6 and Table 7). The observed significant, strong, and positive correlation between N and K, Mg, Ca, and B uptake by the plants indicates synergism. In general, the results of this study reveal that the increased uptake of N by plants also enhanced the uptake of other plant nutrients. This implies that attempts to enhance soil N supply have to take into consideration that all other plant nutrients will also have to be supplied in adequate amounts.

5. Conclusions

Trial sites and fertilization treatments demonstrated a significant influence on plant growth, yield, and efficiency of the N fertilizer applied to the crop. The largest values of the listed parameters were attained in the more humid zone of Lyamungo. Inorganic fertilization led to a significant and positive increase in the growth and yield of the Mchare banana. However, the combination of urea with cattle manure was superior to any other fertilization treatments. It also shows that inorganic/organic interactions enhanced the efficiency of the applied nutrient fertilizer. This infers that a combined use of inorganic and organic fertilizers could be used as an excellent alternative strategy to manage soil fertility in farms with insufficient quantities of animal manure. Given that the price and application costs of inorganic fertilizers are relatively lower than those of organic fertilizers, this is a welcome observation, potentially removing reservations among farmers against mineral fertilizer use. Integrated soil fertility management will, in turn, contribute toward improved soil fertility, increased crop production, and sustainable banana-based farming systems. The yields obtained in this study in Mchare ranged between 24 and 51 t ha−1 crop−1, which is at the same level as the triploid export Cavendish bananas. This is an entirely new given, as global banana production is focused on triploids as diploids are believed to be very low yielders. This indicates that more diploids need to be investigated and that banana breeding programs need to revisit the concept that the end product of a breeding program should always be a triploid.

Author Contributions

A.I.M. conducted the field experiments, collected the soil samples and plant tissue samples, growth and yield data, analyzed the data and wrote the manuscript; K.M.M. supervised the research and reviewed the first draft of the manuscript; P.A.N., R.S., and R.M. conceived, supervised the research, and revised the final draft manuscript. All authors have read and agreed to the published version of the manuscript.

Funding

The authors wish to thank the Government of Belgium through the VLIR-UDC program for institutional support to the Nelson Mandela African Institution of Science and Technology (NM-AIST), Tanzania. The authors thank all donors who supported this work through their contributions to the CGIAR Fund (http://www.cgiar.org/who-we-are/cgiar-fund/fund-donors-2/), and in particular to the CGIAR Research Program Roots, Tubers, and Bananas (RTB-CRP).

Acknowledgments

We acknowledge the efforts made by laboratory staff of KU Leuven, Belgium, Division of soil and water management for carrying out plant tissue and soil analyses.

Conflicts of Interest

The authors declare no conflict of interest.

References

  1. Pedersen, E.K. Factors Affecting the Adoption of Improved Banana Technologies in Northern Tanzania; Rockwool foundation research unit, Evaluation note no. 1; Rockwool Foundation Research Unit: Copenhagen, Denmark, 2012; p. 24. [Google Scholar]
  2. Promar Consulting. Fact-Finding Survey for the Support aid to Developing Countries: Agriculture, Forestry and Fisheries of Tanzania; Promar consulting, 1-10-12 Shinkawa Chuo-ku: Tokyo, Japan, 2011; p. 151. [Google Scholar]
  3. Baijukya, F.P.; de Ridder, N.; Masuki, K.F.; Giller, K.E. Dynamics of banana-based farming systems in Bukoba District, Tanzania: Changes in land use, cropping and cattle keeping. Agric. Ecosyst. Environ. 2005, 106, 395–406. [Google Scholar] [CrossRef]
  4. FAOSTAT. 2017. Available online: http://www.fao.org/faostat/en/#data/QC/visualize (accessed on 15 May 2019).
  5. Kalyebara, R.; Nkuba, J.N.; Mgenzi, S.R.B.; Kikulwe, E.M.; Edmeades, S. Overview of the banana economy in the Lake Victoria regions of Uganda and Tanzania. In An Economic Assessment of Banana Genetic Improvement and Innovation in the Lake Victoria Region of Uganda and Tanzania; Smale, M., Tushemereirwe, W., Eds.; IFPRI: Washington, DC, USA, 2007; pp. 73–78. [Google Scholar]
  6. Perrier, X.; Jenny, C.; Bakry, F.; Karamura, D.; Kitavi, M.; Dubois, C.; Hervouet, C.; Philippson, G.; De Langhe, E. East African diploid and triploid bananas: A genetic complex transported from South-East Asia. Ann. Bot. 2019, 123, 19–36. [Google Scholar] [CrossRef] [PubMed] [Green Version]
  7. Smithson, P.C.; Mclntyre, B.D.; Gold, C.S.; Ssali, H.; Kashayij, I.N. Nitrogen and potassium fertilizers vs. nematode and weevil effects on yield and foliar nutrient status of banana in Uganda. Nutr. Cycl. Agroecosyst. 2001, 59, 239–250. [Google Scholar] [CrossRef]
  8. Maruo, S. Differentiation of subsistence farming patterns among the Haya banana growers in the northwestern Tanzania. Afr. Study Monogr. 2002, 23, 147–175. [Google Scholar]
  9. Raeymaekers, S.; Stevens, B. Characterization of Banana-Based farming systems in the Upper-Pangani basin, Tanzania. Master’s Thesis, KU Leuven, Leuven, Belgium, 2015; p. 217. [Google Scholar]
  10. Mizota, C.; Kawasaki, I.; Wakatsuki, T. Clay mineralogy and chemistry of seven pedons formed in volcanic ash, Tanzania. Geoderma 1988, 43, 131–141. [Google Scholar] [CrossRef]
  11. Kaihura, F.B.S.; Kully, I.K.; Kilasara, M.; Aune, J.B.; Singh, B.R.; Lal, R. Impact of soil erosion on crop productivity and crop yield in Tanzania. Adv. GeoEcol. 1998, 31, 375–381. [Google Scholar]
  12. Ndakidemi, P.A.; Semoka, J.M.R. Soil fertility survey in west Usambara Mountains, northern Tanzania. Pedosphere 2006, 16, 237–244. [Google Scholar] [CrossRef]
  13. Pabst, H.; Kühnel, A.; Kuzyakov, Y. Effect of land use and elevation on microbial biomass and water extractable carbon in soils of Mount Kilimanjaro ecosystems. Appl. Soil Ecol. 2013, 67, 10–19. [Google Scholar] [CrossRef] [Green Version]
  14. Maro, G.; Msanya, B.; Mrema, J. Soil fertility evaluation for coffee (Coffea arabica) in Hai and Lushoto districts, northern Tanzania. Int. J. Plant Soil Sci. 2014, 3, 934–947. [Google Scholar] [CrossRef] [Green Version]
  15. Irizarry, H.; Goenaga, R.; Chardon, U. Nitrogen fertilization on banana growth on highly weathered soil of the humid mountain region of the Puerto Rico. J. Agric. Univ. 2002, 86, 15–26. [Google Scholar]
  16. Van de Kop, P.J. The Role of Cattle in nutrient fluxes of the banana-based agro-ecosystem of Bukoba district, Tanzania. Master Thesis, Department of Agronomy, Department of Soil Sceince and Plant Nutrition, Wageningen Agricultural University, Wageningen, The Netherlands, 1995. [Google Scholar]
  17. Chivenge, P.; Vanlauwe, B.; Six, J. Does the combined application of organic and mineral nutrient sources influence maize productivity? Plant Soil 2011, 342, 1–30. [Google Scholar] [CrossRef] [Green Version]
  18. Ripoche, A.; Achard, R.; Laurens, A.; Tixier, P. Modeling spatial partitioning of light and nitrogen resources in banana cover-cropping systems. Eur. J. Agron. 2012, 41, 81–91. [Google Scholar] [CrossRef]
  19. Okalebo, J.R.; Gathua, K.W.; Woomer, P.L. Laboratory Methods of Soil and Plant Analysis: A Working Manual, 2nd ed.; Sacred African Publishers: Nairobi, Kenya, 2002; p. 128. [Google Scholar]
  20. Nelson, D.W.; Sommers, L.E. Total carbon, organic carbon and organic matter. In Methods of Soil Analysis. II. Chemical and Microbiological Properties, 2nd ed.; Page, A.L., Miller, R.H., Keeney, D.R., Baker, D.E., Roscoe, E., Ellis, J., Rhodes, J.D., Eds.; American Society of Agronomy: Madson, WI, USA, 1986; pp. 539–581. [Google Scholar]
  21. Olsen, S.R.; Sommers, L.E. Phosphorus. In Methods of Soil Analysis. II. Chemical and Microbiological Properties, 2nd ed.; Page, A.L., Miller, R.H., Keeney, D.R., Baker, D.E., Roscoe, E., Ellis, J., Rhodes, J.D., Eds.; American Society of Agronomy: Madson, WI, USA, 1986; pp. 403–430. [Google Scholar]
  22. Thomas, G.W. Exchangeable cations. In Methods of Soil Analysis. II. Chemical and Microbiological Properties, 2nd ed.; Page, A.L., Miller, R.H., Keeney, D.R., Baker, D.E., Roscoe, E., Ellis, J., Rhodes, J.D., Eds.; American Society of Agronomy: Madson, WI, USA, 1986; pp. 403–430. [Google Scholar]
  23. Gee, G.W.; Bauder, J.W. Particle size analysis. In Methods of Soil Analysis Part 1: Physical and Mineralogical Properties, 2nd ed.; Klute, A., Ed.; Agronomy monographs (9)1; American Society of Agronomy: Madson, WI, USA, 1986; pp. 383–409. [Google Scholar]
  24. Guidelines for Soil Description, 4th ed.; FAO: Rome, Italy, 2006; p. 97.
  25. USDA Keys to Soil Taxonomy, 12th ed.; United States Department of Agriculture, Natural Resources Conservation Service, National Soil Survey Center: Lincoln, NE, USA, 2014; p. 372.
  26. IUSS Working Group WRB. World Reference Base for Soil Resources 2014, update 2015. In International Soil Classification System for Naming Soils and Creating Legends for Soil Maps; World Soil Resources Reports No. 106; FAO: Rome, Italy, 2015; p. 203. [Google Scholar]
  27. National Soil Services. Classification for General Soil Fertility Evaluation; NSS, Mlingano Research Institute: Tanga, Tanzania, 1990; p. 48. [Google Scholar]
  28. Alvarez, C.E.; Ortega, A.; Fernandez, M.; Borges, A.A. Growth, yield and leaf nutrient content of organically grown banana plants in the Canary Island. Fruits 2001, 56, 17–26. [Google Scholar] [CrossRef]
  29. Luhav, E. Banana nutrition. In Bananas and Plantains; Gowen, S., Ed.; Chapman and Hall: London, UK, 1995; pp. 258–316. [Google Scholar]
  30. Delstanche, S. Drivers of Soil Fertility in Smallholder Banana Systems in the African Great Lakes Region. Ph.D. Thesis, universite catholique de Louvain, Ottignies-Louvain-la-Neuve, Belgium, 2011; p. 454. [Google Scholar]
  31. Reuter, D.J.; Robinson, J.B.; Dutkiewicz, C. (Eds.) Plant Analysis: An Interpretation Manual, 2nd ed.; CSIRO Publishing: Collingwood, Australia, 1997; p. 572. [Google Scholar]
  32. Khasawneh, F.E.; Doll, E.C. The use of phosphate rock for direct application to soils. Adv. Agron. 1978, 30, 159–206. [Google Scholar] [CrossRef]
  33. Jagtap, S.S. Diagnostic survey site selection using GIS for effective biological integrated control of highland banana pests. In Biological and Integrated Control of Highland Banana and Plantain Pests and Diseases; Gold, C.S., Gemmil, B., Eds.; proceedings of Research Coordination Meeting, 12–14 November 1991; IITA: Cotonou, Benin, 1993; pp. 25–36. [Google Scholar]
  34. Moreira, A.; Fageria, N.K. Yield, uptake, and retranslocation of nutrients in banana plants cultivated in upland soil of central Amazonian. J. Plant Nutr. 2009, 32, 443–457. [Google Scholar] [CrossRef]
  35. Okech, S.H.; Van Asten, P.A.J.; Gold, C.S.; Ssali, H. Effects of potassium deficiency, drought and weevils on banana yield and economic performance in Mbarara, Uganda. Uganda J. Agric. Sci. 2004, 9, 511–519. [Google Scholar]
  36. Wairegi, L.W.I.; Van Asten, P.J.A.; Tenywa, M.M.; Bekunda, M.A. Abiotic constraints overrides biotic constraints in East African highland banana systems. Field Crops Res. 2010, 146–153. [Google Scholar] [CrossRef]
  37. Van Asten, P.J.A.; Fermont, A.M.; Taulya, G. Drought is a major yield loss factor for rainfed East African highland banana. Agric. Water Manag. 2011, 98, 541–552. [Google Scholar] [CrossRef]
  38. Kayongo, S.N.; Sebuliba, J.M.; Nyombi, K. Responses of East African highland banana (EAHB-AAA) cultivars to drought stress. Uganda J. Agric. Sci. 2015, 16, 55–81. [Google Scholar] [CrossRef] [Green Version]
  39. Abd el Moniem, E.A.; Abd-Allah, A.S.E.; Ahmed, M.A. The combined effect of some organic manures, mineral N fertilizers and Algal cells extract on yield and fruit quality of Williams banana plants. Am. Eurasian J. Agric. Environ. Sci. 2008, 4, 417–426. [Google Scholar]
  40. Otinga, A.N.; Pypers, P.; Okalebo, J.R.; Njoroge, R.; Emong’ole, M.; Six, L.; Vanlauwe, B.; Merckx, R. Partial substitution of phosphorus fertilizer by farmyard manure and its localized application increases agronomic efficiency and profitability of maize production. Field Crops Res. 2013, 140, 32–43. [Google Scholar] [CrossRef]
  41. Baijukya, F.P.; de Ridder, N.; Masuki, K.F.; Giller, K.E. Nitrogen release from decomposing residues of leguminous cover crops and their effect on maize yield on depleted soils of Bukoba District, Tanzania. Plant Soil 2006, 279, 77–93. [Google Scholar] [CrossRef]
  42. Wairegi, L.W.I.; Van Asten, P.J.A. The agronomic and economic benefits of fertilizer and mulch use in highland banana systems in Uganda. Agric. Syst. 2010, 103, 543–550. [Google Scholar] [CrossRef] [Green Version]
  43. Vanlauwe, B.; Wendit, J.; Diels, J. Combined application of organic matter and fertilizer. In Sustaining Soil Fertility in West Africa; Tian, G., Ishinda, F., Keatinge, J.D.H., Eds.; SSSA Special Publication Number 58: Madison, WI, USA, 2001; pp. 247–280. [Google Scholar]
  44. Vanlauwe, B.; Batiano, A.; Chianu, J.; Giller, K.E.; Merckx, R.; Mokwunye, U.; Ohiokpehai, O.; Pypers, P.; Tabo, R.; Shepherd, K.D.; et al. Integrated soil fertility management-operational definition and consequences for implementation and dissemination. Outlook Agric. 2010, 39, 17–24. [Google Scholar] [CrossRef] [Green Version]
  45. Kihara, J.; Nziguheba, G.; Zingore, S.; Coulibaly, A.; Esilaba, A.; Kabambe, V.; Njoroge, S.; Pal, C.; Huising, J. Understanding variability in crop response to fertilizer and amendments in sub-Saharan Africa. J. Agric. Ecosyst. Environ. 2016, 229, 1–12. [Google Scholar] [CrossRef] [PubMed] [Green Version]
  46. Das, S.; Chou, M.L.; Jean, J.S.; Liu, C.C.; Yang, H.J. Water management impacts on arsenic behavior and rhizosphere bacterial communities and activities in a rice agro-ecosystem. Sci. Total Environ. 2016, 542, 642–652. [Google Scholar] [CrossRef] [PubMed]
  47. Teixeira, L.A.J.; Berton, R.S.; Coscione, A.R.; Saes, L.A.; Chiba, M.K. Agronomic efficiency of biosolid as a source of nitrogen to banana plants. Appl. Environ. Soil Sci. 2015, 1, 1–10. [Google Scholar] [CrossRef] [Green Version]
  48. Banful, B.; Dzietror, A.; Ofori, I.; Hemeng, O.B. Yield of plantain alley cropped with Leucaena leucocephala and Flemingia macrophylla in Kumasi, Ghana. Agrofor. Syst. 2000, 49, 189–199. [Google Scholar] [CrossRef]
  49. Bekunda, M.; Sanginga, N.; Woomer, P.L. Restoring soil fertility in Sub-Sahara Africa. Adv. Agron. 2010, 108, 183–236. [Google Scholar] [CrossRef]
  50. Tadesse, T.; Liben, M.; Asefa, A. Role of maize (Zea mays L.)-faba bean (Vicia faba L.) intercropping planting pattern on productivity and nitrogen use efficiency of maize in northwestern Ethiopia highlands. Int. Res. J. Agric. Sci. Soil Sci. 2012, 2, 102–112. [Google Scholar]
  51. Bista, D.R.; Heckathorn, S.A.; Jayawardena, D.M.; Mishra, S.; Boldt, J.K. Effects of drought on nutrient uptake and the levels of nutrient-uptake proteins in roots of drought-sensitive and-tolerant grasses. Plants 2018, 7, 28. [Google Scholar] [CrossRef] [Green Version]
  52. Yadav, M.K.; Patel, N.L.; Parmar, B.R.; Singh, K.; Singh, P. Effect of micronutrients on growth and crop duration of banana cv. Grand Nain. Prog. Hortic. 2010, 42, 162–164. [Google Scholar]
  53. Krishnamoorthy, V.; Hanif, N.A.K.A. Influence of micronutrients on growth and yield of banana. J. Krishi Vigyan 2017, 5, 87–89. [Google Scholar] [CrossRef]
  54. Jegadeeswari, D.; Dheebakaran, G.A.; Pand, V.K.P. Foliar application of micronutrients for enhancing productivity of banana under irrigated conditions through farmers’ participatory approach. Int. J. Chem. Stud. 2018, 6, 1094–1097. [Google Scholar]
  55. Bindu, B. Micronutrient mixture application in banana cv. Nendran (Musa AAB) for yield enhancement. J. Pharm. Phytochem. 2019, 8, 840–842. [Google Scholar]
  56. Bradford, K.J.; Hsiao, T.C. Physiological responses to moderate water stress. In Physiological Plant Ecology; Lange, O.L., Nobel, P.S., Osmond, C.B., Ziegler, H., Eds.; Springer: Berlin, Germany, 1982; pp. 263–324. [Google Scholar]
  57. Schimel, J.; Balser, T.C.; Wallenstein, M. Microbial stress-response physiology and its implications for ecosystem function. Ecology 2007, 88, 1386–1394. [Google Scholar] [CrossRef]
  58. Sanaullah, M.; Rumpel, C.; Charrier, X.; Chabbi, A. How does drought stress influence the decomposition of plant litter with contrasting quality in a grassland ecosystem? Plant Soil 2012, 352, 277–288. [Google Scholar] [CrossRef]
  59. Robredo, A.; Pérez-López, U.; Miranda-Apodaca, J.; Lacuesta, M.; Mena-Petite, A.; Muñoz-Rueda, A. Elevated CO2 reduces the drought effect on nitrogen metabolism in barley plants during drought and subsequent recovery. Environ. Exp. Bot. 2011, 71, 399–408. [Google Scholar] [CrossRef]
  60. He, M.; Dijkstra, F.A. Drought effect on plant nitrogen and phosphorus: A meta-analysis. New Phytol. 2014, 204, 924–931. [Google Scholar] [CrossRef]
  61. DaMatta, F.; Loos, R.A.; Silva, E.A.; Loureiro, M.E.; Ducatti, C. Effects of soil water deficit and nitrogen nutrition on water relations and photosynthesis of pot-grown Coffea canephora Pierra. Trees 2002, 16, 555–558. [Google Scholar] [CrossRef]
  62. Sardans, J.; Peñuelas, J.; Ogaya, R. Drought’s impact on Ca, Fe, Mg, Mo and S concentration and accumulation patterns in the plants and soil of a Mediterranean evergreen Quercus ilex forest. Biogeochemistry 2008, 87, 49–69. [Google Scholar] [CrossRef]
  63. Brown, C.E.; Pezeshki, S.R.; DeLaune, R.D. The effect of salinity and soil drying on nutrient uptake and growth of Spartina alterniflora in a simulated tidal system. Environ. Exp. Bot. 2006, 58, 140–148. [Google Scholar] [CrossRef]
  64. Funakawa, S.; Yoshida, H.; Watanabe, T.; Sugihara, S.; Kilasara, M.; Kosaki, T. Soil fertility status and its determining factors in Tanzania. In Soil Health and Land Management; Soriano, M.C.H., Ed.; InTech: Rijeka, Croatia, 2012; pp. 1–16. [Google Scholar]
  65. Choudhary, A.K.; Suri, V.K. Effect of organic manures and inorganic fertilizers on productivity, nutrient uptake and soil fertility in rice (Oryza sativa)-wheat (Triticum aestivum) crop sequence in western Himalayas. Curr. Adv. Agric. Sci. 2009, 1, 65–69. [Google Scholar]
  66. Martin-Prevel, P.; Gagnard, J.; Gautier, P. (Eds.) Banana Plant. Analysis as Guide to the Nutrient Requirements of Temperate and Tropical Crops; Lavoisier: New York, NY, USA, 1984; pp. 637–670. [Google Scholar]
Figure 1. Annual rainfall (a) and rainfall distribution pattern (b,c) in the experimental sites located along the altitudinal gradients on the slopes of Mount Kilimanjaro and Mount Meru in northern Tanzania.
Agronomy 10 00289 g001
Table 1. Salient features of the experimental sites.
CharacteristicsTarakeaLyamungoTengeru
Elevation (m.a.s.l.)160813461106
Geographical location03°02′17.0″ S; 037°35′24.9″ E03°13′49.6″ S, 037°14′55.9″ E03°02′17.0″ S, 037°35′24.9″ E
Top soil (30 cm surface layer) characteristics
Clay (%)46.0 ± 0.031.3 ± 0.740.0 ± 1.2
Silt (%)26.0 ± 1.230.0 ± 1.229.3 ± 3.7
Sand (%)28.0 ± 1.238.7 ± 0.730.7 ± 2.9
Textural classClayClay loamClay
pH H2O 1:2.55.9 ± 0.15.4 ± 0.06.5 ± 0.2
Total C (g kg−1)18.7 ± 2.422.2 ± 3.017.1 ± 2.5
Total N (g kg−1)1.2 ± 0.22.2 ± 0.11.4 ± 0.0
Available P (mg kg−1)6.9 ± 0.16.3 ± 0.07.9 ± 0.8
Exchangeable K (cmolc kg−1)0.9 ± 0.20.8 ± 0.13.4 ± 0.2
Exchangeable Mg (cmolc kg−1)3.5 ± 0.11.6 ± 0.14.9 ± 0.4
Exchangeable Ca (cmolc kg−1)11.0 ± 0.87.9 ± 0.524.0 ± 0.4
CEC22.8 ± 2.116.4 ± 0.844.1 ± 0.9
Soil profile characteristics (a) horizon depth (cm)
Horizon 1202018
Horizon 2504562
Horizon 3307055
Horizon 4407030
Relative soil depth140205165
(b) Soil color (when dry)
Horizon 1Dark brown 10 YR 3/3Dark brown 10 YR 3/4Brownish black 7,5 YR 3/2
Horizon 2Brownish black 10 YR 2/2Very dark brown 7,5 YR 2/3Black 10 YR 2/1
Horizon 3Brownish black 5 YR 2/2Brownish black 7,5 YR 2/2Brownish black 7,5 YR 2/2
Horizon 4Dark reddish brown 5 YR 3/4Dark brown 7,5 YR 3/4Dull yellow orange 11 YR 6/4
Classification (WRB-FAO)Endo-Eutric Calcic Vitric Andosol (Aric, Clayic, Sideralic)Luvic, Rhodic NitisolPhaeozem (Clayic, Humic, Geoabruptic)
Table 2. Fertilization treatments, nutrient sources and application rates.
Fertilization TreatmentsCattle Manure & Haulms Rate (kg ha−1 Year−1)Nutrients Supplied by Manure & Haulms (kg ha−1 Year−1)Nutrients Supplied by Mineral Fertilizer (kg ha−1 Year−1)
ManureHaulmsNPKNP2O5K2O
T1: No N (control) 0.00.00.00.00.00.0119471
T2: 77 kg N [urea (50% below optimum rate)]0.00.00.00.00.077119471
T3: 153 kg N [urea (optimum rate)]0.00.00.00.00.0153119471
T4: 230 kg N [urea (50% above optimum rate)]0.00.00.00.00.0230119471
T5: 77 kg N (urea) + 77 kg N (cattle manure)38,3180.077119471770.00.0
T6: 153 kg N [cattle manure (farmer’s practice)]76,6360.01532389420.00.00.0
T7: 77 kg N (urea) + 52 kg (bean haulms)0.01600525.04077119471
T8: 52 kg N (bean haulms)0.01600525.0400.0119471
Table 3. Mineral fertilizers applied mat−1 in each split.
Fertilization TreatmentsNutrient Fertilizer
(g mat−1 Year−1)
Fertilizer Source
(g mat−1 Year−1)
1st Split: at Planting
(g mat−1)
2nd Split 60 DAP
(g mat−1)
3rd Split 150 DAP
(g mat−1)
NP2O5K2OUreaTSPMOPUreaTSPMOPUreaTSPMOPUreaTSPMOP
T1: No N (control) 0.0552830.01205900.01201180.00.02360.00.0236
T2: 77 kg N [urea (50% below optimum rate)]465528310012059025120118250.0236500.0236
T3: 153 kg N [urea (optimum rate)]925528320012059050120118500.02361000.0236
T4: 230 kg N [urea (50% above optimum rate)]1385528330012059075120118750.02361500.0236
T5: 77 kg N (urea) + 77 kg N (cattle manure)460.00.01000.00.0250.00.0250.00.0500.00.0
T6: 153 kg N [cattle manure (farmer’s practice)]0.00.00.00.00.00.00.00.00.00.00.00.00.00.00.0
T7: 77 kg N (urea) + 52 kg (bean haulms)465528310012059025120118250.0236500.0236
T8: 52 kg N (bean haulms)0.0552830.01205900.01201180.00.02360.00.0236
Table 4. Effects of fertilization treatments on the growth and yield of Mchare banana at the three sites located along the altitudinal gradients in volcanic soils of the northern highlands, Tanzania.
FactorsPlant SizeCrop CycleFingersFinger WeightBunch WeightTotal Fruit Yield
(m3)(Days)Bunch−1(g)(kg)(t ha−1 Cycle−1)Increment (%) y
Sites
Tarakea (1608 m.a.s.l.)0.04 ± 0.002b400.61 ± 11.40b74.64 ± 2.54c220.59 ± 7.45b19.27 ± 1.07b33.76 ± 1.43b
Lyamungo (1346 m.a.s.l.)0.06 ± 0.003a397.73 ± 6.11b107.99 ± 2.67a235.82 ± 7.23a28.03 ± 1.30a47.79 ± 2.21a
Tengeru (1106 m.a.s.l.)0.04 ± 0.002b412.77 ± 7.49a87.66 ± 2.47b170.74 ± 5.54c17.06 ± 0.92c28.88 ± 1.52c
Fertilization treatments
T1: No N (control) 0.03 ± 0.002d462.48 ± 6.79a71.16 ± 4.27f165.04 ± 8.48e13.81 ± 1.00g23.90 ± 1.57g-
T2: 77 kg N [urea (50% below optimum rate)]0.04 ± 0.003c422.03 ± 8.66c87.47 ± 5.87d195.04 ± 11.37d19.38 ± 1.77e33.43 ± 2.98e28.5
T3: 153 kg N [urea (optimum rate)]0.05 ± 0.002b383.43 ± 3.81c94.88 ± 5.26c230.43 ± 12.23b24.02 ± 2.09c40.85 ± 3.60c41.5
T4: 230 kg N [urea (50% above optimum rate)]0.05 ± 0.003b395.00 ± 4.85c92.72 ± 5.42cd216.64 ± 10.99c22.34 ± 1.70d38.38 ± 2.64d37.7
T5: 77 kg N (urea) + 77 kg N (cattle manure)0.06 ± 0.004a354.94 ± 2.79d107.54 ± 4.67a247.74 ± 11.07a29.30 ± 1.93a50.65 ± 3.40a52.8
T6: 153 kg N [cattle manure (farmers practice)]0.06 ± 0.004a356.36 ± 4.11d101.19 ± 5.63b247.89 ± 12.06a27.54 ± 2.01b47.42 ±3.31b49.6
T7: 77 kg N (urea) + 52 kg N (bean haulms) z0.05 ± 0.002b406.75 ± 8.27b87.14 ± 5.41d198.02 ± 9.85d19.49 ± 1.88e32.84 ± 2.92e27.2
T8: 52 kg N (bean haulms)0.04 ± 0.003c448.62 ± 11.69a78.68 ± 5.13e171.59 ± 10.02e15.73 ± 1.50f27.05 ± 2.55f11.2
2-Way ANOVA (F-Statistics)
Site61.51 ***3.24 *168.25 ***133.03 ***390.22 ***2137.97 ***
Fertilization treatments28.97 ***39.56 ***30.68 ***44.15 ***127.46 ***727.49 ***
Site* fertilization treatments1.74 ns1.79 ns0.45 ns0.62 ns2.80 **18.19 ***
Values presented are means ± SE; *, **, and *** indicates differences at p = 0.05, p < 0.01 and p < 0.001 respectively; ns = not significant at p = 0.05; SE = standard error; z = maximum bean haulms attained in banana-bean intercropping ha−1; y = yield increase was calculated by dividing the difference between the yield attained in respective fertilization technique (T2–T8) and control (T1) multiplied by 100. Means with similar letters in the same column are not significantly different at p = 0.05.
Table 5. Effects of fertilization treatments on nutrient concentrations in the third fully open leaf of nine month old Mchare plants at three sites located along the altitudinal gradients in volcanic soils of the northern highlands, Tanzania.
FactorsN P K MgCaBCuFeZn
(%)(mg kg−1)
Sites
Tarakea (1608 m.a.s.l.)3.4 ± 0.05b 0.22 ± 0.00b3.3 ± 0.14b0.5 ± 0.02a1.3 ± 0.04b11.1 ± 0.12b6.4 ± 0.12b148.0 ± 6.90a12.6 ± 0.32c
Lyamungo (1346 m.a.s.l.)3.6 ± 0.04a0.24 ± 0.00a3.5 ± 0.06a0.5 ± 0.02a1.5 ± 0.06a10.2 ± 0.19c8.9 ± 0.16a105.4 ± 6.71b13.7 ± 0.29b
Tengeru (1106 m.a.s.l.)3.2 ± 0.08c0.20 ± 0.00c 3.0 ± 0.06c0.4 ± 0.01b0.9 ± 0.02c24.4 ± 0.98a5.9 ± 0.22b126.3 ± 3.44ab15.2 ± 0.22a
Fertilization treatments
T1: Zero N (control) 3.1 ± 0.14d0.22 ± 0.01a3.5 ± 0.16ab0.4 ± 0.03a1.1 ± 0.06c15.5 ± 2.29b6.6 ± 0.68a121.3 ± 9.80a13.5 ± 0.63ab
T2: 77 kg N [from urea (50% below optimum rate)]3.5 ± 0.04b0.22 ± 0.01a3.0 ± 0.18b0.5 ± 0.03a1.3 ± 0.10a14.4 ± 2.10c6.9 ± 0.52a120.4 ± 8.64a13.6 ± 0.52ab
T3: 153 kg N [from urea (optimum rate)]3.6 ± 0.02b0.22 ± 0.01a3.1 ± 0.14ab0.5 ± 0.04a1.4 ± 0.14a14.6 ± 2.12c7.4 ± 0.48a142.0 ± 17.75a13.8 ± 0.53ab
T4: 230 kg N [from urea (50% above optimum rate)]3.8 ± 0.04a0.22 ± 0.01a3.1 ± 0.18ab0.5 ± 0.04a1.3 ± 0.08a13.1 ± 1.14d7.1 ± 0.52a118.5 ± 10.87a13.8 ± 0.48ab
T5: 77 kg N (from urea) + 77 kg N (from cattle manure)3.4 ± 0.10c0.22 ± 0.01a3.7 ± 0.11a0.4 ± 0.02a1.0 ± 0.05c15.8 ± 2.57b7.4 ± 0.44a132.0 ± 15.32a14.9 ± 0.53a
T6: 153 kg N [from cattle manure (farmers practice)]3.3 ± 0.04c0.22 ± 0.00a3.6 ± 0.13ab0.4 ± 0.02a1.0 ± 0.06c18.2 ± 4.11a7.0 ± 0.31a126.4 ± 11.48a14.9 ± 0.48a
T7: 77 kg N (from urea) + 52 kg N (Common bean haulms) z3.5 ± 0.06b0.22 ± 0.01a3.1 ± 0.14ab0.5 ± 0.04a1.4 ± 0.16a14.1 ± 1.62c7.3 ± 0.61a131.1 ± 8.08a13.5 ± 0.52ab
T8: 52 kg N (common bean haulms)2.9 ± 0.08e0.22 ± 0.01a3.2 ± 0.15ab0.4 ± 0.04a1.2 ± 0.11b16.0 ± 2.43b6.6 ± 0.70a121.0 ± 3.29a12.7 ± 0.68b
2-Way ANOVA (F-Statistics)
Site160.0 **61.65 ***8.446 **7.912 *361.96 ***4917.74 **108.63 ***11.30 ***29.97 ***
Fertilization treatment165.7 **1.16 ns3.168 *2.102 ns32.82 ***71.16 **1.68 ns0.60 ns3.69 *
Site* fertilization treatment31.9 **2.33 *0.684 ns2.033 *13.22 ***91.60 **2.16 *0.56 ns1.76 ns
Nitrogen fertilizer sources: urea, cattle manure and common bean haulms. Values presented are means ± SE; *, **, and *** indicates differences at p = 0.05, p < 0.01. and p < 0.001, respectively; SE = standard error; MAP = months after planting; z = maximum common bean haulms attained under banana-bean intercropping ha−1; ns = not significant. Means with similar letters are not significantly different at p = 0.05.
Table 6. Effects of fertilization treatments on total nutrient contents in the above ground biomass of Mchare banana at harvest at three sites located along the altitudinal gradients in volcanic soils of the northern highlands, Tanzania.
FactorsNPKMgCaS
(g Plant−1)
Sites
Tarakea (1608 m.a.s.l.)130.68 ± 9.03a14.47 ± 0.50b571.66 ± 32.36a35.54 ± 1.78b77.36 ± 4.78a7.80 ± 0.32b
Lyamungo (1346 m.a.s.l.)130.70 ± 7.86a17.08 ± 0.48a575.48 ± 27.99a40.80 ± 1.75a77.98 ± 4.16a9.54 ± 0.54a
Tengeru (1106 m.a.s.l.)110.71 ± 6.79b13.08 ± 0.32c509.91 ± 27.80b32.76 ± 1.46c72.98 ± 5.60b7.06 ± 0.20c
Fertilization treatments
T1: No N (control) 81.34 ± 2.00f12.38 ± 0.48d364.26 ± 6.31g25.89 ± 0.56f49.76 ± 2.52g6.22 ± 0.22e
T2: 77 kg N [urea (50% below optimum rate)]94.34 ± 2.98e14.46 ± 0.49c449.84 ± 15.38e31.60 ± 1.18e54.63 ± 1.61f6.98 ± 0.14d
T3: 153 kg N [urea (optimum rate)]134.31 ± 6.30c16.06 ± 0.80b589.30 ± 13.26c38.86 ± 1.73c82.95 ± 3.54c8.04 ± 0.29bc
T4: 230 kg N [urea (50% above optimum rate)]133.43 ± 7.62c14.82 ± 0.58c541.01 ± 2.40d38.68 ± 1.70c76.21 ± 1.10d8.48 ± 0.54b
T5: 77 kg N (urea) + 77 kg N (cattle manure)182.26 ± 6.00a17.67 ± 0.90a809.76 ± 17.38a49.85 ± 1.44a112.88 ± 2.12a10.82 ± 0.88a
T6: 153 kg N [cattle manure (farmers practice)]176.42 ± 4.78b17.42 ± 0.72a703.20 ± 16.82b43.74 ± 1.16b108.10 ± 3.66b10.36 ± 0.76a
T7: 77 kg N (urea) + 52 kg (bean haulms) z100.38 ± 3.94d14.08 ± 0.61c533.77 ± 24.94d34.97 ± 2.22d66.48 ± 2.18e7.41 ± 0.35c
T8: 52 kg N (bean haulms)89.72 ± 3.16e12.09 ± 0.61d427.62 ± 12.73f27.36 ± 1.19f57.90 ± 2.86f6.72 ± 0.20de
2-Way ANOVA (F-Statistics)
Site289.8 **150.81 ***444.4 **172.81 ***33.36 ***173.82 ***
Fertilization treatment1257.4 **59.81 ***2677.0 **257.61 ***963.74 ***113.11 ***
Site* fertilization treatment46.1 **2.52 *61.6 **10.51 ***43.52 ***16.81 ***
Values presented are means ± SE; *, **, and *** indicates differences at p = 0.05, p < 0.01 and p < 0.001, respectively; SE = standard error; z = maximum bean haulms attained in banana-bean intercropping ha−1. Means with similar letters in the same column are not significantly different at p = 0.05.
Table 7. Effects of fertilization treatments on total nutrient contents in the above ground biomass of Mchare banana at harvest at three sites located along the altitudinal gradients in volcanic soils of the northern highlands, Tanzania.
FactorsBCuMnFeZn
(mg Plant−1)
Sites
Tarakea (1608 m.a.s.l.)118.46 ± 4.59b53.13 ± 1.88b1590.54 ± 49.96b1085.67 ± 39.45b124.50 ± 5.24c
Lyamungo (1346 m.a.s.l.)131.98 ± 4.67a64.37 ± 2.66a1983.65 ± 118.32a1261.68 ± 38.75a178.04 ± 7.76a
Tengeru (1106 m.a.s.l.)106.32 ± 3.54c43.21±1.52c1353.75 ± 44.58c925.01 ± 32.78c132.57 ± 5.09b
Fertilization treatments
T1: No N (control) 89.26 ± 1.68g38.15 ± 2.17g1079.96 ± 18.58g785.04 ± 35.62g99.77 ± 5.02f
T2: 77 kg N [urea (50% below optimum rate)]109.32 ± 4.73e50.22 ± 2.91e1456.31 ± 72.08e1002.22 ± 47.98e125.10 ± 5.58e
T3: 153 kg N [urea (optimum rate)]126.70 ± 4.58c58.04 ± 3.44c1720.00 ± 131.21c1144.02 ± 54.22c159.30 ± 9.30b
T4: 230 kg N [urea (50% above optimum rate)]118.88 ± 3.34d55.43 ± 4.23d1881.17 ± 140.81b1121.66 ± 53.94c148.14 ± 9.50c
T5: 77 kg N (urea) + 77 kg N (cattle manure)143.98 ± 3.62b64.91 ± 4.37b2053.16 ± 161.84a1266.26 ± 61.26b184.28 ± 10.84a
T6: 153 kg N [cattle manure (farmers practice)]149.71 ± 6.05a67.60 ± 3.63a2025.28 ± 148.06a1379.68 ± 41.36a185.94 ± 11.32a
T7: 77 kg N (urea) + 52 kg (bean haulms) z118.31 ± 3.14d50.28 ± 2.86e1629.16 ± 105.79d1083.12 ± 56.91d136.42 ± 8.76d
T8: 52 kg N (bean haulms)95.21 ± 4.66f43.92 ± 1.64f1296.12 ± 33.41f944.27 ± 48.56f121.32 ± 7.66e
2-Way ANOVA (F-Statistics)
Site470.9 ***999.15 ***1806.4 **1655.1 ***1116.01 ***
Fertilization treatment485.6 ***334.91 ***812.0 **753.2 ***467.14 ***
Site* fertilization treatment14.2 ***18.40 ***132.4 **16.3 ***13.42 ***
Values presented are means ± SE; ** and *** indicates differences at p < 0.01 and p < 0.001, respectively; SE = standard error; z = maximum bean haulms attained in banana-bean intercropping ha−1.
Table 8. Effects of fertilization treatments on the efficiency of N fertilizer applied to the crop.
FactorsInternal Efficiency
(kg Fingers kg N Uptake−1)
Utilization Efficiency
(%)
Sites
Tarakea (1608 m.a.s.l.)51.08 ± 5.26b32 ± 0.04a
Lyamungo (1346 m.a.s.l.)87.64 ± 4.87a34 ± 0.04a
Tengeru (1106 m.a.s.l.)50.39 ± 5.03b25 ± 0.03b
Fertilization treatments
T1: No N (control) --
T2: 77 kg N [urea (50% below optimum rate)]59.04 ± 7.51d16 ± 0.02c
T3: 153 kg N [urea (optimum rate)]75.88 ± 9.16b28 ± 0.03b
T4: 230 kg N [urea (50% above optimum rate)]67.52 ± 7.29c18 ± 0.02c
T5: 77 kg N (urea) + 77 kg N (cattle manure)90.67 ± 5.72a54 ± 0.02a
T6: 153 kg N [cattle manure (farmers practice)]76.74 ± 3.69b52 ± 0.02a
T7: 77 kg N (urea) + 52 kg (bean haulms) z51.65 ± 6.26e29 ± 0.04b
T8: 52 kg N (bean haulms)19.75 ± 6.26f14 ± 0.02c
2-Way ANOVA (F-Statistics)
Site408.71 ***50.06 ***
Fertilization treatment202.84 ***259.49 ***
Site * fertilization treatment10.29 ***20.15 ***
Values presented are means ± SE; ** indicates differences at p < 0.01; SE = standard error; z = maximum bean haulms attained in banana-bean intercropping ha−1.
Table 9. Pearson’s correlation coefficients (r) between the total nutrient contents in the above ground biomass of Mchare banana plant at harvest and (i) annual precipitation, (ii) yield, and (iii) total N contents.
Total Nutrient Contents in the above Ground Biomass
NPKCaMgSBCuFeMnZn
Annual precipitation0.95 **0.88 **0.86 **0.74 **0.86 **0.79 **0.83 **0.88 **0.53 *0.92 **0.94 **
Yield0.95 **0.87 **0.88 **0.80 **0.88 **0.77 **0.85 **0.91 **0.54 *0.96 **0.93 **
Total N contents in the above ground biomass 10.56 **0.58 **0.62 **0.34 **0.46 **0.47 **0.40 **0.19 ns0.18 ns0.30 **
* and ** indicates significance at p = 0.05 and 0.01 respectively; ns = not significant at p = 0.05.
Table 10. Pearson’s correlation coefficients (r) between the annual precipitation and plant characteristics of Mchare.
Plant SizeCrop CycleHands per BunchFingers per BunchFinger WeightYield
Annual precipitation0.96 **0.22 ns0.81 **0.86 **0.75 **0.99 **
Yield0.94 **−0.68 *0.82 *0.85 *0.88 *1
* and ** indicates significance at p = 0.05 and 0.01 respectively; ns = not significant at p = 0.05.

