Effect of Drought Stress at Reproductive Stages on Growth and Nitrogen Metabolism in Soybean

Soybean Research Institute, Shenyang Agricultural University, Shenyang 110866, China
*
Author to whom correspondence should be addressed.
Agronomy 2020, 10(2), 302; https://0-doi-org.brum.beds.ac.uk/10.3390/agronomy10020302
Submission received: 9 February 2020
/
Revised: 14 February 2020
/
Accepted: 18 February 2020
/
Published: 20 February 2020
(This article belongs to the Special Issue Functional Metabolism in Crops/Agronomy)
Abstract
:This study aims to determine variability among soybean (Glycine max (L.) Merr.) cultivars under drought conditions and how nitrogen metabolites, metabolism-related enzymes, and gene expression vary during soybean growth. Three soybean cultivars, Shennong17 (CV.SN17), Shennong8 (CV.SN8), and Shennong12 (CV.SN12), were grown in pot culture and subjected to drought stress at reproductive stages for 45 days. The results showed that long-term drought stress decreased biomass allocation to reproductive organs, weakened antioxidant capacity, and reduced seed weight, effects that were less pronounced in CV.SN12 compared with those in CV.SN8 and CV.SN17. Drought stress decreased the concentrations of nitrogen and soluble protein but increased nitrate concentration in leaves. This was related to the significantly reduction of nitrogen metabolism efficiency, including decreased activities of nitrogen metabolism enzymes, and downregulated expression of GmNR, GmNiR, GmGS, and GmGOGAT. Drought stress increased the concentrations of free amino acid, proline, and soluble sugar in leaves to enhance the osmotic adjustment ability. Furthermore, soybean seed weight showed significantly correlation (p < 0.05) with nitrogen-metabolism-related parameters. Based on the performance of growth, nitrogen metabolism, and yield attributes, CV.SN12 showed the highest tolerance to drought, followed by CV.SN8 and CV.SN17. In addition, these nitrogen-metabolism-related parameters could be used in soybeans to select for drought tolerance.
1. Introduction
Drought stress is one of the most unfavorable environmental stress factors and can severely reduce crop yield and quality [1,2]. Drought stress can interfere with numerous physiological processes, including oxidative stress [3], membrane integrity [4], and enzyme activity [5], all of which could lead to plant growth inhibition. During reproductive stages, source organs (mainly mature leaves) transport carbohydrates and energy to sink organs (mainly seeds) to promote the seeds development and growth. Drought stress occurring at reproductive stages could negatively affect seed size, weight, and composition as well as final crop yield [6,7]. Therefore, understanding the effect of drought stress at reproductive stages on physiological and molecular mechanisms of crops is beneficial to grain yield improvement.
Plants have evolved various mechanisms, including changing morphological structure, regulating water transport, regulating nutrient synthesis and redistribution, superoxide anion scavenging mechanism, osmotic substance regulation, and hormone regulation, to adapt to adverse conditions [8,9]. It has been extensively reported that drought stress induces reactive oxygen species (ROS) accumulation. Excessive ROS results in oxidative damage to cell structures, cell metabolism, and macromolecules, such as membrane lipids, nucleic acids, and proteins [1,10]. Thus, in order to keep the balance between ROS production and scavenging, plants develop scavenging mechanisms to effectively diminish ROS damage, involving both enzymatic and nonenzymatic antioxidants. Superoxide dismutase (SOD), peroxidases (POD), and catalase (CAT) are most important enzymatic systems for ROS scavenging and are also important parameters for estimating drought resistance of plants [11,12,13]. These antioxidant enzyme-mediated ROS scavenging mechanisms are the first line of defense against drought stress, directly reflecting the effects of drought stress on plants. However, the ability of plants to use antioxidant enzyme activity to alleviate drought stress varies among cultivars, plant growth stages, and even among different drought stress conditions [3,4,14,15]. Effective antioxidant capacity is crucial to maintain the balance between ROS production and scavenging and to alleviate the adverse effects of drought stress on plants’ physiological metabolism and growth.
Many studies have shown that regulation of nitrogen (N) metabolism is closely related to drought stress response in plants [16,17,18]. N is an essential nutrient element for plant growth and development. N metabolism is one of the most basic physiological processes and determines crop growth, quality, and yield [19,20]. N is mainly absorbed by plant roots in the form of NO3− and transported to leaves for N assimilation. NO3− is reduced to NO2− by nitrate reductase (NR; EC 1.6.6.1) in the cytoplasm. NO2− is transported to the chloroplast, and then transformed into NH4+ by nitrite reductase (NiR; EC 1.7.2.1). NH4+ is converted to glutamate and glutamine through the glutamine synthetase (GS; EC 6.3.1.2), glutamate synthetase (GOGAT; EC 1.4.7.1), and glutamate dehydrogenase pathways [21]. Since the accumulation of NO2− and NH4+ in the nitrogen metabolism process is toxic to plant cells [22], maintaining the activities of key enzymes, such as NR, NiR, GS, and GOGAT, in the process of nitrogen metabolism is crucial to plant growth and development. Drought stress conditions usually decrease activities of NR and NiR enzymes [23,24,25], which leads to NO3− accumulation. The activities of GS and GOGAT are also related to drought stress response and they are often regarded as important metabolic indicators of drought tolerance [26,27]. For example, Nagy et al. [26] showed that drought stress decreased the activities of glutamine synthetase isoenzymes in sensitive wheat, while no change was found in those tolerance genotypes.
N assimilation products not only act as energy sources but also function as signaling molecules in a variety of physiological metabolism processes and play important roles in plant growth and development [24,28]. Proline is one of important products in nitrogen metabolism and plays an important role in maintaining the integrity of the cytomembrane and protein structure. Furthermore, proline and some other nitrogen compounds are important osmotic adjustment (OA) substances involved in various metabolic pathways in response to abiotic stress [29,30,31], including maintaining cell turgor and subcellular structures, quenching free radicals, and buffering cellular redox potential [29]. Accumulation and synthesis of compatible solutes (amino acids and soluble sugars) and ions (NO3−) are considered as main contributors to OA in plants under drought stress [29,32]. Moreover, previous studies have shown that nitrogen assimilation products, including NO3−, NH4+, and proline, can regulate the selective absorption and transport of ions in plants and play an important role in maintaining the dynamic balance of physiological metabolism in plants under abiotic stress [33,34,35].
Soybean (Glycine max (L.) Merr.) is an important legume cash crop and is widely cultivated around the world [36,37]. The balance between N accumulation and distribution during soybean reproductive stages is important to grain yield and quality [20]. During the reproductive stages, various energy substances such as amino acids and sugars are rapidly transported, synthesized, and stored in seeds. This process requires sufficient water supply. Previous studies have shown that drought stress at reproductive stages significantly decreases soybean grain yield or even results in no harvest [38,39,40].
In this study, three soybean cultivars with similar maturity, Shennong17 (CV.SN17), Shennong8 (CV.SN8), and Shennong12 (CV.SN12), were used to (1) elucidate the relationships between nitrogen metabolism and seed weight and (2) investigate the physiological, molecular, and enzymatic performance of these cultivars as a response to drought stress during reproductive stages.
2. Materials and Methods
2.1. Experimental Design and Treatment
This pot cultivation experiment was conducted at the experimental station of Shenyang Agricultural University (41°82′N, 123°57′E) in Liaoning Province, China from May to September 2018. Three soybean cultivars, ‘Shennong17′ (CV.SN17, 44.26% protein (dry base) and 20.77% oil), ‘Shennong8′ (CV.SN8, 42.89% protein and 20.40% oil), and ‘Shennong12′ (CV.SN12, 38.89% protein and 22.09% oil), which have similar maturity, were used in this study. Average-sized soybean seeds were selected and planted directly into pots (25 × 30 × 25 cm) with 12.5 kg of soil per pot, but not inoculated with diazotrophs. To simulate field conditions, the pot-culture experiments were carried out under open field conditions. The soil properties were as follows: soil organic matter 16.77 g kg−1, total nitrogen 0.77 g kg−1, available nitrogen 0.07 g kg−1, available phosphorus 0.02 g kg−1, and available potassium 0.14 g kg−1). Experiments were conducted according to a randomized complete block design with three replicates. Each pot contained two plants of the same treatment, which were together considered as one experimental unit.
All pots were equally watered by drip irrigation to keep the soil moist at 70%–80% of the field water-holding capacity until 50% of the flowers on the main stems of soybean were open (R2 growth stage, according to Fehr et al. [41]). Before drought stress treatment, all pots were treated with covering 2 m above ground with transparent plastic sheets in case of rain. Then, the soybean plants were subjected to the following two water treatments: soil relative water content of 70%–80% (control, CK) and 35%–40% (drought stress, DS). The soil water levels were monitored using a soil moisture probe (Field Scout TDR 300 Probe, Spectrum Technologies, Inc., Aurora, IL, United States) every day according to the manufacturer’s protocol. The first day after the drought stress treatment, i.e., the day after flowering (DAF), was recorded as 1 DAF, and the drought stress treatment lasted for 45 days. Leaf samples were taken at 15, 30, and 45 DAF, which represented the beginning of the seed formation phase (15 DAF, R4 growth stage), the start of the grain filling phase (30 DAF, R5 growth stage), and the rapid grain filling phase (45 DAF, R6 growth stage).
2.2. Sampling
The upper third fully expanded leaf on each plant (from the top of the main stem) was collected to measure leaf physiological and biochemical parameters and all samples were obtained between 09:30 and 11:00. Leaf samples were divided into two parts from the main veins, and one half was flash-frozen in liquid nitrogen prior to storage at −80 °C for gene expression analysis, enzyme activity assays, and protein, free amino acids, and proline concentration measurement. The second part was oven-dried at 105 °C for 30 min, and maintained at 85 °C until the weight was constant to determine soluble sugar, nitrogen, and nitrate concentrations.
2.3. Agronomic Traits Measurement
At maturity, aboveground parts of soybean plants were cut at the node of the cotyledon and were used as shoot samples for stem biomass, pod number, seed number, pod wall weight, and seed weight measurement. The roots were thoroughly rinsed and cleaned from all soil. Shoot and root samples were oven-dried at 105 °C for 30 min and further dried at 85 °C until constant weight.
2.4. Measurement of Nitrogen and Nitrate Concentrations
Leaf total N concentration was measured following the H2SO4-H2O2 Kjeldhal digestion method.
The nitrate (NO3−) concentration was determined as described by Patterson et al. [42]. Briefly, fine powder of leaf tissue (0.1 g) was added to 1 mL of deionized water and incubated for 45 °C for 1 h. The homogenate was centrifuged at 5000× g for 15 min at 20 °C. A total of 0.2 mL of supernatant was taken for NO3− determination and mixed with 0.8 mL of 5% (w/v) salicylic acid in H2SO4 at 96%. The NO3− concentration was measured with a spectrophotometer at A410 nm.
2.5. Measurement of Soluble Protein, Free Amino Acid, Proline, and Soluble Sugar Concentrations
The soluble protein concentration was determined by the Brilliant Blue G-250 regent with bovine serum albumin (BSA) as a standard according to Bradford [43].
Concentrations of free amino acid and proline were analyzed by the methods according to Bates et al. [44]. Frozen leaf tissues (0.5 g) were homogenized in 10 mL of 3% aqueous sulfosalicylic acid. After filtering the homogenate, 2 mL of filtrate was mixed with 2 mL glacial acetic acid and 2 mL acidic ninhydrin. The reaction mixture was incubated at 100 °C for 1 h and then cooled on the ice for 20 min before extraction with 4 mL toluene. The concentrations of free amino acids and proline were measured with a spectrophotometer at A580 nm and A520 nm, respectively.
Total soluble sugar concentration was determined by the methods according to Hendrix and Donald [45]. Dried leaf tissues (0.1 g) were added in 5 mL of 80% (v/v) ethanol and incubated in a water bath at 80 °C for 30 min, followed by centrifugation at 10,000 × g for 10 min. The residue was extracted two more times using 80% ethanol. The three supernatants were combined and 80% ethanol was added to a total volume of 5 mL. The soluble sugar concentration was determined spectrophotometrically at A620 nm wavelength.
2.6. N-Metabolizing Enzymes Extraction and Analysis
The enzymes nitrate reductase (NR, EC 1.6.6.1), nitrite reductase (NiR, EC 1.7.2.1), and glutamine synthetase (GS, EC 6.3.1.2) were extracted following Ding et al. [46]. First, frozen leaf tissues (0.3 g) were homogenized in cold extraction buffer containing 4 mL of 0.1 M phosphate buffer (pH 7.5) prepared by mixing NaH2PO4·2H2O and Na2HPO4·12H2O. The homogenate was centrifuged at 12,000× g for 20 min at 4 °C.
The reaction buffer to measure NR activity contained 0.4 mL nicotinamide adenine dinucleotide (NADH), 1.2 mL of 0.1 M KNO3, and 0.4 mL extract. The reaction was initiated by incubating the enzyme at 25 °C for 30 min and terminated using 1 mL sulfanilamide. Then, 1 mL of 1% N-1-naphthyl ethylene diamine dihydrochloride was added into the samples. The samples were incubated at room temperature for 15 min and then centrifuged at 12,000× g for 10 min. NR activity was determined colorimetrically at A540 nm, as in Hageman and Reed [47], based on the reduction of nitrate to nitrite at 25 °C for 30 min. NR activity was calculated from the standard curve of nitrite nitrogen.
The reaction buffer to measure NiR activity contained 0.4 mL of 0.1 M potassium phosphate buffer (pH 7.4), 0.1 mL of 15 mM sodium nitrite, 0.2 mL of 5 mM methyl viologen, 0.2 mL of 86.15 mM sodium dithionite in a 190 mM NaHCO3 and 0.1 mL extract. The reaction was terminated by a violent agitation on vortex after 30 min incubation. Then, the absorbance of supernatant was measured at A540 nm according to Singh et al. [34]. NiR activity was expressed in terms of μmol NO2− reduced g−1 FW h−1.
The reaction buffer to measure GS activity contained 0.2 mL of 0.3 M Na-glutamate, 0.3 mL of 0.25 M imidazole-HCl (pH 7.0), 0.1 mL of 0.5 M MgSO4, 0.2 mL of 0.03 M Na-ATP (pH 7.0), and 0.6 mL extract. The reaction was initiated by incubating the enzyme at 25 °C for 5 min, and then 0.1 mL of 1.0 M hydroxylamine was added. After incubating the mixture at 25 °C for 5 min, the reaction was stopped using 0.4 mL mixed reagent (10% FeCl3·6H2O, 50% (v/v) HCl, and 24% (w/v) trichloroacetic acid). The mixture was incubated at 25 °C for 20 min to change color and then centrifuged at 15,000× g for 10 min. The absorbance of supernatant was measured at A540 nm according to Zahoor et al. [32]. GS activity was calculated from the standard curve of c-glutamyl hydroxamate.
Glutamate synthase (GOGAT; EC 1.4.7.1) was extracted following Singh and Srivastava [48]. Frozen leaf tissues (0.1 g) were homogenized in 0.2 M sodium phosphate buffer (pH 7.5) extraction buffer containing 2 mM EDTA, 50 mM KCl, 0.1% (v/v) mercaptoethanol and 0.5% (v/v) Triton X 100. The homogenate was centrifuged at 6000× g for 20 min at 4 °C. The reaction buffer (3 mL) to measure GOGAT activity contained 20 mM L-glutamine, 5 mM 2-oxoglutarate, 100 mM KCl, 25 mM sodium phosphate buffer (pH 7.3) containing 1 mM EDTA, and 0.3 mL extract. The decrease in absorbance was determined at A340 nm for 5 min. GOGAT activity was calculated by standard curve prepared with NADH and expressed in terms of µmol NADH oxidized g−1 FW h−1.
2.7. Antioxidant Enzymes Activities and MDA Concentration
The enzymes SOD (EC 1.15.1.1), POD (EC 1.11.1.7), and CAT (EC 1.11.1.6) were extracted following de Azevedo Neto et al. [49]. First, frozen leaf tissues (0.5 g) were homogenized in cold extraction buffer containing 5 mL of 50 mM sodium phosphate buffer (pH 7.8 for SOD and POD, and pH 7.0 for CAT), 0.1 mM Na2EDTA, and 1% (w/v) PVP. The homogenate was centrifuged at 12,000× g for 20 min at 4 °C.
The reaction buffer to measure SOD activity contained 50 mM PBS (pH 7.8), 0.1 mM EDTA, 13 mM methionine, 75 μM NBT, 2 μM riboflavin, and 0.1 mL extract. Then, the absorbance of supernatant was measured at A560 nm according to Giannopolitis and Ries [50]. One unit of SOD activity was considered as the amount of enzyme inhibiting 50% of NBT photoreduction.
The reaction buffer to measure POD activity contained 100 mM PBS (pH 6.0), 20 mM of guaiacol, 40 mM of H2O2, and 0.1 mL extract. Then, the absorbance of supernatant was measured at A460 nm according to Chance and Maehly [51]. One unit of POD activity was defined as change of absorbance of 0.01 units min−1.
The reaction buffer to measure CAT activity contained 19 mM H2O2 in 50 mM PBS (pH 7.8) and 0.1 mL extract. Then, the absorbance of supernatant was measured at A240 nm according to Havir and McHale [52]. One unit of CAT activity was considered as the amount of enzyme catalyzing the H2O2 decomposition per minute.
The MDA level was determined by 2-thiobarbituric acid (TBA) test as described by Havir and McHale [52].
2.8. RNA Extraction and Complementary DNA Synthesis
Total RNA was isolated from each soybean leaf sample using a MiniBEST Universal RNA Extraction Kit (Takara, Kusatsu, Japan) according to the manufacturer’s protocol. RNA quantity and integrity were checked by optical density at 260 nm and 1.0% agar gel electrophoresis, respectively. Single-stranded cDNA was synthesized from 1 μg of total RNA using a PrimeScriptTM RT Reagent Kit (Perfect Real Time) (Takara, Kusatsu, Japan).
2.9. Gene Expression by qRT-PCR
For each sample, 1 μL of a reaction mixture was used for qRT-PCR in a 20 μL total reaction volume using TransScript® Top Green qPCR SuperMix (TransScript, Beijing, PR China). Two reference genes, GmEF1a and GmEF1b, were selected for examination in this study [53]. The following thermal cycle conditions were used: 95 °C for 1 min, followed by 39 cycles of 95 °C for 5 s, 58 °C for 20 s, and 60 °C for 20 s. The relative expression was determined according to the 2−△△Ct method. The gene-specific primers are listed in Table 1.
2.10. Statistical Analysis
The data were analyzed using a two-way analysis of variance (ANOVA) for dry matter accumulation and seed yield (Table 2 and Table 3) and a three-way ANOVA for physiological parameters Table 4), as implemented in SPSS version 17.0 (SPSS Inc., Chicago, IL, USA). The differences between the means were compared using Tukey’s multiple range test (at a p < 0.05 significance threshold), with significant differences indicated by different letters above the bars in each figure. The correlations between seed weight with physiological parameters in soybean leaves were assessed via Pearson’s product-moment correlation [54]. The data presented are means (± SD) of three independent experiments.
3. Results
3.1. Effect of Drought Stress on Dry Matter Accumulation and Seed Yield
Two-way ANOVA analysis revealed that treatment (T), genotype (G), and their interaction significantly affected the dry matter accumulation and seed yield (Table 2). Three soybean cultivars showed different yield and yield component performances both under control and drought stress conditions. Drought stress during reproductive stages significantly inhibited the accumulation of biomass in root, stem, pod wall, and seed and reduced pod and seed number; more reduction was observed in CV.SN17 and CV.SN8 than CV.SN12. As shown in Table 2, pod number, seed number, and seed weight were reduced under drought stress by 64.60%, 63.55%, and 68.60%, respectively, in CV.SN17 as compared to control. Pod number, seed number, and seed weight were reduced under drought stress by 44.55%, 51.72% and 66.43%, respectively, in CV.SN8 as compared to control. Pod number, seed number, and seed weight were reduced under drought stress by 36.25%, 60.41% and 57.03%, respectively, in CV.SN12 as compared to control. Compared with the control, drought stress significantly reduced the 100-seed weight of CV.SN17 and CV.SN8, but had no significant effect on the 100-seed weight of CV.SN12. Drought stress had different effects on the distribution ratio of dry matter accumulation in different organs (Table 3). Drought stress significantly decreased the distribution ratio of dry matter in seed and pod wall of three soybean cultivars, but increased the distribution ratio of dry matter in root and stem, except root biomass distribution ratio in CV.SN17 root. Seed biomass/total biomass ratio was more reduced in CV.SN8 (decreased by 13.24%) due to drought but less reduction was recorded both in CV.SN17 (11.37%) and CV.SN12 (11.92%).
3.2. Effect of Drought Stress on Antioxidant Enzymes Activities and MDA Contents in Leaves
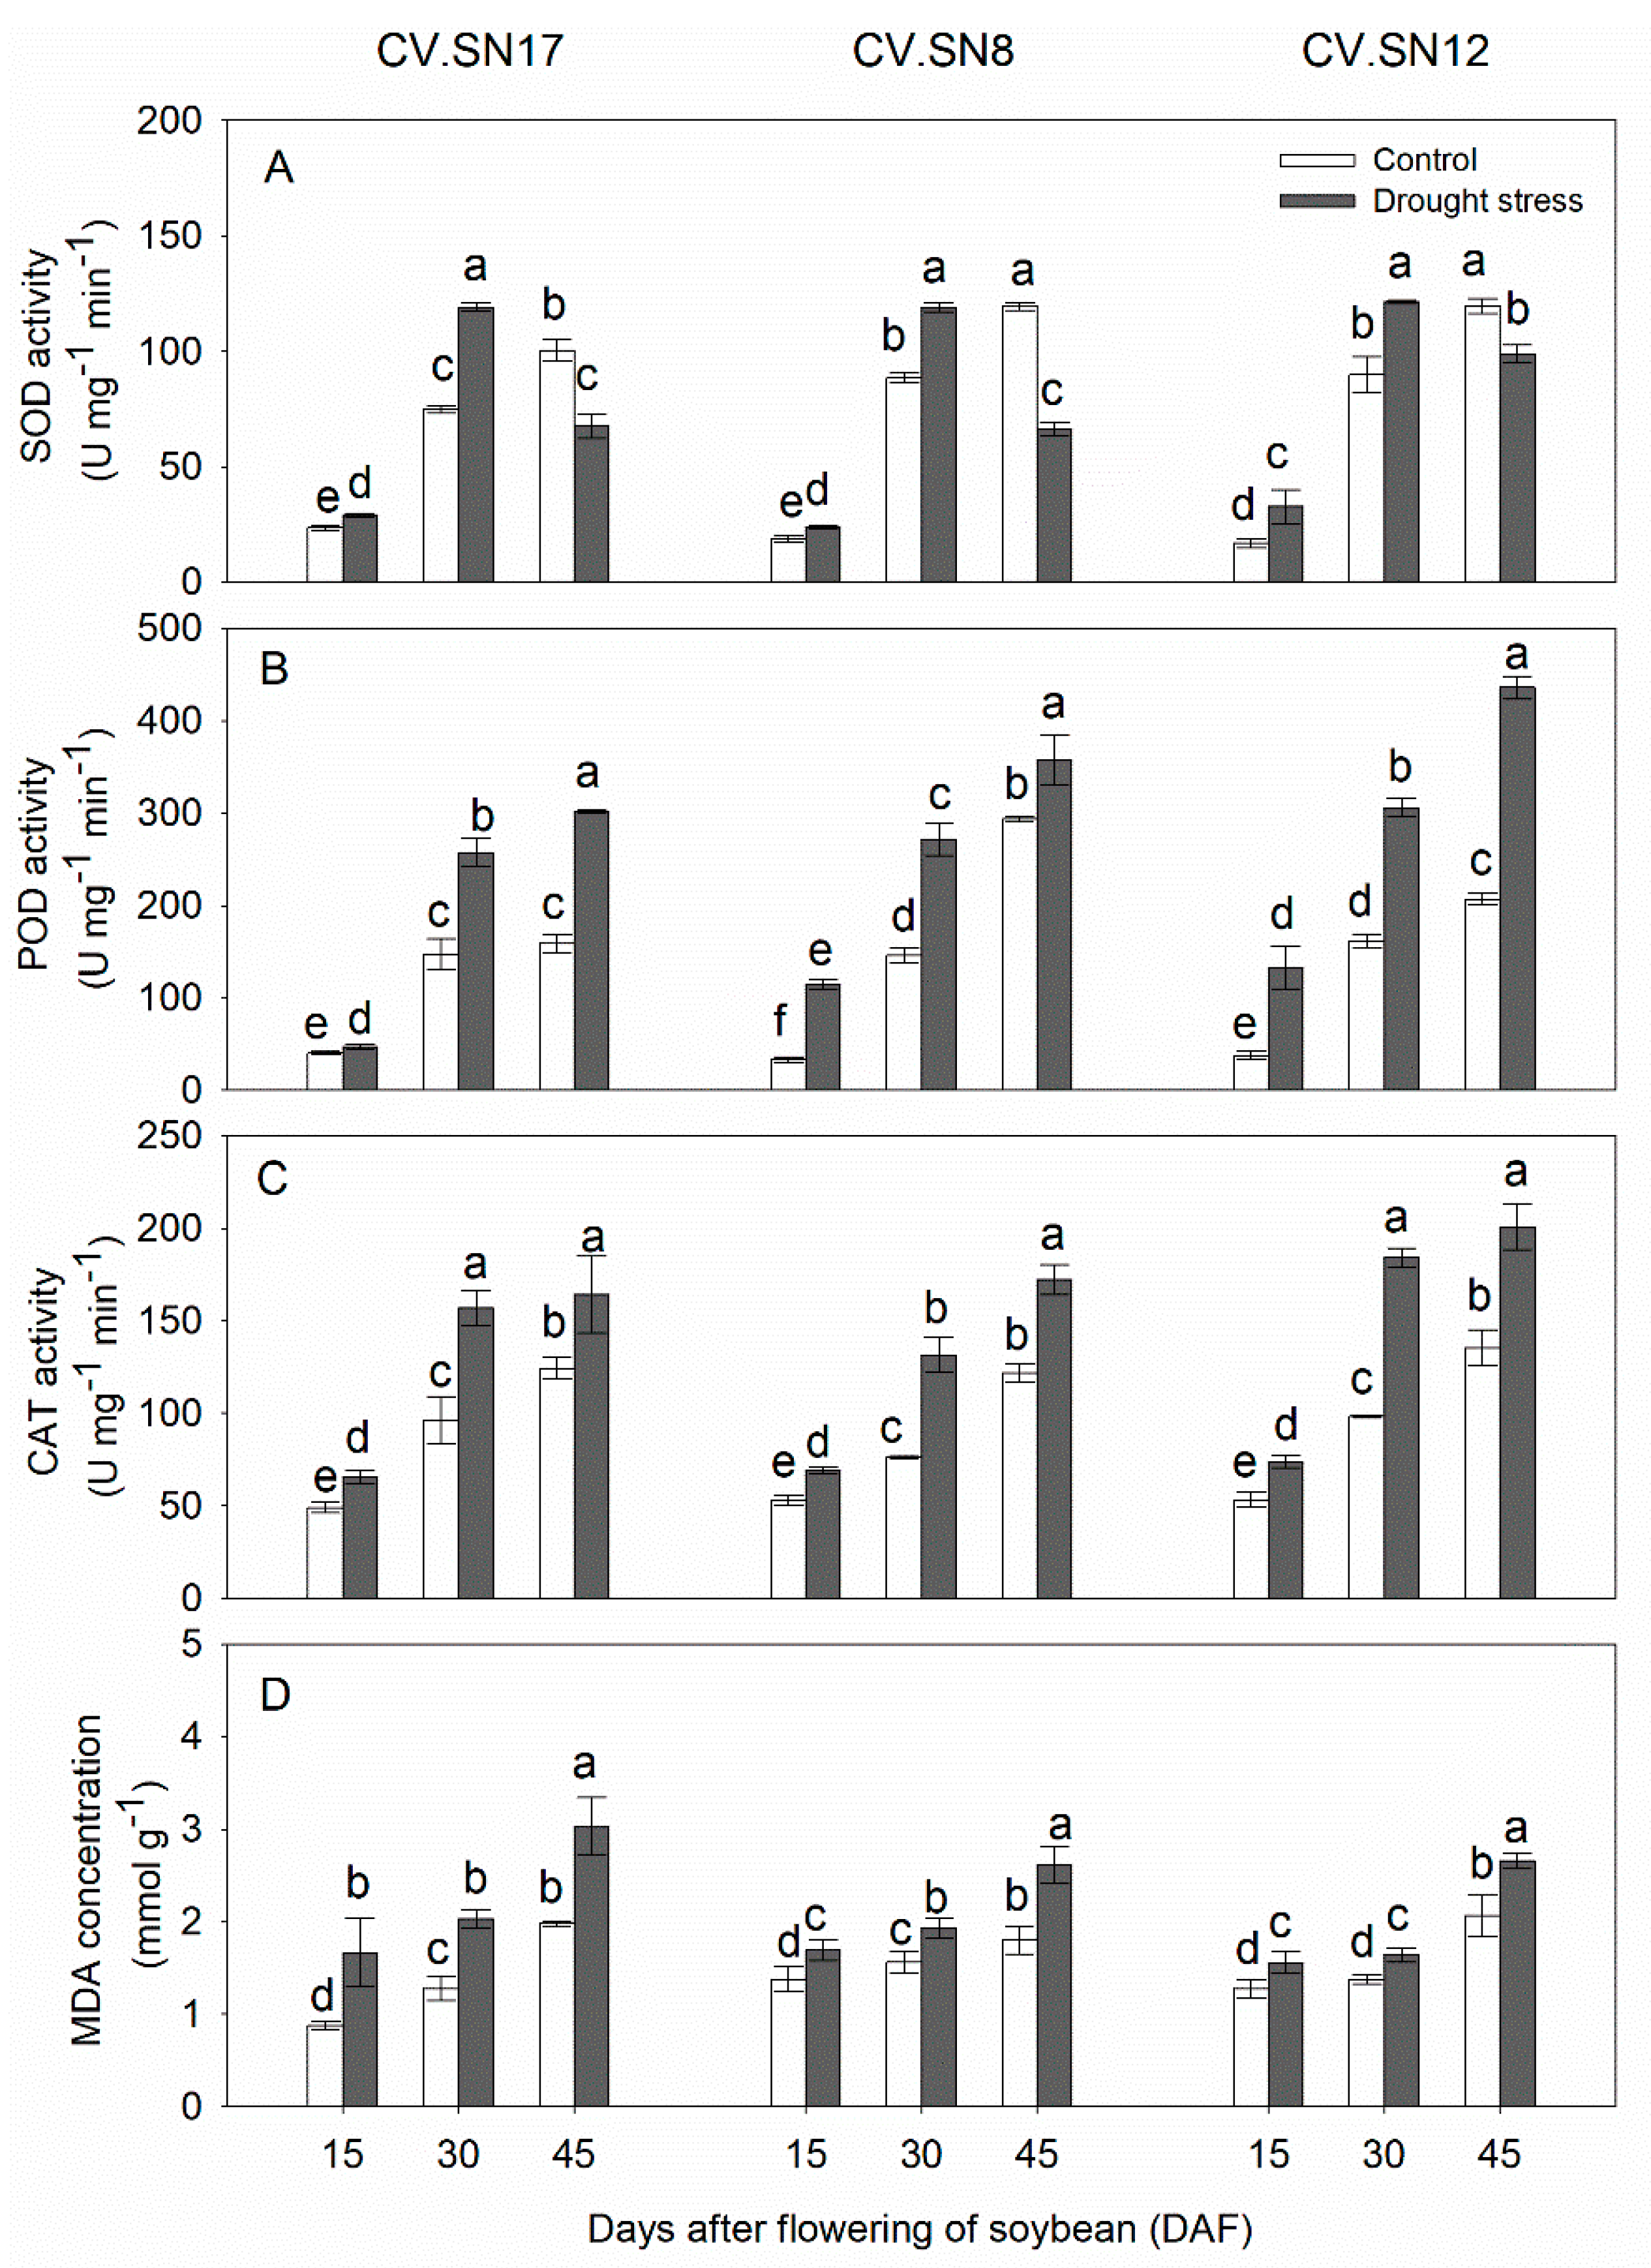
The activities of SOD, POD, and CAT and the contents of MDA in soybean leaves significantly increased with plant growth under well-watered growth conditions (Figure 1). Compared with the control, SOD activities were significantly increased in leaves during 15–30 DAF in all cultivars under drought stress, while significantly decreased at 45 DAF (Figure 1A). POD activity was increased by 17.62%–90.74% in CV.SN17, 21.91%–246.08% in CV.SN8 and 110.88%–249.03%2 in CV.SN12 under drought stress as compared to control during 15–45 DAF (Figure 1B). CAT activity was increased by 32.06%–34.29% in CV.SN17, 30.85%–41.37% in CV.SN8 and 38.64%–48.09% in CV.SN12 during 15–45 DAF (Figure 1C). MDA concentration increment during drought stress was 52.86%–90.11% in CV.SN17, 22.46%–45.45% in CV.SN8 and 22.25%–28.76% in CV.SN12 as compared to control during 15–45 DAF (Figure 1D). Plant growth stage (S), treatment (T), genotype (G), and their interaction significantly affected activities of SOD, POD, and CAT and concentration of MDA in leaves, except G and S × T × G for MDA content, according to the three-way ANOVA (Table 4).
3.3. Effect of Drought Stress on Nitrogen and Nitrate Contents in Leaves
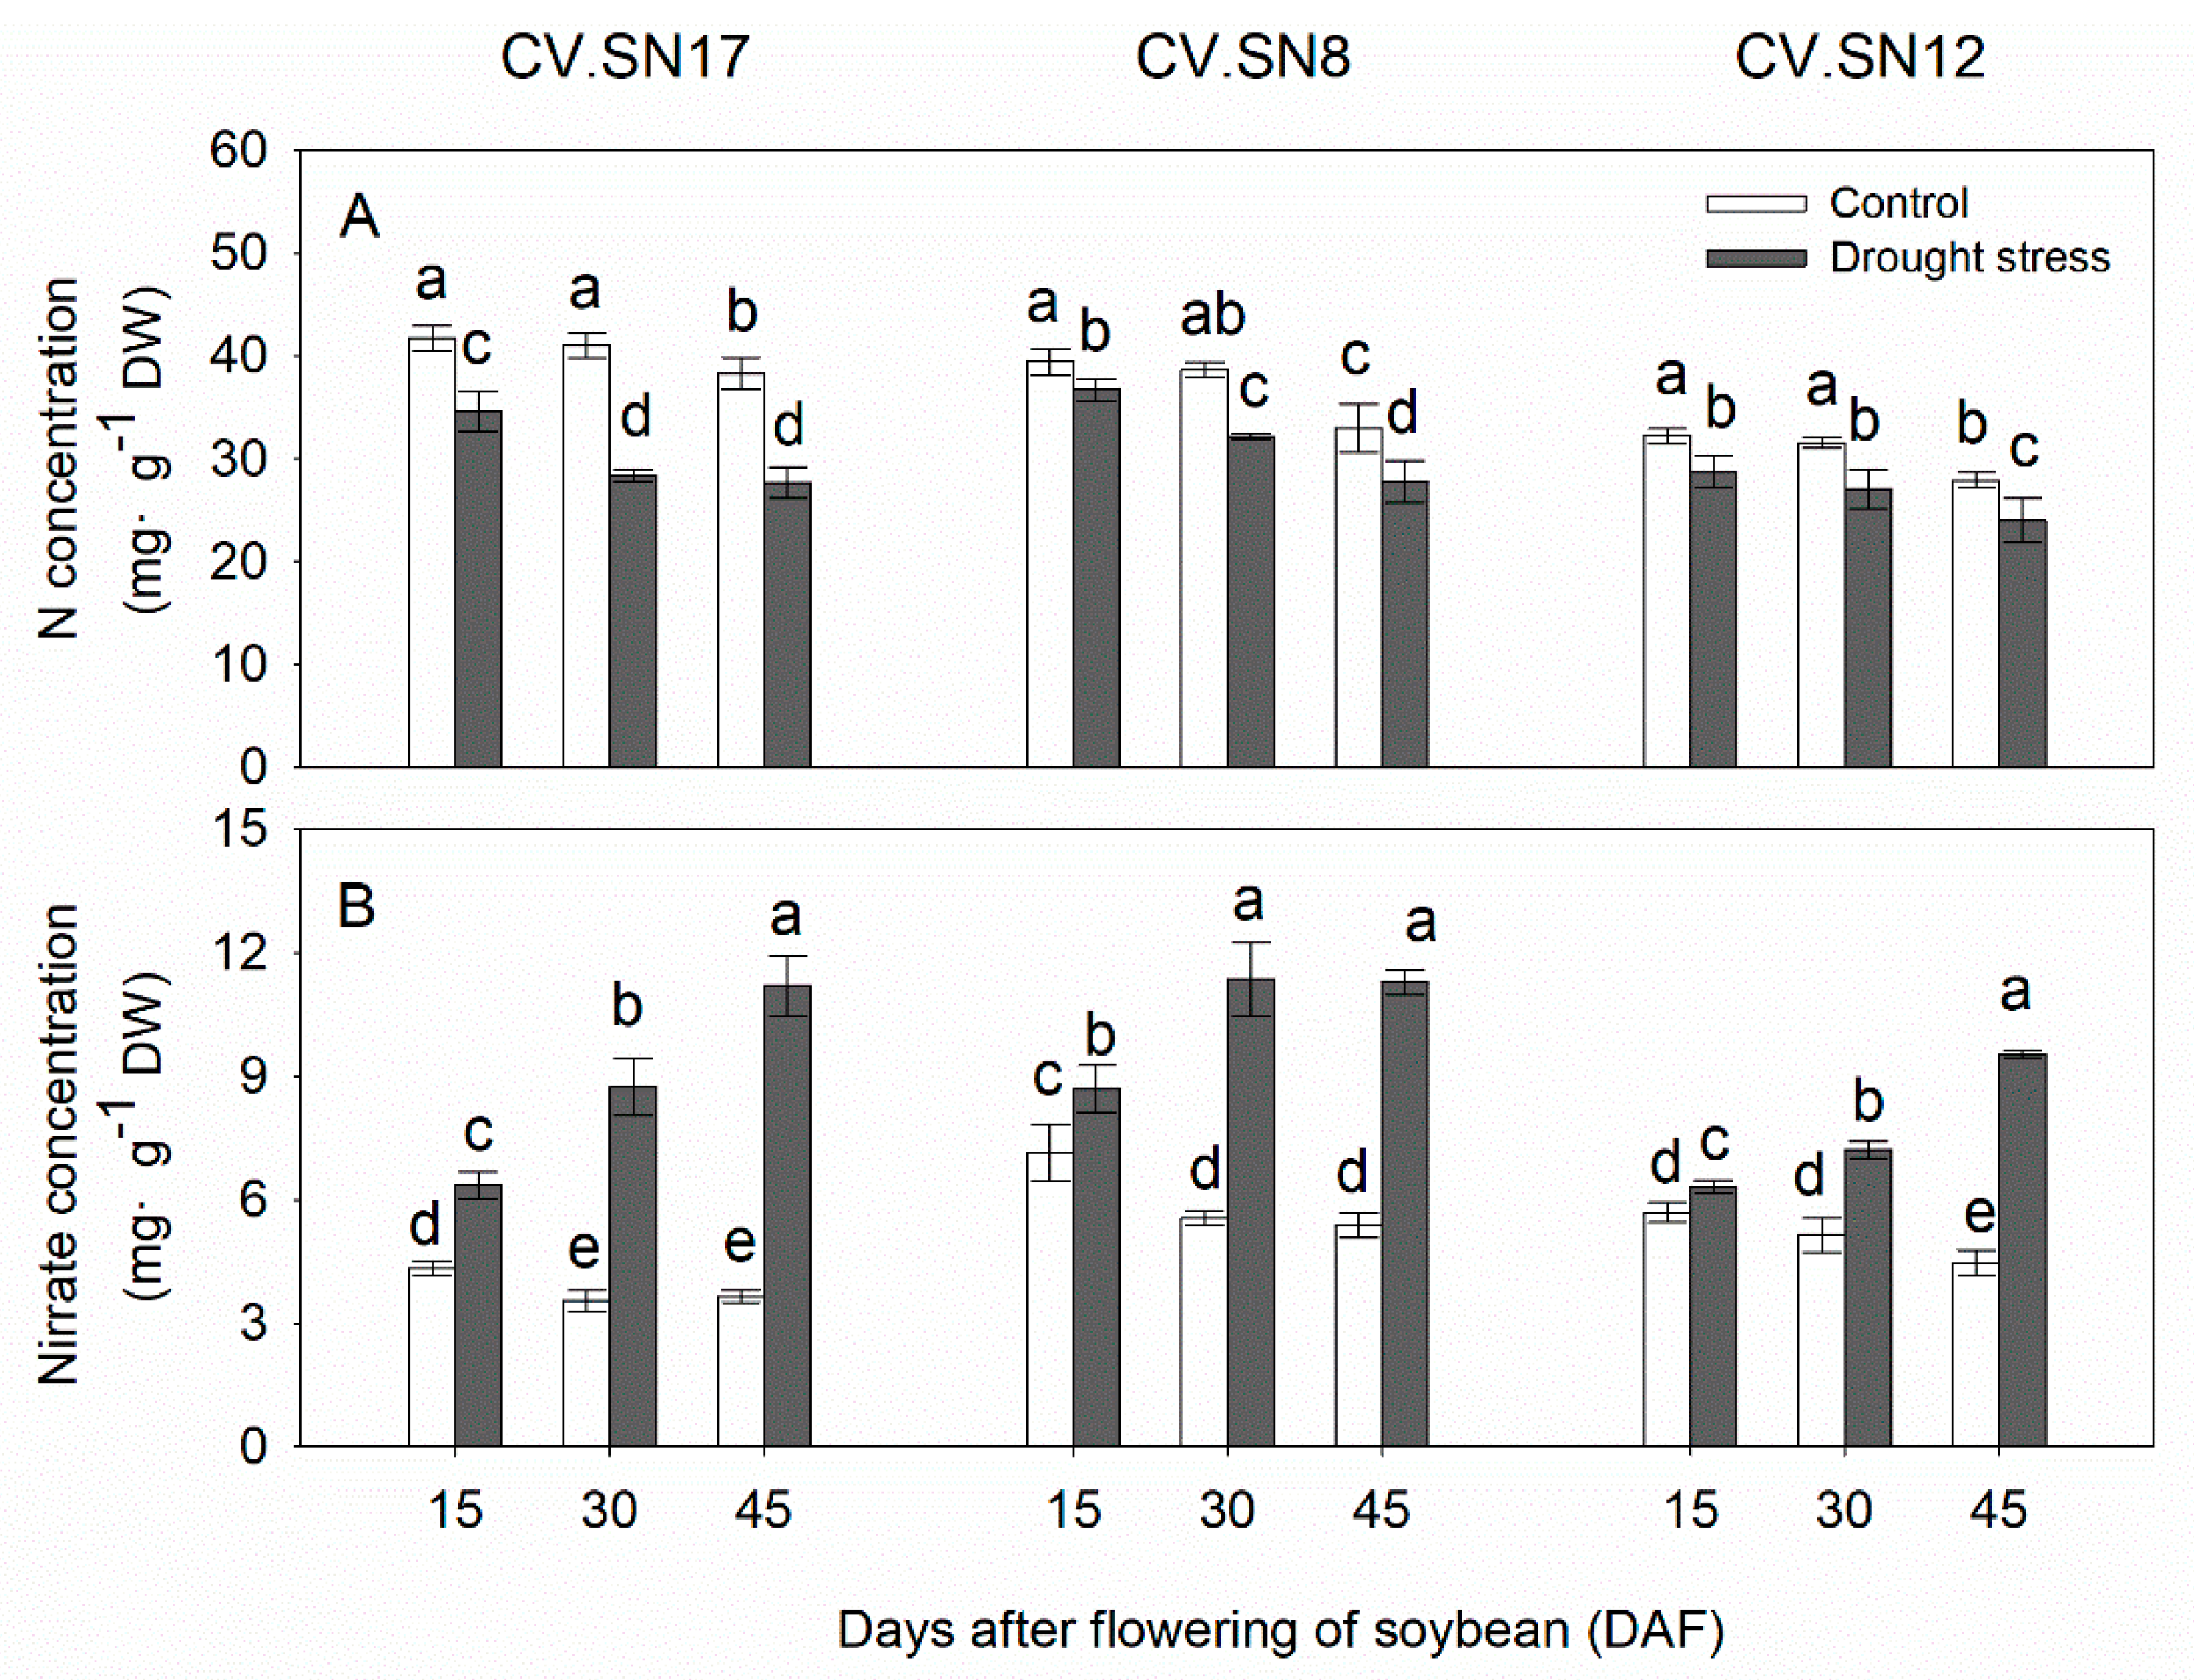
Plant growth stage (S), treatment (T), genotype (G) and their interaction significantly affected the concentrations of nitrogen and nitrate in leaves, except S × T × G for nitrogen concentration by the three-way ANOVA (Table 4). The concentrations of nitrogen and nitrate in soybean leaves slightly decreased with plant growth under well-watered growth conditions (Figure 2). Drought stress had significant effects on the nitrogen concentration and nitrate nitrogen concentration (p < 0.05, Table 3). Nitrogen concentration was reduced under drought stress by 25.11%, 13.21%, and 13.05% in CV.SN17, CV.SN8, and CV.SN12, respectively. However, compared with the control, drought stress increased the nitrate concentration by 132.90%, 78.57%, and 54.93% in CV.SN17, CV.SN8, and CV.SN12, respectively.
3.4. Effect of Drought Stress on the Activities of Enzymes Related to Nitrogen Metabolism in Leaves
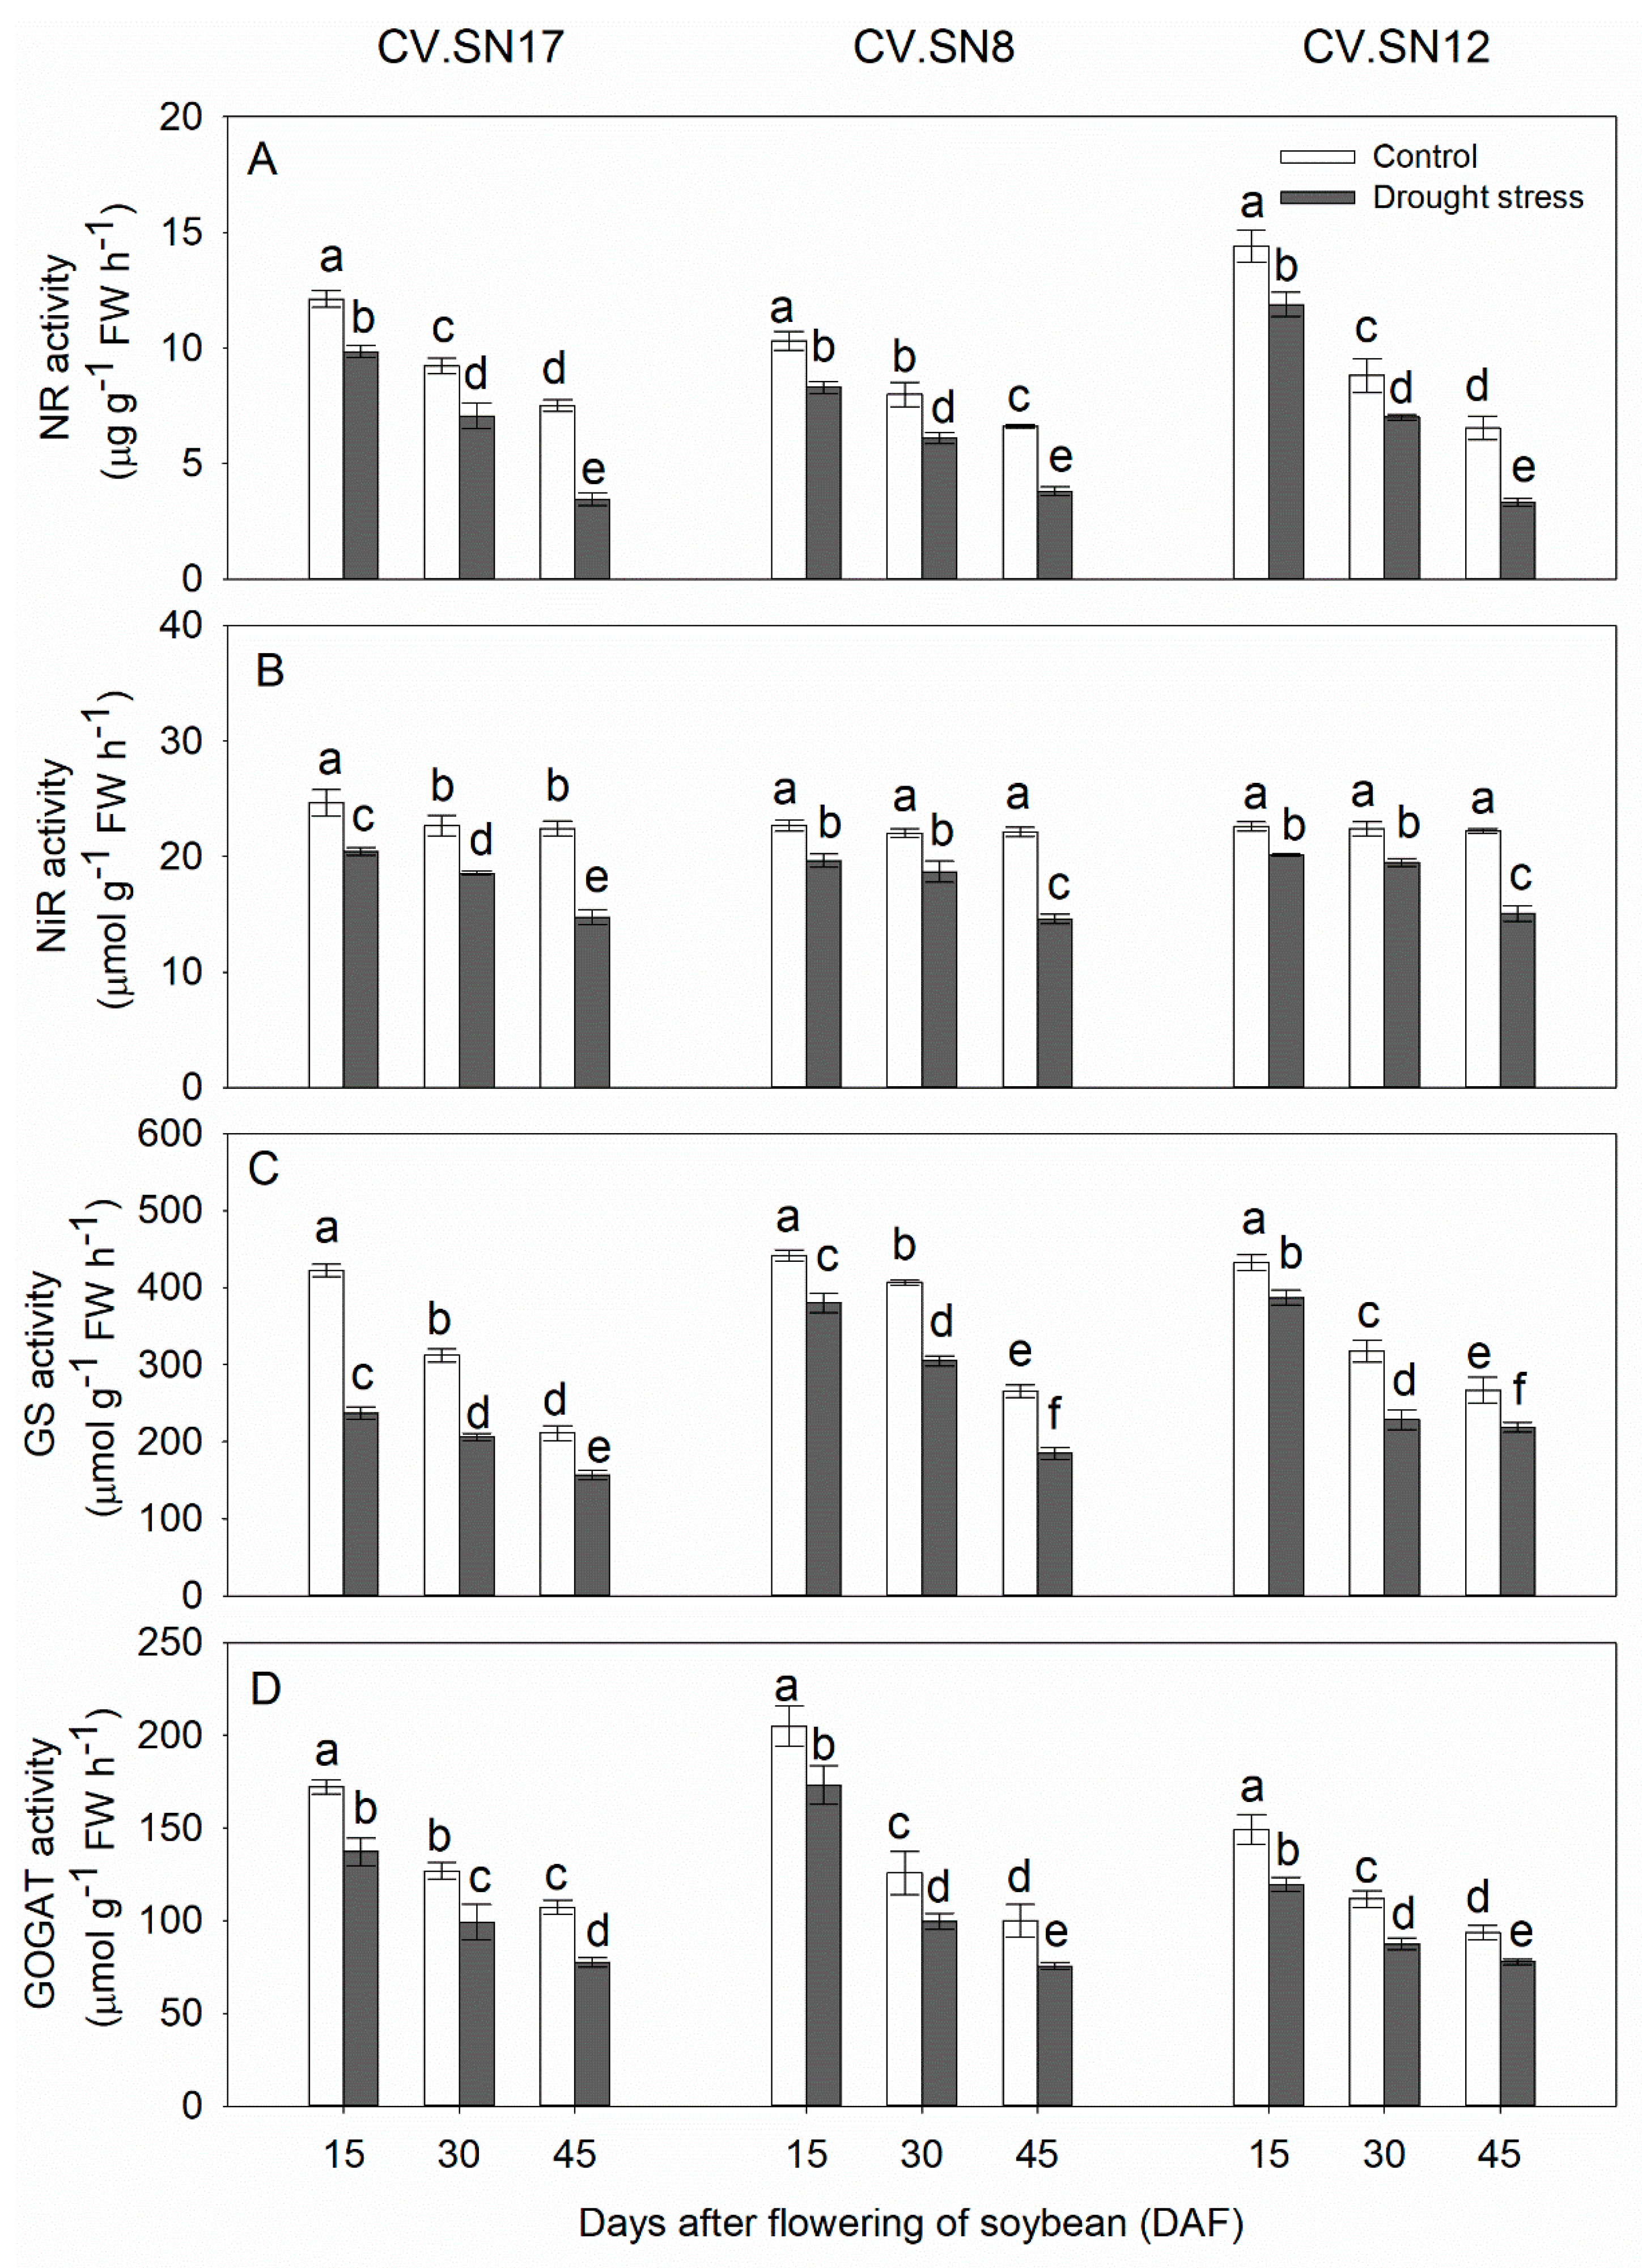
To better understand how drought affects nitrogen utilization and partitioning of nitrogen, the activities of four nitrogen-metabolism-related enzymes were analyzed, including NR and NiR for N assimilation and GS and GOGAT for ammonia assimilation. The activities of NR, NiR, GS, and GOGAT in soybean leaves significantly decreased with plant growth under well-watered growth conditions, except the NiR activities in CV.SN8 and CV.SN12 during 15–30 DAF (Figure 3). Compared with the control, drought stress caused significant decreases in the activities of NR, NiR, GS, and GOGAT by 32.06%, 23.10%, 34.61%, and 23.23%, respectively, in CV.SN17. Compared with the control, drought stress caused significant decreases in the activities of NR, NiR, GS, and GOGAT by 28.60%, 20.83%, 23.41%, and 20.21%, respectively, in CV.SN8. Compared with the control, drought stress caused significant decreases in the activities of NR, NiR, GS, and GOGAT by 29.01%, 18.66%, 18.86%, and 19.51%, respectively, in CV.SN12. Plant growth stage (S), treatment (T), genotype (G), and their interaction significantly affected the activities of NR, NiR, GS and GOGAT in leaves, except T × G and S × T × G for NR activities, S × G for NiR activities, S × T, T × G, and S × T × G for GOGAT activities, according to the three-way ANOVA (Table 4).
3.5. Effect of Drought Stress on Expression Levels of Genes Involved in Nitrogen Metabolism in Leaves
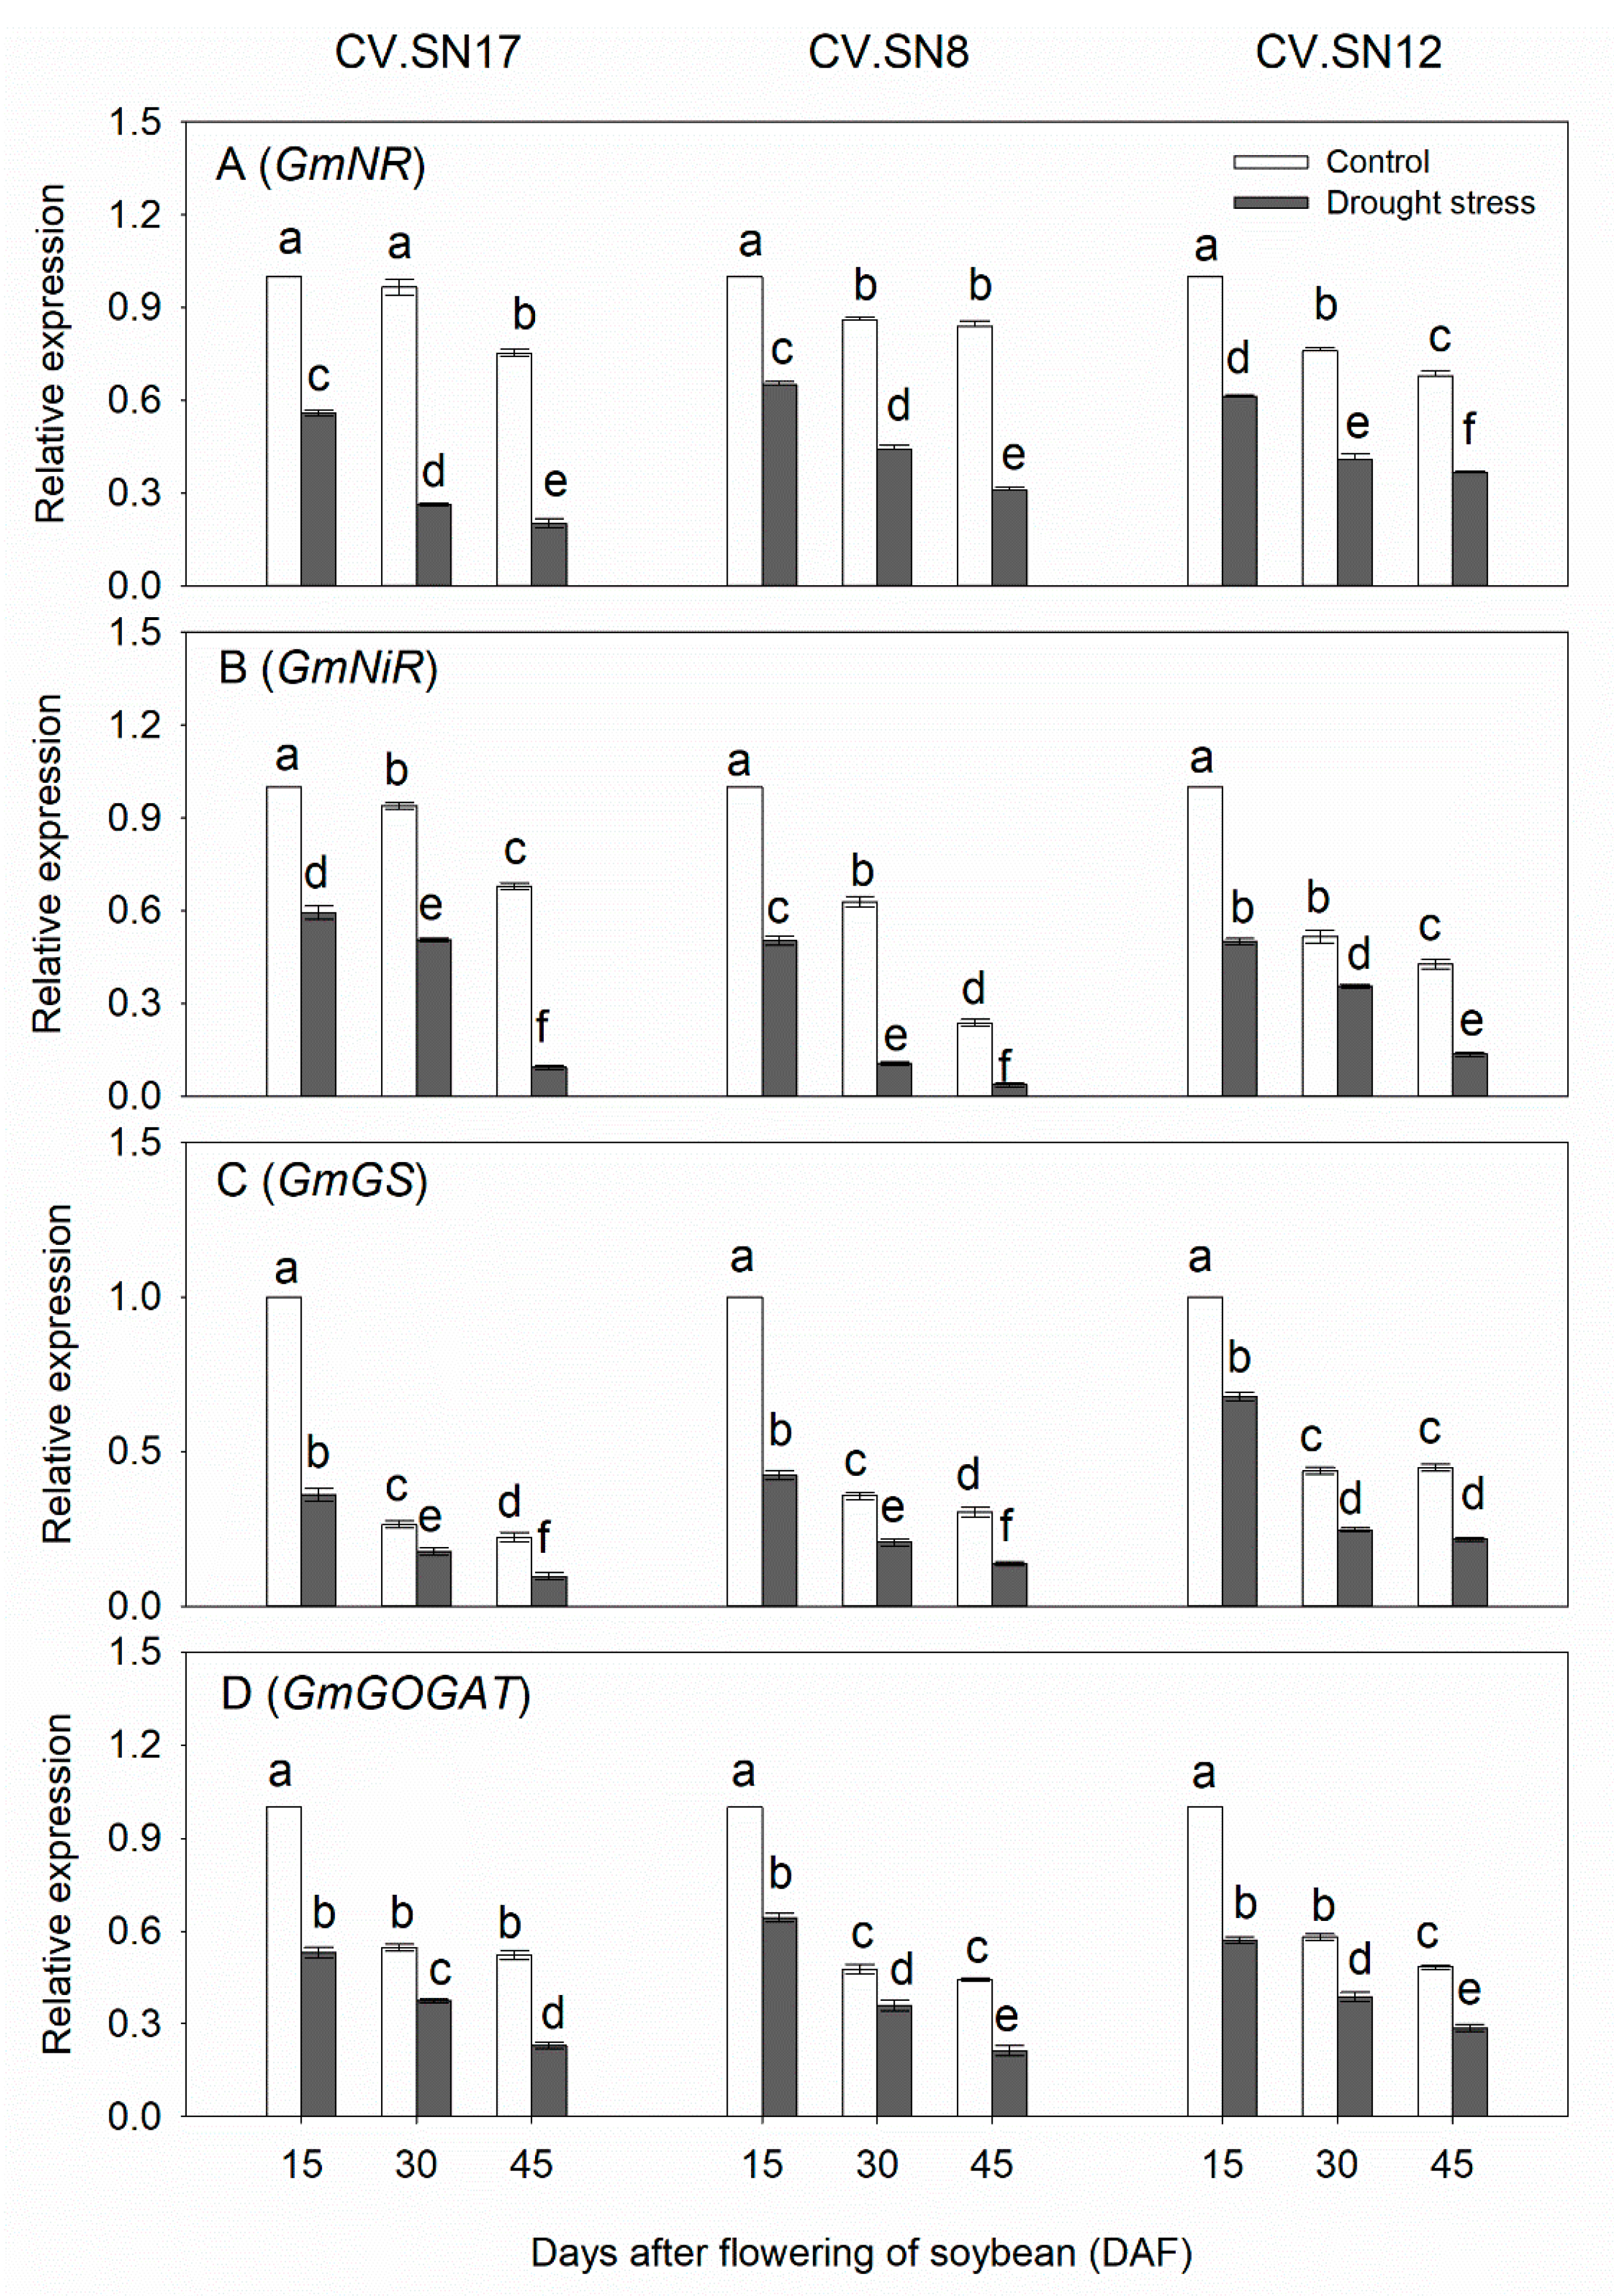
To investigate the mechanisms of nitrogen metabolism pathway in leaves under drought stress, a qRT-PCR expression analysis was performed on four genes, namely GmNR, GmNiR, GmGS, and GmGOGAT. The expression levels of GmNR, GmNiR, GmGS, and GmGOGAT in soybean leaves significantly decreased with plant growth under well-watered growth conditions (Figure 4). Compared with the control, drought stress significantly decreased the expression levels of GmNR, GmNiR, GmGS, and GmGOGAT by 63.26%, 57.68%, 51.20%, and 44.92%, respectively, in CV.SN17. Compared with the control, drought stress significantly decreased the expression levels of GmNR, GmNiR, GmGS, and GmGOGAT by 43.60%, 72.41%, 51.55%, and 37.34%, respectively, in CV.SN8. Compared with the control, drought stress significantly decreased the expression levels of GmNR, GmNiR, GmGS, and GmGOGAT by 48.85%, 49.64%, 42.44%, and 39.00%, respectively, in CV.SN12. Plant growth stage (S), treatment (T), genotype (G), and their interaction significantly affected the expression levels of GmNR, GmNiR, GmGS, and GmGOGAT in leaves, according to the three-way ANOVA (Table 4).
3.6. Effect of Drought Stress on Soluble Protein, Free Amino Acid, Proline, and Soluble Sugar Contents in Leaves
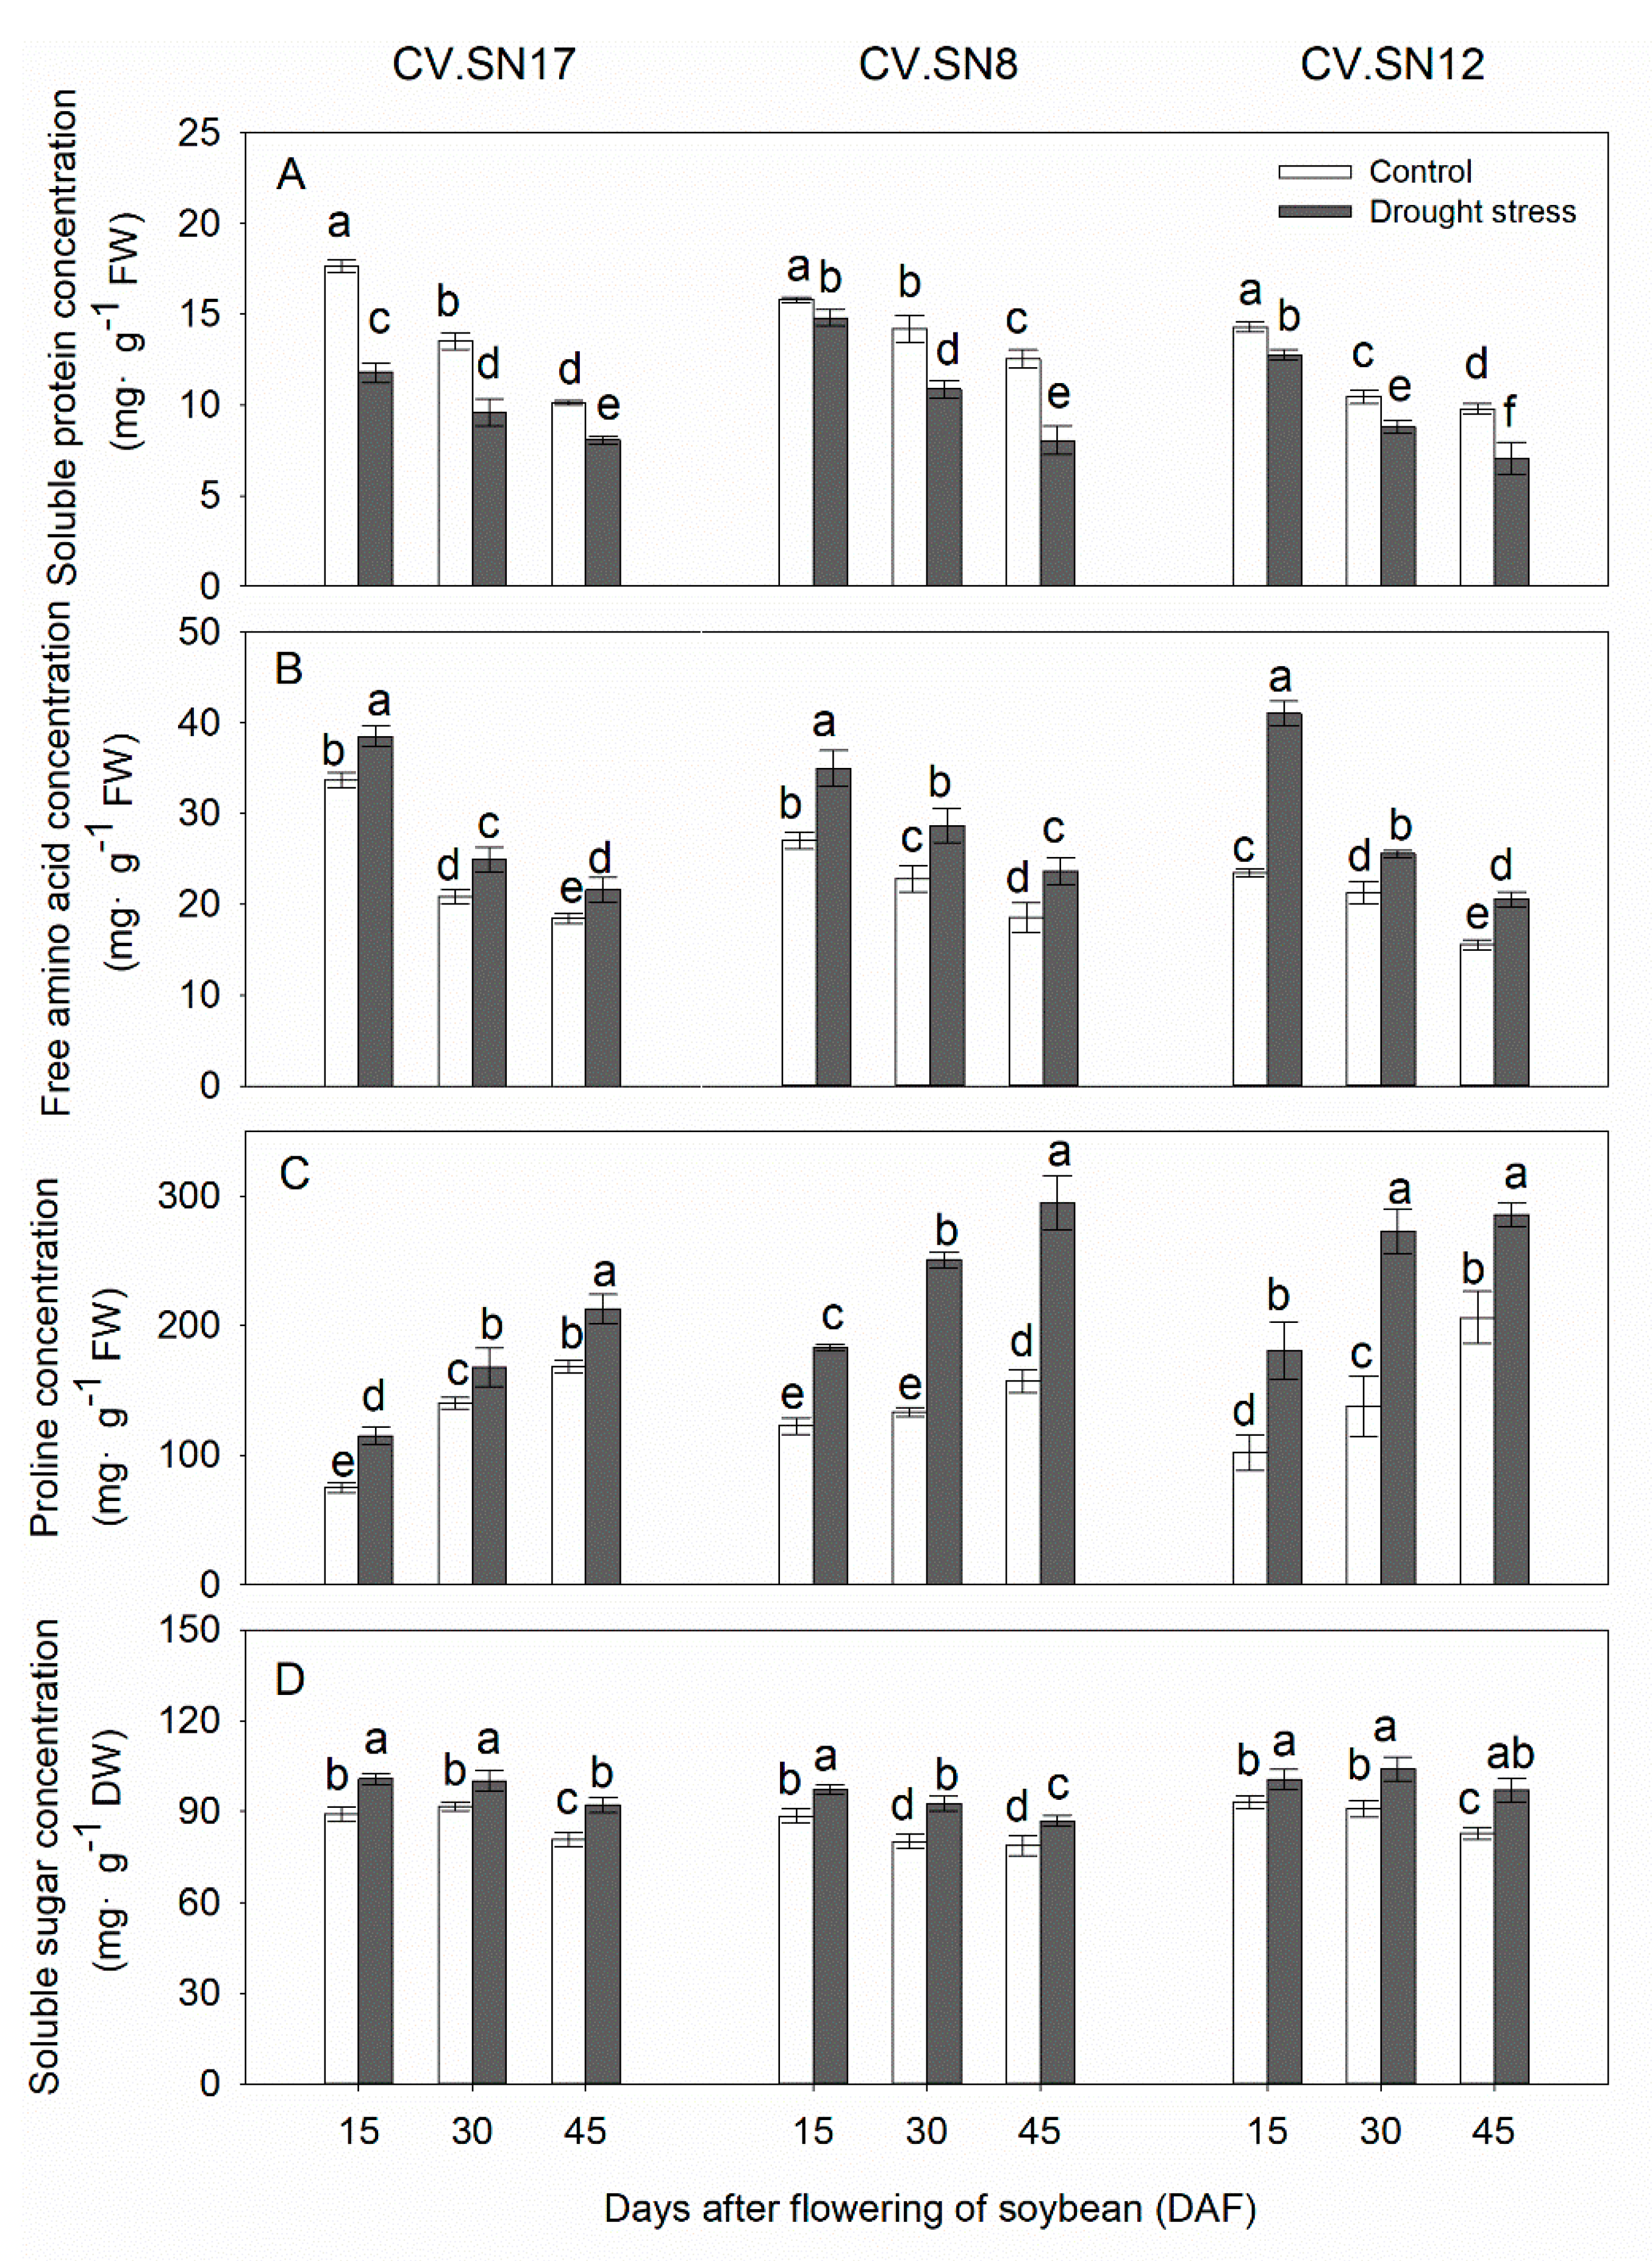
Under well-watered growth conditions, the concentrations of soluble protein and free amino acid in soybean leaves showed a slightly decrease with plant growth, while proline concentrations were increased (Figure 5). Drought stress had significant effects on the concentrations of soluble protein, free amino acid, proline, and soluble sugar (p < 0.05, Table 3). Soluble protein content was reduced under drought stress by 27.55%, 21.82%, and 18.14% in CV.SN17, CV.SN8 and CV.SN12, respectively (Figure 5A). However, compared with the control, drought stress increased the concentrations of free amino acids, proline, and soluble sugar by 17.11%, 33.23%, and 12.13%, respectively, in CV.SN17. Compared with the control, drought stress increased the concentrations of free amino acids, proline, and soluble sugar by 27.66%, 75.17%, and 12.02%, respectively, in CV.SN8. Compared with the control, drought stress increased the concentrations of free amino acids, proline, and soluble sugar by 42.28%, 65.97%, and 13.04%, respectively, in CV.SN12 (Figure 5B–D). Plant growth stage (S), treatment (T), genotype (G), and their interaction significantly affected the concentrations of soluble protein, free amino acid, proline, and soluble sugar in leaves, except S × T for soluble content and T × G and S × T × G for soluble sugar content, according to the three-way ANOVA (Table 4).
3.7. Correlations of Seed Weight with Physiological Parameters
The correlations of seed weight with physiological parameters during reproductive phases (15–45 DAF) were analyzed (Table 5). Seed weight showed a significant positive correlation (p < 0.05) with nitrogen concentration at 30 DAF and 45 DAF and a significant negative correlation with nitrate content during 15–45 DAF. Seed weight was positively correlated with soluble protein (p < 0.05), but negatively correlated with free amino acid, proline, and soluble sugar (p < 0.05). The activities of nitrogen-metabolism-related enzymes and expression levels of genes involved in metabolism all showed a significant positive correlation with seed weight (p < 0.05), with the exception of seed weight and GOGAT activity at 15 DAF, which was not significantly correlated. The activities of SOD, POD and CAT, and MDA content all showed a significant negative correlation with seed weight (p < 0.05), with the exception of seed weight and SOD activity at 45 DAF, which showed a significant positive correlation (p < 0.05).
4. Discussion
Drought stress has significantly negative effects on soybean growth, development, and yield [38,39]. Drought stress inhibits the production of photosynthetic products by decreasing leaf photosynthetic capacity [8,55] and the accelerating leaf senescence and oxidative stress [56]. Our study showed that drought stress during the reproductive stages decreased biomass of soybean stem, root, and seed (Table 2) and reduced biomass allocation to seed compared to the control (Table 3), which finally led to seed weight loss. The production and mobilization of assimilates to developing seeds decreased and considerable yield losses occurred in plants undergoing drought stress. Three soybean cultivars showed differential behaviors depending on their differential drought stress sensitivities under drought stress, with CV.SN12 being the most tolerant, followed by CV.SN17 and CV.SN8 as the most susceptible. It obvious from this research that soybean cultivars under drought stress displayed different physiological and molecular responses for regulating growth, gene expression levels, and enzyme activities involved in nitrogen-assimilates production and metabolism.
Drought-stress-induced excessive production of ROS can cause oxidative stress, resulting in membrane lipid peroxidation, metabolic disorders, and serious plant growth inhibition [57]. In plants, antioxidant enzymes, including SOD, POD, and CAT, play an important role in scavenging excess ROS and maintaining ROS in a dynamic equilibrium. The activities of antioxidant enzymes in plants can directly reflect the ability of scavenging ROS. Previous studies showed that drought stress increased the SOD, POD, and CAT activities in soybean [58] and alfalfa [4]. In this study, short-term drought stress (15–30 DAF) increased the activities of antioxidant enzymes, including SOD, POD, and CAT (Figure 1A–C), indicating that the antioxidant enzyme system was involved in the early drought resistance response of soybean. However, once the ROS produced by plants exceed the scavenging capacity of antioxidant enzymes, the antioxidant system will be destroyed [15,59]. Our results showed that long-term drought stress (45 DAF) significantly reduced SOD activity in leaves, but increased POD and CAT enzyme activities compared to the control (Figure 1A–C). Previous studies showed that SOD and CAT activities were significantly decreased under prolonged drought stress in Kentucky bluegrass [12,60]. Thus, although the changes of antioxidant enzyme activities vary among species under long-term stress, antioxidant capacity to scavenge ROS was weakened, leading to ROS-mediated oxidative damage. This was further supported by the fact that drought stress increased MDA concentration in soybean leaves, especially at 45 DAF (Figure 1D). POD and CAT were higher in CV.SN12 than CV.SN17 and CV.SN8 under drought stress, which might contribute to retarded leaf senescence and reduced seed weight. Therefore, drought stress enhanced the peroxidation degree of membranes and weakened the scavenging ability of ROS, which caused damage to cellular components and basic metabolism and finally inhibited plant growth and reduced yield.
N is an essential element for soybean growth [19,61]. Effective N fixation and utilization can promote crop growth and increase yield [20,62]. Zapata et al. [63] suggested that maximum N fixation occurs during R3 and R5 stages of soybean development. A number of previous studies have suggested that N application at reproductive stages increased soybean yield, especially in high-yielding environments [20,64,65,66]. However, when N supply does not meet requirements of growth and development, soybean will remobilize N accumulated in leaves to the grain, accompanied by diminishing photosynthetic capacity, thus decreasing yield potential [19]. Thus, coordination between N supply and N utilization is crucial to plant growth and development [17,67]. During seed-filling stages, N concentration in leaves decreased with the development of soybean growth process (Figure 2A and Figure 6), indicating that N was transferred from leaf to grain to meet the demand of seed development and growth. Drought stress reduced N concentration, but increased nitrate concentration in leaves, especially during 30–45 DAF (Figure 2). Nitrate is an important signaling element for various molecular and physiological processes in plants which integrates second messengers to early signaling and nitrate perception, leading to physiological and metabolic changes [68,69]. The accumulated NO3− not only acts as an important nutrient for cells but also as osmoprotectant against injuries to the membrane [70,71,72]. Wilkinson et al. [71] indicated that NO3− in leaves contributed to regulate stomatal opening through its effect on depolarization of guard cells. Thus, the accumulation of NO3− under drought stress might be a strategy for soybeans to adapt to drought stress.
Previous studies showed that drought stress regulated N metabolism balance through changes in N metabolic enzyme activities [17,18,32]. Drought stress decreased activities of NR and GOGAT enzymes in both leaves and roots of Populus simonii seedlings [67] and activities of NR, GS, and GOGAT enzymes in cotton leaves [32]. The changes of enzyme activities can directly affect the efficiency of N uptake and utilization. Drought stress significantly decreased NR and NiR activities (Figure 3A,B) and the expression levels of GmNR and GmNiR (Figure 4A,B) in soybean leaves, indicating that drought stress reduced the ability of NO3− reduction to NH4+ and resulted in a decrease in the efficiency of nitrogen assimilation. This can be further supported by the fact that drought stress induced NO3− accumulation in leaves (Figure 2B and Figure 6). Efficient GS/GOGAT metabolism cycle is conducive to the rapid NH4+ detoxification [73]. In this experiment, GS and GOGAT activities were decreased (Figure 3C,D) and the expression levels of GmGS and GmGOGAT were downregulated under drought stress (Figure 4C,D). This result indicated that drought stress inhibited the GS/GOGAT metabolism cycle, leading to weakened NH4+ assimilation and causing toxicity to cells. Furthermore, seed weight was positively correlated with nitrogen content and nitrogen-metabolism-related parameters, especially during late seed filling stages (30–45 DAF) (Table 5). The lower NO3− concentration and less decreased activities of nitrogen-metabolism-related enzymes and expression levels of genes related to metabolism in CV.SN12 than in CV.SN17 and CV.SN8 suggested that maintaining high N utilization and metabolism was responsible for enhancing drought stress adaptation.
Synthesis and accumulation of soluble metabolites such as soluble sugars and amino acids, especially proline, mediate OA during drought stress [31,74]. Drought stress increased the contents of free amino acid and proline (Figure 5B,C), indicating that N metabolism was involved in OA in response to drought stress. These results were in accordance with previous studies, which reported that proline accumulation was a part of the drought-stress response [75,76]. Furthermore, proline not only functions as an osmoprotectant, but it can also efficiently scavenge ROS, thus protecting plant cells from oxidative damage [77,78]. The increments of free amino acid and proline could have resulted from N assimilation (mainly by amino acid synthesis) or proteolysis [79]. In this study, the accumulation of free amino acids and proline (Figure 5B,C, Figure 6) were more likely resulting from proteolysis, for the decreased protein content (Figure 5A) and N-metabolism-related enzyme activities (Figure 3). However, Zhong et al. [17] suggested that the short-term water stress increased the contents of free amino acids and proline due to the synthesis of amino acids, because the protein content in rice remained unchanged and the activity of N assimilation enzymes increased. Therefore, drought stress regulation of amino acids and proline metabolism may vary among species, plant growth stages, treatment degree, and treatment duration. Under drought stress, soluble sugar accumulated in leaves (Figure 5D) also participated in osmotic adjustment, which was beneficial to maintain leaf turgor. The accumulated soluble sugars can cooperate with amino acids to prevent dehydration of cells and maintain the structure and function of cell membranes under drought stress [17,80]. Furthermore, seed weight was negatively correlated with the contents of free amino acids, proline, and soluble sugar (Table 4), indicating that efficient OA may contribute to reduce seed weight loss under drought stress. The increment of free amino acids, proline, and soluble sugars concentrations were higher in CV.SN12 than CV.SN17 and CV.SN8 under drought stress. Taken together, these results suggested that N metabolism cooperated with carbon metabolism to modulate OA in leaves under drought stress.
5. Conclusions
This study showed that drought-stress-reduced soybean seed weight was due to the reduced biomass accumulation of organs and decreased biomass allocated to seed. Long-term drought stress decreased SOD activity, which induced ROS-mediated oxidative damage and MDA accumulation. Soybean growth under drought stress is regulated by nitrogen distribution and metabolism (Figure 6). Drought stress reduced the activities of nitrogen metabolic enzymes and downregulated the expression of genes such as GmNR, GmNiR, GmGS, and GmGOGAT in soybean leaves. These changes declined the utilization efficiency of nitrogen, resulting in the decreased nitrogen content and increased nitrate content. N assimilation products, including free amino acids and proline, cooperated with soluble-sugar-coordinated osmotic adjustment in leaves under drought stress. Our results showed that soybean seed weight was significantly (p < 0.05) correlated with nitrogen-metabolism-related parameters. It was evident that the combination of different changes in gene expression and enzymatic activities could be responsible for drought tolerance. Based on the performance of growth, nitrogen metabolism, and yield attributes, CV.SN12 showed the highest tolerance to drought, followed by CV.SN8 and CV.SN17. Our results indicated that these nitrogen-metabolism-related parameters could be used as selection traits for drought tolerance in soybean.
Author Contributions
Y.D. and F.X. designed experiment; Y.D., Q.Z., L.C., and X.Y. performed experiment; Y.D. and Q.Z. analyzed the data; Y.D. wrote the manuscript; Q.Z. and F.X. revised the manuscript. All authors have read and agreed to the published version of the manuscript.
Funding
This research was supported by grants [2017YFD0101306-04] from the National Key Research and Development Plan of Ministry of Science and Technology and [2018416023] from the Key Research Project of Liaoning Province.
Conflicts of Interest
The authors declare no conflict of interest.
References
- Chakhchar, A.; Lamaoui, M.; Aissam, S.; Ferradous, A.; Wahbi, S.; El Mousadik, A.; Ibnsouda-Koraichi, S.; Filali-Maltouf, A.; El Modafar, C. Differential physiological and antioxidative responses to drought stress and recovery among four contrasting Argania spinosa ecotypes. J. Plant Interact. 2016, 11, 30–40. [Google Scholar] [CrossRef] [Green Version]
- Zandalinas, S.I.; Mittler, R.; Balfagón, D.; Arbona, V.; Gómez-Cadenas, A. Plant adaptations to the combination of drought and high temperatures. Physiol. Plant 2018, 162, 2–12. [Google Scholar] [CrossRef] [PubMed] [Green Version]
- Reddy, A.R.; Chaitanya, K.; Jutur, P.; Sumithra, K. Differential antioxidative responses to water stress among five mulberry (Morus alba L.) cultivars. Environ. Exp. Bot. 2004, 52, 33–42. [Google Scholar] [CrossRef]
- Zhang, C.; Shi, S.; Liu, Z.; Yang, F.; Yin, G. Drought tolerance in alfalfa (Medicago sativa L.) varieties is associated with enhanced antioxidative protection and declined lipid peroxidation. J. Plant Physiol. 2019, 232, 226–240. [Google Scholar] [CrossRef]
- Xu, W.; Cui, K.; Xu, A.; Nie, L.; Huang, J.; Peng, S. Drought stress condition increases root to shoot ratio via alteration of carbohydrate partitioning and enzymatic activity in rice seedlings. Acta Physiol. Plant 2015, 37, 9. [Google Scholar] [CrossRef]
- Fougereux, J.-A.; Doré, T.; Ladonne, F.; Fleury, A. Water stress during reproductive stages affects seed quality and yield of pea (Pisum sativum L.). Crop Sci. 1997, 37, 1247–1252. [Google Scholar] [CrossRef]
- Begcy, K.; Walia, H. Drought stress delays endosperm development and misregulates genes associated with cytoskeleton organization and grain quality proteins in developing wheat seeds. Plant Sci. 2015, 240, 109–119. [Google Scholar] [CrossRef]
- Anjum, S.A.; Xie, X.Y.; Wang, L.C.; Saleem, M.F.; Man, C.; Lei, W. Morphological, physiological and biochemical responses of plants to drought stress. Afr. J. Agric. Res. 2011, 6, 2026–2032. [Google Scholar]
- Muller, B.; Pantin, F.; Génard, M.; Turc, O.; Freixes, S.; Piques, M.; Gibon, Y. Water deficits uncouple growth from photosynthesis, increase C content, and modify the relationships between C and growth in sink organs. J. Exp. Bot. 2011, 62, 1715–1729. [Google Scholar] [CrossRef] [Green Version]
- Mittler, R.; Blumwald, E. The roles of ROS and ABA in systemic acquired acclimation. Plant Cell 2015, 27, 64–70. [Google Scholar] [CrossRef] [Green Version]
- Sofo, A.; Cicco, N.; Paraggio, M.; Scopa, A. Regulation of the ascorbate—Glutathione cycle in plants under drought stress. In Ascorbate-Glutathione Pathway and Stress Tolerance in Plants; Anjum, N.A., Chan, M.T., Umar, S., Eds.; Springer: Dordrecht, The Netherlands, 2010; pp. 137–189. [Google Scholar]
- Xu, L.; Han, L.; Huang, B. Antioxidant enzyme activities and gene expression patterns in leaves of Kentucky bluegrass in response to drought and post-drought recovery. J. Am. Soc. Hortic. Sci. 2011, 136, 247–255. [Google Scholar] [CrossRef] [Green Version]
- Sharma, V.; Kumar, S. Stipules are the principal photosynthetic organs in the papilionoid species Lathyrus aphaca. Natl. Acad. Sci. Lett. 2012, 35, 75–78. [Google Scholar] [CrossRef]
- Ge, T.D.; Sui, F.G.; Bai, L.P.; Lu, Y.Y.; Zhou, G.S. Effects of water stress on the protective enzyme activities and lipid peroxidation in roots and leaves of summer maize. Agric. Sci. China 2006, 5, 291–298. [Google Scholar] [CrossRef]
- Wang, R.; Gao, M.; Ji, S.; Wang, S.; Meng, Y.; Zhou, Z. Carbon allocation, osmotic adjustment, antioxidant capacity and growth in cotton under long-term soil drought during flowering and boll-forming period. Plant Physiol. Biochem. 2016, 107, 137–146. [Google Scholar] [CrossRef] [PubMed]
- Cao, X.; Zhong, C.; Zhu, C.; Zhu, L.; Zhang, J.; Wu, L.; Jin, Q. Ammonium uptake and metabolism alleviate PEG-induced water stress in rice seedlings. Plant Physiol. Biochem. 2018, 132, 128–137. [Google Scholar] [CrossRef] [PubMed]
- Zhong, C.; Cao, X.; Bai, Z.; Zhang, J.; Zhu, L.; Huang, J.; Jin, Q. Nitrogen metabolism correlates with the acclimation of photosynthesis to short-term water stress in rice (Oryza sativa L.). Plant Physiol. Biochem. 2018, 125, 52–62. [Google Scholar] [CrossRef]
- Zhong, C.; Bai, Z.G.; Zhu, L.F.; Zhang, J.H.; Zhu, C.Q.; Huang, J.L.; Jin, Q.Y.; Cao, X.C. Nitrogen-mediated alleviation of photosynthetic inhibition under moderate water deficit stress in rice (Oryza sativa L.). Environ. Exp. Bot. 2019, 157, 269–282. [Google Scholar] [CrossRef]
- Salvagiotti, F.; Cassman, K.G.; Specht, J.E.; Walters, D.T.; Weiss, A.; Dobermann, A. Nitrogen uptake, fixation and response to fertilizer N in soybeans: A review. Field Crops Res. 2008, 108, 1–13. [Google Scholar] [CrossRef] [Green Version]
- Zhou, H.; Yao, X.; Liu, W.; Wu, Z.; Zhao, Q.; Zhang, H.; Wang, H.; Ao, X.; Zhao, M.; Xie, F. Precise nitrogen topdressing upregulates nitrogen metabolism and improves soybean (Glycine max) grain yield. Crop Pasture Sci. 2019, 70, 334–343. [Google Scholar] [CrossRef]
- Xu, Z.Z.; Zhou, G.S. Combined effects of water stress and high temperature on photosynthesis, nitrogen metabolism and lipid peroxidation of a perennial grass Leymus chinensis. Planta 2006, 224, 1080–1090. [Google Scholar] [CrossRef]
- Nguyen, H.T.T.; Shim, I.S.; Kobayashi, K.; Usui, K. Regulation of ammonium accumulation during salt stress in rice (Oryza sativa L.) seedlings. Plant Prod. Sci. 2005, 8, 397–404. [Google Scholar] [CrossRef]
- Foyer, C.H.; Valadier, M.H.; Migge, A.; Becker, T.W. Drought-induced effects on nitrate reductase activity and mRNA and on the coordination of nitrogen and carbon metabolism in maize leaves. Plant Physiol. 1998, 117, 283–292. [Google Scholar] [CrossRef] [Green Version]
- Sánchez-Rodríguez, E.; del Mar Rubio-Wilhelmi, M.; Ríos, J.J.; Blasco, B.; Rosales, M.Á.; Melgarejo, R.; Romero, L.; Ruiz, J.M. Ammonia production and assimilation: Its importance as a tolerance mechanism during moderate water deficit in tomato plants. J. Plant Physiol. 2011, 168, 816–823. [Google Scholar] [CrossRef] [PubMed]
- del Mar Rubio-Wilhelmi, M.; Sanchez-Rodriguez, E.; Leyva, R.; Blasco, B.; Romero, L.; Blumwald, E.; Ruiz, J.M. Response of carbon and nitrogen-rich metabolites to nitrogen deficiency in PSARK∷IPT tobacco plants. Plant Physiol. Biochem. 2012, 57, 231–237. [Google Scholar] [CrossRef] [PubMed]
- Nagy, Z.; Németh, E.; Guóth, A.; Bona, L.; Wodala, B.; Pécsváradi, A. Metabolic indicators of drought stress tolerance in wheat: Glutamine synthetase isoenzymes and Rubisco. Plant Physiol. Biochem. 2013, 67, 48–54. [Google Scholar] [CrossRef] [PubMed]
- Singh, K.K.; Ghosh, S. Regulation of glutamine synthetase isoforms in two differentially drought-tolerant rice (Oryza sativa L.) cultivars under water deficit conditions. Plant Cell Rep. 2013, 32, 183–193. [Google Scholar] [CrossRef] [PubMed]
- Coruzzi, G.M.; Zhou, L. Carbon and nitrogen sensing and signaling in plants: Emerging ‘matrix effects’. Curr. Opin. Plant Biol. 2001, 4, 247–253. [Google Scholar] [CrossRef]
- Ashraf, M.F.M.R.; Foolad, M.R. Roles of glycine betaine and proline in improving plant abiotic stress resistance. Environ. Exp. Bot. 2007, 59, 206–216. [Google Scholar] [CrossRef]
- Kaur, G.; Asthir, B.J.B.P. Proline: A key player in plant abiotic stress tolerance. Biol. Plant. 2015, 59, 609–619. [Google Scholar] [CrossRef]
- Per, T.S.; Khan, N.A.; Reddy, P.S.; Masood, A.; Hasanuzzaman, M.; Khan, M.I.R.; Anjum, N.A. Approaches in modulating proline metabolism in plants for salt and drought stress tolerance: Phytohormones, mineral nutrients and transgenics. Plant Physiol. Biochem. 2017, 115, 126–140. [Google Scholar] [CrossRef]
- Zahoor, R.; Zhao, W.; Abid, M.; Dong, H.; Zhou, Z. Potassium application regulates nitrogen metabolism and osmotic adjustment in cotton (Gossypium hirsutum L.) functional leaf under drought stress. J. Plant Physiol. 2017, 215, 30–38. [Google Scholar] [CrossRef] [PubMed]
- de Souza Miranda, R.; Gomes-Filho, E.; Prisco, J.T.; Alvarez-Pizarro, J.C. Ammonium improves tolerance to salinity stress in Sorghum bicolor plants. Plant Growth Regul. 2016, 78, 121–131. [Google Scholar] [CrossRef]
- Singh, M.; Singh, V.P.; Prasad, S.M. Responses of photosynthesis, nitrogen and proline metabolism to salinity stress in Solanum lycopersicum under different levels of nitrogen supplementation. Plant Physiol. Biochem. 2016, 109, 72–83. [Google Scholar] [CrossRef]
- Sperandio, M.V.L.; Santos, L.A.; Bucher, C.A.; Fernandes, M.S.; de Souza, S.R. Isoforms of plasma membrane H+-ATPase in rice root and shoot are differentially induced by starvation and resupply of NO3− or NH4+. Plant Sci. 2011, 180, 251–258. [Google Scholar] [CrossRef] [PubMed]
- Kim, S.L.; Berhow, M.A.; Kim, J.T.; Chi, H.Y.; Lee, S.J.; Chung, I.M. Evaluation of soyasaponin, isoflavone, protein, lipid, and free sugar accumulation in developing soybean seeds. J. Agric. Food Chem. 2006, 54, 10003–10010. [Google Scholar] [CrossRef]
- Sakthivelu, G.; Akitha Devi, M.; Giridhar, P.; Rajasekaran, T.; Ravishankar, G.; Nikolova, M.; Angelov, G.; Todorova, R.; Kosturkova, G. Isoflavone composition, phenol content, and antioxidant activity of soybean seeds from India and Bulgaria. J. Agric. Food Chem. 2008, 56, 2090–2095. [Google Scholar] [CrossRef]
- Liu, F.; Jensen, C.R.; Andersen, M.N. Drought stress effect on carbohydrate concentration in soybean leaves and pods during early reproductive development: Its implication in altering pod set. Field Crops Res. 2004, 86, 1–13. [Google Scholar] [CrossRef]
- Lobato, A.; Neto, M.; Meirelles, A.; Silva, L.; Marochio, C.; Monteiro, E.; Zeni Neto, H.; Maleia, M.; Moiana, L.; Bronzato, A. Relationship between leaf relative water content and total soluble proteins in soybean exposed to short water deficit. Res. J. Biol. Sci. 2009, 4, 1061–1067. [Google Scholar]
- Masoumi, H.; Masoumi, M.; Darvish, F.; Daneshian, J.; Nourmohammadi, G.; Habibi, D. Change in several antioxidant enzymes activity and seed yield by water deficit stress in soybean (Glycine max L.) cultivars. Not. Bot. Horti Agrobot. Cluj Napoca 2010, 38, 86–94. [Google Scholar]
- Fehr, W.; Caviness, C.; Burmood, D.; Pennington, J. Stage of development descriptions for soybeans, Glycine Max (L.) Merrill. Crop Sci. 1971, 11, 929–931. [Google Scholar] [CrossRef]
- Patterson, K.; Cakmak, T.; Cooper, A.; Lager, I.; Rasmusson, A.G.; Escobar, M.A. Distinct signalling pathways and transcriptome response signatures differentiate ammonium-and nitrate-supplied plants. Plant Cell Environ. 2010, 33, 1486–1501. [Google Scholar] [CrossRef] [PubMed] [Green Version]
- Bradford, M.M. A rapid and sensitive method for the quantitation of microgram quantities of protein utilizing the principle of protein-dye binding. Anal. Biochem. 1976, 72, 248–254. [Google Scholar] [CrossRef]
- Bates, L.S.; Waldren, R.P.; Teare, I. Rapid determination of free proline for water-stress studies. Plant Soil 1973, 39, 205–207. [Google Scholar] [CrossRef]
- Hendrix, D.L. Rapid extraction and analysis of nonstructural carbohydrates in plant tissues. Crop Sci. 1993, 33, 1306–1311. [Google Scholar] [CrossRef]
- Ding, Y.; Luo, W.; Xu, G. Characterisation of magnesium nutrition and interaction of magnesium and potassium in rice. Ann. Appl. Biol. 2006, 149, 111–123. [Google Scholar] [CrossRef]
- Hageman, R.; Reed, A. Nitrate reductase from higher plants. Methods Enzymol. 1980, 69, 270–280. [Google Scholar]
- Singh, R.P.; Srivastava, H. Increase in glutamate synthase (NADH) activity in maize seedlings in response to nitrate and ammonium nitrogen. Physiol. Plant 1986, 66, 413–416. [Google Scholar] [CrossRef]
- de Azevedo Neto, A.D.; Prisco, J.T.; Enéas-Filho, J.; Medeiros, J.V.R.; Gomes-Filho, E. Hydrogen peroxide pre-treatment induces salt-stress acclimation in maize plants. J. Plant Physiol. 2005, 162, 1114–1122. [Google Scholar] [CrossRef]
- Giannopolitis, C.N.; Ries, S.K. Superoxide dismutases: I. Occurrence in higher plants. Plant Physiol. 1977, 59, 309–314. [Google Scholar] [CrossRef] [PubMed]
- Chance, B.; Maehly, A. Assay of catalases and peroxidases. Methods Enzymol. 1955, 2, 764–775. [Google Scholar]
- Havir, E.A.; McHale, N.A. Biochemical and developmental characterization of multiple forms of catalase in tobacco leaves. Plant Physiol. 1987, 84, 450–455. [Google Scholar] [CrossRef] [PubMed] [Green Version]
- de Jesus Miranda, V.; Coelho, R.R.; Viana, A.A.B.; de Oliveira Neto, O.B.; Carneiro, R.M.D.G.; Rocha, T.L.; de Sa, M.F.G.; Fragoso, R.R. Validation of reference genes aiming accurate normalization of qPCR data in soybean upon nematode parasitism and insect attack. BMC Res. Notes 2013, 6, 196. [Google Scholar]
- Du, Y.; Zhao, Q.; Li, S.; Yao, X.; Xie, F.; Zhao, M. Shoot/root interactions affect soybean photosynthetic traits and yield formation: A case study of grafting with record-yield cultivars. Front. Plant Sci. 2019, 10, 445. [Google Scholar] [CrossRef] [PubMed] [Green Version]
- Samarah, N.; Alqudah, A.; Amayreh, J.; McAndrews, G. The effect of late-terminal drought stress on yield components of four barley cultivars. J. Agron. Crop Sci. 2009, 195, 427–441. [Google Scholar] [CrossRef]
- Farooq, M.; Gogoi, N.; Barthakur, S.; Baroowa, B.; Bharadwaj, N.; Alghamdi, S.S.; Siddique, K. Drought stress in grain legumes during reproduction and grain filling. J. Agron. Crop Sci. 2017, 203, 81–102. [Google Scholar] [CrossRef]
- Gill, S.S.; Tuteja, N. Reactive oxygen species and antioxidant machinery in abiotic stress tolerance in crop plants. Plant Physiol. Biochem. 2010, 48, 909–930. [Google Scholar] [CrossRef]
- Devi, M.A.; Giridhar, P. Variations in physiological response, lipid peroxidation, antioxidant enzyme activities, proline and isoflavones content in soybean varieties subjected to drought stress. Proc. Natl. Acad. Sci. India Sec. B Biol. Sci. 2015, 85, 35–44. [Google Scholar] [CrossRef]
- Zhang, C.; Zeng, G.; Chen, J. Effects of drought stress on the protective enzymes activities and membrane lipid peroxidation in leaves of Brassica parachinensis LH Bailey. J. Plant Resour. Environ. 2000, 9, 23–26, (In Chinese, with English abstract). [Google Scholar]
- Fu, J.; Huang, B. Involvement of antioxidants and lipid peroxidation in the adaptation of two cool-season grasses to localized drought stress. Environ. Exp. Bot. 2001, 45, 105–114. [Google Scholar] [CrossRef]
- Saito, A.; Tanabata, S.; Tanabata, T.; Tajima, S.; Ueno, M.; Ishikawa, S.; Ohtake, N.; Sueyoshi, K.; Ohyama, T. Effect of nitrate on nodule and root growth of soybean (Glycine max (L.) Merr.). Int. J. Mol. Sci. 2014, 15, 4464–4480. [Google Scholar] [CrossRef]
- La Menza, N.C.; Monzon, J.P.; Specht, J.E.; Grassini, P. Is soybean yield limited by nitrogen supply? Field Crops Res. 2017, 213, 204–212. [Google Scholar] [CrossRef]
- Zapata, F.; Danso, S.; Hardarson, G.; Fried, M. Time course of nitrogen fixation in field-grown soybean using nitrogen-15 methodology. Agron. J. 1987, 79, 172–176. [Google Scholar] [CrossRef]
- Barker, D.W.; Sawyer, J.E. Nitrogen application to soybean at early reproductive development. Agron. J. 2005, 97, 615–619. [Google Scholar] [CrossRef] [Green Version]
- Gutiérrez-Boem, F.H.; Scheiner, J.D.; Rimski-Korsakov, H.; Lavado, R.S. Late season nitrogen fertilization of soybeans: Effects on leaf senescence, yield and environment. Nutr. Cycl. Agroecosyst. 2004, 68, 109–115. [Google Scholar] [CrossRef]
- Bindraban, P.S.; Dimkpa, C.; Nagarajan, L.; Roy, A.; Rabbinge, R. Revisiting fertilisers and fertilisation strategies for improved nutrient uptake by plants. Biol. Fertil. Soils 2015, 51, 897–911. [Google Scholar] [CrossRef] [Green Version]
- Meng, S.; Zhang, C.; Su, L.; Li, Y.; Zhao, Z. Nitrogen uptake and metabolism of Populus simonii in response to PEG-induced drought stress. Environ. Exp. Bot. 2016, 123, 78–87. [Google Scholar] [CrossRef]
- Armijo, G.; Gutiérrez, R.A. Emerging players in the nitrate signaling pathway. Mol. Plant 2017, 10, 1019–1022. [Google Scholar] [CrossRef]
- Krapp, A.; David, L.C.; Chardin, C.; Girin, T.; Marmagne, A.; Leprince, A.S.; Chaillou, S.; Ferrario-Méry, S.; Meyer, C.; Daniel-Vedele, F. Nitrate transport and signalling in Arabidopsis. J. Exp. Bot. 2014, 65, 789–798. [Google Scholar] [CrossRef]
- Fresneau, C.; Ghashghaie, J.; Cornic, G. Drought effect on nitrate reductase and sucrose-phosphate synthase activities in wheat (Triticum durum L.): Role of leaf internal CO2. J. Exp. Bot. 2007, 58, 2983–2992. [Google Scholar] [CrossRef] [Green Version]
- Wilkinson, S.; Bacon, M.A.; Davies, W.J. Nitrate signalling to stomata and growing leaves: Interactions with soil drying, ABA, and xylem sap pH in maize. J. Exp. Bot. 2007, 58, 1705–1716. [Google Scholar] [CrossRef]
- Krouk, G.; Crawford, N.M.; Coruzzi, G.M.; Tsay, Y.F. Nitrate signaling: Adaptation to fluctuating environments. Curr. Opin. Plant Biol. 2010, 13, 265–272. [Google Scholar] [CrossRef] [PubMed]
- Thomas, F.M.; Hilker, C. Nitrate reduction in leaves and roots of young pedunculate oaks (Quercus robur) growing on different nitrate concentrations. Environ. Exp. Bot. 2000, 43, 19–32. [Google Scholar] [CrossRef]
- Hummel, I.; Pantin, F.; Sulpice, R.; Piques, M.; Rolland, G.; Dauzat, M.; Christophe, A.; Pervent, M.; Bouteillé, M.; Stitt, M. Arabidopsis plants acclimate to water deficit at low cost through changes of carbon usage: An integrated perspective using growth, metabolite, enzyme, and gene expression analysis. Plant Physiol. 2010, 154, 357–372. [Google Scholar] [CrossRef] [Green Version]
- Szabados, L.; Savoure, A. Proline: A multifunctional amino acid. Trends Plant Sci. 2010, 15, 89–97. [Google Scholar] [CrossRef] [PubMed]
- Ben, K.R.; Abdelly, C.; Savouré, A. Proline, a multifunctional amino-acid involved in plant adaptation to environmental constraints. Biol. Aujourd’hui 2012, 206, 291–299. [Google Scholar]
- Matysik, J.; Alia; Bhalu, B.; Mohanty, P. Molecular mechanisms of quenching of reactive oxygen species by proline under stress in plants. Curr. Sci. 2002, 82, 525–532. [Google Scholar]
- Bartels, D.; Sunkar, R. Drought and salt tolerance in plants. Crit. Rev. Plant Sci. 2005, 24, 23–58. [Google Scholar] [CrossRef]
- Wingler, A.; Quick, W.; Bungard, R.; Bailey, K.; Lea, P.; Leegood, R. The role of photorespiration during drought stress: An analysis utilizing barley mutants with reduced activities of photorespiratory enzymes. Plant Cell Environ. 1999, 22, 361–373. [Google Scholar] [CrossRef]
- Pinheiro, C.; Chaves, M. Photosynthesis and drought: Can we make metabolic connections from available data? J. Exp. Bot. 2010, 62, 869–882. [Google Scholar] [CrossRef] [Green Version]
Figure 1.
Changes of (A) SOD activities, (B) POD activities, (C) CAT activities and (D) MDA concentrations in leaves of CV.SN17, CV.SN8 and CV.SN12 under control and drought stress conditions. Data show the means ± standard deviation of three independent samples. Different letters above vertical bars indicate significant differences between means at a p < 0.05 level.

Figure 2.
Changes of (A) nitrogen content and (B) nitrate content in leaves of CV.SN17, CV.SN8, and CV.SN12 under control and drought stress conditions. Data show the means ± standard deviation of three independent samples. Different letters above vertical bars indicate significant differences between means at a p < 0.05 level.

Figure 3.
Changes of (A) NR activities, (B) NiR activities, (C) GS activities, and (D) GAGAT activities in leaves of CV.SN17, CV.SN8, and CV.SN12 under control and drought stress conditions. Data show the means ± standard deviation of three independent samples. Different letters above vertical bars indicate significant differences between means at a p < 0.05 level.

Figure 4.
Changes of expression patterns of (A) GmNR, (B) GmNiR, (C) GmGS, and (D) GmGOGAT in leaves of CV.SN17, CV.SN8 and CV.SN12 under control and drought stress conditions. Data show the means ± standard deviation of three independent samples. Different letters above vertical bars indicate significant differences between means at a p < 0.05 level.

Figure 5.
Changes of (A) soluble protein concentrations, (B) free amino acid concentrations, (C) proline concentrations, and (D) soluble sugar concentrations in leaves of CV.SN17, CV.SN8 and CV.SN12 under control and drought stress condition. Data show the means ± standard deviation of three independent samples. Different letters above vertical bars indicate significant differences between means at a p < 0.05 level.

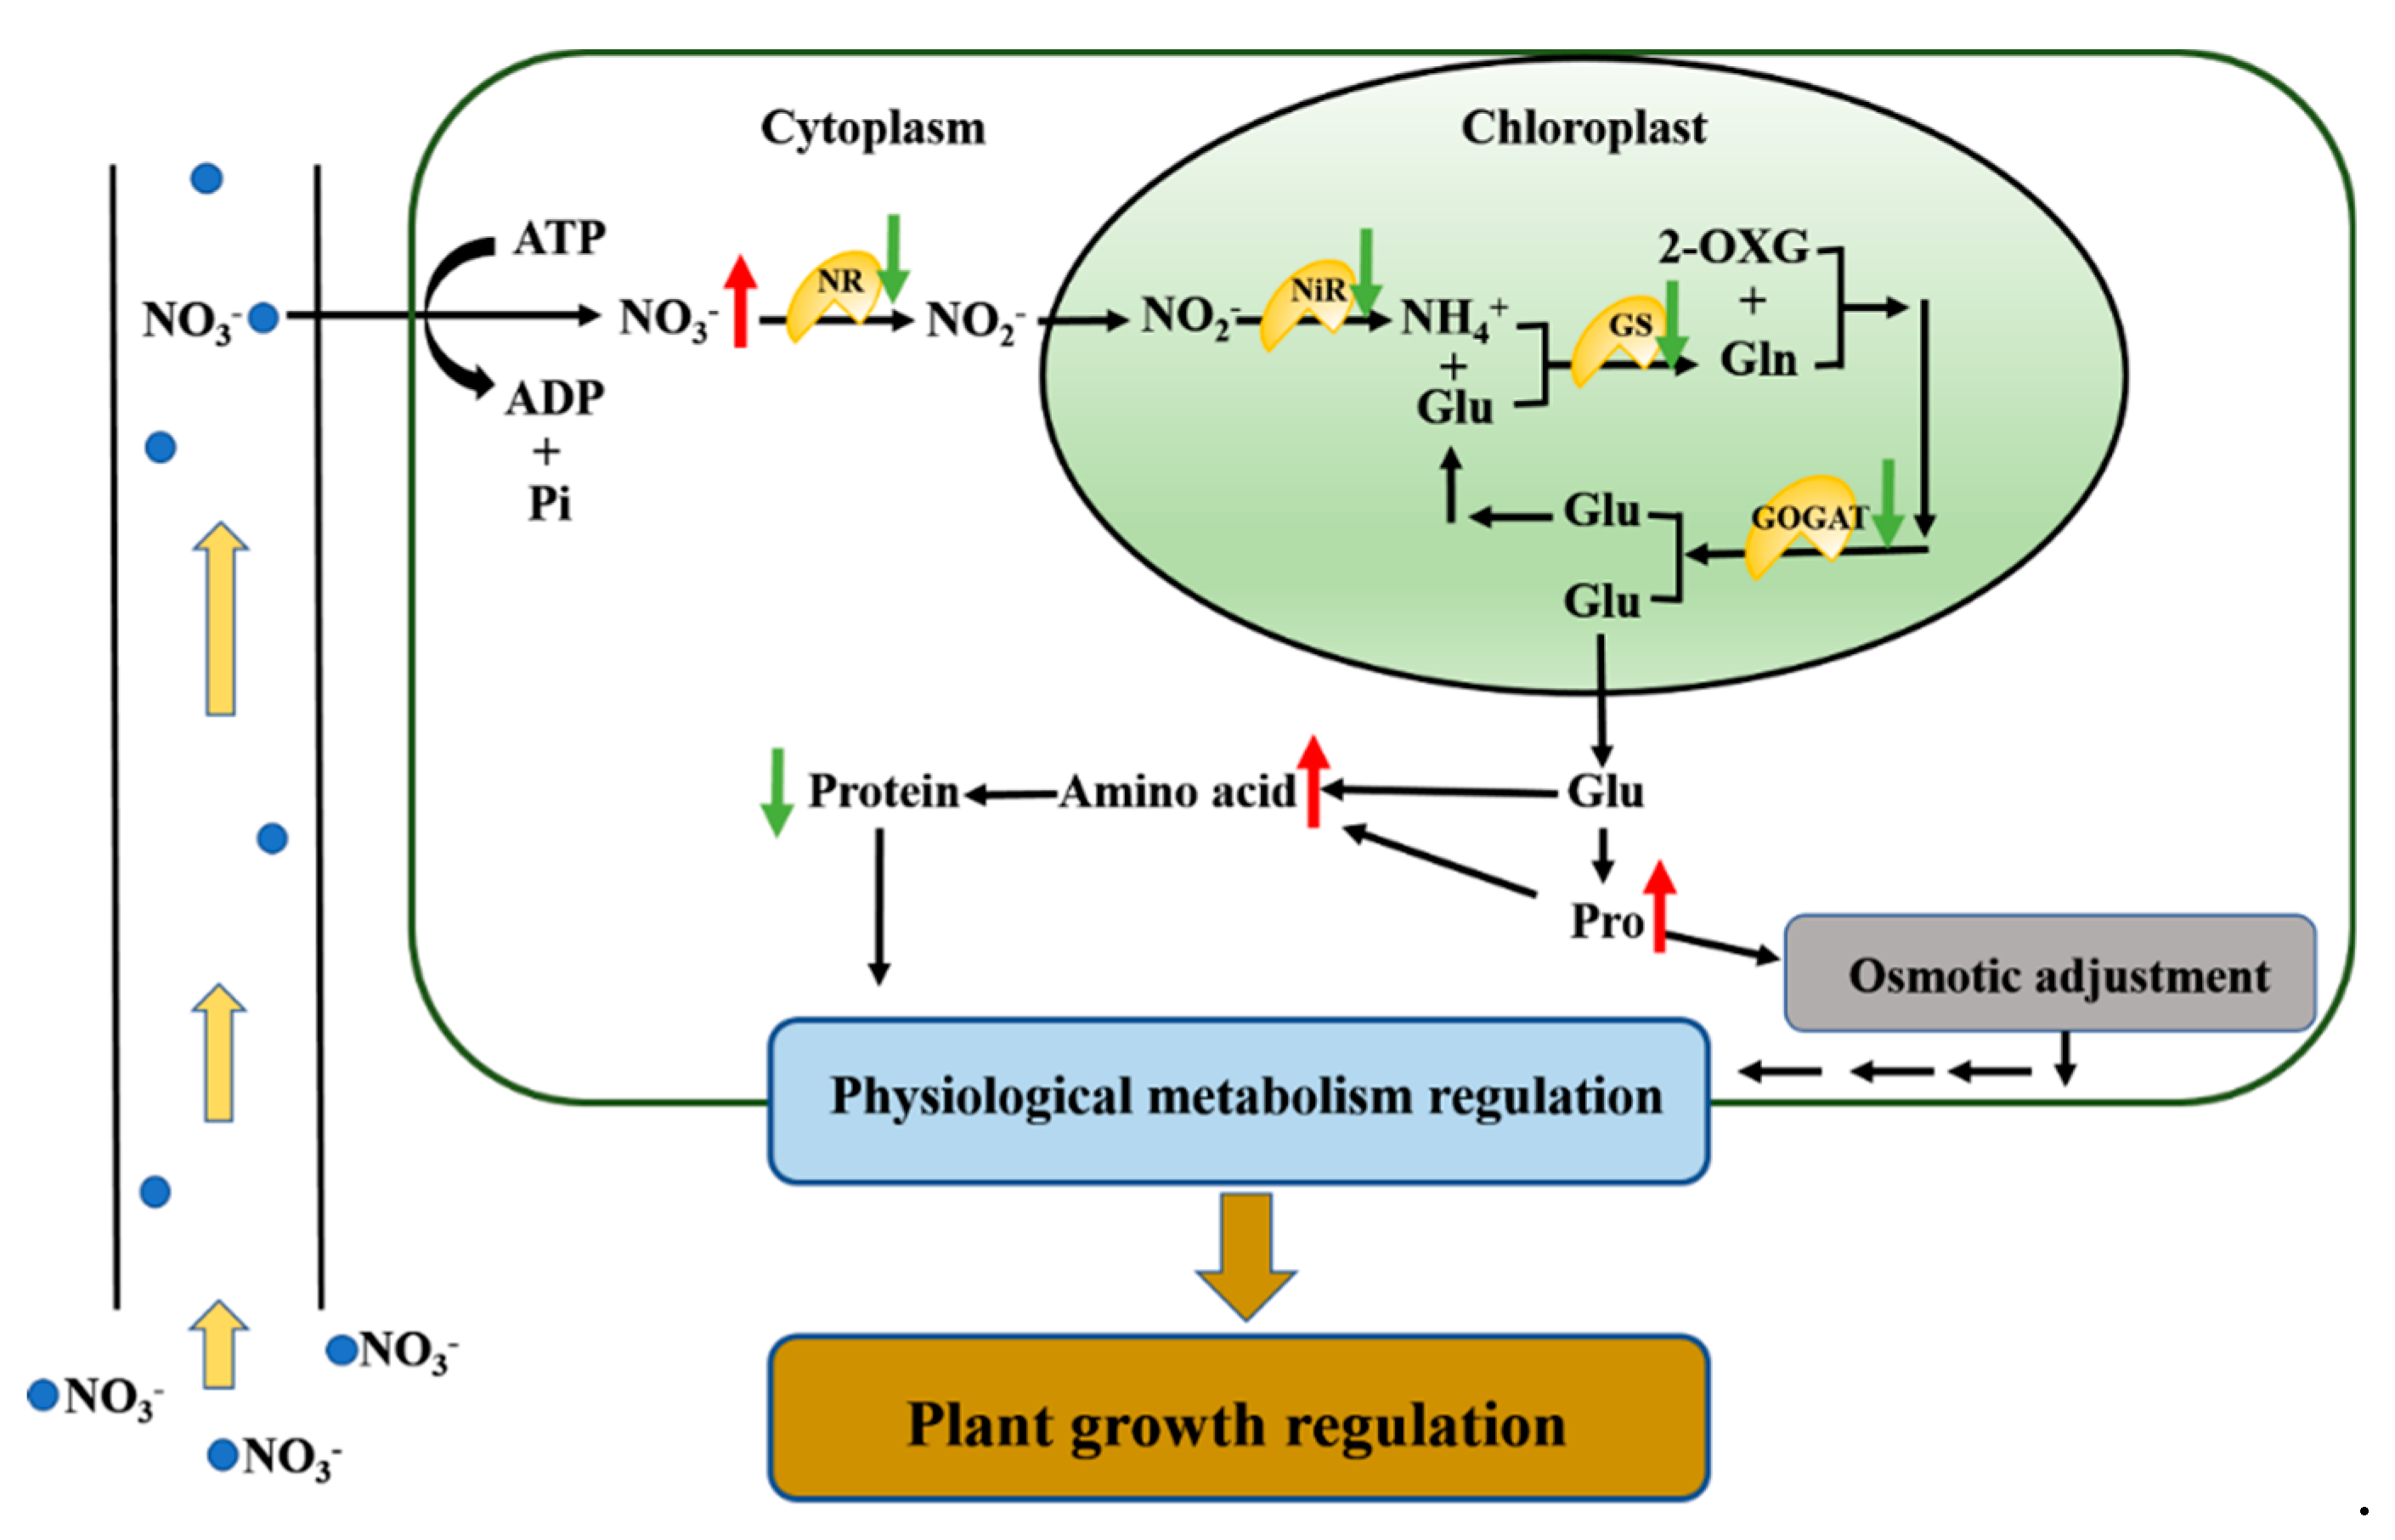
Figure 6.
A model of the nitrogen regulation in soybean leaf in response to drought stress. Here, drought stress triggers a nitrogen-mediated tandem reaction in response to drought stress. Drought stress might change the expression of key regulatory metabolic genes and the activities of nitrogen metabolism enzymes, which regulate nitrogen distribution and utilization to adapt to environmental stress. NR, nitrate reductase; NiR, nitrite reductase; GS, glutamine synthetase; GOGAT, glutamate synthetase; Glu, glutamate; Gln, glutamine; 2-OXG, 2-oxoglutarate. Increased items under drought stress are marked with upward red arrows and decreased items are marked with downward green arrows.


Table 1.
Specific primers used in this study.
| Gene Name | Primer ID | Primer Sequence |
|---|---|---|
| GmNR | Glyma.06G109200_F | GATCCTCGCCCGTATGAAGG |
| Glyma.06G109200_R | CATACTTGGACCCACCACCC | |
| GmNiR | Glyma.02G132100_F | AACCCCGCCATGTCAAACTT |
| Glyma.02G132100_R | TTGCAGGCATGTAAGCCAGA | |
| GmGS | Glyma.11G215500_F | CTATTCCCACTAACAAG AGGCACGC |
| Glyma.11G215500_R | GCCAACACCACAGTAGTATGGACCG | |
| GmGOGAT | Glyma.03G128300_F | ACACTCTCATCTTCTCTCTCTCTCTCTCTCG |
| Glyma.03G128300_R | CGTTGTGGAGGGAAGGGAATG | |
| GmEF1a | Glyma.05G114900_F | GACCTTCTTCGTTTCTCGCA |
| Glyma.05G114900_R | CGAACCTCTCAATCACACGC | |
| GmEF1b | Glyma.14G039100_F | GTTGAAAAGCCAGGGGACA |
| Glyma.14G039100_R | TCTTACCCCTTGAGCGTGG |
Table 2.
Effect of drought stress on dry matter accumulation and seed yield.
| Genotype | Treatment | Root Biomass (g plant−1) | Stem Biomass (g plant−1) | Pod Wall Weight (g plant−1) | Pod Number (plant−1) | Seed Number (plant−1) | Seed Weight (g plant−1) | 100-Seed Weight (g plant−1) |
|---|---|---|---|---|---|---|---|---|
| CV.SN17 | CK | 8.04 ± 1.41a | 21.32 ± 2.5a | 16.9 ± 0.51a | 75 ± 3a | 147 ± 2b | 38.31 ± 0.25a | 25.03 ± 0.54a |
| DS | 2.40 ± 0.5d | 10.21 ± 1.14d | 5.33 ± 0.22d | 27 ± 3e | 53 ± 1f | 12.03 ± 1.16e | 21.05 ± 0.85c | |
| CV.SN8 | CK | 3.31 ± 0.5bc | 14.07 ± 1.92c | 12.7 ± 1.69c | 70 ± 3b | 126 ± 5c | 33.24 ± 0.87b | 25.54 ± 0.95a |
| DS | 2.40 ± 0.27bc | 6.88 ± 1.82e | 4.06 ± 0.63e | 39 ± 3d | 61 ± 5e | 11.16 ± 1.00e | 22.16 ± 0.60b | |
| CV.SN12 | CK | 3.92 ± 0.42b | 18.6 ± 0.98b | 13.83 ± 0.39b | 80 ± 2a | 227 ± 9a | 38.98 ± 0.67a | 16.82 ± 0.11d |
| DS | 2.96 ± 0.23cd | 11.99 ± 0.48d | 5.05 ± 0.53d | 51 ± 2c | 94 ± 7d | 16.75 ± 0.31d | 15.95 ± 0.11d | |
| Source of variations | ||||||||
| Treatment (T) (df = 1) | 121.85 ** | 235.87 ** | 1262.44 ** | 913.92 ** | 1625.56 ** | 10500.15 ** | 88.06 ** | |
| Genotype (G) (df = 2) | 39.35 ** | 39.05 ** | 34.43 ** | 52.47 ** | 287.27 ** | 203.14 ** | 261.91 ** | |
| T × G (df = 2) | 47.90 ** | 6.84 ** | 12.32 ** | 26.64 ** | 73.59 ** | 35.86 ** | 10.63 ** |
Different letters indicate significant differences between means at the p < 0.05 level. ** Significant at the 0.01 probability levels. NS, Not significant. CK, control conditions; DS, drought stress conditions. Standard deviations were calculated with three independent experiments, each comprising two soybean plants.
Table 3.
Biomass proportion (%) of soybean root, stem, pod wall, and seed under drought stress.
| Cultivars | Treatment | Root/Plant | Stem/Plant | Pod Wall/Plant | Seed/Plant |
|---|---|---|---|---|---|
| CV.SN17 | CK | 9.51 | 25.21 | 19.99 | 45.30 |
| DS | 8.00 ** | 34.06 ** | 17.79 ** | 40.15 ** | |
| CV.SN8 | CK | 5.23 | 22.22 | 20.05 | 52.50 |
| DS | 9.79 ** | 28.10 ** | 16.56 ** | 45.55 ** | |
| CV.SN12 | CK | 5.20 | 24.69 | 18.36 | 51.75 |
| DS | 8.06 ** | 32.62 ** | 13.73 ** | 45.58 ** |
** Significant at the 0.01 probability levels. NS, Not significant. CK, control conditions; DS, drought stress conditions.
Table 4.
Analysis of variance of physiological parameters.
| Traits (/plant) | Source of Variations | ||||||
|---|---|---|---|---|---|---|---|
| Growth Stages (S) (df = 2) | Treatment (T) (df = 1) | Genotype (G) (df = 2) | S × T (df = 2) | S × G (df = 4) | T × G (df = 2) | S × T × G (df = 4) | |
| Nitrogen concentration (mg g−1) | 73.78 ** | 258.81 ** | 119.48 ** | 6.44 ** | 3.38 * | 23.87 ** | 0.97 NS |
| Nitrate concentration (mg g−1) | 32.05 ** | 1104.61 ** | 110.56 ** | 135.7 ** | 6.97 ** | 35.01 ** | 6.09 ** |
| Soluble protein concentration (mg g−1) | 511.26 ** | 474.76 ** | 86.52 ** | 0.39 NS | 3.57 * | 17.8 ** | 21.48 ** |
| Free amino acid concentration (mg g−1) | 572.79 ** | 381.29 ** | 10.40 ** | 31.58 ** | 18.71 ** | 18.37 ** | 14.15 ** |
| Proline concentration (mg g−1) | 536.11 ** | 1021.81 ** | 271.68 ** | 115.43 ** | 105.69 ** | 171.75 ** | 62.22 ** |
| Soluble sugar concentration (mg g−1) | 108.4 ** | 137.38 ** | 36.11 ** | 8.65 ** | 5.00 ** | 0.21 NS | 2.04 NS |
| NR activity (μg−1 FW h−1) | 703.77 ** | 284.74 ** | 62.42 ** | 5.89 ** | 44.00 ** | 2.40 NS | 1.04 NS |
| NiR activity (μmol g−1 FW h−1) | 134.59 ** | 866.12 ** | 1.37 NS | 73.66 ** | 2.25 NS | 8.41 ** | 0.96 NS |
| GS activity (μmol g−1 FW h−1) | 1351.24 ** | 1082.03 ** | 306.95 ** | 22.38 ** | 36.10 ** | 31.98 ** | 34.78 ** |
| GOGAT activity (μmol g−1 FW h−1) | 548 ** | 227.48 ** | 56.22 ** | 2.11 NS | 29.15 ** | 1.43 NS | 0.29 NS |
| GmNR | 2475.46 ** | 18594.23 ** | 118.98 ** | 79.1 ** | 21.85 ** | 360.04 ** | 99.48 ** |
| GmNiR | 8857.47 ** | 17,121.19 ** | 1745.57 ** | 126.06 ** | 364.56 ** | 226.87 ** | 360.32 ** |
| GmGS | 10,763.28 ** | 7859.28 ** | 802.44 ** | 1446.63 ** | 16.56 ** | 22.94 ** | 179.66 ** |
| GmGOGAT | 6747.71 ** | 7460.88 ** | 27.14 ** | 580.73 ** | 49.6 ** | 50.34 ** | 15.31 ** |
| SOD activity (U mg−1 min−1) | 5132.44 ** | 643.77 ** | 34.80 ** | 84.27 ** | 21.18 ** | 6.94 ** | 5.38 ** |
| POD activity (U mg−1 min−1) | 1614.38 ** | 1147.66 ** | 103.75 ** | 61.04 ** | 23.00 ** | 46.86 ** | 24.72 ** |
| CAT activity (U mg−1 min−1) | 1510.18 ** | 1487.9 ** | 30.51 ** | 614.69 ** | 9.69 ** | 12.38 ** | 4.06 ** |
| MDA concentration (mmol g−1) | 156.35 ** | 137.39 ** | 3.00 NS | 12.18 ** | 7.47 ** | 4.10 * | 1.78 NS |
*, ** Significant at the 0.05 and 0.01 probability levels, respectively. NS, Not significant.
Table 5.
Pearson’s correlation of seed weight with physiological parameters during reproductive phases.
Table 5.
Pearson’s correlation of seed weight with physiological parameters during reproductive phases.
| Traits (/plant) | 15DAF | 30DAF | 45DAF |
|---|---|---|---|
| Nitrogen concentration (mg g−1) | 0.375 | 0.677 ** | 0.609 ** |
| Nitrate concentration (mg g−1) | −0.621 ** | −0.897 ** | −0.992 ** |
| Soluble protein concentration (mg g−1) | 0.674 ** | 0.621 ** | 0.725 ** |
| Free amino acid concentration (mg g−1) | −0.755 ** | −0.858 ** | −0.870 ** |
| Proline concentration (mg g−1) | −0.723 ** | −0.740 ** | −0.506 * |
| Soluble sugar concentration (mg g−1) | −0.803 ** | −0.587* | −0.721 ** |
| NR activity (μg g−1 FW h−1) | 0.712 ** | 0.886 ** | 0.948 ** |
| NiR activity (μmol g−1 FW h−1) | 0.884 ** | 0.956 ** | 0.978 ** |
| GS activity (μmol g−1 FW h−1) | 0.711 ** | 0.639 ** | 0.759 ** |
| GOGAT activity (μmol g−1 FW h−1) | 0.401 | 0.748 ** | 0.891 ** |
| GmNR | 0.968 ** | 0.929 ** | 0.930 ** |
| GmNiR | 0.960 ** | 0.746 ** | 0.871 ** |
| GmGS | 0.961 ** | 0.806 ** | 0.805 ** |
| GmGOGAT | 0.956 ** | 0.967 ** | 0.988 ** |
| SOD activity (U mg−1 min−1) | −0.651 ** | −0.937 ** | 0.844 ** |
| POD activity (U mg−1 min−1) | −0.668 ** | −0.903 ** | −0.779 ** |
| CAT activity (U mg−1 min−1) | −0.874 ** | −0.776 ** | −0.785 ** |
| MDA concentration (mmol g−1) | −0.778 ** | −0.659 ** | −0.859 ** |
*, ** Significant at the 0.05 and 0.01 probability levels, respectively. NS, Not significant.
© 2020 by the authors. Licensee MDPI, Basel, Switzerland. This article is an open access article distributed under the terms and conditions of the Creative Commons Attribution (CC BY) license (http://creativecommons.org/licenses/by/4.0/).
Share and Cite
MDPI and ACS Style
Du, Y.; Zhao, Q.; Chen, L.; Yao, X.; Xie, F. Effect of Drought Stress at Reproductive Stages on Growth and Nitrogen Metabolism in Soybean. Agronomy 2020, 10, 302. https://0-doi-org.brum.beds.ac.uk/10.3390/agronomy10020302
AMA Style
Du Y, Zhao Q, Chen L, Yao X, Xie F. Effect of Drought Stress at Reproductive Stages on Growth and Nitrogen Metabolism in Soybean. Agronomy. 2020; 10(2):302. https://0-doi-org.brum.beds.ac.uk/10.3390/agronomy10020302
Chicago/Turabian StyleDu, Yanli, Qiang Zhao, Liru Chen, Xingdong Yao, and Futi Xie. 2020. "Effect of Drought Stress at Reproductive Stages on Growth and Nitrogen Metabolism in Soybean" Agronomy 10, no. 2: 302. https://0-doi-org.brum.beds.ac.uk/10.3390/agronomy10020302
Note that from the first issue of 2016, this journal uses article numbers instead of page numbers. See further details here.