Article

Estimation of Genetic Diversity in Seven Races of Native Maize from the Highlands of Mexico

by
Mario Rocandio-Rodríguez
1,
Amalio Santacruz-Varela
2,*,
Leobigildo Córdova-Téllez
2,
Higinio López-Sánchez
3,
Aurelio Hernández-Bautista
2,
Fernando Castillo-González
2,
Ricardo Lobato-Ortiz
2,
J. Jesús García-Zavala
2 and
Pedro Antonio López
3
1
Instituto de Ecología Aplicada, Universidad Autónoma de Tamaulipas, División del Golfo 356, Col. Libertad, Victoria 87019, Mexico
2
Colegio de Postgraduados Campus Montecillo, km. 36.5. Carr. Mexico-Texcoco, Texcoco 56230, Mexico
3
Colegio de Postgraduados, Campus Puebla, km. 125.5. Carr. Fed. Mexico-Puebla, Santiago Momoxpan, Cholula, Puebla 72760, Mexico
*
Author to whom correspondence should be addressed.
Submission received: 26 January 2020 / Revised: 14 February 2020 / Accepted: 15 February 2020 / Published: 22 February 2020
(This article belongs to the Special Issue Analysis of Crop Genetic and Germplasm Diversity)

Abstract

:
Characterizing the genetic diversity of maize (Zea mays L.) populations by their morphological and molecular attributes makes it possible to place populations into specific groups; thus, facilitating the design of procedures for their optimum and sustainable use. In this study, data from two lines of evidence were analyzed simultaneously to robustly classify maize populations and to determine their genetic relationships. Seven maize races of the central high plateau of Mexico were characterized using a combined analysis of 13 morphological traits and 31 microsatellite loci. The germplasm assessed included samples of 119 accessions held at Mexican germplasm banks. Cluster and principal component analyses were performed. Also, genetic and geographic relationships among the accessions were determined. Principal component analysis separated the different accessions into well-defined groups using first three principal components. The accessions of Arrocillo Amarillo and Elotes Cónicos races did not exhibit a grouping pattern, indicating greater genetic complexity. Better grounded grouping and phylogenetic relationships were obtained when traits of both lines of evidence were used simultaneously.

1. Introduction

The evolutionary history of maize (Zea mays L.), as well as its diversity, has been of interest for numerous studies [1], which have focused mainly on morphological variation [2,3]. In other classic studies, Cervantes, Goodman, Casas and Rawlings [4] used genetic effects and the interaction genotype × environment, while Sánchez, Goodman and Rawlings [5] involved the effects of the interaction genotype × environment along with stability parameters, which enabled to classify individuals more precisely into discrete units [6], although these parameters may not necessarily provide reliable information on possible phylogenetic relationships [7]. More recently, molecular tools, such as simple sequence repeats of DNA (SSRs) have been applied in studies of maize landraces [8,9,10,11,12], and the data and findings have added substantially to understanding maize evolution and diversification.
Some classification work on Mexican maize landraces has been based on phenetic analysis, using morphological traits [12,13], in combination, in some instances, with isozyme allelic frequencies [14,15], and combinations of morphological traits, isozymes and microsatellites have also been used [16]. Morphological and agronomic characterization has been very useful for the study and assessment of genetic resources; however, morphological and agronomic traits are attributes that may or may not be inherited and may be controlled by one or multiple genes [17]. They may also have limitations that restrict recovering genetic information, such as pleiotropic effects, ignorance of the genetic base, type of inheritance, or high susceptibility to environmental influence [18]. For these reasons, in recent years and due to progress in molecular biology, the use of molecular markers such as microsatellites has complemented the information from morphological traits, making it possible to estimate neutral genetic diversity. Although assessment of molecular data is more complex than that of morphological traits, there is the advantage that environmental influence is negligible and comparisons can be made between individuals of the same or different species, kinship and phylogenetic relations can be established, and processes of migration and genetic drift can be revealed. Moreover, a large amount of genetic information on populations can be obtained [19].
The convenience of using sets of data separately and combined has been discussed. Avise [20] argue that separate analyses may result in conflicts in the resolution of the trees, or classifications, given that the traits may have different origins; that is, they may be affected to a greater or lesser degree by natural or artificial selection, or they may have a different evolutionary rate, among other reasons. Furthermore, [21,22] put forth the possibility of obtaining better grounded classification when traits of different nature are combined, although it is expected that some errors generated by a certain type of traits or marker can be minimized using other markers According to [23,24,25,26,27], one of the most accepted approaches for analyzing this information is that of simultaneous analysis, or total evidence, since it gives more precision to the classifications and maximizes descriptive efficiency and explanatory power of all the information.
In recent years, the genetic diversity of maize was analyzed by Rocandio-Rodríguez, Santacruz-Varela, Córdova-Téllez, López-Sánchez, Castillo-González, Lobato-Ortiz, García-Zavala and Ortega-Paczka [14], who assessed phenotypically 119 accessions of maize at the Mexican highlands. In other study Rocandio-Rodríguez, Santacruz-Varela, Córdova-Téllez, López-Sánchez, Castillo-González, Lobato-Ortiz, and García-Zavala [11], also studied the genetic structure and molecular genetic diversity within and among these same accessions along with the race Balsas of teosinte (Zea mays ssp. parviglumis). Based on the above, to understand maize diversity and obtain better grounded phylogenetic relations of the accessions within discrete units (races), this study aimed to classify accessions of the seven maize races most cultivated at the Mexican central high plateau, and examine similarity relations among populations and groups of populations according to the combined analysis of morphological traits and microsatellite allele frequencies.

2. Materials and Methods

2.1. Biological Material

One hundred and seven accessions, representative of seven maize races of the central highlands of Mexico, were characterized: 10 Arrocillo Amarillo, 11 Cacachuacintle, 22 Chalqueño, 23 Cónico, 14 Elotes Cónicos, 8 Palomero Toluqueño, 19 Purépecha, along with two commercial varieties used as reference. The seed used was acquired from the germplasm banks of the International Maize and Wheat Improvement Center (CIMMYT), and Mexican institutions as Chapingo Autonomous University, National Institute of Research on Forestry, Agriculture and Livestock, and Colegio de Postgraduados. The accessions were identified visually by expert classifiers as those that most closely exhibited the ear and plant characteristics of each race.

2.2. Field Assessments

The field experiments were set up during the 2010 Spring-Summer growing cycle in three environments of the high Mexican plateau: Ciudad Serdán (18°50′ latitude N, 97°28′ longitude W, altitude of 2570 masl) and San Mateo Capultitlán (19°08′ latitude N; 98°28′ longitude W, altitude 2260 masl), state of Puebla and Montecillo, State of Mexico (19°27′ latitude N, 98°54′ longitude W, altitude 2250 masl). Experimental design was complete randomized blocks with two replications in each site. The experimental unit or plot consisted of two rows 5-m long and 0.8-m wide in which 44 seeds were equidistantly planted.

2.3. Morphological Traits Measured

In each experiment phenotypic traits were recorded. We randomly chose five competitive plants per plot in order to collect data for phenologic, vegetative, tassel, ear and kernel traits. Also, some ratios among those traits were calculated (Table 1).

2.4. Assessment of Microsatellite Polymorphism

The 107 accessions were analyzed using 31 microsatellite loci distributed on the ten maize chromosomes; there is ample information on these loci published in the Maize Genetics and Genomics Database (MaizeGDB), available on line at http://www.maizegdb.org/ssr.php# (Table 2).
For the molecular analysis, genomic DNA was extracted from 100 mg of mesocotyl, coleoptile, and young leaf tissue individually from 25 plants per accession with a commercial DNA extraction kit (ChargeSwitch® gDNA Plant, Invitrogen, Thermo Fisher Scientific, Carlsbad, USA), using a DNA extraction and purification robot (King Fisher Flex, ThermoScientific, Waltham, MA, USA). Amplification was performed individually by PCR in volumes of 25 µL that contained 10 mM nucleotides, 25 mM MgCl2, 5× buffer, 100 ng template DNA, 1 unit DNA Taq polymerase, and 4 pmol of each primer. The protocol for PCR amplification consisted of initial denaturation for 4 min at 95 °C, followed by 25 cycles of 1 min at 95 °C, 2 min at 55 °C, 2 min at 72 °C, and one final extension of 60 min at 72 °C. PCR products were separated by capillary electrophoresis in a DNA sequencer (Genetic Analyzer ABI 3130, Applied Biosystems, Foster City, CA, USA) and detection was based on the presence of the fluorescent labels 6-FAM, ROX or HEX at the 5′ extreme of the forward primers using LIZ-500 as the size standard internal marker. Data files were generated with the allelic profile of the markers for each of the populations with the software GeneMapper® V. 4.0 [28], and allele variability with POPGENE 1.31 [29] software.

2.5. Statistical Analysis

Using the averages of the morphological data from the three sites, a combined analysis of variance was performed with SAS V.9.0. [30]. The linear model used was: Yijk = μ + αi + γj + δij + B(γ)k(j) + εijk, where Yijk is the observation of the ith accession in the jth environment of the kth block, μ is the general mean, αi is the effect of the ith accession, γj is the effect of the jth environment, δij is the interaction effect of the ith accession with the jth environment, B(γ)k(j) is the effect of the kth block nested into the jth environment, and εijk is the random error associated with the experimental unit [31].
Morphological traits were then selected using two statistical methods for additional analyses. The first method was based on repeatability coefficient (r), as suggested by Sánchez, Goodman and Rawlings [5], and the second one was based on the structure of the correlation matrix of independent variables distributed on Gabriel graphics [32]. The repeatability coefficient is a criterion proposed by Goodman and Paterniani [6], which is based on discriminating morphological variables based on the stability of the characters across the environments. When ≥1, the variable is considered stable and appropriate for classification.
Allele frequencies were selected based on the level of significance between populations for each of the alleles (p ≤ 0.05) Also selected were those alleles that had a frequency above 2%. This was done to avoid problems of distancing between accessions and of interpretation when involving low frequency or single alleles in the grouping analyses.
With the morphological traits and allele frequencies selected from the 31 microsatellite loci detected in each of the individuals, a data matrix was constructed with 107 populations, using a total of 224 variables (13 morphological traits and frequency of 211 alleles previously selected). The variables were standardized by subtracting the mean and dividing by the standard deviation. The dataset was used to calculate Gower distances, which are recommended when variables of different nature are used [33] among populations; this was done with SAS V.9.0. [30] software. A phylogenetic tree was then constructed with the Neighbor-Joining method [34] in NTSYSpc V.2.2 software [35], and the population Sina-2 of the Chapalote race, considered one of the ancient maize landraces [2] was used as an outgroup.
Allele frequencies and morphological information were used to construct a correlation matrix among the traits. Each morphological trait and each allele were considered as an independent variable. The principal component analysis was based on the correlation matrix and processed with the statistical software SAS V.9.0. [30].

3. Results

3.1. Analysis of Variance

Analysis of variance evidenced highly significant differences among populations for all the measured characteristics (Table 3). For population-environment interaction, it was observed that traits as plant height, peduncle length of the tassel, length of branched part of tassel, ear length, kernel width, ear grain percentage, weight of 100 kernels, volume of 100 kernels, kernel thickness/kernel length, and weight of 100 kernels/volume of 100 kernels had non-significant interaction. Finally, estimators of variance components produced values of repeatability r ≥ 1 for 19 out of the 32 traits (Table 4).

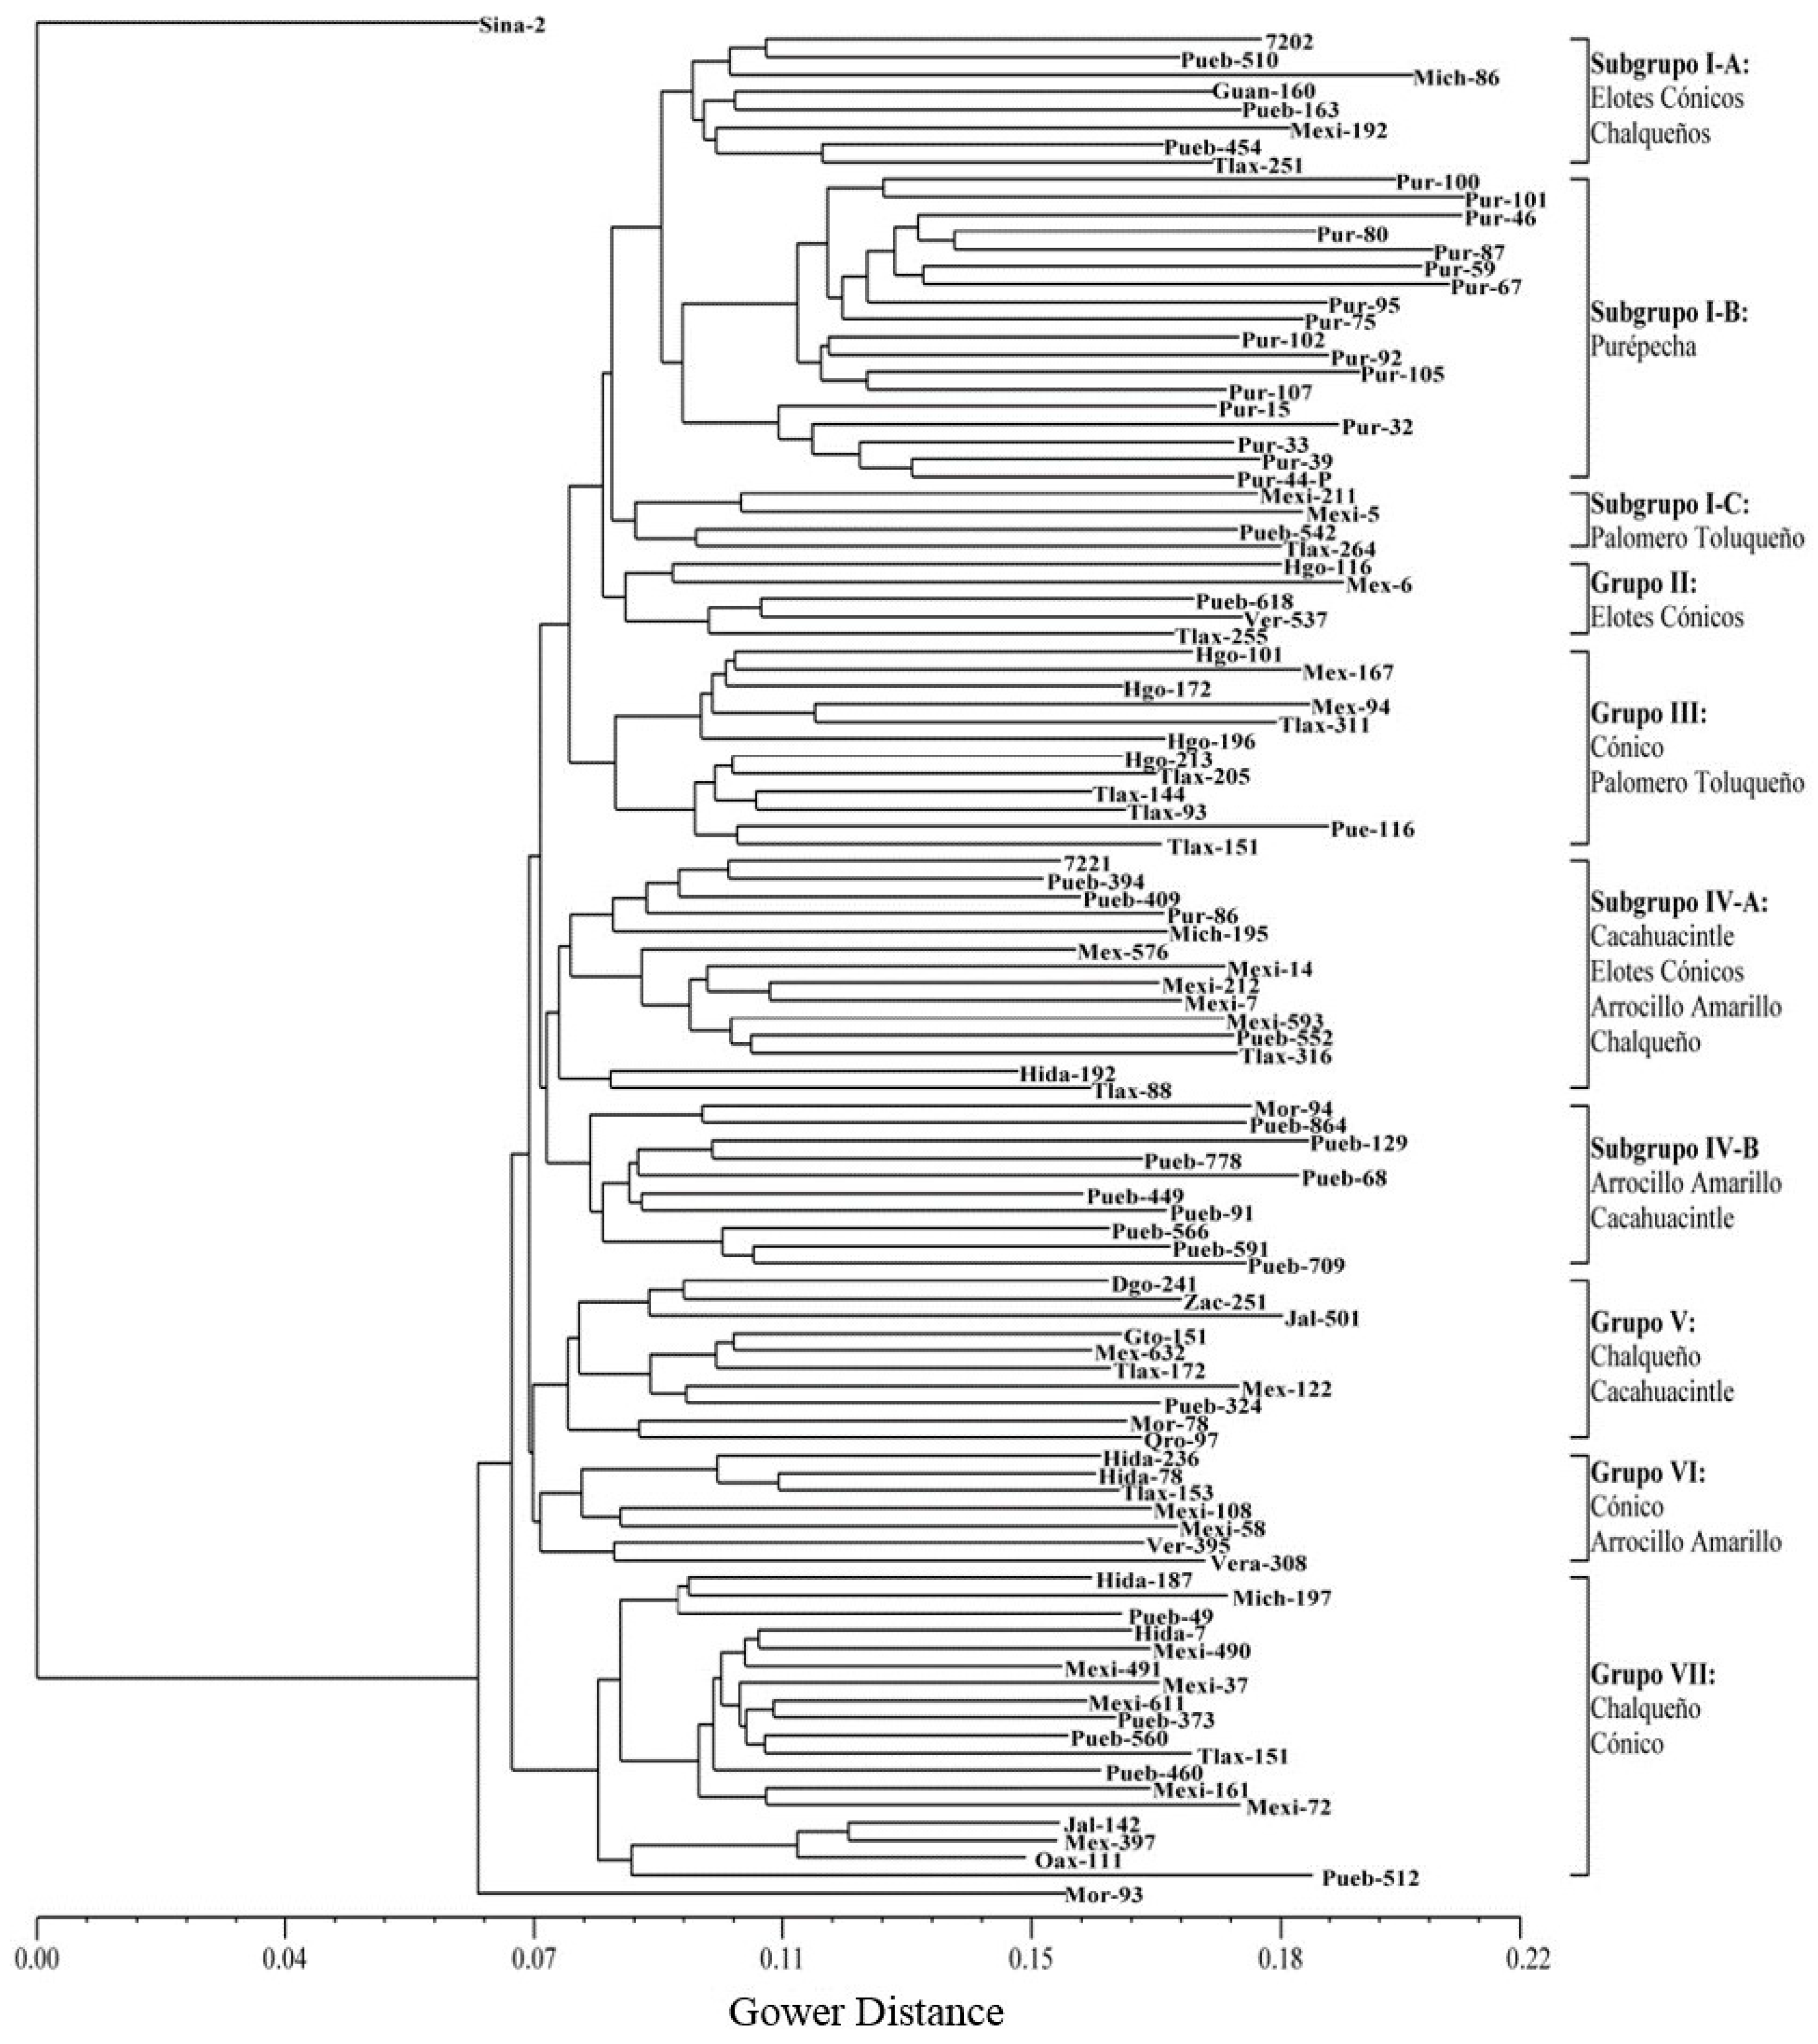
3.2. Cluster and Principal Component Analyses

To define the final set of traits, the correlation matrix was generated, and one trait of those pairs with a correlation coefficient above 0.7 was eliminated. In this way, 13 final traits (FF, LCS, NLE, KR, EL, ED/EL, KW, W100K, KW/KL, KT/KL, KT, KL and W100K/V100K) were chosen for the assessment of racial diversity and classification.
According to the cluster analysis, a total of seven groups were observed (Figure 1). Group I was integrated by accessions of the Purépecha, Palomero Toluqueño and Elotes Cónicos races. Group II, was placed in the upper part of the phylogram, it was represented by accessions Hgo-116, Mex-6, Pueb-618, Ver-537 and Tlax-255, belonging to the Elotes Cónicos race. Group III included nine populations of the Cónico race, originating from the states of Hidalgo and Tlaxcala, and three Palomero Toluqueño accessions from the states of Mexico and Tlaxcala. Group IV was formed by a mixed set of different races (Cacahuacintle, Elotes Cónicos, Arrocillo Amarillo, Chalqueño, Purépecha). Group V comprised eight Chalqueño populations, predominantly from the states of Durango, Guanajuato, Jalisco, Zacatecas and Querétaro, and two Cacahuacintle populations. Group VI was formed by Cónico accessions from the states of Mexico, Hidalgo and Tlaxcala as well as Arrocillo Amarillo accessions from states of Veracruz and Mexico. Group VII integrated populations of the races Cónico and Chalqueño, predominantly from the states of Mexico, Hidalgo Puebla and Tlaxcala, and one population (Pue-512) of the Elotes Cónicos race, distinguished for its recent formation.
Dispersion of the 107 maize accessions of the highlands of Mexico was represented in a three-dimensional space determined by the first three principal components (Figure 2), which exhibited broad variation within each racial group and groups defined by race. The first principal component explained 8.7% of the total variation, and the alleles that most contributed were phi072-C, phi121-B, phi121-H, phi346482-J, phi093-E, phi015-K, phi050-H, phi024-Q, phi427913-F, phi346482-I, phi402893-G and phi127-B toward the positive end, while the morphological traits that had the largest influence were ED/EL, EL and KT/KL. The second principal component explained 4.9% of the total variation and was influenced mostly by the high frequency of the alleles phi033-L, phi115-C, phi265454-M, phi402893-B, phi115-A, phi051-D, phi053-G, phi96100-C, phi101249-B, phi96100-N and phi265454-P at the positive end of the component. The third PC explained 4.6% of the total variation and was more closely associated with morphological traits (LCS, EL, KW, W100G, W100K/V100K, KT and FF) and with some allele frequencies (phi050-G and phi427913-I).

4. Discussion

The high degree of variation found suggests the existence of broad genetic diversity among genotypes. Based on the value of repeatability, a total of 32 traits were selected at the first stage. With the exception of PH and LBT, the selected traits in this stage were not statistically significant for the interaction genotypes × localities. This gives them properties that are desirable for classification. According to Sánchez, Godman and Rawlings [5], the traits that are less affected by environment are more useful for characterizing populations. Some of the traits detected here as appropriate for classification were also selected by [5], who indicated that ear, and in general reproductive traits are the most suitable for characterization of maize races. Among these NL, LCS, KW, ED/EL and KW/KL are included.
Thirteen (FF, LCS, NLE, KR, EL, ED/EL, KW, W100K, KW/KL, KT/KL, KT, KL and W100K/V100K) were selected for performing the cluster and PCA procedures, based on correlation analysis. Most of these traits had also been selected in other studies of maize genetic diversity [5,15,16,36,37].
The dendrogram differentiated seven groups, with subgroups within two of them. Group I had three subgroups. Subgroup I-A included six accessions of the Elotes Cónicos race and two of the Chalqueño race; Subgroup I-B comprised most of the populations of the Purépecha race, which formed a well-defined cluster, with poorly differentiated native populations within the Sierra Purépecha region (Salvador Escalante, Charapan, Tingambato, Nahuatzen and Paracho, Michoacán), which is isolated by several geographic barriers created by the mountainous orography; cultural identity is strong and there are semi-collective forms of land use [38]. The results suggest that these populations constituted a genetic group different from the Chalqueño group, and strongly justify their integration into the newly described race Purépecha, as it was proposed by Romero, Castillo and Ortega [39] and later confirmed by Subgroup I-C comprised four Palomero Toluqueño accessions.
The nine populations (Group III) of the Cónico race were grouped intermediately between Palomero Toluqueño populations (Subgroup I-C) and those of Cacahuacintle (Subgroup IV-A). This is in agreement with [2], who proposed that the Cónico race could be a product of hybridization between Palomero Toluqueño and Cacahuacintle races. In this group, the Cónico accession Pue-116 is outstanding as it appeared as a recently formed population.
Group IV is divided into two subgroups. Subgroup IV-A integrated six accessions of Cacahuacintle, three Elotes Cónicos, two Arrocillo Amarillo, two Chalqueño and one Purépecha population (Pur-86). Subgroup IV-B was defined by geographic origin, exhibiting populations from the state of Puebla (five Arrocillo Amarillo, three Cacahuacintle and one Cónico), as well as one population of the Chalqueño race from Totolapan, Morelos. The Cacahuacintle and Arrocillo Amarillo races are associated in both Subgroups (IV-A and IV-B), indicating a higher degree of diversity [2,13,40], since both are closely related and share similar traits.
The interspersing of the Cónico and Chalqueño races in Groups V, VI and VII indicates that the two races are closely related due to the constant gene flow among their populations. This did not allow placing the populations in well-defined groups because their geographic distribution is almost identical. Results reveal that the principal maize races of the Mexican highlands share a common origin and have a diffuse genetic background extending throughout the populations; this is also indicated by the presence of common alleles of the molecular markers and similar values of the morphological traits; therefore, it is inferred that differentiation of these races has been influenced mainly by natural and artificial selection pressure in relatively recent times.
The Cónico population Mor-93 was placed alone in the far inner part of the phylogram. It is likely that this population has not been in contact with those of other regions, or it has had influence from materials not included in this study.
Regarding the principal component analysis of the combined dataset (frequencies of 211 SSR alleles and 13 morphological traits), the first 20 principal components explained 55.1% of the variance. When allele frequencies are involved in the analysis, it is common that the percentage of explained variance decreases notably; in contrast, when only morphological characterization is used, a higher percentage is reached with a smaller number of principal components [37,41]. Such reduction could be due to the rare alleles present in the population, effect of molecular markers in the genetic architecture of the traits, and the linkage between the molecular markers and major or minor genes explicating the phenotypic diversity present in the population [42].
The principal component analysis revealed grouping patterns very similar to those observed in the phylogenetic analysis, indicating that the definition of the associations is highly consistent. Races Cacahuacintle, Purépecha, Elotes Cónicos, Palomero Toluqueño constitute well-defined groups, while the Chalqueño race exhibis two groups, in which it was possible to distinguish accessions from the states of Durango, Zacatecas, Jalisco and Querétaro from those of the traditional core of this race located in the highlands of central Mexico. The Cónico accessions overlapped with the Chalqueño race, indicating genetic complexity influenced by neutral selective markers. Spatial distribution of populations observed on the principal component analysis was similar to that reported by Wellhausen, Roberts, Hernández and Mangelsdorf [2], who found that the race Cónico was localized between Palomero Toluqueño and Cacahuacintle. Such result suggested that the race Cónico was derived from the cross between both races, or that a close relationship does exist between the three races. In addition, a strong grouping was observed between the races Cónico and Elotes Cónicos, and some authors as Wellhausen, Roberts, Hernández and Mangelsdorf [2] even considered that Elotes Cónicos is only a pigmented sub-race of Cónico.
Spatial distribution of the Purépecha race, according to the three first principal components, shows that the populations are very similar, observed in the compact group toward the positive end of the first principal component. It can also be observed that populations of the Cónico race are found far apart, indicating that the variation into this race is very broad, or rather that the populations are not appropriately classified in the Mexican germplasm banks. Most of the maize accessions from Mexican germplasm banks were classified according to morphological variables. However, the morphological variables are often susceptible to phenotypic plasticity [43], which caused a bias in the classification of some populations of the Mexican germplasm banks. Our study demonstrated that this disadvantage can be solved with the combined use of molecular markers and morphological variables.
In the same context, it can be observed that accessions Mex-122 of the Cacahuacintle race and Pur-86 of the Purépecha race do not coincide with their respective groups. This suggests that they are perhaps not correctly classified or that they have had genetic influence from other races.

5. Conclusions

The molecular and morphological information analyzed together for racial classification provided strong elements for understanding diversification and evolutionary relationships that exist among the maize landraces of the highlands of Mexico. Results obtained in this study, in general, agree with the description in that the Pyramidal complex (races Cónico, Chalqueño, Palomero Toluqueño, Arrocillo Amarillo and Elotes Cónicos) are more closely related genetically, while the Cacahuacintle and Purépecha races are not closely associated with this complex.

Author Contributions

Conceptualization, A.S.-V. and L.C.-T.; methodology, A.S.-V., L.C.-T. and M.R.-R.; formal analysis, M.R.-R., A.H.-B.; investigation, M.R.-R., A.S.-V.; writing—original draft preparation, M.R.-R., A.H.-B., and A.S.-V.; writing—review and editing R.L.-O., J.J.G.-Z., H.L.-S., P.A.L. and F.C.-G.; visualization, A.S.-V. and L.C.-T.; supervision, A.S.-V. and L.C.-T.; project administration, A.S.-V. and L.C.-T.; funding acquisition, A.S.-V. and L.C.-T. All authors have read and agreed to the published version of the manuscript.

Funding

This research was funded by the Mexican National Service of Inspection and Certification of Seeds, grant number BI-Mz-09-ha, SINAREFI Project Huella Genética de Maíz.

Conflicts of Interest

The authors declare no conflict of interest.

References

  1. Kato, Y.T.A.; Mapes, C.S.; Mera, L.M.O.; Serratos, J.A.H.; Bye, R.A.B. Origen y Diversificación del Maíz: Una Revisión Analítica; Universidad Nacional Autónoma de México, Comisión Nacional para el Conocimiento y Uso de la Biodiversidad: Mexico City, Mexico, 2009; p. 116. [Google Scholar]
  2. Wellhausen, E.J.; Roberts, L.M.; Hernández, X.E.; Mangelsdorf, P.C. Races of Maize in México, their Origin, Characteristics and Distribution; The Bussey Institution of Harvard University: Cambridge, UK, 1952; p. 223. [Google Scholar]
  3. Hernández, X.E.; Alanís, F.G. Morphological study of five new maize races of the Sierra Madre Occidental of Mexico. Phylogenetic and phytogeographic implications. Agrociencia 1970, 5, 3–30. [Google Scholar]
  4. Cervantes, S.T.; Goodman, M.M.; Casas, D.E.; Rawlings, J.O. Use of genetic effects and genotype by environmental interactions for the classification of Mexican races of maize. Genetics 1978, 90, 339–348. [Google Scholar] [PubMed]
  5. Sánchez, G.J.J.; Goodman, M.M.; Rawlings, J.O. Appropriate characters for racial classification in maize. Econ. Bot. 1993, 47, 44–59. [Google Scholar] [CrossRef]
  6. Goodman, M.M.; Paterniani, E. The races of maize: III. Choices of appropriate characters for racial classification. Econ. Bot. 1969, 23, 265–273. [Google Scholar] [CrossRef]
  7. Doebley, J.F.; Iltis, H.H. Taxonomy of Zea (Gramineae). I. A subgeneric classification with key to taxa. Am. J. Bot. 1980, 67, 982–993. [Google Scholar] [CrossRef]
  8. Matsuoka, Y.; Vigoroux, Y.; Goodman, M.M.; Sánchez, G.J.; Buckler, E.; Doebley, J. A single domestication for maize shown by multilocus microsatellite genotyping. Proc. Natl. Acad. Sci. USA 2002, 99, 6080–6084. [Google Scholar] [CrossRef] [PubMed] [Green Version]
  9. Reif, J.C.; Waburton, M.L.; Xia, X.C.; Hoisington, D.A.; Crossa, J.; Taba, S.; Muminović, J.; Bohn, M.; Frisch, M.; Melchinger, A.E. Grouping of accessions of Mexican races of maize revisited with SSR markers. Theor. Appl. Genet. 2006, 113, 177–185. [Google Scholar] [CrossRef]
  10. Vigouroux, Y.; Glaubitz, J.C.; Matsuoka, Y.; Goodman, M.M.; Sánchez, G.J.; Doebley, J. Population structure and genetic diversity of New World maize races assessed by DNA microsatellites. Am. J. Bot. 2008, 95, 1240–1253. [Google Scholar] [CrossRef]
  11. Rocandio-Rodríguez, M.; Santacruz-Varela, A.; Córdova-Téllez, L.; López-Sánchez, H.; Castillo-González, F.; Lobato-Ortiz, R.; García-Zavala, J.J. Detection of genetic diversity of seven maize races from the high central valleys of Mexico using microsatellites. Maydica 2014, 59, 144–151. [Google Scholar]
  12. Vega-Alvarez, I.; Santacruz-Varela, A.; Rocandio-Rodríguez, M.; Córdova-Téllez, L.; López-Sánchez, H.; Muñoz-Orozco, A.; Hernández-Bautista, A. Genetic diversity and structure of native maize races from Northwestern Mexico. Pesq. Agropec. Bras. 2017, 52, 1023–1032. [Google Scholar] [CrossRef] [Green Version]
  13. Sánchez, G.J.J.; Goodman, M.M. Relationships among the Mexican races of maize. Econ. Bot. 1992, 46, 72–85. [Google Scholar] [CrossRef]
  14. Rocandio-Rodríguez, M.; Santacruz-Varela, A.; Córdova-Téllez, L.; López-Sánchez, H.; Castillo-González, F.; Lobato-Ortiz, R.; García-Zavala, J.J.; Ortega-Paczka, R. Morphological and agronomic characterization of seven maize races from the highlands of México. Rev. Fitotec. Mex. 2014, 37, 351–361. [Google Scholar]
  15. Sánchez, G.J.J.; Goodman, M.M.; Stuber, C.W. Isozymatic and morphological diversity in the races of maize of Mexico. Econ. Bot. 2000, 54, 43–59. [Google Scholar] [CrossRef]
  16. Mijangos-Cortés, J.O.; Corona-Torres, T.; Espinosa-Victoria, D.; Muñoz-Orozco, A.; Romero-Peñaloza, J.; Santacruz-Varela, A. Differentiation among maize (Zea mays L.) landraces from the Tarasca Mountain Chain, Michoacan, Mexico and the Chalqueño complex. Genet. Resour. Crop Evol. 2007, 54, 309–325. [Google Scholar] [CrossRef]
  17. Santacruz-Varela, A.; Widrlechner, M.P.; Ziegler, K.E.; Salvador, R.J.; Millard, M.J.; Bretting, P.K. Phylogenetic relationships among North American popcorns and their evolutionary links to Mexican and South American popcorns. Crop. Sci. 2004, 44, 1456–1467. [Google Scholar] [CrossRef] [Green Version]
  18. Lowe, A.J.; Hanotte, O.; Guarino, L. Standardization of molecular genetic techniques for the characterization of germplasm collections: The case of random amplified polymorphic DNA (RAPD). Plant Genet. Resour. Newsl. 1996, 107, 50–54. [Google Scholar]
  19. Pan, Y.B.; Burner, D.M.; Legendre, B.L.; Grisham, M.P.; White, W.H. An assessment of the genetic diversity within a collection of Saccharum spontaneum L. with RAPD-PCR. Genet. Resour. Crop Evol. 2004, 51, 895–903. [Google Scholar] [CrossRef]
  20. Avise, J.C. Molecular Markers, Natural History and Evolution, 2nd ed.; Sinauer Associates: Sunderland, MA, USA, 2004; p. 684. [Google Scholar]
  21. De Queiroz, A.; Donoghue, M.J.; Kim, J. Separate versus combined analysis of phylogenetic evidence. Annu. Rev. Ecol. Evol. Syst. 1995, 26, 657–681. [Google Scholar] [CrossRef]
  22. Chippindale, P.T.; Wiens, J.J. Weighting, partitioning, and combining characters in phylogenetic analysis. Syst. Biol. 1994, 43, 278–287. [Google Scholar] [CrossRef]
  23. Leal, A.A.; Mangolin, C.A.; do Amaral, A.T., Jr.; Gonçalves, L.S.A.; Scapim, C.A.; Mott, A.S.; Eloi, I.B.O.; Cordovés, V.; da Silva, M.F.P. Efficiency of RAPD versus SSR markers for determining genetic diversity among popcorn lines. Genet. Mol. Res. 2010, 9, 9–18. [Google Scholar] [CrossRef]
  24. Kluge, A.G. A concern for evidence and a phylogenetic hypothesis of relationships among Epicrates (Boidae, Serpentes). Syst. Zool. 1989, 38, 7–25. [Google Scholar] [CrossRef]
  25. Kluge, A.G.; Wolf, A.J. Cladistics: What’s in a word? Cladistics 1993, 9, 183–199. [Google Scholar] [CrossRef]
  26. Nixon, K.C.; Carpenter, J.M. On simultaneous analysis. Cladistics 1996, 12, 221–241. [Google Scholar] [CrossRef]
  27. Gulanbaier, T.; Seoung, B.M. Gower distance-based multivariate control charts for a mixture of continuous and categorical variables. Expert Syst. Appl. 2014, 41, 1701–1707. [Google Scholar]
  28. Applied, B. GeneMapper® Software Version 4.0. Reference and Troubleshooting Guide; Applied Biosystems Inc.: Foster City, CA, USA, 2005; p. 82. [Google Scholar]
  29. Yeh, F.C.; Yang, R.C.; Boyle, T. POPGENE Version 1.31. Microsoft Window-based Freeware for Population Genetic Analysis, Quik User Guide; University of Alberta and Center for International Forestry Research: Edmonton, AB, Canada, 1999; Available online: http://www.ualberta.ca/~fyeh/popgene.pdf (accessed on 23 March 2018).
  30. SAS, Institute. SAS/STAT User’s Guide, Software version 9.0.; SAS Institute Inc.: Cary, NC, USA, 2002; p. 4424. [Google Scholar]
  31. Martínez, G.A. Manual de diseño y análisis de los látices. Monografías y Manuales de Estadística y Cómputo. Vol. 8, Núm. 3; Centro de Estadística y Cálculo, Colegio de Postgraduados: Chapingo, Mexico, 1989; p. 71. [Google Scholar]
  32. Pla, L.E. Análisis Multivariado: Métodos de Componentes Principales. Programa Regional de Desarrollo Científico y Tecnológico; Secretaria General de la Organización de los Estados Americanos: Washington, DC, USA, 1986; p. 94. [Google Scholar]
  33. Gower, J.C. A general coefficient of similarity and some of its properties. Biometrics 1971, 27, 857–874. [Google Scholar] [CrossRef]
  34. Saitou, N.; Nei, M. The neighbor-joining method: A new method for reconstructing phylogenetic trees. Mol. Biol. Evol. 1987, 4, 406–425. [Google Scholar]
  35. Rohlf, F.J. NTSYSpc: Numerical Taxonomy System, Version 2.21c; Exeter Software, Setauket: New York, NY, USA, 2009. [Google Scholar]
  36. Herrera, C.B.E.; Castillo, G.F.; Sánchez, G.J.J.; Ortega, P.R.; Goodman, M.M. Morphological traits to assess diversity among maize populations in a region: Chalqueño landrace case. Rev. Fitotec. Mex. 2000, 23, 335–354. [Google Scholar]
  37. López-Romero, G.; Santacruz-Varela, A.; Muñoz-Orozco, A.; Castillo-González, F.; Córdova-Téllez, L.; Vaquera-Huerta, H. Caracterización morfológica de poblaciones nativas de maíz del Istmo de Tehuantepec, México. Interciencia 2005, 30, 284–290. [Google Scholar]
  38. Maturana, M.S.; Sánchez, C.J. Las comunidades de la Meseta Tarasca, Un Estudio Socioeconómico; Centro de Investigaciones Agrarias: Mexico City, Mexico, 1970; p. 124. [Google Scholar]
  39. Romero, P.J.; Castillo, G.F.; Ortega, P.R. Crosses of native populations of maize from Chalqueño race: II. Genetic groups, genetic divergence and heterosis. Rev. Fitotec. Mex. 2002, 25, 107–115. [Google Scholar]
  40. Doebley, J.F.; Goodman, M.M.; Stuber, C.W. Isozyme variation in the races of maize from México. Am. J. Bot. 1985, 72, 629–639. [Google Scholar] [CrossRef]
  41. Ángeles-Gaspar, E.; Ortiz-Torres, E.; López, P.A.; López-Romero, G. Characterization and yield performance of native maize populations from Molcaxac, Puebla. Rev. Fitotec. Mex. 2010, 33, 287–296. [Google Scholar]
  42. Myles, S.; Peiffer, J.; Brown, P.J.; Ersoz, E.S.; Zhang, Z.; Costich, D.E.; Buckler, E.S. Association mapping: Critical considerations shift from genotyping to experimental design. Plant Cell 2009, 21, 2194–2202. [Google Scholar] [CrossRef] [PubMed] [Green Version]
  43. Govindaraj, M.; Vetriventhan, M.; Srinivasan, M. Importance of genetic diversity assessment in crop plants and its recent advances: An overview of its analytical perspectives. Genet. Res. Int. 2015, 2015, 431487. [Google Scholar] [CrossRef] [PubMed] [Green Version]
Figure 1. Dendrogram showing the hierarchical clustering produced by the Neighbor-Joining method from 107 maize accessions using Gower distances derived from 13 morphological variables and 211 SSR alleles.
Agronomy 10 00309 g001
Figure 2. Dispersion of 107 accessions of Mexican maize based on the first three principal components derived from 13 morphological variables and 211 alleles of 31 SSR loci.
Agronomy 10 00309 g002
Table 1. Phenotypic traits assessed.
Traits
Phenological traits: days to male (MF) and female (FF) flowering; anthesis-silking interval (ASI).
Vegetative traits: number of tillers per plant (SP), plant height (PH), ear height (EH), length (LL) and width (LW) of the leaf at the primary ear in cm, total number of leaves (NL) and number of leaves above the ear (NLE).
Tassel traits: peduncle length (PLS), length of the branched part of the tassel (LBT), length of the central spike (LCS), total tassel length (TL) in cm, number of primary branches (PB).
Ear traits: length (EL) and ear diameter (ED); peduncle length (PLE); cob diameter (CD), in cm, number of kernel rows (KR), ear grain percentage (EGP = (grain weight/total weight of maize ear) × 100).
Kernel traits: length (KL), width (KW) and thickness (KT) in mm in 10 kernels of each of the five ears of the sampled plants, weight of 100 kernels (W100K) in g, volume of 100 kernels (V100K) in mL.
Ratios: EH/PH, ED/EL, LBT/TL, KW/KL, KT/KL and W100K/V100K.
Table 2. Microsatellite loci and primers used for amplification of repeated simple sequences in maize landrace populations of the highlands of Mexico.
LocusN. Bin.Forward Primer//Reverse Primer
phi1272.07ROX-ATATGCATTGCCTGGAACTGGAAGGA//AATTCAAACACGCCTCCCGAGTGT
phi0517.066-FAM-GCGAAAGCGAACGACAACAATCTT//ACATCGTCAGATTATATTGCAGACCA
phi1158.03HEX-GCTCCGTGTTTCGCCTGAA//ACCATCACCTGAATCCATCACA
phi0158.08HEX-GCAACGTACCGTACCTTTCCGA//ACGCTGCATTCAATTACCGGGAAG
phi0339.026-FAM-ATCGAAATGCAGGCGATGGTTCTC//ATCGAGATGTTCTACGCCCTGAAGT
phi0533.05ROX-CTGCCTCTCAGATTCAGAGATTGAC//AACCCAACGTACTCCGGCAG
phi0724.016-FAM-GTGCATGATTAATTTCTCCAGCCTT//GACAGCGCGCAAATGGATTGAACT
phi0934.08ROX-GTGCGTCAGCTTCATCGCCTACAAG//CCATGCATGCTTGCAACAATGGATACA
phi0245.01HEX-CTCCGCTTCCACTGTTCCA//TGTCCGCTGCTTCTACCCA
phi0855.066-FAM-AGCAGAACGGCAAGGGCTACT//TTTGGCACACCACGACGA
phi0347.02HEX-TAGCGACAGGATGGCCTCTTCT//GGGGAGCACGCCTTCGTTCT
phi1218.046-FAM-AGGAAAATGGAGCCGGTGAACCA//TTGGTCTGGACCAAGCACATACAC
phi0561.01ROX-ACTTGCTTGCCTGCCGTTAC//CGCACACCACTTCCCAGAA
phi0641.11HEX-CGAATTGAAATAGCTGCGAGAACCT//ACAATGAACGGTGGTTATCAACACGC
phi05010.03ROX-AACATGCCAGACACATACGGACAG//ATGGCTCTAGCGAAGCGTAGAG
phi961002.016-FAM-AGGAGGACCCCAACTCCTG//TTGCACGAGCCATCGTAT
phi101249Unknown6-FAM-TTCCTCCTCCACTGCCTC//AAGAACAGCGAAGCAGAGAAGG
phi1091885.03HEX-AAGCTCAGAAGCCGGAGC//GGTCATCAAGCTCTCTGATCG
phi0293.04ROX-TCTTTCTTCCTCCACAAGCAGCGAA//TTTCCAGTTGCCACCGACGAAGAACTT
phi0733.05HEX-GTGCGAGAGGCTTGACCAA//AAGGGTTGAGGGCGAGGAA
phi9634210.026-FAM-GTAATCCCACGTCCTATCAGCC//TCCAACTTGAACGAACTCCTC
phi1092751.036-FAM-CGGTTCATGCTAGCTCTGC//GTTGTGGCTGTGGTGGTG
phi4279131.01ROX-CAAAAGCTAGTCGGGGTCA//ATTGTTCGATGACACACTACGC
phi2654541.116-FAM-CAAGCACCTCAACCTCTTCG//TCCACGCTGCTCACCTTC
phi4028932.XXHEX-GCCAAGCTCAGGGTCAAG//CACGAGCGTTATTCGCTGT
phi3464821.XXHEX-GCATCACACTTCACACAACAA//GTGGAATAGGAGGCGAGAGAGG
phi3080904.04–4.056-FAM-CAGTCTGCCACGAAGCAA//CTGTCGGTTTCGGTCTTCTT
phi3305075.02–5.06ROX-GTAAAGTACGATGCGCCTCCC//CGGGGTAGAGGAGAGTTGTG
phi2133984.01–4.046-FAM-GTGACCTAAACTTGGCAGACCC//CAAGAGGTACCTGCATGGC
phi3390171.03HEX-ACTGCTGTTGGGGTAGGG//GCAGCTTGAGCAGGAAGC
phi1598196.00–6.086-FAM-GATGGGCCCTAGACCAGCTT//GCCTCTCCCATCTCTCGGT
Table 3. Mean squares of the combined analysis of variance across localities.
TraitPopulationsLocalitiesPob × LocErrorMeanStandard Deviation
Male flowering932.5 **26,311.7 **39.4 **13.5100.6415.79
Female flowering813.2 **34,724.2 **33.0 **15.793.4615.71
Anthesis-silking interval33.5 **659.8 **9.965 **5.57.183.65
Shoots per plant0.1 **15.0 **0.1 **0.10.210.32
Plant height10,455.7 **421,681.3 **330.9 ns288.2250.2356.16
Ear height5441.2 **326,631.3 **254.4 **206.4119.7244.63
Ear height/plant height0.0 **1.2 **0.0 **0.00.460.09
Number of leaves21.5 **25.4 ns1.2 **0.612.062.08
Number of leaves above ear2.1 **10.6 **0.1 **0.14.810.69
Leaf length393.7 **57,622.6 **57.5 **29.275.0816.07
Leaf width7.7 **955.6 **1.7 *1.48.812.28
Total length155.3 **210.7 ns30.0 **25.663.276.85
Peduncle length of the tassel30.6 **248.5 ns12.9 ns11.125.213.97
Length of central spike64.6 **265.0 **10.6 **7.731.584.34
Length of branched part of tassel23.6 **1190.5 **2.4 ns2.26.653.02
Length of branched part of tassel/total length0.0 **0.3 **0.0 **0.00.100.05
Number of primary branches38.2 **1180.2 **6.2 **4.88.173.75
Ear length34.8 **423.7 **2.9 ns2.714.543.05
Number of kernel rows25.0 **186.7 **1.3 **1.14.482.37
Peduncle length of the ear26.1 **1549.9 **8.5**6.12.013.83
Ear diameter0.9 **34.6 **0.1 **0.14.110.56
Ear diameter/ear length0.0 **0.0 ns0.0 **0.00.290.05
Cob diameter0.6 **12.3 **0.1 **0.11.950.45
Kernel length783.1 **14,837.6 **97.8 **64.112.671.54
Kernel width826.7 **1500.4 **20.9 ns19.07.731.25
Kernel thickness156.9 **138.3**9.7 **7.34.160.58
Ear grain percentage56.6 **223.1 **14.4 ns14.787.304.70
Weight of 100 kernels248.1 **1114.0 **22.2 ns18.827.797.81
Volume of 100 kernels811.2 **2990.6 **50.1 ns47.142.8613.52
Kernel width/kernel length0.1 **0.1 **0.0 **0.00.620.11
Kernel thickness/kernel length0.0 **0.1 **0.0 ns0.00.330.07
Weight of 100 kernels/volume of 100 kernels0.0 **0.0 ns0.0 ns0.00.660.06
* Significance at 5%; ** significance at 1%; ns: non significance.
Table 4. Variance components for populations (σ2g), localities (σ2l), interaction populations × localities (σ2g×l), error (σ2e), broad-sense heritability (H2) and repeatability (r) of the traits studied.
Traitσ2gσ2lσ2g×lσ2eH2r
Female flowering †148.84108.423812.969613.48884.911.2261
Male flowering130.024143.23638.649115.73484.210.8561
Anthesis-silking interval3.9352.70192.19875.46733.920.8030
Shoots per plant0.0010.06180.00980.0521.590.0143
Plant height1687.461734.805021.3440288.21684.500.9609
Ear height864.461346.003124.0306206.36778.960.6310
Ear height/plant height0.0020.00500.00050.00244.440.3706
Number of leaves †3.3880.08300.27570.679.469.4447
Number of leaves above ear †0.3250.04210.01930.10871.855.3000
Leaf length56.02237.409314.134829.23956.360.2227
Leaf width0.9853.94530.14781.43938.300.2408
Total length †20.8830.23292.208525.59642.898.5538
Peduncle length of the tassel †2.9490.84680.871211.14919.701.7169
Length of central spike †9.0120.99871.43567.6949.693.7021
Length of branched part of tassel3.5384.90740.10902.20160.500.7055
Length of branched part of tassel/total length0.00080.00110.00010.00142.110.6358
Number of primary branches5.3354.85650.71634.7949.210.9574
Ear length †5.3161.70330.12332.69665.342.9107
Number of kernel rows †3.9320.76030.13031.04477.004.4151
Peduncle length of the ear2.9236.34341.03256.4628.060.3963
Ear diameter0.1490.14150.01110.05469.590.9795
Ear diameter/Ear length †0.0010.00010.00010.00147.628.0939
Cob diameter †0.0850.05060.00930.07450.511.4316
Kernel length †114.21360.042516.877564.05658.531.4848
Kernel width †134.2916.17510.970018.9987.0618.7950
Kernel thickness †24.5450.53271.17007.3374.2814.4151
Ear grain percentage †7.0250.9063−0.129414.69932.539.0428
Weight of 100 kernels †37.6554.40131.73318.75564.766.1385
Volume of 100 kernels †126.8512.11321.503447.08472.309.3161
Kernel width/kernel length †0.0080.00050.00050.00369.579.2262
Kernel thickness/kernel length †0.0020.00050.00020.00247.623.1202
Weight of 100 kernel/volume of 100 kernels †0.0010.00010.00010.00232.2610.2235
† Selected traits.

