Article

Changes and Interactions between Grassland Ecosystem Soil and Plant Properties under Long-Term Mineral Fertilization

by
Vladimíra Vargová
1,
Radoslava Kanianska
2,*,
Miriam Kizeková
1,
Bernard Šiška
3,
Zuzana Kováčiková
1 and
Milan Michalec
1
1
National Agricultural and Food Centre, Grassland and Mountain Agriculture Research Institute, Mládežnícka 36, 974 21 Banská Bystrica, Slovakia
2
Faculty of Natural Sciences, Matej Bel University Banská Bystrica, Tajovského 40, 974 01 Banská Bystrica, Slovakia
3
Faculty of European Studies and Regional Development, Slovak University of Agriculture in Nitra, Tr. A. Hlinku 2, 949 76 Nitra, Slovakia
*
Author to whom correspondence should be addressed.
Submission received: 12 February 2020 / Revised: 27 February 2020 / Accepted: 6 March 2020 / Published: 9 March 2020

Abstract

:
Grasslands intensification by use of mineral fertilization has contributed substantially to the increase in forage production. Intensification, however, can degrade the other beneficial functions or soil properties. The effects of mineral fertilization on soil and plant chemical qualities of a permanent wet grassland (Festucetum pratense association) were investigated in Slovakia. The grassland was treated using 3 different N, P, and K rates of mineral fertilizers in kg. ha−1. yr−1 plus the Control (0NPK) almost over 60-year period (1961–2017). The N, P, and K rates in low NPK treatment (LNPK) were N50, P15.4, and K 41.5, in the medium NPK treatment (MNPK) were N100, P30.8, and K83, and in the high NPK treatment (HNPK) were N200, P 61.6, and K 166, respectively. Overall, soil variables (pH, soil organic carbon, plant-available K) showed the most significant changes. A more balanced development was observed in case of soil total nitrogen, C:N ratio, and plant-available P. ANOVA revealed a significant effect between treatments only on plant-available P. In the case of plant functional group development, long-term mineral addition significantly disfavors legumes and forbs. However, analyses of the botanical composition over the last 5 years showed that legume cover significantly differs only in the HNPK treatment. Plant C:P, N:P, and N:K ratios were significantly reduced when fertilizers were added. In terms of grasslands yields, the highest biomass and content of macronutrients were obtained under the HNPK rates. However, with regard to the quality and quantity of the soil organic matter, the most appropriate treatment has been with the MNPK rates. Our findings demonstrate that medium fertilization seems to be an acceptable compromise to meet both productivity and environmental aspects and to connect ecological benefits with social benefits in the long term.

1. Introduction

Grasslands are complex ecosystems, and connecting ecological benefits with social benefits in the medium and long terms is a duty of society. To understand the ecological processes and factors regulating soil and plant quality and productivity, the use of combined approaches of research, field experiments, and depth analysis of data is needed. Ecological and economic importance is also given by their global distribution and multifunctionality. A vital role of grasslands has been to meet the feed requirements of ruminants and to produce forage of high nutritive value, rich in protein, energy, minerals (P, K, Ca, Mg), and dry matter digestibility [1]. Moreover, these ecosystems provide an array of ecosystem services—the benefits human societies and individual people can obtain from ecosystem functioning. According to the concept of ecosystem services developed within the Millennium Ecosystem Assessment, four groups of ecosystem services are distinguished (provisioning, regulating, cultural, and supporting). Besides provisioning services, grasslands contribute to the maintenance of soil fertility, carbon storage and climate regulation, water regulation, and recreational value [2,3]. Traditional vision of grasslands used exclusively for domestic herbivore production should be oriented to a more integrated vision, where more ecosystem services and their multiple interactions have to be considered together [4]. Grassland capacity to deliver multiple ecosystem services as parts of agricultural systems is surprisingly understudied compared to other production systems [5].
Many ecosystem services depend largely on the management and intensity of grassland use. Current strategies to improve productivity include fertilizer application. Traditionally, grasslands were extensively used by mowing or grazing. Ensuring food security after World War II, quantity and quality of grassland production were improved by the use of mineral fertilizers, particularly nitrogen. Nowadays, an increase in population also results in demand for food and material supplies as well. The use of fertilizers is also essential for global food security [6]. However, an effort to satisfy human food requirements has to consider the environmental impacts of increasing agriculture production.
Fertilizers have both positive and negative effects on grassland ecosystem [7]. Grasses have an extraordinary capacity to absorb nitrogen from different sources [8,9,10] and respond with a further increase in protein content [11,12]. However, the extensive use of chemical fertilizers dramatically altered grassland ecosystems and resulted in a decrease in both above-ground [13] and soil biodiversity [14]. Apart from enhanced grassland biomass productivity, addition of chemical fertilizers has a significant effect on grassland soils. In general, the soil is considered as an important natural resource. Maintaining soil productivity and quality requires crucial attention as it plays a significant role in delivering ecosystem services of agroecosystems to society [15]. Several authors argued that long-period nitrogen fertilization of grassland improved the quality of soil organic matter [16] or increased soil nitrogen mineralization [17]. On the other hand, there is evidence of negative impact of the excess of artificial fertilizers on grassland soil such as acidification [18], nutrient leaching, and emissions of nitrogen [19].
To reduce negative environmental externalities while increasing yield, the concept of sustainable agriculture or sustainable intensification has been developed [20]. However, in the face of a constant change of terrestrial ecosystems and societal demands, there is an increasing demand for comprehensive agricultural research. It is a great deal to investigate possibilities for reducing the so-called environmental footprint of agriculture while maintaining yields by sustainable intensification combining the best fertilization rates with the preservation of the natural environment. It is not possible to define a sustainable intensification level for each environment, so it is necessary to carry out experiments suitable for each environmental situation.
The practical ways of how to assess the sustainability of agriculture practice are long-term experiments [21]. The long-period experiments have unique and increasing value. They are fundamental sources of knowledge and crucial in understanding the agroecosystem development and changes occurring as a result of long-period agricultural operations, particularly of long-term fertilization [22]. Grassland long-term experiments with different nutrient or defoliation management demonstrate the dynamics of soil and plant changes and thus provide solutions for optimal setting of fertilizer doses and management practices to ensure not only sustainable forage production but also other ecosystem services and sustainable soil quality and fertility [23].
There are very few long-term experiments with chemical fertilizers on grasslands going on in Europe. In Slovakia, a grassland experiment is still underway since 1961 on a permanent wet meadow. At the beginning of the experiment, the main goal was to observe the influence of high doses of nitrogen together with phosphorus and potassium on both above-ground biomass and soil chemical properties and processes such as biomass yield and its nutritive value, soil pH, content of organic matter and nutrients, soil mineralization, and humification as well [24]. In 1961, the majority of such experiments were established with management methods and intentions very different from today’s society demands. Nevertheless, the one who established this experiment 57 years ago had clever and important intuitions on the importance of some ecological aspects that are nowadays known as “ecosystem services”. As the experiment is still ongoing after 59 years and could be considered as a classical long-term experiment [25], it allows us to observe changes in agroecosystem properties and related functions and services. The aim of this study is to investigate the effects of chemical fertilization in a long-term period on soil and plant chemical properties to quantify changes, interactions, and thus related ecosystem services. We identified two groups of ecosystem services from grasslands: (i) provisioning ecosystem services evaluated by plant biomass and plant chemical properties, and (ii) supporting ecosystem services evaluated by soil fertility determined by soil chemical properties, i.e., pH, soil organic carbon (SOC), soil total nitrogen (STN), and soil organic matter quality.

2. Materials and Methods

A long-term Permanent Grassland Experiment (PGE) was established in 1961 in a flat wet meadow on Fluvisol run by NAFC-GMARI at Veľká Lúka in Central Slovakia. Slovak permanent grasslands cover 858.601 ha representing 17.5% of the total area [26]. The EU JRC PESETA project [27] defined eight agro-climatic zones in the EU based on the cluster analysis of temperature and precipitation data, district crop yield data, and irrigation data. Slovakia belongs to continental north agro-climatic zone with cold relatively wet winters and mild dry summers as well as with cold relatively dry winters and warm dry to occasionally wet summers. Fluvisols are genetically young azonal soils predominately developed on fluvial deposits. They occupy less than 350 million ha worldwide and generally they are of good natural fertility and suitable for grasslands.

2.1. Site Description and Experimental Design

The Veľká Lúka PGE is located in Central Slovakia in the western part of the Zvolenská kotlina basin at 350 m a.s.l. (48°37′57″ N, 19°9′55″ E). The soil is classified as Gelyic Fluvisol according to the World Reference Base for Soil Resources [28] and has a loam texture. Long-term mean rainfall over the growing season is 428 mm, long-term mean annual rainfall is 757 mm, and mean daily temperature are 8.2 °C per year and 14.7 °C during the growing season. However, the weather has been very changeable throughout the PGE.
The experiment was arranged in randomized complete blocks with three replications. The area of each replication is 32 m2. The sward type is Festucetum pratense association with 35 species (Alopecurus pratensis dominant) and before establishment of the PGE, the meadow was cut twice a year. The experiment consisted of 10 treatments with varying amounts of mineral fertilizers including an unfertilized control. In this paper, we present the results of the most comprehensive data for the period of 57 years (Table 1). Nitrogen was applied as ammonium nitrate (granulated nitrogen fertilizer LAD 27%), phosphorus as superphosphate (19%), and potassium as potassium chloride (60%). The total rate of nitrogen fertilizer was split into two dressings that were applied in early spring (65%) and after the 1st cut (35%) of each year. The experiment has remained under constant management since 1961 as follows: the 1st cut—at the ear emergence of dominant grass species; the 2nd cut—approximately 6 to 8 weeks later; the 3rd cut—approximately 8 to 10 weeks after the 2nd cut.

2.2. Soil Sampling and Analysis

Soil samples were collected in October from the depth of 0–0.15 m. In this paper, we report years 1961, 1970, 1988, 2010, and 2017. From a past period, available data of assessed soil characteristics are from the years 1961, 1970, and 1988. From a recent period, we used data of soil and plant characteristics from the years 2010 and 2017 to keep similar timing with the past period. To show also annual soil data variability, we especially evaluated the period 2013–2017.
In each plot, four separate samples were taken and combined to form one representative sample. Soil samples were air-dried and sifted through a 2-mm mesh sieve. We determined soil pH in KCl solution, total soil organic carbon (SOC) using oxidimetric method according to Tjurin, soil total N (STN) by Kjeldahl method [29], and plant-available nutrients K and P were extracted by Mehlich III. K was determined by flame photometry in a spectrophotometer and P calorimetrically by a Scalar Network Analyzer (SNA). At the beginning of the experiment, the soil pH/KCl was 6.03 and contained 28.50 g.kg−1 of SOC, 3.00 g.kg−1 of STN, 6.16 mg.kg−1 of plant-available P, and 96.60 mg.kg−1 of plant-available K. The soil C:N ratio was 9.5.

2.3. Botanical Composition, Plant Biomass Yield, and Chemical Analysis

In mid-May of each year, the cover of plant species and functional groups (grass, legume, forb) was visually estimated directly in percentages. The nomenclature of plant species followed Marhold and Hindák [30]. The total plant yield per plot was recorded after 3 cuts per year and every year from 1961 to 2017. The herbage was weighed at the research site, and subsamples were oven-dried at 65 °C to constant weight. The N content was determined by Kjeldahl method [29], and the concentration of K was determined by flame photometry; P content was determined colorimetrically by a continuous flow SNA. The C concentration in herbage was estimated to be 40% of the DM, as used in the study of Hanly and Gregg [31].

2.4. Data Analysis

We evaluated long-term changes in observed characteristics. The soil and plant parameters were analyzed using one-way ANOVA analysis of variance followed by post hoc comparisons using the Tuckey HSD test to compare differences in the measured soil and plant parameters between treatment plots. To analyze dynamics in plant functional groups and biomass yield, repeated-measures ANOVA was used to evaluate the effect of year and treatment with year. To identify relationships among soil and plant parameters, correlation analyses were conducted using the Pearson correlation coefficients. ANOVA and Pearson correlation coefficients were computed using the STATGRAPHICS Centurion XVI.I.

3. Results

The examined soil and plant chemical properties varied with respect to time and applied fertilizer doses.

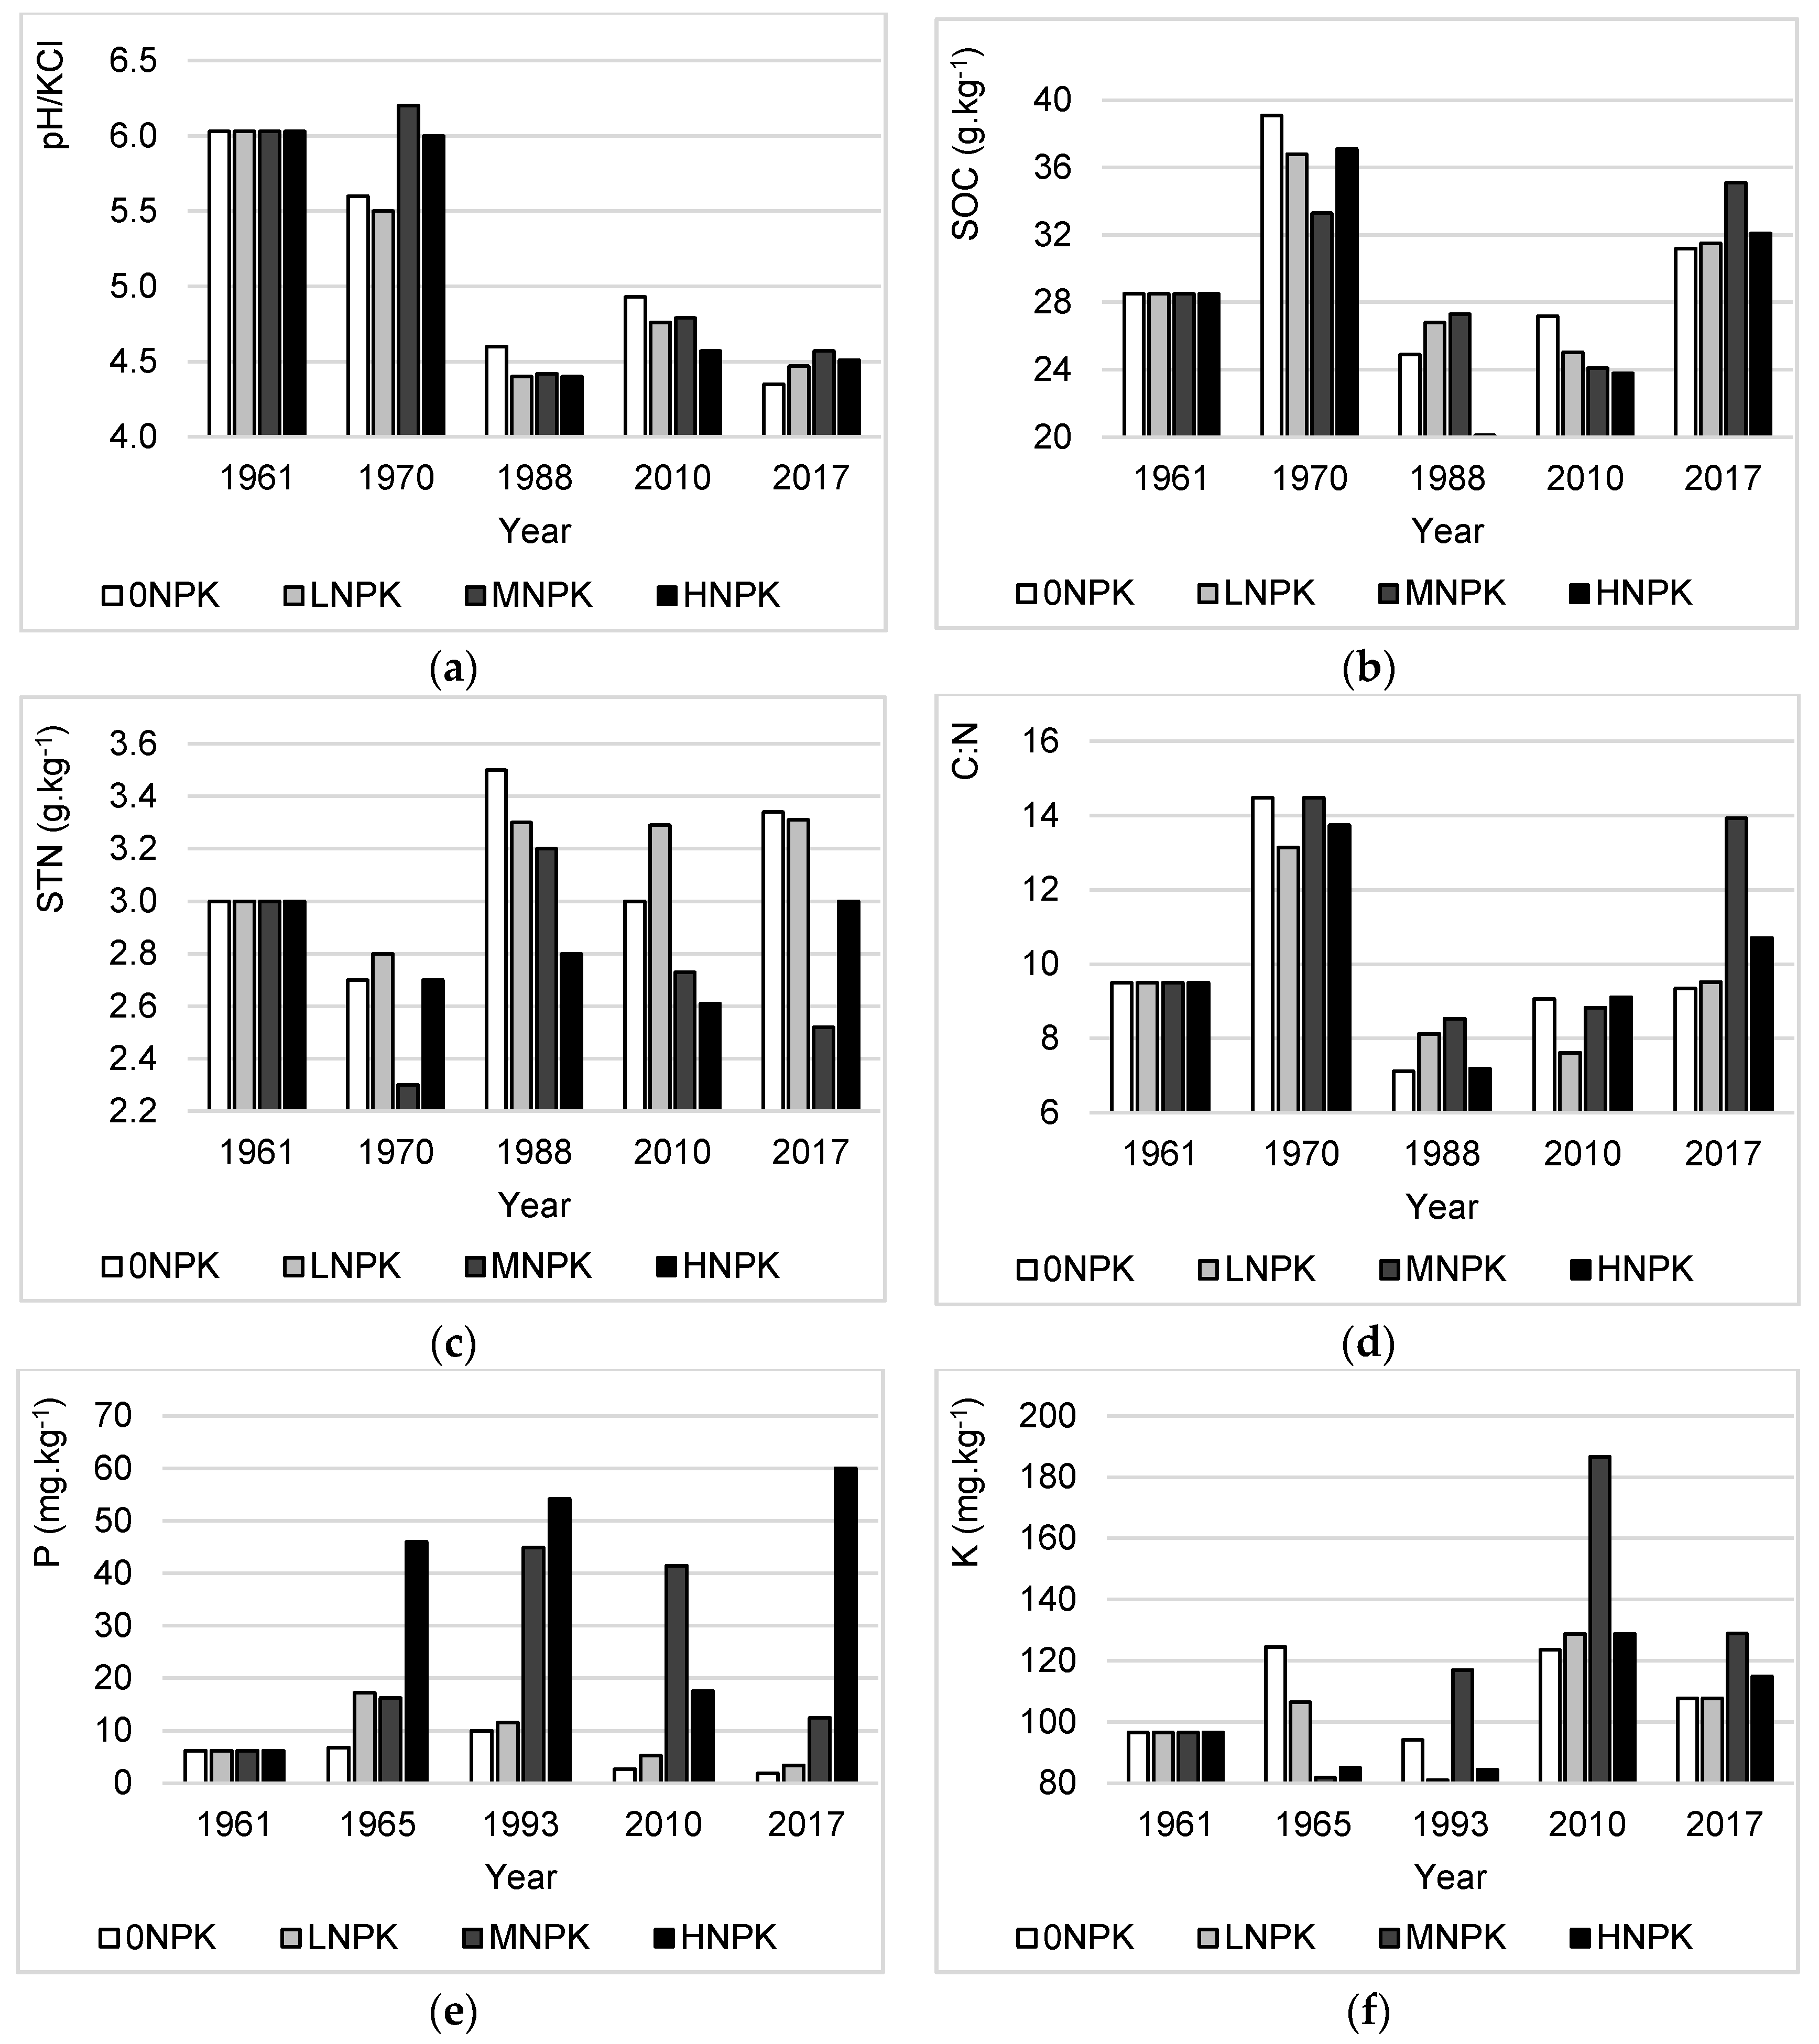
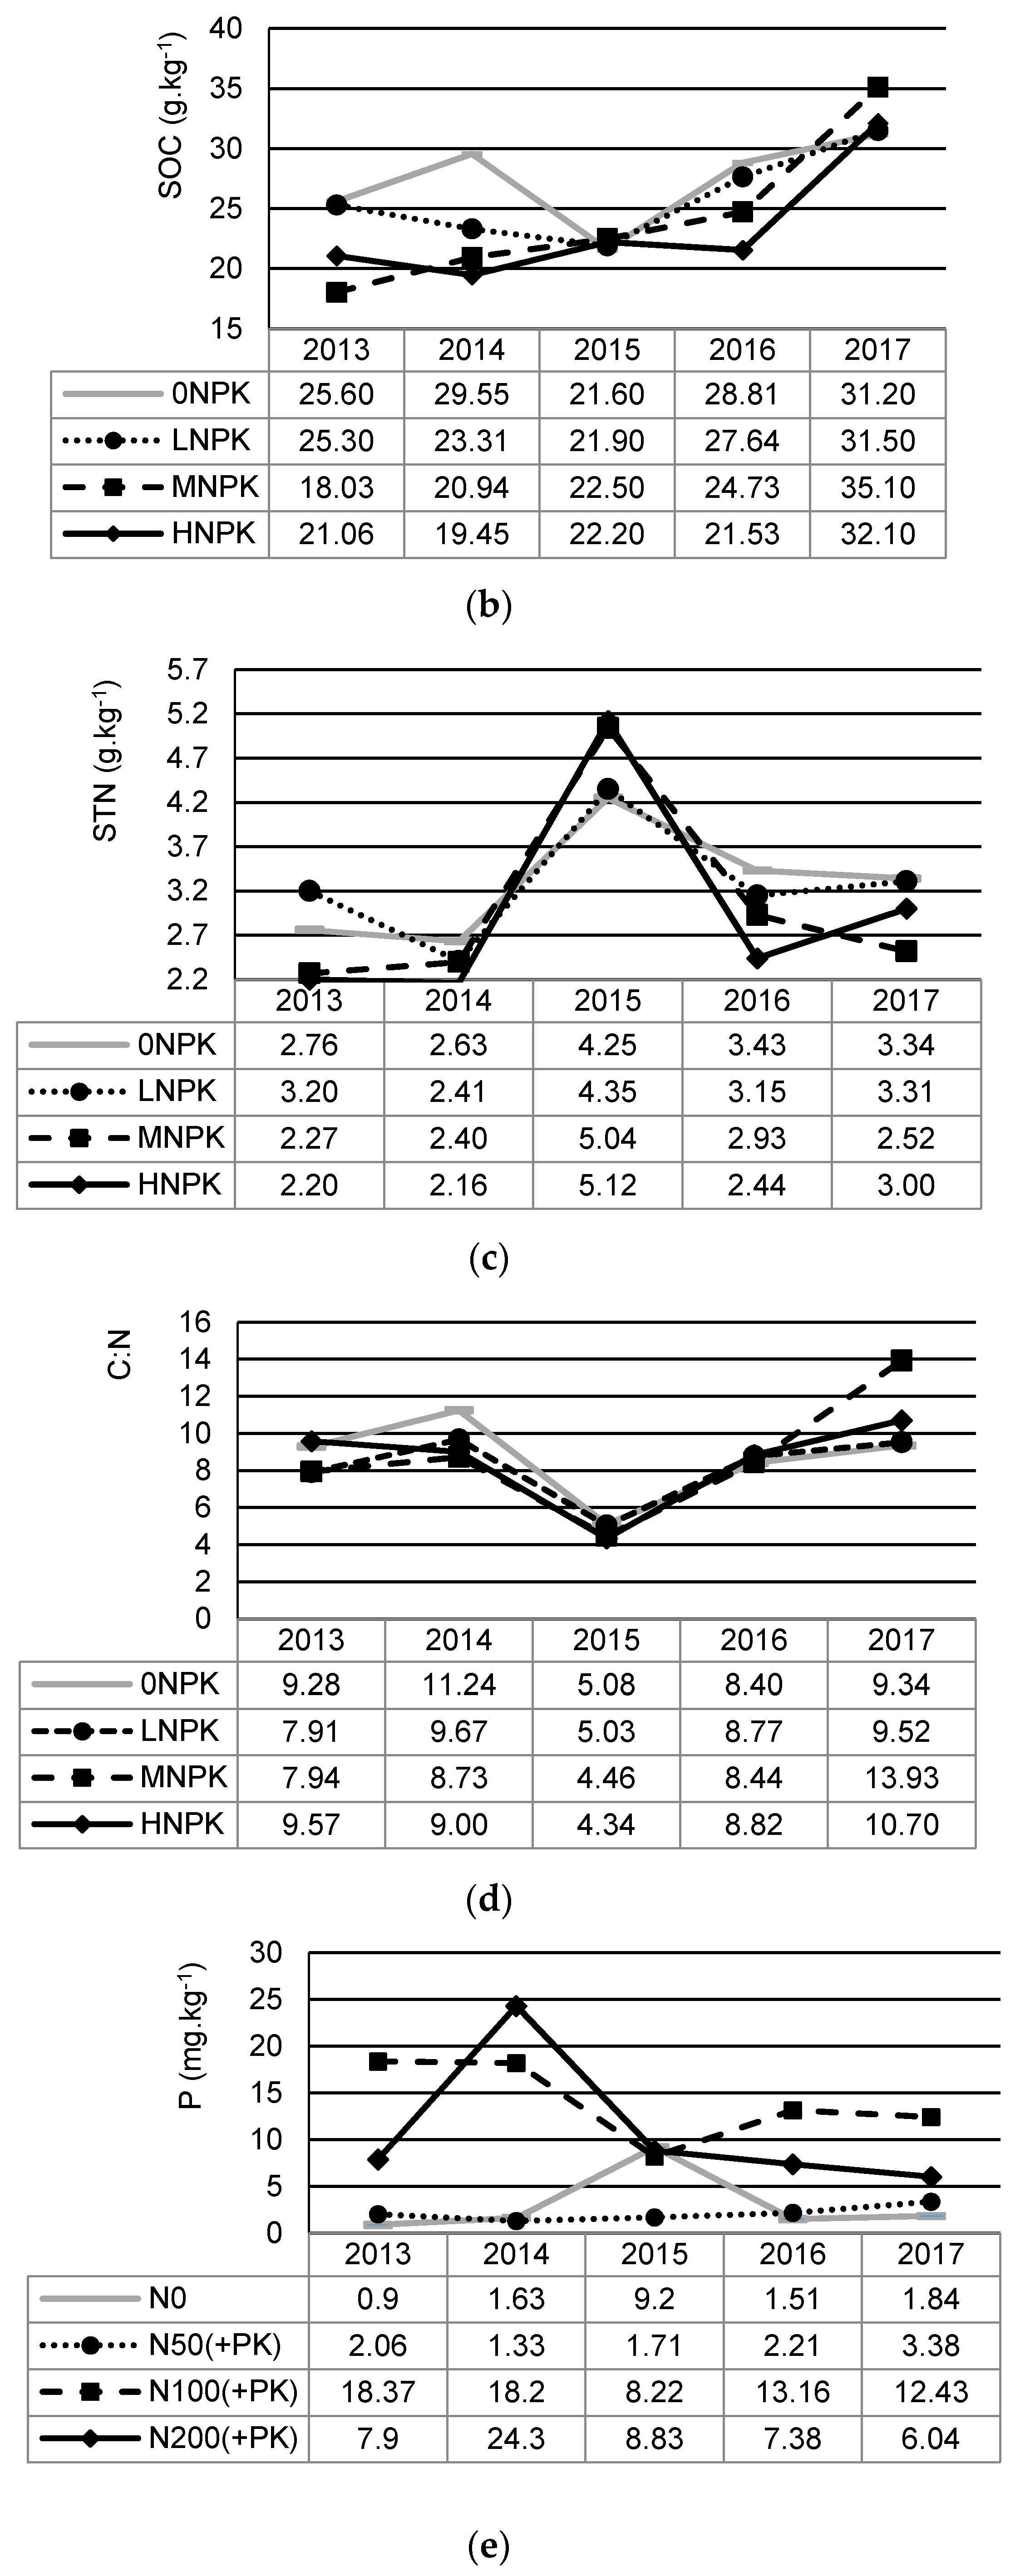
3.1. Soil Chemical Properties

In 1961, the soil had a slightly acid reaction (pH/KCl - 6.03). In 1970, after nine years from the beginning of the experiment, the soil pH slightly increased by 0.17 units under the MNPK treatment and reached a sub-acid reaction. However, the pH values dropped in the other treatments. In the middle of the experiment (1988), the pH values reduced markedly in all treatments, and the soil became strongly acid (pH/KCl between 4.1 and 4.6). In 2010, all treatments exhibited a moderate increase in pH values, however, in 2017 a decline of pH was recorded in all treatments. Overall, comparing the years 1961 and 2017, the soil pH values showed a decreasing trend in all treatments (Figure 1a). The highest pH decrease (−1.68 units) was recorded under the 0NPK treatment and the lowest (−1.46 units) under the MNPK treatment.
At the beginning of the experiment, the total SOC stock was 28.50 g.kg−1. During the experiment, all treatments exhibited different variations in SOC (Figure 1b). After nine years from the establishment of the experiment, SOC values increased in all treatments, where the highest SOC was recorded under 0NPK treatment (+10.6 g.kg−1). However, in the middle of the experiment (1988), a marked reduction in SOC values was found in all treatments with the highest decrease under HNPK treatment (−17 g.kg−1). During the next period, all treatments showed a different pattern in SOC dynamics. Under the LNPK and MNPK treatments, SOC values slightly dropped to 25.03 g.kg−1 and 24.10 g.kg−1 in 2010 with a subsequent increase in 2017. On the contrary, the 0NPK and HNPK treatments showed only an increase in SOC. Overall, comparing the years 1961 and 2017, the SOC increased for all treatments. The highest SOC increase (+6.60 g.kg−1) was recorded under the MNPK treatment and the lowest one (+2.70 g.kg−1) under the 0NPK treatment.
During the experiment, a variation in STN concentration was observed, where STN values were alternately increasing and decreasing (Figure 1c). Overall, comparing the years 1961 and 2017, two treatments (0NPK and LNPK) showed an increase in STN content; the treatment MNPK showed a decrease and no change was observed under the HNPK treatment.
We evaluated the soil organic matter quality according to the C:N ratio. At the beginning of the experiment, the C:N ratio in the soil was 9.50. During the experiment, the soil C:N ratio varied and the general trend was very similar to SOC development (Figure 1d). Overall, comparing the years 1961 and 2017, all treatments showed an increase in the soil C:N ratio except for the 0NPK treatment where the soil C:N ratio was reduced by 2%. The highest increase (+4.43) in soil C:N ratio was recorded under the treatment MNPK and the lowest (+0.02 g.kg−1) recorded under the treatment LNPK.
In 1961, at the beginning of the experiment, the content of the plant-available P in soil was very low (6.16 mg.kg−1). In the middle of the experiment (1988), an increased concentration of plant-available P was observed in all treatments except for the LNPK treatment (Figure 1e). However, in the next period up to 2017, all treatments showed a continual decrease in plant-available P content except for the HNPK treatment. Overall, comparing the years 1961 and 2017, the MNPK and HNPK treatments exhibited an increase in the plant-available P concentration. On the contrary, a decline was recorded under the 0NPK and LNPK treatments.
At the beginning of the experiment in 1961, the concentration of plant-available K in soil was 96.60 mg.kg−1. During the experiment, the treatments showed different patterns in dynamics of the plant-available K (Figure 1f). Overall, comparing the years 1961 and 2017, the concentration was higher in all treatments compared to the beginning of the experiment.
Annual changes in the soil chemical properties, plant yields, and precipitations during the period of 2013 and 2017 show Figure 2a–f. Mean and standard deviation values of soil chemical properties related to this period are shown in Table 2. The most significant yearly change in the observed characteristics was recorded in the year 2015 with the lowest precipitation rate.

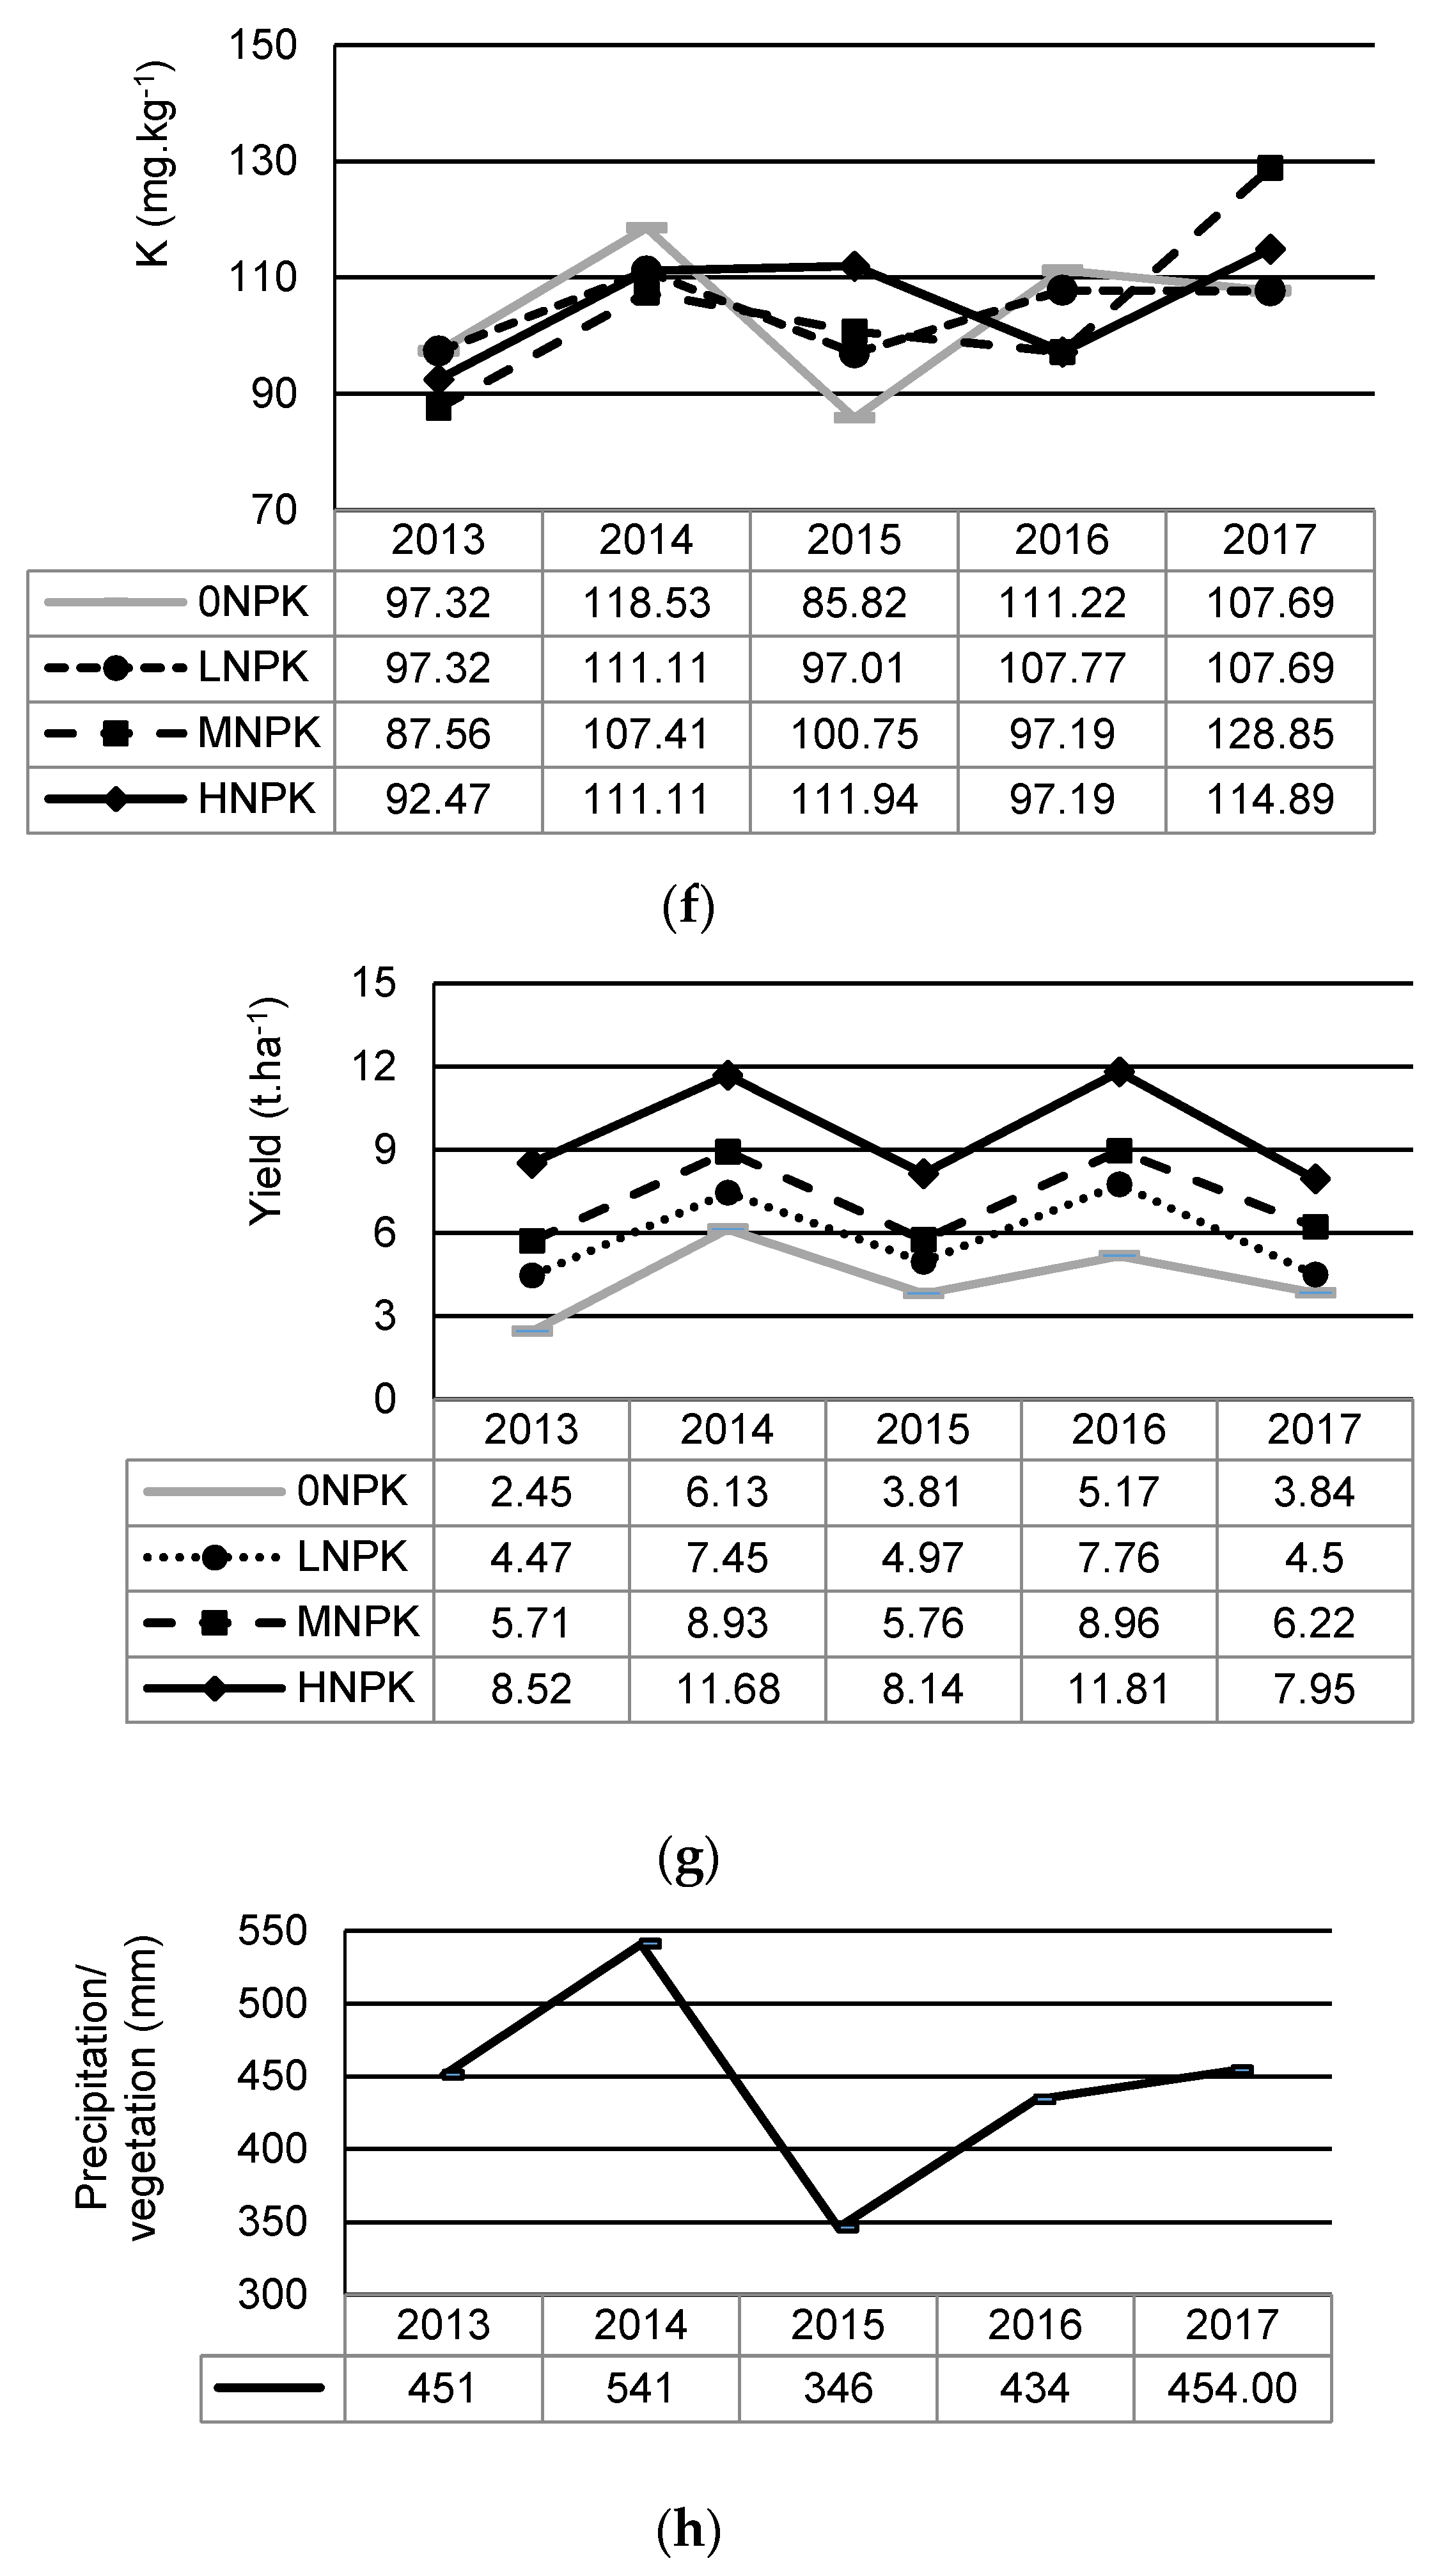
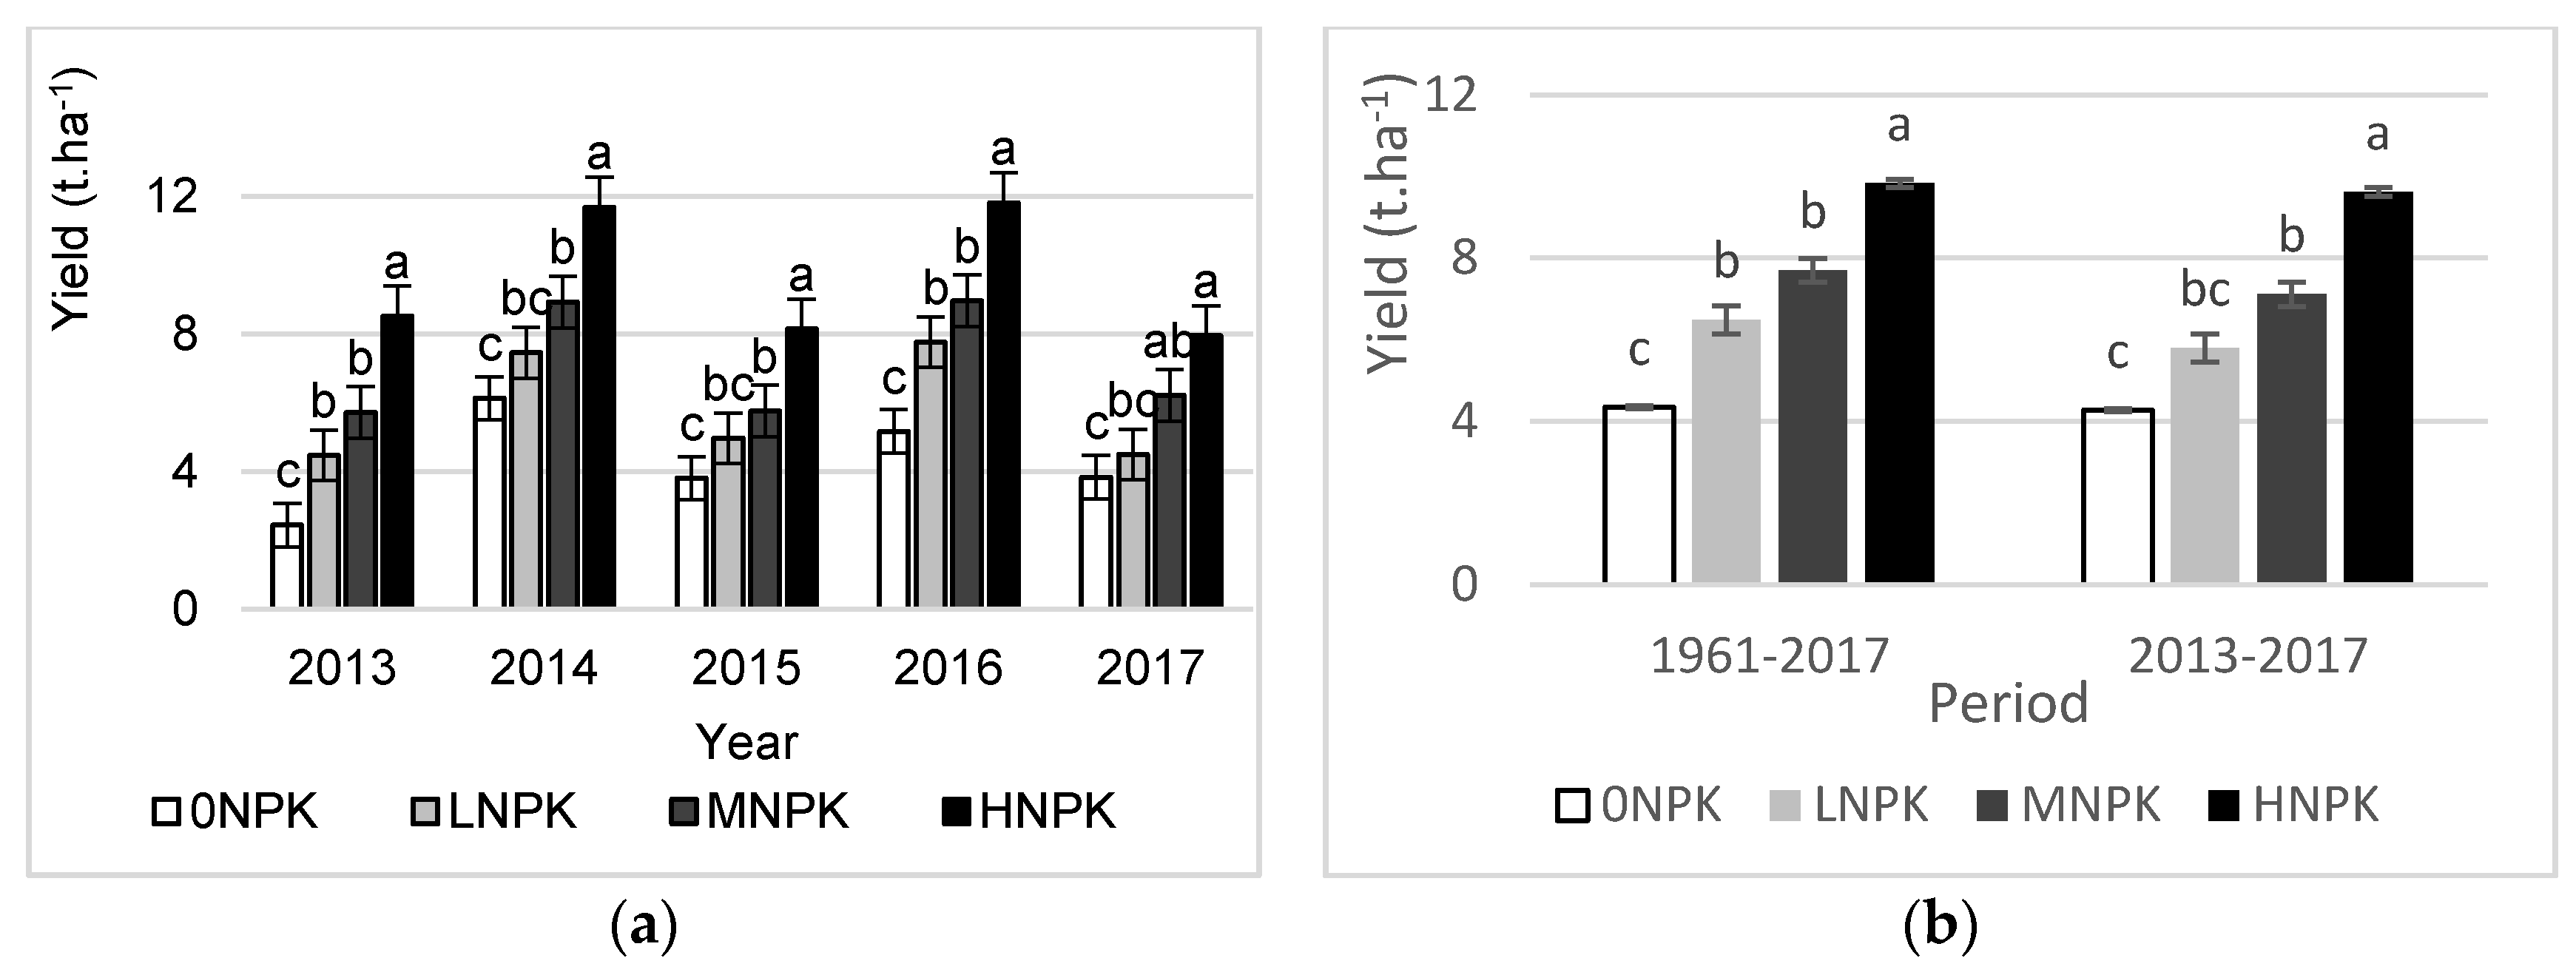
3.2. Botanical Composition, Plant Biomass Yield, Plant and Soil Properties

In 1961, the wet meadow was dominated by grasses (63%), of which the most abundant species were Alopecurus pratensis (7%), Deschampsia caespitosa (24%), Festuca pratensis (5%), and Poa pratensis (24%). The presence of legumes and forbs was 22% and 15%, respectively, with the most abundant species Trifolium pratense (10%), Trifolium repens (9%), Taraxacum officinale (7%). After 57 years, changes in plant species and functional groups were observed. Mineral fertilization has led to an increase in grass cover, particularly in a higher abundance of tall grasses such as Alopecurus pratensis and Arrhenatherum elatius (Table 3).
Comparing both periods, the development of legume cover exhibited a different pattern (Table 4). During the 57-year period, legume cover significantly differed between treatments. On the contrary, during the last 5 years, the effect of LNPK and MNPK treatments on legume cover was not significant and legumes ranged from 8.2% (treatment MNPK) to 14.4% (Control treatment). Forb cover showed a similar trend to legume with the highest coverage in control treatment.
The average annual yield responded to fertilizer doses and significantly differed between treatments. During the 57-year period and the period of the last 5 years, the greatest biomass yield was found under the HNPK treatment that received the highest doses of fertilizers (Figure 3). Despite differences in biomass yield between treatments over 57 years period, there were only small differences between the LNPK and MNPK treatments. A repeated ANOVA revealed a significant effect of year (F = 44.68, p < 0.001) and treatment (F = 107.62, p < 0.001) on plant biomass yield over the last 5 years. On average, the highest plant biomass yield was recorded in 2014, when the biomass production varied from 6.13 t.ha−1 (Control treatment) to 11.68 t.ha−1 (HNPK treatment), respectively. The lowest plant biomass yield was observed in the Control treatment in 2013 (Figure 3).
Table 5 shows that the supply of mineral fertilizers affected the concentration of macronutrients in plants. The concentration of N, P, and K was significantly higher in the HNPK treatment. On average, the N content varied from 21.99 g.kg−1 to 23.64 g.kg−1 and there was a little difference between the HNPK and MNPK treatments. The concentration of P ranged from 2.46 g.kg−1 to 3.47 g.kg−1. The lowest P and K concentration was recorded in the Control treatment. On the contrary, there were no significant differences for P and K concentration in the herbage in the LNPK and MNPK treatments. Contrary to the content of macronutrients with the lowest values in the 0NPK treatment, the plant C:P, N:P, and N:K ratios were significantly reduced when fertilizers were added. The highest mean C:P and N:P ratios were found in the Control treatment, while there were little differences among the fertilized treatments.
On average, the HNPK treatment showed significantly the highest removal of nutrients (Table 6). If we compare N, P, K fertilizers input and nutrient removal, only P addition in the MNPK and HNPK treatments exceed the plant removal.
The relations between the average annual yields and the soil chemical properties under different treatments are reported in Figure 4a–d. It is clear that the increase of yields is determined by the synergic effect of many factors and no direct effect can be observed, e.g., between higher yields and higher content of SOC or lower pH values.

3.3. Fertilizer Effect on Soil and Plant Properties and Their Relationship

Soil pH, SOC, and concentration of plant-available K showed substantial fluctuations over the 57-year period according to the fertilizer rates. A more balanced development was observed in case of STN concentration and plant-available P, and for soil C:N ratio as well. ANOVA showed that soil pH, SOC, STN, C:N ratio, and concentration of plant-available K did not differ significantly between treatments. To contrary, ANOVA revealed a significant effect of fertilization rates on the concentration of plant-available P (F = 15.935, p < 0.001) (Table 7).
In general, fertilization rates significantly (p < 0.001) affected plant yield, content of plant macronutrients, and plant C:P, N:P, and N:K ratios as well. While the mean effects of fertilization on plant yield and concentration of plant N, P, and K were supportive, the plant C:P, N:P, and N:K ratios were significantly reduced when fertilizers were supplied (Table 7).
Correlation analysis among soil variables displayed a significant positive correlation between pH/KCl and SOC (r = 0.404 **). The content of STN was negatively correlated with the concentration of plant-available P (r = −0.324 *) and negatively and significantly correlated with the soil C:N ratio (r = −0.820 **) (Table 8).
Results of correlation analyses among plant variables showed that the contents of plant P and K are negatively correlated with the plant C:N, C:P, N:P, and N:K ratios (Table 9). In all treatments, the plant C:N ratio is negatively correlated with the content of plant N. In general, the plant C:N ratio did not display any correlation with plant biomass yield, while the plant N:P and N:K ratios were significantly and negatively correlated with biomass production. In the LNPK treatment, no correlation was found between plant yields and the content of plant nutrients and plant ratios.

4. Discussion

Our results show that soil and plant of this permanent wet meadow differed to various rates of mineral fertilizers applied. It should be mentioned that soil pH and its changes affected by buffer systems alter soil processes and alter plant growth. It is also well known that there are strong links between soil pH and the availability of nutrient ions essential for plant growth and plant production. The phosphate availability depends upon soil pH and generally maximum amounts of plant-available P would be expected in the slightly acid to neutral range of soil reaction [32]. Thus, pH is an important soil chemical property determining soil fertility as an ecosystem service.
The pH of the soil depends on the extent to which the input of the base cations coming from artificial and organic fertilizers, from the atmosphere, from the geochemical atmospheric agents, from the vegetable waste, from the water that flows into the ground, can offset the exit in the ground, in the drainage water, in the absorption of plants, and in the removal of animals and crops [33]. Soil acidification is an environmental problem that is driven by various factors and was documented on grasslands [34,35] and in the other crop systems as well [36,37]. Our results showed that soil has been significantly acidified under all treatments. Consistent with our results, Bowman and Cleveland [38] reported a negative impact of N deposition of soil pH in alpine grassland. However, Cai et al. [39] showed that N-limited ecosystems are also sensitive to acidification. In grasslands, roots, litter, and harvest residues together with fertilizers are important sources of basic cations to maintenance of optimal pH value. However, permanent removal of basic cations with harvested biomass together with addition of high rates of fertilizers particularly by ammonium-based fertilizers and urea are main drivers of acidification of grassland soils [18,40]. In Gleyic Fluvisol of our experiment, the buffer system of silicate, cation exchange, and organic matter acted to buffer the acidity. Fluvisol is young in pedological terms and has been developed in clayey, silty, and sandy sediments and from weathering products of varying lithology. However, soil substrate is low in carbonate content and thus cannot act against acidification. In addition, during the experiment soil acidity was not ameliorated by applying lime or other acid-neutralizing materials. At the beginning of the experiment, the pH was 6.03, which was very close to the optimum pH value. The optimum soil pH for grassland is at or above 6.3. It was not necessary to add lime, and there was possible just without additional management practices to observe direct effect of fertilization on soil chemical properties. In addition, Slovak grasslands because of predominant mountain character of Slovakia are typical with more extensive management practices. In our case, ANOVA showed that soil pH did not differ significantly between treatments when considering long-term period of addition of different rates of mineral fertilization but the same intensity of defoliation regime. It seems that a higher frequency of defoliation together with higher removal of nutrients in harvested biomass is also an important driver of soil acidification. Similar results were documented by Hrevušová et al. [41] and Kid et al. [42].
Long-term grassland experiments show progress in soil acidification and also indicate when the soil is approaching equilibrium in pH values. We observed that soil pH decreased with time in all treatments. However, pH values in all treatments have been approaching the equilibrium in the middle of the experiment. In the Park Grass Experiment at Rothamsted, soil pH values were steadily reduced to an equilibrium pH value of 5.1. In contrast to our experiment, the equilibrium was reached after 100 years of the addition of the fertilizer [43].
Values of pH are significantly and positively correlated with SOC values and this result confirmed the importance of SOC buffering activity in relation to soil acidification. SOC has proved to be an important factor for what concerns the quality of the environment. In the experiment, SOC content changed during the experiment similarly like pH values. Nevertheless, under the HNPK treatment, the content of SOC and the organic matter quality (expressed by C:N ratio) in 1988 were the lowest compared to the 0NPK, LNPK, and MNPK, respectively. Fertilization may impact SOC in different agroecosystems, and usually soil organic matter including soil organic carbon is significantly influenced by long-term NPK addition [44]. However, this effect is not entirely clear. Zeller et al. [45] did not find any relationship between the intensity of management and SOC stock in Alpine grasslands. However, global data sets revealed that fertilized grasslands had, on average, higher SOC stocks than natural or less intensively managed systems [46]. In intensively managed grasslands with high livestock, grazing intensity also significantly increased SOC for specific grassland communities [47]. In some cases, mineral fertilizer application increases the input of plant remains into the soil and, thus, contributes to the rise in the humus content [48]. However, at the same time, mineral fertilizers may favor a decrease in the humus content owing to the enhanced mineralization of organic matter by the soil microflora [49]. Fertilizer doses affect the humus quality and the distribution of particular fractions of humic and fulvic acids in the soil profile [50]. Mucha and Tomková [51] confirmed at Veľká Lúka PGE experiment as the most optimal MNPK treatment from the point of the content and quality of humus substances.
The STN content was changing during the experiment. Soil TN in all treatments declined in the first decade similarly like in the long-term wheat experiment carried out by Karimi et al. [52]. Then, the STN increased with following variability among the treatments. Lower content of STN under the MNPK and HNPK treatments with higher N doses in 2017 comparing the start of the experiment could be a result of a higher N plant uptake or possible nitrate leaching from the over-fertilized soil. Fertilization with N in its mineral form has greatly increased food security but has also been identified as a cause of major environmental problems. Leaching of NO3 from soils into waterways is responsible for pollution of groundwater, surface water, and estuaries [53], although nitrate leaching under grassland is greatly reduced as compared to cropland [54].
Mineral fertilization affects grassland botanical composition. Nitrogen favors grass performance particularly tall grasses [55] and changes abundance of legumes and forbs. During 57 years, fertilization addition in LNPK, MNPK, and HNPK treatments suppressed legume by 30%, 57%, and 89%, respectively. Our study is consistent with Ren at al. (2017) [56]. A mean legume and forb cover in all treatments was lower in the 2013–2017 period in comparison to mean values of the 57-year period. A decrease in legume performance during the last 5 years could be explained by weather conditions, particularly by the shortage of precipitation and increased mean temperature in 2013, 2015, and 2017.
Plant-available K and P showed substantial fluctuations over the 57-year period. In case of plant-available K, the MNPK treatment showed the highest increase compared to all treatments including the HNPK treatment with the highest K dose. As in a long-term grassland fertilizer experiment in the Czech Republic [57], we also observed a significant effect of fertilizer treatments on plant-available P content in the soil. Content of plant-available nutrients approached levels sufficient to meet the needs of plants after 28 years (in the middle of the experiment) since the start of the experiment only under the MNPK and HNPK treatments with regular annual addition of 30 kg P. ha−1 and 61 kg P. ha−1 and 83 kg K. ha−1 and 166 kg K. ha−1, respectively. This is contrary to the observation of Schipper et al. [58] who claim that while the use of N fertilizers in grasslands seems necessary to maintain productivity, soil P stocks of most temperate agricultural soils appear to be sufficient.
Plant biomass yield was the highest under the HNPK treatment with the highest NPK rate. Nitrogen addition generally increases biomass in temperate grassland systems [59], but these responses are also strongly influenced by N rate, application duration, and management practice [60]. In our research, the amount of N, P, and K fertilizers rate determined also the plant biomass yield in ascending order. Long-term fertilization also increased the concentration of macronutrients in plant biomass. The highest N content was found under the HNPK treatment. Nevertheless, under the LNPK treatment with N rate of 50 kg. ha−1 showed lower nitrogen content in plant biomass comparing to the Control. Similar findings with decreasing N content in plant biomass with low nitrogen rate was recorded by Hejcman et al. [61] in the long-term Rengen Grassland Experiment.
Phosphorus and potassium have specific biochemical functions in plants, and fertilization is necessary to ensure herbage yield [62]. The optimum content of P recommended for dairy cattle ranges from 2.4 to 4.0 g.kg-1 [63]. In our study, the P concentration in plant biomass was adequate to meet the animal’s requirements. On the contrary, the dairy cattle requirements for K are lower than those found in grassland biomass. According to Whitehead [63], the optimum content of K ranges from 6.5 to 10 g.kg-1. Animals on the diet with the K concentration over 25 g.kg -1 can have a risk of metabolic and reproductive disorders in particular grass tetany or milk fever. Similarly to the N concertation, increasing fertilizer doses resulted in a significantly higher P and K concentration in plant biomass. The relationship between plant C:N:P ratios is useful parameter to consider nutrient limitation of biomass production in ecological research. Continual fertilization, in addition to an increased content of nutrients in above-ground biomass, also affects the plant C:N:P stoichiometric responses and nutrients cycling in grassland as well. In this study, N, P, and K fertilizer application significantly decreased plant C:N, C:P, N:P, and N:K ratios comparing to unfertilized control, which is consistent with research findings by Heyburn et al. [35] and Zheng et al. [64]. Similarly to our study, some authors [65,66] observed that plant C:N ratio was negatively correlated with plant N content and was not associated with C dynamics. According to Güsewell [67], this can be due to higher variation in plant tissue N content in comparison to plant C concentration. A meta-analysis of more than 1400 studies confirmed that the plant C:P and the N:P ratios decreased with combined N and P fertilization [68]. Our results showed that any significant difference in plant C:P and N:P ratios between the fertilized LNPK, MNPK, and HNPK treatments and changes in the plant C:P and N:P ratios were negatively correlated only with the plant P concentration. In this experiment, it seems that the decrease in C:P and N:P ratios is not related to the N amount of 50, 100, and 200 kg (+ P and K) applied. Some authors report that in alluvial meadows with plant N:P and N:K ratios, respectively, lower than 14 [67] and 2.1 [69], it may be excluded that there is a limitation of K and P in biomass production. The plant N:P ratio below 9 and the plant N:K ratio below 1.3 registered in all treatments show that plant yields in the experiment were N-limited. Our results are in accordance with Hrevušová et al. [41].
It is well-known that grassland ecosystems require decades to stabilize in response to any anthropogenic impact. Fertilization experiments younger than 10–20 years may only show an intermediate impact on ecosystem properties [42].

5. Conclusions

This experiment offered very important indications that confirm the importance and the need to conduct long-term tests to obtain reliable and transferable results. Among all major fertilizer nutrients, N is considered the main nutrient affecting soil pH and especially ammonium-based products. However, in this experiment, soil acidification was also observed in the non-fertilized control, which indicates that the land use, the permanent removal of base cations with the collected biomass, and the soil substrate-specific in buffer capacity had a more important effect than the fertilizers themselves. SOC increased in all treatments but above all in the treatment with a medium rate of fertilizers. Continual fertilization has increased grassland biomass yield and content of macronutrients as well. Our results suggest that a medium quantity of fertilizers on grasslands seems to be an acceptable compromise to meet both productivity and maintain quantity and quality of soil organic matter. Nevertheless, fertilization has shifted plant stoichiometric C:N:P relations. Future research that investigates how C:N:P stoichiometry responds to continual fertilization is necessary for progressing our understanding of the relationship between provisioning and regulating grassland ecosystem services.

Author Contributions

Conceptualization and writing—original draft preparation, R.K. and M.K.; methodology, V.V. and M.M.; formal analysis, V.V., R.K., M.K., and B.Š.; investigation, V.V., Z.K., and M.M.; writing—review and editing, V.V., R.K., M.K., B.Š., and Z.K.; project administration, V.V. and B.Š.; funding acquisition, B.Š. All authors have read and agreed to the published version of the manuscript.

Funding

This research was supported by the Ministry of Agriculture and Rural Development of the Slovak Republic by the project no. 381/2018/MPRV SR - 300 and by the Scientific Grant Agency of the Ministry of Education, Science, Research and Sport of the Slovak republic by the project no. VEGA 1/0767/17.

Acknowledgments

We acknowledge all staff for their work associated with the Veľká Lúka Permanent Grassland Experiment.

Conflicts of Interest

The authors declare no conflict of interest.

References

  1. Lemaire, G.; Belanger, G. Allometries in plants as drivers of forage nutritive value: A review. Agriculture 2020, 10, 5. [Google Scholar] [CrossRef] [Green Version]
  2. Fornara, D.A.; Tilman, D. Soil carbon sequestration in prairie grasslands increased by chronic nitrogen addition. Ecology 2012, 93, 2030–2036. [Google Scholar] [CrossRef] [PubMed] [Green Version]
  3. Rumpel, C.; Crème, A.; Ngo, P.T.; Velásquez, G.; Mora, M.L.; Chabbi, A. The impact of grassland management on biogeochemical cycles involving carbon, nitrogen and phosphorus. J. Soil Sci. Plant Nutr. 2015, 15, 353–371. [Google Scholar] [CrossRef] [Green Version]
  4. Lemaire, G.; Hodgson, J.; Chabbi, A. Introduction: Food security and environmental impacts—Challenge for grassland sciences. In Grassland Productivity and Ecosystem Services; Lemiare, G., Hodgson, J., Chabbi, A., Eds.; CAB International: Wallingford, UK, 2011. [Google Scholar]
  5. Bengtsson, J.; Bullock, J.M.; Egoh, B.; Everson, C.; O’Connor, T.; O’Farrell, P.J.O.; Smith, H.G.; Lindborg, R. Grasslands—More important for ecosystem services than you might think. Ecosphere 2019, 10, 1–20. [Google Scholar] [CrossRef]
  6. Powlson, D.S.; Gregory, P.J.; Whalley, W.R.; Quinton, J.N.; Hopkins, D.W.; Whitmore, A.P.; Hirsch, P.R.; Goulding, K.W.T. Soil management in relation to sustainable agriculture and ecosystem services. Food Policy 2011, 36, 572–587. [Google Scholar] [CrossRef]
  7. Tomaškin, J.; Jančovič, J.; Vozár, Ľ.; Tomaškinová, J. The effect of mineral fertilization on belowground plant biomass of grassland ecosystems. Acta Univ. Agric. Silvic. Mendel. Brun. 2013, 61, 1431–1440. [Google Scholar] [CrossRef] [Green Version]
  8. Leto, J.; Knezevic, M.; Bosnjak, K.; Vranic, M.; Gunjaca, J. Changes in grassland yield and botanical composition under contrasting managements. Cereal Res. Commun. 2008, 36, 867–870. [Google Scholar]
  9. Niu, K.; Luo, Y.; Choler, P.; Du, G. The role of biomass allocation strategy in diversity loss due to fertilization. Basic Appl. Ecol. 2008, 9, 485–493. [Google Scholar] [CrossRef]
  10. Dupre, C.; Stevens, C.J.; Ranke, T.; Bleeker, A.; Peppler-Lisbach, C.; Gowing, D.J.G.; Dise, N.B.; Dorland, E.; Bobbink, R.; Diekmann, M. Changes in species richness and composition in European acidic grasslands over the past 70 years: the contribution of cumulative atmospheric nitrogen deposition. Glob. Chang. Biol. 2010, 16, 344–357. [Google Scholar] [CrossRef]
  11. Berge, H.F.M.; van der Meer, H.G.; Carlier, L.; Baan Hofman, T.; Neeteson, J.J. Limits to nitrogen use on grassland. Environ. Pollut. 2002, 118, 225–238. [Google Scholar] [CrossRef]
  12. Vukovic, S.; Cupina, B.; Simic, A.; Prodanovic, S.; Zivanovic, T. Effect of nitrogen fertilization and under sowing on yield and quality of Cynosuretum cristati – type meadows in hilly-mountainous grasslands in Serbia. J. Cent. Eur. Agric. 2005, 6, 509–514. [Google Scholar]
  13. Klimek, S.; Richter gen. Kemmermann, A.; Hoffman, M.; Isselstein, J. Plant species richness and composition in managed grasslands. The relative importance of field management and environmental factors. Biol. Conser. 2007, 134, 559–570. [Google Scholar] [CrossRef]
  14. Bardgett, R.D. The Biology of Soil: A Community and Ecosystem Approach; Oxford University Press: Oxford, UK, 2005. [Google Scholar]
  15. Pimentel, D. Soil erosion. A food and environmental threat. Environ. Dev. Sustain. 2006, 8, 119–137. [Google Scholar] [CrossRef]
  16. Malhi, S.S.; Wang, Z.H.; Schnizer, M.; Monreal, C.M.; Harapiak, J.T. Nitrogen fertilization effects on quality of organic matter in a grassland soil. Nutri. Cycl. Agroecosyst. 2005, 73, 191–199. [Google Scholar] [CrossRef]
  17. Zhang, X.; Wang, Q.; Gillian, F.S.; Bai, W.; Han, X.; Li, L. Effect of nitrogen fertilization on net nitrogen mineralization in a grassland soil, northern China. Grass Forage Sci. 2012, 67, 219–230. [Google Scholar] [CrossRef]
  18. Tian, D.; Niu, S. A global analysis of soil acidification caused by nitrogen addition. Environ. Res. Lett. 2015, 10, 024019. [Google Scholar] [CrossRef]
  19. Isselstein, J.; Kayser, M. Functions of grassland and their potential in delivering ecosystem services. Grassl. Sci. Eur. 2014, 19, 199–214. [Google Scholar]
  20. Taube, F.; Gierus, M.; Hermann, A.; Loges, R.; Schönbach, P. Grassland and globalization—Challenges for north-west European grass and forage research. Grass Forage Sci. 2014, 69, 2–16. [Google Scholar] [CrossRef]
  21. Johnston, A.E.; Goulding, K.W.T.; Poulton, P.R. The importance of long-term experiments in agriculture: their management to ensure continued crop production and soil fertility; the Rothamsted experience. Eur. J. Soil Sci. 2018, 69, 113–125. [Google Scholar] [CrossRef] [Green Version]
  22. Debreceni, K.; Körschens, M. Long-term experiments of the world. Arch. Agron. Soil Sci. 2003, 49, 465–483. [Google Scholar] [CrossRef]
  23. Gaisler, J.; Pavlu, V.; Pavlu, L.; Hejcman, M. Long-term effects of different mulching and cutting regimes on plant species composition of Festuca rubra grassland. Agric. Ecosyst. Environ. 2013, 178, 10–17. [Google Scholar] [CrossRef]
  24. Tomka, O.; Morháč, P.; Lihán, E.; Džuban, Š. To the question of humus and its function at different rates of applied nutrients and mechanical treatment on grass swards. Vedecké práce VÚLP 1972, 8, 33–40. [Google Scholar]
  25. Steiner, R.A.; Herdt, R.W. A Global Directory of Long-Term Agronomic Experiment; Vol. 1: Non-European Experiments; The Rockefeller Foundation: New York, NY, USA, 1993; p. 296. [Google Scholar]
  26. UGKKSR. Statistical Yearbook on Land in the Slovak Republic; UGKKSR: Bratislava, Slovakia, 2017. (in Slovak) [Google Scholar]
  27. European Communities. Climate Change Impacts in Europe. Final Report of the PESETA Research Project; EC, JRC IPTS, JRC IES; Joint Research Centre: Ispra, Italy, 2009. [Google Scholar]
  28. IUSS Working Group WRB. World Reference Base for Soil Resources 2014, Update 2015. International Soil Classification System for Naming Soils and Creating Legends for Soil Maps; World Soil Resources Reports No., 106; FAO: Rome, Italy, 2015. [Google Scholar]
  29. AOAC. Official Methods of Analysis, 17th ed.; AOAC: Washington, DC, USA, 2000. [Google Scholar]
  30. Marhold, K.; Hindák, F. Checklist of Non-Vascular and Vascular Plants of Slovakia; Veda: Bratislava, Slovakia, 1998. [Google Scholar]
  31. Hanly, J.A.; Gregg, P.E.H. Green-manure impacts on nitrogen availability to organic sweetcorn (Zea mays). New Zealand Journal of Crop and Horticultural Science 2010, 32, 295–307. [Google Scholar] [CrossRef]
  32. Tan, K.H. Principles of Soil Chemistry, 4th ed.; CRC Press, Taylor & Francis Group: Boca Raton, FL, USA, 2011; ISBN 978-1-4398-1392-8. [Google Scholar]
  33. Cresser, M.; Killham, K.; Edwards, T. Soil Chemistry and Its Application; Cambridge Environmental Chemistry Series, 5; Cambridge University Press: Cambridge, UK, 1993; ISBN 0 521 31134 9. [Google Scholar]
  34. Čop, J. Soil acidification and liming in grassland production and grassland soil fertility in Slovenia. Acta Agric. Slov. 2014, 103, 15–25. [Google Scholar] [CrossRef]
  35. Heyburn, J.; McKenzie, P.; Crawley, M.J.; Fornara, D.A. Long-term belowground effects of grassland management: the key role of liming. Ecol. Appl. 2017, 27, 2001–2012. [Google Scholar] [CrossRef]
  36. Vašák, F.; Černý, J.; Buráňová, Š.; Kulhánek, M.; Balík, J. Soil pH changes in long-term field experiments with different fertilizing systems. Soil Water Res. 2015, 10, 19–23. [Google Scholar] [CrossRef] [Green Version]
  37. Yang, X.; Ni, K.; Shi, Y.; Yi, X.; Zhang, Q.; Fang, L.; Ma, L.; Ruan, J. Effects of long-term nitrogen application on soil acidification and solution chemistry of a tea plantation in China. Agric. Ecosyst. Environ. 2018, 252, 74–82. [Google Scholar] [CrossRef]
  38. Bowman, W.D.; Cleveland, C.C. Negative impact of nitrogen deposition on soil buffering capacity. Nat. Geosci. 2008, 1, 767–770. [Google Scholar] [CrossRef]
  39. Cai, J.; Luo, W.; Liu, H.; Feng, X.; Zhang, Y.; Wang, R.; Xu, Z.; Zhang, Y.; Jiang, Y. Precipitation-mediated responses of soil acid buffering capacity to long-term nitrogen addition in a semi-arid grassland. Atmos. Environ. 2017, 170, 312–318. [Google Scholar] [CrossRef]
  40. Guo, S.; Wu, J.; Dang, T.; Liu, W.; Li, Y.; Wei, W.; Syers, K. Impacts of fertilizer practices on environmental risk of nitrate in semiarid farmland the Loess Plateau of China. Plant Soil 2010, 330. [Google Scholar] [CrossRef]
  41. Hrevušová, Z.; Hejcman, M.; Pavlů, V.; Hakl, J.; Klaudisová, M.; Mrkvička, J. Long-term dynamics of biomass production, soil chemical properties and plant species composition of alluvial grassland after the cessation of fertilizer application in the Czech Republic. Agric. Ecosyst. Environ. 2009, 130, 123–130. [Google Scholar] [CrossRef]
  42. Kidd, J.; Manning, P.; Simkin, J.; Peacock, S.; Stockdale, E. Impacts of 120 years of fertilizer addition on a temperate grassland ecosystem. PLoS ONE 2017, 12, e0174632. [Google Scholar] [CrossRef] [PubMed]
  43. Johnston, A.E.; Goulding, K.W.T.; Poulton, P.R. Soil acidification during more than 100 years under permanent grassland and woodland at Rothamsted. Soil Use Manag. 1986, 2, 3–10. [Google Scholar] [CrossRef]
  44. Ahmed, W.; Kaulou, L.; Qaswar, M.; Huang, J.; Huang, Q.; Xu, Y.; Ali, S.; Mehmood, S.; Asghar, R.M.A.; Mahmood, M.; et al. Long-term mineral fertilization improved the grain yield and phosphorus use efficiency by changing soil P fractions in ferralic Cambisol. Agronomy 2019, 9, 784. [Google Scholar] [CrossRef] [Green Version]
  45. Zeller, V.; Kandeler, E.; Mair, V. N-dynamic in mountain grassland with different intensity of cultivation. Aust. J. Agric. Res. 1997, 48, 217–230. [Google Scholar]
  46. Conant, R.T. Challenges and opportunities for carbon sequestration in grassland systems. A technical report on grassland management and climate mitigation. Integr. Crop Manag. 2010, 9, 1–67. [Google Scholar]
  47. Abdalla, M.; Hastings, A.; Chadwick, D.R.; Jones, D.L.; Evans, C.D.; Jones, M.B.; Rees, R.M.; Smith, P. Critical review of the impacts of grazing intensity on soil organic carbon storage and other soil quality indicators in extensively managed grasslands. Agric. Ecosyst. Environ. 2018, 253, 62–81. [Google Scholar] [CrossRef] [Green Version]
  48. Galeeva, L.P. Changes in the properties of leached chernozems of the northern forest-steppe in the middle Ob River basin caused by different agricultural uses. Euasian Soil Sci. 2012, 45, 206–219. [Google Scholar] [CrossRef]
  49. Masakazu, A.; Kumakura, N. Quantitative and qualitative changes of organic matter in an ando soil induced by mineral fertilizer and cattle manure applications for 20 years. Soil Sci. Plant Nutr. 2001, 47, 241–252. [Google Scholar] [CrossRef]
  50. Eremin, D.I. Changes in the content and quality of humus in leached chernozems of the Trans-Ural forest-steppe zone under the impact of their agricultural use. Euasian Soil Sci. 2016, 49, 584–592. [Google Scholar] [CrossRef]
  51. Mucha, V.; Tomková, R. Quantity and quality of humus substances under permanent grasslands in fluvi-eutric gleysol at different intensity of fertilization. Acta Fytotechnica 1994, XLIX, 3–10. [Google Scholar]
  52. Karimi, R.; Janzen, H.H.; Smith, E.G.; Ellert, B.H.; Kröbel, R. Nitrogen balance in century-old wheat experiments. Can. J. Soil. Sci. 2017, 97, 1–12. [Google Scholar] [CrossRef] [Green Version]
  53. Cameron, K.C.; Di, H.J.; Moir, J.I. Nitrogen losses from the soil/plant system: a review. Ann. Appl. Biol. 2013, 162, 145–173. [Google Scholar] [CrossRef]
  54. Kunrath, T.R.; de Berranger, C.; Charrier, X.; Gastal, F.; de Faccio Carvalho, F.C.; Leamire, G.; Emile, J.C.; Durand, J.L. How much do sod based rotations reduce nitrate leaching in a cereal cropping system? Agric. Water Manag. 2015, 150, 46–56. [Google Scholar] [CrossRef]
  55. Gaujour, E.; Amiaud, B.; Mignolet, C.; Plantureux, S. Factors and processes affecting plant biodiversity in permanent grasslands. A review. Agron. Sustain. Dev. 2012, 32, 133–160. [Google Scholar] [CrossRef] [Green Version]
  56. Ren, F.; Song, W.; Chen, L.; Mi, Z.; Zhang, Z.; Zhu, W.; Zhou, H.; Cao, G.; He, J. Phosphorus does not alleviate the negative effect of nitrogen enrichment on legume performance in an alpine grassland. J. Plant Ecol. 2017, 10, 822–830. [Google Scholar] [CrossRef] [Green Version]
  57. Hrevušová, Z.; Hejcman, M.; Hakl, J.; Mrkvička, J. Soil chemical properties, plant species composition, herbage quality, production and nutrient uptake of an alluvial meadow after 45 years of N, P and K application. Grass Forage Sci. 2014, 70, 205–2018. [Google Scholar] [CrossRef]
  58. Schipper, L.A.; Dodd, M.B.; Pronger, J.; Mudge, P.L.; Upsdell, M.; Moss, R.A. Decadal changes in soil carbon and nitrogen under a range of irrigation and phosphorus fertilizer treatments. Soil Sci. Soc. Am. J. 2012, 77, 246–256. [Google Scholar] [CrossRef]
  59. Kizeková, M.; Feoli, E.; Parente, J.; Kanianska, R. Analysis of the effects of mineral fertilization on species diversity and yield of permanent grasslands: revisited data to mediate economic and environmental needs. Community Ecol. 2017, 18, 295–304. [Google Scholar] [CrossRef]
  60. Humbert, J.; Dwyier, J.M.; Andrey, A.; Arlettaz, R. Impacts of nitrogen addition on plant biodiversity in mountain grasslands depend on does, application duration and climate: a systematic review. Glob. Chang. Biol. 2016, 22, 110–120. [Google Scholar] [CrossRef]
  61. Hejcman, M.; Szaková, J.; Schellberg, J.; Tlustoš, P. The Rengen grassland experiment: relationship between soil and biomass chemical properties, amount of elements applied, and their uptake. Plant Soil 2010, 333, 163–179. [Google Scholar] [CrossRef]
  62. Lunnan, T.; Ogaard, A.F.; Krogstad, T. Potassium fertilization of timothy-based cut grassland-effects on herbage yield, mineral composition and critical K concentration on soils with different K status. Grass For. Sci. 2018, 73, 500–509. [Google Scholar] [CrossRef]
  63. Whitehead, D.C. Nutrient Elements in Grassland. Soil-Plant-Animal Relationships; CABI Publishing: Wallingford, UK, 2000. [Google Scholar]
  64. Zheng, S.; Ren, H.; Li, W.; Lan, Z. Scale-dependent effects of grazing n plant C : N : P stoichiometry and linkages to ecosystem functioning in the Inner Mongolia Grassland. PLoS ONE 2012, 7, e51750. [Google Scholar] [CrossRef] [PubMed]
  65. Yang, Y.; Luo, Y.; Lu, M.; Schädel, C.; Han, W. Terrestrial C:N stoichiometry in response to elevated CO2 and N addition: a synthesis of two meta-analyses. Plant Soil 2011, 343, 393–400. [Google Scholar] [CrossRef]
  66. Luo, W.; Li, M.H.; Sardans, J.; Lü, X.T.; Wang, C.; Peñuelas, J.; Wang, Z.; Han, X.G.; Jiang, Y. Carbon and nitrogen allocation shifts in plants and soils aridity and fertility gradients in grasslands of China. Ecol. Evol. 2017, 7, 6927–6934. [Google Scholar] [CrossRef]
  67. Gűsewell, S. N : P ratios in terrestrial plants: variation and functional significance. New Phytol. 2004, 164, 243–266. [Google Scholar] [CrossRef]
  68. Yuan, Z.; Chen, H. Decoupling of bitrogen and phosphorus in terrestrial plants associated with global changes. Nat. Clim. Change 2015. [CrossRef]
  69. OldeVentrik, H.; Wassen, M.J.; Verkroost, A.W.M.; De Ruiter, P.C. Species richness-productivity patterns differ between N-, P-, and K-limited wetlands. Ecology 2003, 84, 2191–2199. [Google Scholar] [CrossRef]
Figure 1. Changes in soil chemical properties under the different NPK addition: (a) soil pH; (b) soil organic carbon (SOC); (c) soil total nitrogen (STN); (d) C:N ratio (C:N); e) plant-available phosphorus (P); f) plant-available potassium (K).
Agronomy 10 00375 g001
Figure 2. Changes in soil chemical properties, yields, and precipitation under the different NPK addition during 2013–2017: (a) soil pH; (b) soil organic carbon (SOC); (c) soil total nitrogen (STN); (d) C:N ratio (C:N); (e) plant-available phosphorus (P); (f) plant-available potassium (K); (g) plant yields; (h) precipitation during vegetation.
Agronomy 10 00375 g002aAgronomy 10 00375 g002bAgronomy 10 00375 g002c
Figure 3. Plant biomass yield (a) mean values for 57-year period and period of last 5 years; (b) mean values for 2013, 2014, 2015, 2016, and 2017. Different letters indicate treatment differences at p < 0.01.
Agronomy 10 00375 g003
Figure 4. Changes in soil chemical properties and plant yield under the different NPK addition: (a) 0NPK; (b) low NPK treatment (LNPK); (c) medium NPK treatment (MNPK); (d) high NPK treatment (HNPK).
Agronomy 10 00375 g004
Table 1. Details of the fertilizer treatments at Veľká Lúka Permanent Grassland Experiment (PGE).
TreatmentTotal Nutrient Supply (kg. ha−1. y−1)Nutrient Ratio
NPKN:P:K
0NPK0000
LNPK5015.441.51:0.31:0.83
MNPK10030.883.01:0.31:0.83
HNPK20061.6166.01:0.31:0.83
Table 2. Mean and standard deviation values of soil chemical properties during 2013–2017.
TreatmentpHSOC
(g.kg−1)
STN
(g.kg−1)
C:NP
(mg.kg−1)
K
(mg.kg−1)
Yield
(t.ha−1)
0NPK4.44 ± 0.1927.35 ± 3.403.28 ± 0.588.67 ± 2.023.02 ± 3.11104.12 ± 11.424.28 ± 1.26
LNPK4.52 ± 0.3025.93 ± 3.393.28 ± 0.628.18 ± 1.692.14 ± 0.69104.18 ± 5.865.83 ± 1.46
MNPK4.58 ± 0.1424.26 ± 5.843.03 ± 1.038.70 ± 3.0314.08 ± 3.83104.35 ± 13.837.12 ± 1.50
HNPK4.57 ± 0.1623.27 ± 4.512.98 ± 1.118.49 ± 2.1810.89 ± 6.77105.52 ± 8.949.62 ± 1.75
Table 3. Botanical composition (%) in 1961 and 2017.
Plant SpeciesTreatment 0NPKLNPKMNPKHNPK
Year
Functional Group19612017
Agrostis stolanifera L.Grass06303
Alopecurus pratensis L.Grass7281427
Anthoxanthum odoratum L.Grass01315166
Arrhenatherum elatius L.Grass1761021
Avenastrum pubescens Dumort.Grass06648
Bromus mollis Huds.Grass50001
Carex spp.Grass2966+
Dactylis glomerata L.Grass11000
Deschampsia caespitosa (L.) P. Beauv.Grass140100
Festuca pratensis (L.) P. Beauv.Grass55632
Festuca rubra L.Grass06585
Lolium perenne L.Grass10000
Phleum pratense L.Grass10000
Poa pratensis L.Grass2481089
Poa trivialis L.Grass20000
Trisetum flavescens (L.) P. Beauv.Grass0481111
Lathyrus pratensis L.Legume00050
Lotus corniculatus L.Legume20000
Medicago falcata L.Legume01+00
Trifolium repens L.Legume9232+
Trifolium pratense L.Legume103831
Vicia tenuifolia L.Legume12001
Acetosa pratensis Mill.Forb111+1
Achillea millefolium L.Forb21+11
Campanula patula L.Forb00+00
Galium mollugo L.Forb0+1+0
Leontodon hispidus L.Forb21152+
Plantago lanceolata L.Forb11000
Plantago media L.Forb0+000
Ranunculus acer L.Forb13331
Senecio vulgaris L.Forb0+000
Stellaria media L.Forb0111+
Taraxacum officinale auct. non Weber.Forb75322
Tragopogon orientalis L.Forb11000
Veronica verna L.Forb01110
+ cover less than 1%.
Table 4. Mean cover (%) of plant functional group before the first cut during 1961–2017 and 2013–2017 period.
1961–20172013–2017
TreatmentGrassLegumeForbGrassLegumeForb
0NPK41.88 d ± 13.4221.09 a ± 11.3436.11 a ± 9.7557.20 c ± 9.8614.40 a ± 6.6628.40 a ± 8.35
LNPK59.15 c ± 10.3414.75 b ± 8.8426.58 b ± 9.3273.00 b ± 4.8510.80 a ± 2.4916.20 ab ± 5.63
MNPK68.04 b ± 10.449.07 c ± 5.8322.45 bc ± 7.5479.80 ab ± 5.368.20 ab ± 1.6412.00 bc ± 5.10
HNPK79.95 a ± 12.032.17 d ± 2.2716.89 c ± 11.5287.20 a ± 4.023.40 b ± 0.897.40 c
p value<0.001<0.001<0.001<0.0010.001<0.001
Contrasting letters denote significant differences; P—probability value.
Table 5. Average content of nutrients and nutrient ratios.
TreatmentAnalyzed Parameters
N (g.kg−1)P (g.kg−1)K (g.kg−1)C:NC:PN:PN:K
0NPK21.99 b2.46 c16.18 c18.39 ab168.74 a8.61 a1.28 a
LNPK21.83 b2.96 b17.87 bc18.55 a137.78 b7.12 b1.17 ab
MNPK22.07 a3.36 ab19.42 b18.36 ab120.44 b6.37 b1.11 bc
HNPK23.64 a3.47 a22.20 a17.18 b118.66 b6.45 b1.00 c
p value˂0.001˂0.001˂0.001˂0.001˂0.001˂0.001˂0.001
Contrasting letters denote significant differences; P—probability value.
Table 6. Long-term mean removal of nutrients in harvested plant biomass.
TreatmentN (kg.ha−1)P (kg.ha −1)K (kg.ha −1)
0NPK92.74 c ± 32.2310.87 c ± 3.4573.28 c ± 26.44
LNPK129.07 bc ± 46.0721.57 bc ± 7.53111.67 bc ± 43.31
MNPK156.34 b ± 44.4024.98 b ± 8.27145.84 b ± 53.48
HNPK205.70 a ± 52.6332.90 a ± 10.81213.10 a ± 78.43
Contrasting letters denote significant differences; P—probability value.
Table 7. Effect of treatments on soil and plant properties.
ParameterF-Valuep-Value
Soil Properties
pH/KCl0.0630.979
SOC1.4870.229
STN0.7070.552
C:N0.5410.656
Plant-available P15.9350.001
Plant-available K0.1300.942
Plant biomass properties
Plant biomass yield124.280.001
Nitrogen13.100.001
Phosphorus53.060.001
Potassium54.610.001
Plant C:N11.410.001
Plant C:P68.520.001
Plant N:P57.900.001
Plant N:K39.510.001
p-values highlighted in bold are statistically significant (p < 0.001).
Table 8. Pearson correlation coefficient (r-values) and significance* among soil variables (nall treatments = 56; n0NPK,,LNPK, MNPK, HNPK = 14).
Treatment pH/KClSOCSTNC:NPK
AllpH/KCl1
SOC0.404 **1
STN−0.0250.0881
C:N0.0450.143−0.820 **1
P−0.219−0.161−0.324 *0.1751
K−0.1540.050−0.010−0.0590.1501
** Correlation is significant at the 0.01 level, * Correlation is significant at the 0.05 level.
Table 9. Pearson correlation coefficient (r-values) and significance* among plant variables (nall treatments = 108; n1,2,3,4 = 27).
Treatment YieldNPKC:NC:PN:PN:K
AllYield1
N−0.0351
P0.289 **0.402 **1
K0.503 **0.459 **0.660 **1
C:N0.048−0.985 **−0.402 **−0.445 **1
C:P−0.292 **−0.396 **−0.957 **−0.644 **0.406 **1
N:P−0.345 **0.089−0.839 **−0.464 *−0.0860.871 **1
N:K−0.577 **0.116−0.495 **−0.811 **−0.1210.498 **0.603 **1
** Correlation is significant at 0.01 level. * Correlation is significant at the 0.05 level.

