Article

Seed Morphology in the Vitaceae Based on Geometric Models

by
José Javier Martín-Gómez
1,
Diego Gutiérrez del Pozo
2,
Mariano Ucchesu
3,
Gianluigi Bacchetta
3,
Félix Cabello Sáenz de Santamaría
4,
Ángel Tocino
5 and
Emilio Cervantes
1,6,*
1
IRNASA-CSIC, Cordel de Merinas 40, E-37008 Salamanca, Spain
2
Departamento de Conservación y Manejo de Vida Silvestre (CYMVIS), Universidad Estatal Amazónica (UEA), Carretera Tena a Puyo Km. 44, Napo EC-150950, Ecuador
3
Centro Conservazione Biodiversità (CCB), Dipartimento di Scienze della Vita e dell’Ambiente, Università degli Studi di Cagliari, 09123 Cagliari, Italy
4
Instituto Madrileño de Investigación y Desarrollo Rural Agrario y Alimentario (IMIDRA), Autovía de Aragón Km. 38.2, 28805 Madrid, Spain
5
Departamento de Matemáticas, Facultad de Ciencias, Universidad de Salamanca, Plaza de la Merced 1-4, 37008 Salamanca, Spain
6
Departamento de Bioquímica y Biología Molecular, GIR Biología del Desarrollo, Universidad de Salamanca, 37008 Salamanca, Spain
*
Author to whom correspondence should be addressed.
Submission received: 7 April 2020 / Revised: 8 May 2020 / Accepted: 19 May 2020 / Published: 20 May 2020

Abstract

:
Morphometric methods based on artificial vision algorithms provide measurements for magnitudes descriptive of seed images (i.e., the length, width, area, and surface circularity index). Nevertheless, their results frequently omit the resemblance of the images to geometric figures that may be used as models. A complementary method based on the comparison of seed images with geometric models is applied to seeds of Vitis spp. The J index gives the percentage of similarity between a seed image and the model. Seven new geometric models are described based on the heart-shaped and piriform curves. Seeds of different species, subspecies and cultivars of Vitis adjust to different models. Models 1 and 3, the heart curve and the water drop, adjust better to seeds of V. amurensis, V. labrusca and V. rupestris than to V. vinifera. Model 6, the Fibonacci’s pear, adjusts well to seeds of V. vinifera, in general, and better to V. vinifera ssp. vinifera than to V. vinifera ssp. sylvestris. Seed morphology in species of Cissus and Parthenocissus, two relatives of Vitis in the Vitaceae, is also analysed. Geometric models are a tool for the description and identification of species and lower taxonomic levels complementing the results of morphometric analysis.

1. Introduction

Grapevines belong to the genus Vitis L., which comprises about seventy species of lianes in the family Vitaceae Juss. Grape (Vitis vinifera L. ssp. vinifera) is one of the most ancient fruit-bearing plants in the Old World, and together with the olive, fig, pomegranate and date palm, it comprises the oldest groups of domesticated fruit trees [1,2,3]. Today, it is widely accepted that the modern cultivars of V. vinifera are the result of the domestication of V. vinifera ssp. sylvestris (C.C.Gmel.) Hegi (wild grape) [4,5,6]. The main feature used to distinguish between wild and cultivated Vitis is the reproductive system: the wild grape is dioecious, whereas the cultivated grapevine has hermaphroditic flowers; however, a small percentage of hermaphroditism also exists in the wild grape populations [7]. The domestication process, likely involving vegetative propagation of clones by growing cuttings, induced important changes in the reproductive biology of the grape cultivars, resulting in different properties; both physical (size, color), nutritional (sugar, carbohydrate and phenolic compounds), as well as in seed shape diversification. Ampelography, the botanical discipline dedicated to the identification of grapevines, has been traditionally focused on the shape of vine leaves and grape berries, and it has more recently been focused on DNA fingerprinting [8]. The seeds of grape, often called pips, are highly polymorphic and have an important role for the taxonomic study within the genus Vitis [9,10,11,12,13,14,15]. The description of seed shape proposed in this work is complementary to morphometric analysis and can be useful in Ampelography.
In early morphological studies with grape seeds, two morphotypes were defined consisting of pear-shaped or oblong to ovoid seeds, that corresponded respectively to the taxonomic groups Euvitis and Muscadinia [9,10]. The seeds of cultivated species (V. vinifera, V. labrusca L., V. aestivalis Michx.) are larger and their dimensions are more variable than those of wild species [9,10,11]. Stummer’s index was proposed to discriminate between cultivars and wild forms, defining the “wild syndrome” for those seeds having values of breadth/length above 0.8 and corresponding to wild extra-European Vitis species [9,12]. The seeds of cultivated grapevines have, in general, elongated, pear-shaped seeds, with a long beak, while the wild forms have shorter seeds, although caution must be taken in the identification of the latter, because of the difficulty in differentiating wild forms and feral cultivars [9].
Seed morphology departs from two points: first, it requires a concise description, based in qualitative aspects; and, second but not less important, metrology, i.e., the set of magnitudes that provide the dimensions of a seed. Metrology may also confirm, define and expand information about the adjectives used in the former, qualitative, description. Adjectives used to describe seed shape in Vitis include some already mentioned, like oblong, ovoid or pear-shaped (pyriform) and others like cordate, globose, oval, rounded, squat or triangular [10,11,13]. Magnitudes used to measure seed shape include seed length, seed breadth, chalazal length, chalazal position and others describing primary aspects of the morphology of pips, as indicated by Jaquat and Martinolli [1] and Mangafa and Kotsakis [13]. Modern methods of automated vision are based on the coordinates of the points in a bi-dimensional image and permit new approaches to seed morphology. Digital image analysis coupled with morphometric studies of grape seeds is a relatively new application in the plant research field. By using a set of high-resolution digital images, it is possible to obtain measurements of morphometric, colorimetric and textural features, describing the shape, size, color and texture of seeds, and this quantitative information can be correlated with various qualitative aspects of the seeds. The data obtained, corresponding to magnitudes such as area, perimeter, circularity and roundness [13,14,15,16,17], can be combined and subjected to analysis based on diverse algorithms, for example, elliptic Fourier (EFD) and Aralik descriptors. Finally, in all cases, the data are collected in a matrix and can be submitted to Linear Discriminant Analysis (LDA), to classify the seeds in groups [9,14,15,18,19,20,21].
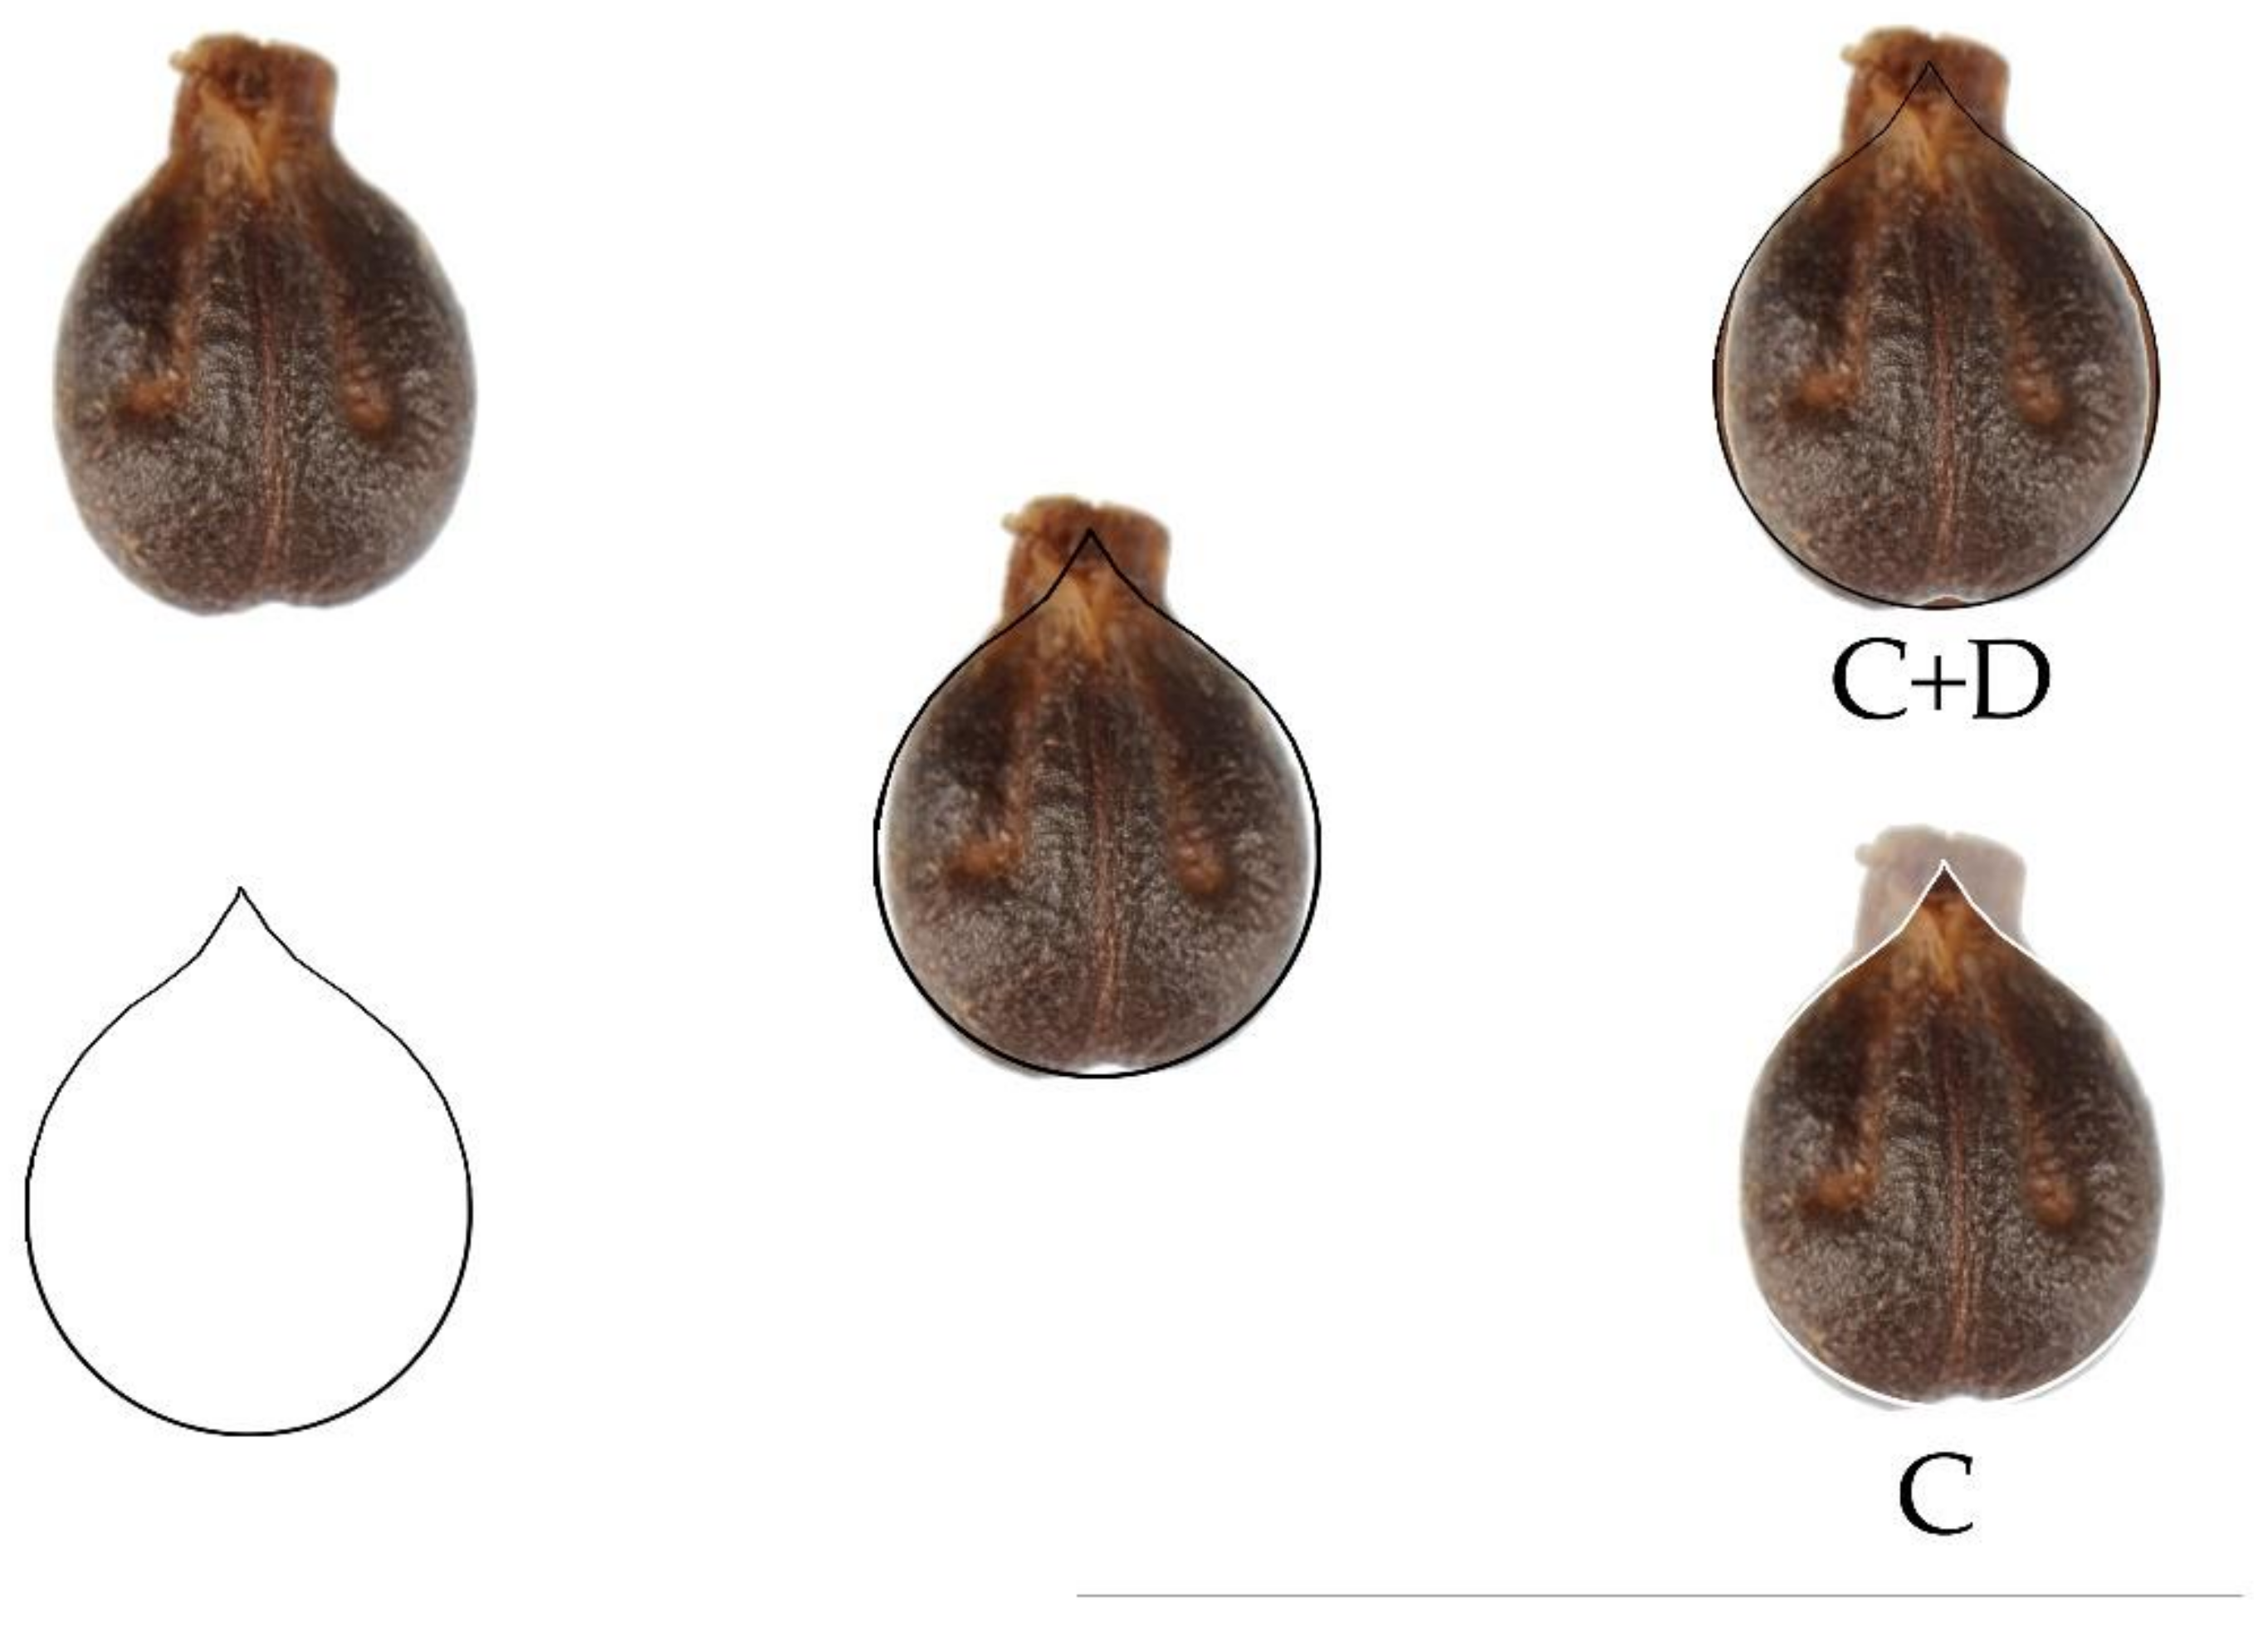
There is an interest, both theoretical and applied, in joining both aspects of morphology: the descriptive adjectives and the measurements with the objective of testing if the groups defined by artificial vision and statistical analysis correspond to well defined geometric figures. This objective, that we may define as obtaining new measurable adjectives, can be reached by comparing the seed images with geometric models based on mathematical curves. This way, we obtain the J index that gives the percent of similarity between the two images (the bi-dimensional image of the seed and the geometric model). High values of J index were obtained when comparing images of seeds with the cardioid or modified cardioids in the model plant Arabidopsis thaliana (L.) Heynh [22], as well as in the model legumes, Lotus japonicus L. and Medicago truncatula Gaertn. [23], also in Capparis spinosa L. [24], and in species of the Papaveraceae and Malvaceae [25,26].
Other geometric models include the ovoid and the ellipse, that give high values of J index with seeds of species in the Cucurbitaceae [27] and in the Euphorbiaceae, such as Ricinus L. and Jatropha L. [28,29]. Seed shape in wheat kernels was described based on three geometric figures: (1) an ellipse of aspect ratio (AR) = 1.8 fitting the “round varieties” (T. aestivum L. ssp. aestivum cv. Zebra and Torka), (2) a lens of AR = 3.2 for the elongated kernels (T. monococcum L.), and (3) an ellipse of AR = 2.4 that adjusted well the kernels of intermediate-shaped varieties such as T. durum Desf. cv. Floradur [30]. This latter work, demonstrating the adjustment of seed shape to geometrical forms, is useful to complement the results of morphometric analysis as those reported in Vitis sp. [9,14,15,18,19,20,21].
Our objective was to describe seed shape in species, subspecies and cultivars of Vitis by a combined geometric and statistical approach. The images of grape pips belonging to different genotypes were compared with geometrical models derived from mathematical curves that represent diverse heart shapes [31,32] or the pyriform curve [33]. This allows the description of seed shape with adjectives that may be measurable. For example, cordate means heart-like, thus defining a family of curves, responding to different equations that include different models. Among the cordate figures (heart-shaped), the cardioid is the curve defined by the trajectory of the point in a circle rolling around another circle of the same radius. This curve responds to an algebraic equation and is reproducible, thus, for any given two-dimensional figure well defined by a profile, we may calculate the percentage similarity to the cardioid. News models based on geometrical figures are defined for seed shape quantification in the species and cultivars of Vitis. In addition, the overall morphology of Cissus and Parthenocissus, genus related to Vitis in the Vitaceae [34] is described, presenting an overview of seed shape in the Vitaceae.

2. Materials and Methods

2.1. Species and Varieties Used

The study included seeds of four species of Vitis (V. amurensis Rupr., V. labrusca, V. rupestris Scheele and V. vinifera), as well as seeds of Cissus verticillata (L.) Nicolson and C.E. Jarvis and Parthenocissus tricuspidata (Siebold and Zucc.) Planch. V. vinifera is represented by two subspecies: V. vinifera ssp. vinifera and V. vinifera ssp. sylvestris. In addition, six cultivars of V. vinifera ssp. vinifera were included: Camarate, Carignano, Cercial, Malvasía, Meserguera and Morenillo. Seeds of V. amurensis, V. labrusca, V. rupestris and V. vinifera ssp. vinifera cultivars Camarate, Cercial, Morenillo and Meserguera proceed from “Colección de Vides del Encín” (IMIDRA, Comunidad de Madrid). Morenillo and Meserguera are Spanish varieties, while Cercial and Camarate have their origin in Portugal; V. vinifera ssp. sylvestris and V. vinifera ssp. vinifera cultivars Carignano, Malvasía proceed from Sardinia. Morenillo, Camarate and Carignano cultivars have black berries, and Cercial, Malvasía and Meserguera show white berries. All seeds were obtained from Sardinia Germplasm Bank (BG-SAR) of Hortus Botanicus Karalitanus (HBK), Università degli Studi di Cagliari (Italy).
Seeds of C. verticillata were collected at Pastaza (Ecuador) in disturbed areas and, after being photographed, the seeds were returned into the wild. Seeds of P. tricuspidata were collected at the Faculty of Pharmacy, University of Salamanca.

2.2. Seed Images

The seeds were oriented with their chalaza downwards, such as to expose the ribs upwards (ventral orientation; Figure 1). This offers an advantage in relation to the dorsal orientation, because the seed has a more plane surface of sustentation. In the dorsal orientation, the seed rests on top of the rib and the seed is skewed. Photographs containing between 33 and 122 seeds per accession were taken with a digital camera Sony ILCE 5100, with an AF-S Micro NIKKOR 60 mm. 1:2.8 G ED objective (Nikon).
The photographs were obtained with a single-leg tripod, putting the seeds on a glass and illuminating them above and below it to avoid shadows. The resolution of the images is 13.8 pixels per mm. Image data have been deposited in Zenodo: https://zenodo.org/record/3786726#.XrVL0agzaM8.

2.3. General Morphological Description by Image Analysis

Photographs were used to obtain data of the area (A), perimeter (P), length of the major axis (L), length of the minor axis (W), aspect ratio (AR is the ratio L/W), circularity (C) and roundness (R). All these magnitudes were calculated with the Image J program [35]. Length and width are the Feret diameters of the seed images. Feret, or calliper diameters, are the distance between two parallel planes restricting the object. The seeds where oriented vertically, so length and width correspond respectively with the vertical and horizontal Feret diameters. The models were adjusted to fit the size of the seed images. Circularity Iindex and roundness were calculated as described [36,37,38].

2.4. Comparison with Geometric Models

The morphological description of seed shape in Vitis accessions is based on the comparison with geometric figures used as models. The seven models are original from this work. They are shown in Figure 2 and described below.

2.4.1. Description of the Geometric Models Used

Model 1 (M1 in Figure 2) has been obtained inverting the heart curve in Weisstein [31]; then, it is defined by the equation:
x 2 + y + 2 x 2 + x 6 3 x 2 + x + 2 2 = 36 .
Model 2 (a rounded heart curve, M2 in Figure 2) results from a slight modification of Equation (1):
x 2 + y + 2 x 2 + x 6 12 x 2 + x + 2 2 = 3 .
Model 3 (M3 in Figure 2; the water drop) is obtained from M1, adapting the basis in the heart curve to a circumference overlapping the maximum width of the curve. It is the joint graphical representation in the interval [–6,6] of the function f defined by:
f x = 2 3 + 36 x 2 + 16 3 2 + x 2 + x
and g derived from the circumference with centre (0,−6/11) and radius 6:
g x = 6 11 36 x 2
Model 4 (M4 in Figure 2) results from the elongation of M3 in the y-axis by a factor of 123/100; then, it corresponds to the joint graphical representation of y = 123/100 f(x) and y = 123/100 g(x), with f and g defined in (3) and (4), respectively.
Model 5 (M5 in Figure 2) results from the elongation of M1 in the y-axis by a factor of 123/100; then, it is determined by the equation:
1681 x 2 + 100 9 y + 10,086 x 2 + 41 x 2 3 45,387 x 2 + 123 x + 2 2 = 4
To obtain Model 6 (M6 in Figure 2; the Fibonnacci’s pear), we shrink the pear curve with r = 2 in [30], so that it adjusts to a Fibonacci’s rectangle. The proposed curve is given by the equation:
49 x 2 + 25 y 2 117,649 x 6 + 15,625 y 3 2 y 2 + y 1 2 + 60,025 x 4 3 y 2 4 y + 2 + 30,625 x 2 3 y 4 8 y 3 + 8 y 2 + 2 y 3 = 1,562,500
Model 7 (M7 in Figure 2) derives from the modification of an ellipse of equation:
x 22 2 + y 25 2 = 3 44
It is given by the combined representation of the functions:
f x = 25 22 33 x 2 + 125 550   x 2 10 10 + 33     ;     g x = 25 22 33 x 2 + 50 11 ( x 4 + x 2 + x + 5 )

2.4.2. Calculation of the J Index

Figure 3 shows examples of the adjustment between seeds and models and Figure 4 two examples for the calculation of the J index.
Images containing the seed photographs and the geometric model were composed with Corel PHOTO-PAINT X7.
Areas of seed images were calculated with ImageJ program. To obtain the J index, the areas in two regions were obtained: the region shared by the model and the seed image (common region, C) and the region not shared between both areas (D). The J index is defined by [22,32]:
J = (area C)/(area C + area D) × 100
where C represents the common region and D the regions not shared (Figure 4). Note that J is a measure of seed shape, not of its area. It ranges between 0 and 100 decreasing when the size of the not-shared region grows and equals 100, when the geometric model and the seed image areas coincide; that is, when area (D) is zero. Similarity was considered when J index values were over 90.

2.5. Statistical Analysis

One way ANOVA was used to show significant differences between populations for the measured variables, followed by Scheffé or Tukey’s tests to provide specific information on which means were significantly different from one another. The former is used if the cases have different number of samples and the latter if the cases have the same or similar number of samples. The analysis was done with software IBM SPSS statistics v25.

3. Results

3.1. General Morphological Description and Comparison of Vitis Species, Subspecies and Cultivars

3.1.1. Comparison of Vitis Species and Subspecies

Table 1 shows the mean values of the area (A), perimeter (P), length of the major axis (L), length of the minor axis (W), aspect ratio (AR is the ratio L/W), circularity (C) and roundness (R) obtained for the images of the four species of Vitis analysed.
In relation to seed size (area of images), V. labrusca seeds were larger and a group composed by V. amurensis and V. vinifera ssp. vinifera, smaller. The seeds of V. rupestris and V. vinifera ssp. sylvestris had intermediate values.
The seeds of V. vinifera ssp. vinifera had higher AR values, corresponding to lower circularity and roundness, characteristics of the elongated or piriform seed morphology [5]. The seeds of V. vinifera ssp. sylvestris had intermediate values of AR. The seeds of V. amurensis, V. labrusca and V. rupestris had lower values of AR and higher values of roundness, corresponding to their more circular morphology. Smaller differences between circularity and roundness are due to the irregularity of the perimeter of the images.

3.1.2. Comparison of Vitis vinifera Cultivars

Table 2 presents the mean values of the morphometric magnitudes measured in six cultivars of V. vinifera ssp. vinifera.
Three different groups of increasing seed area include: (1) Cercial, (2) Carignano, and (3) Malvasía and Morenillo. Camarate and Meserguera are of intermediate size between Cercial and Carignano. Aspect ratio is smaller in Meserguera, then Malvasía, Cercial and Carignano. Morenillo and Camarate have intermediate values between Malvasía and Cercial. When the cultivars are classified by their values of roundness, the order is inverse to the classification by aspect ratio. Smaller differences between circularity and roundness in some cultivars are due to the irregularity of the perimeter of the seed images.

3.2. Morphological Description of Vitis Species and Cultivars by Similarity with Geometric Models. Values of J Index

3.2.1. Comparison of Vitis Species and Subspecies

The seeds of V. amurensis, V. labrusca and V. rupestris adjusted better to M1 than the seeds of V. vinifera ssp. sylvestris and Vitis vinifera ssp. vinifera. V. amurensis and V. rupestris adjusted better to M3 than the other species, with values of J index of 90.6 and 90.0, respectively (Table 3; Figure 5). Seeds of V. vinifera ssp. sylvestris and V. vinifera ssp. vinifera adjusted better to M6 and M7 than the seeds of the other species. V. vinifera ssp. sylvestris gave higher values than V. vinifera ssp. vinifera with M3, while the reverse was observed with M6 (Table 3; Figure 5).

3.2.2. Comparison of Vitis vinifera Cultivars

In general, the seeds of all cultivars of V. vinifera ssp. vinifera tested adjusted better to Models 5, 6 and 7 than to Models 1, 2, 3 or 4 (not shown). Model 5, the elongated heart curve, gave the highest values of J index with Meserguera (Table 4, Figure 6). The Fibonnacci’s pear, M6, gave similar high values with all cultivars tested, being the model that better adjusted the shape of the seeds of Carignano (Table 4, Figure 6). Differences with M7 were observed between Carignano and the other cultivars, with lower values of J index in the former (Table 4, Figure 6).

3.3. Seed Size and Shape of Cissus and Parthenocissus, Two Relatives of Vitis in the Vitaceae

C. verticillata seeds are smaller and more elongated than P. tricuspidata, having lower values of circularity (C) and roundness (R) (Table 5; Figure 7 and Figure 8). Seeds of both C. verticillata and P. tricuspidata are contained in berry fruits. While in C. verticillata there is only one seed per fruit, in P. tricuspidata the number of seeds oscilates between one and three. Figure 8 contains representative images of seeds obtained from berries having one, two and three seeds obtained from the same plant.
Seeds of C. verticillata adjust well to M4 (mean J index values = 91.2 with N = 28), while seeds of P. tricuspidata adjust to M2 with different values of J index, depending on the number of seeds per fruit (Table 6, Figure 7).

4. Discussion

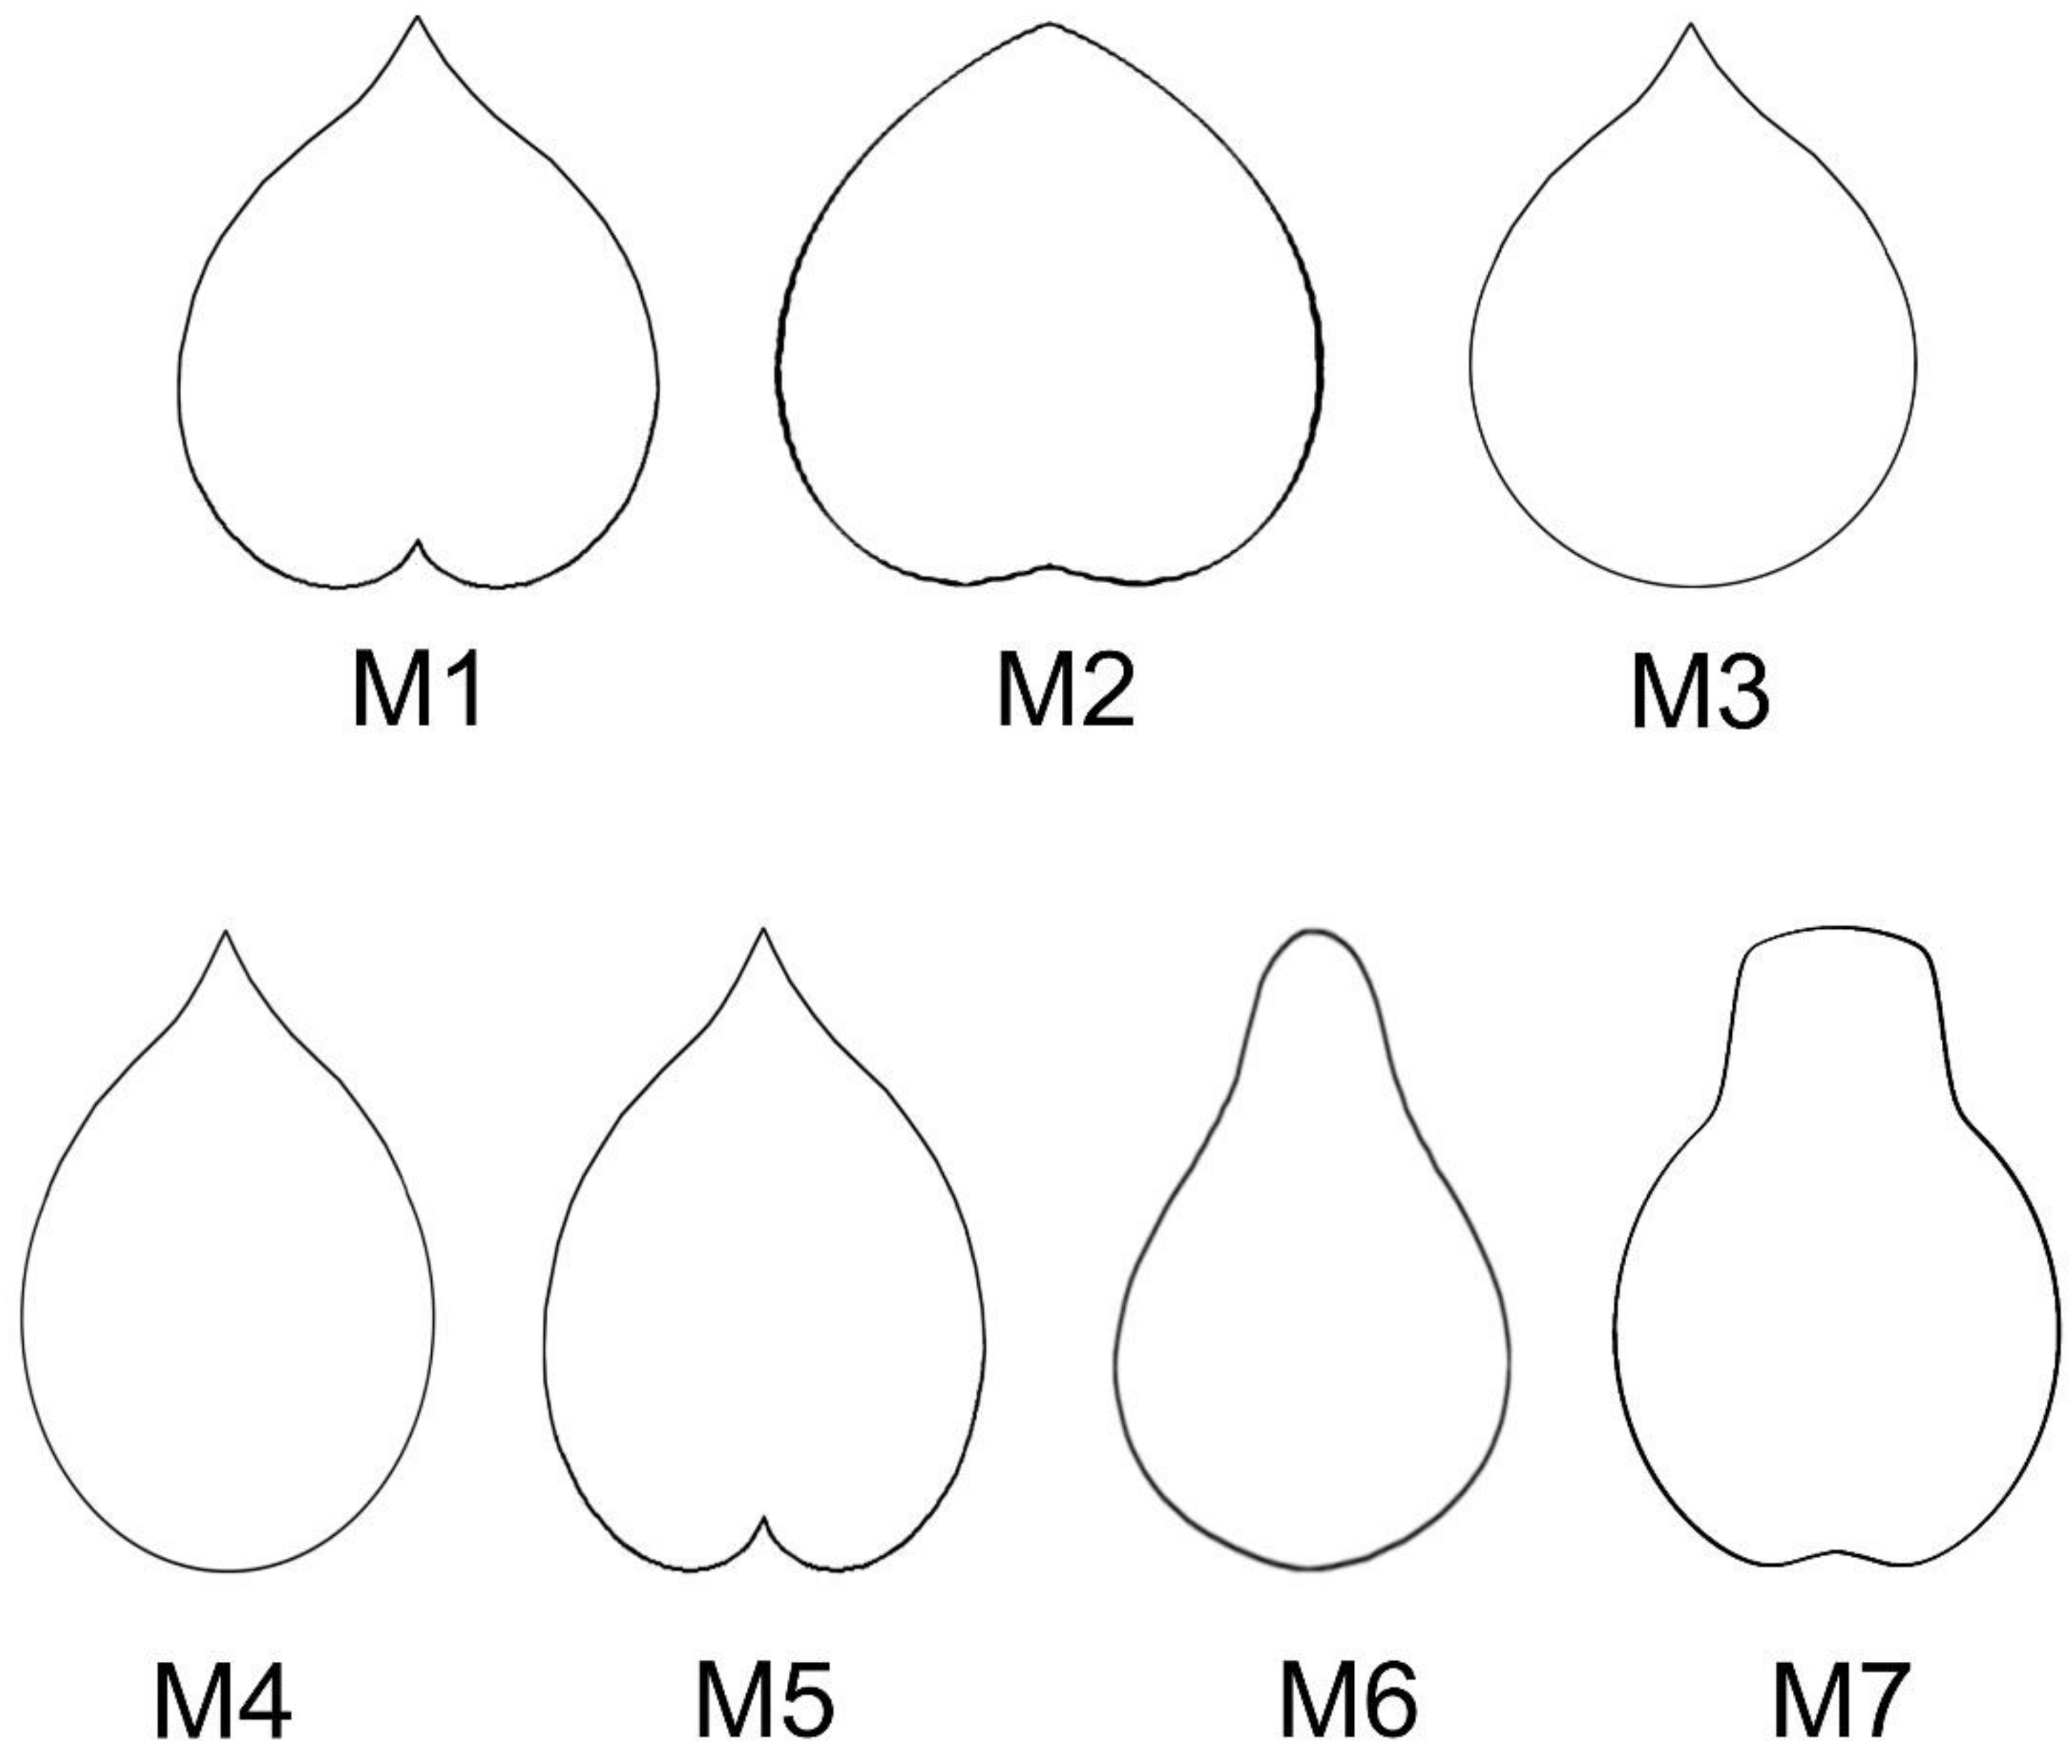
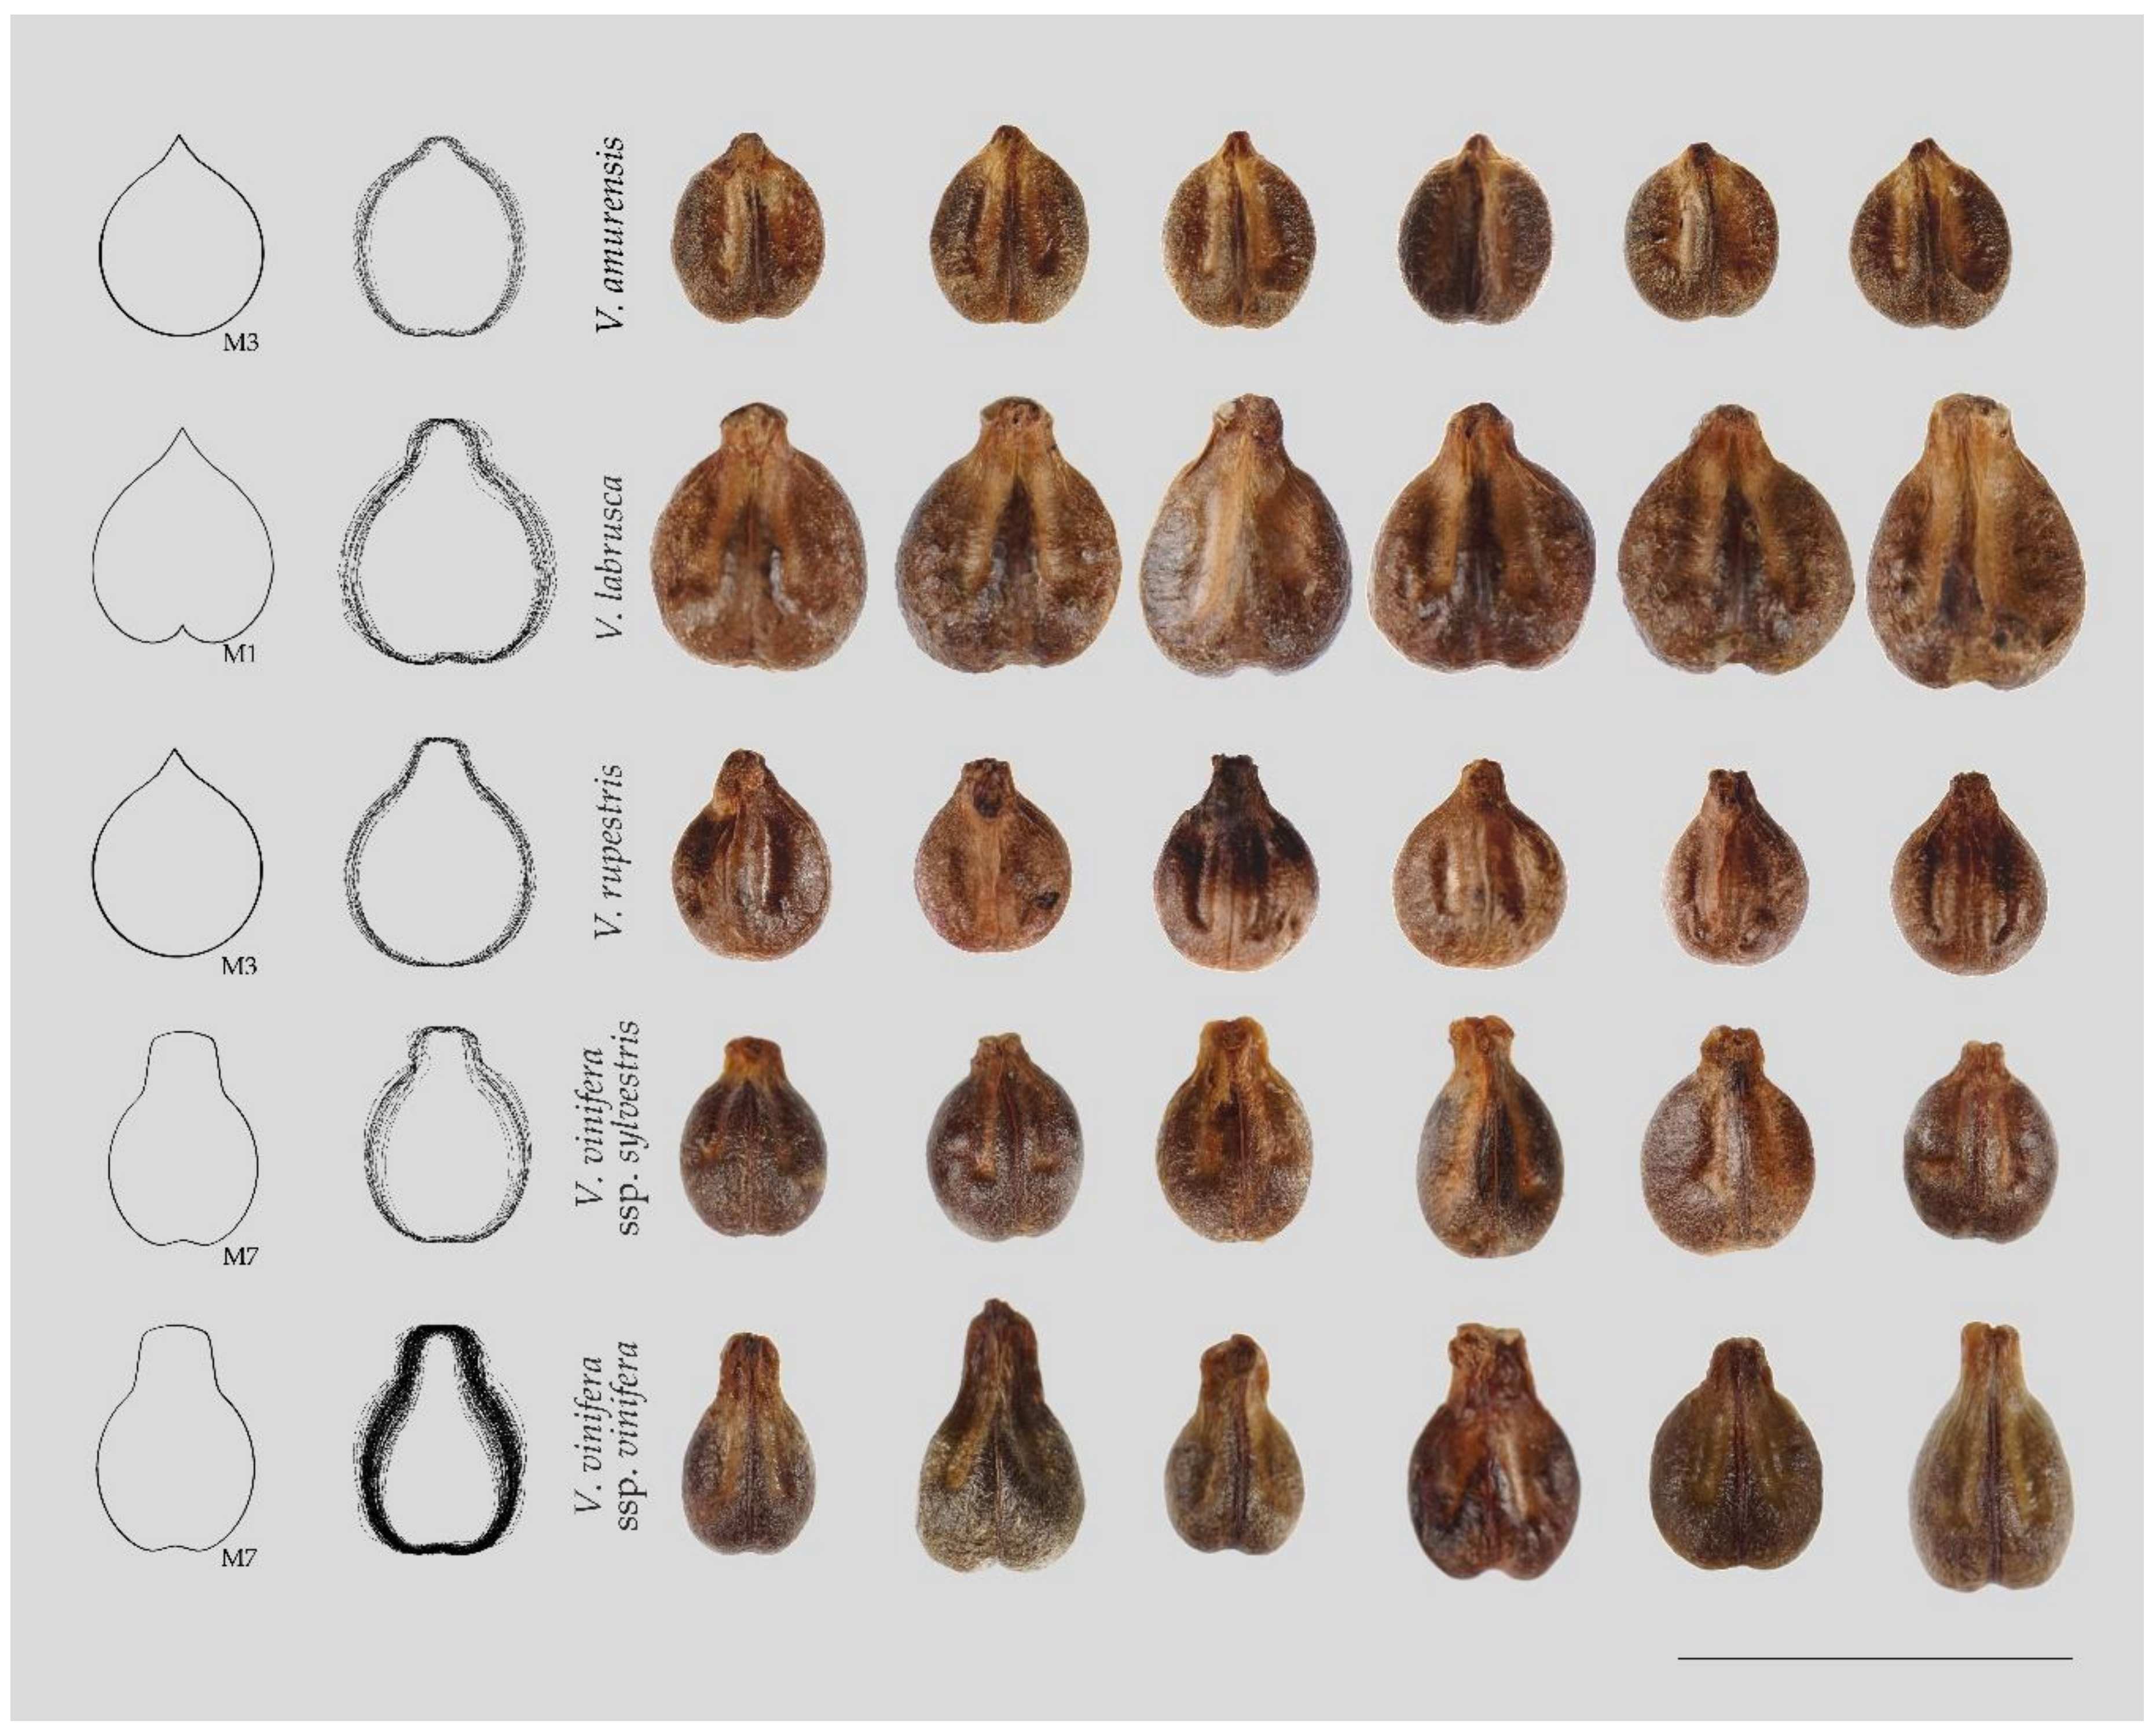
Seven geometric models have been described for the first time and applied to the morphological description of seeds in the Vitaceae. M1, a heart curve defined by Weinstein [31], is useful for the quantification of seed shape in species of Vitis and for the differentiation between the species V. amurensis, V. labrusca and V. rupestris, in one side, and V. vinifera, in the other. M1 adjusts better to seeds of V. amurensis, V. labrusca and V. rupestris than V. vinifera. M6, the Fibonacci’s pear, adjusts well to seeds of V. vinifera, in general, and better to V. vinifera ssp. vinifera than to V. vinifera ssp. sylvestris. This way, V. vinifera ssp. sylvestris can be differentiated from V. vinifera ssp. 
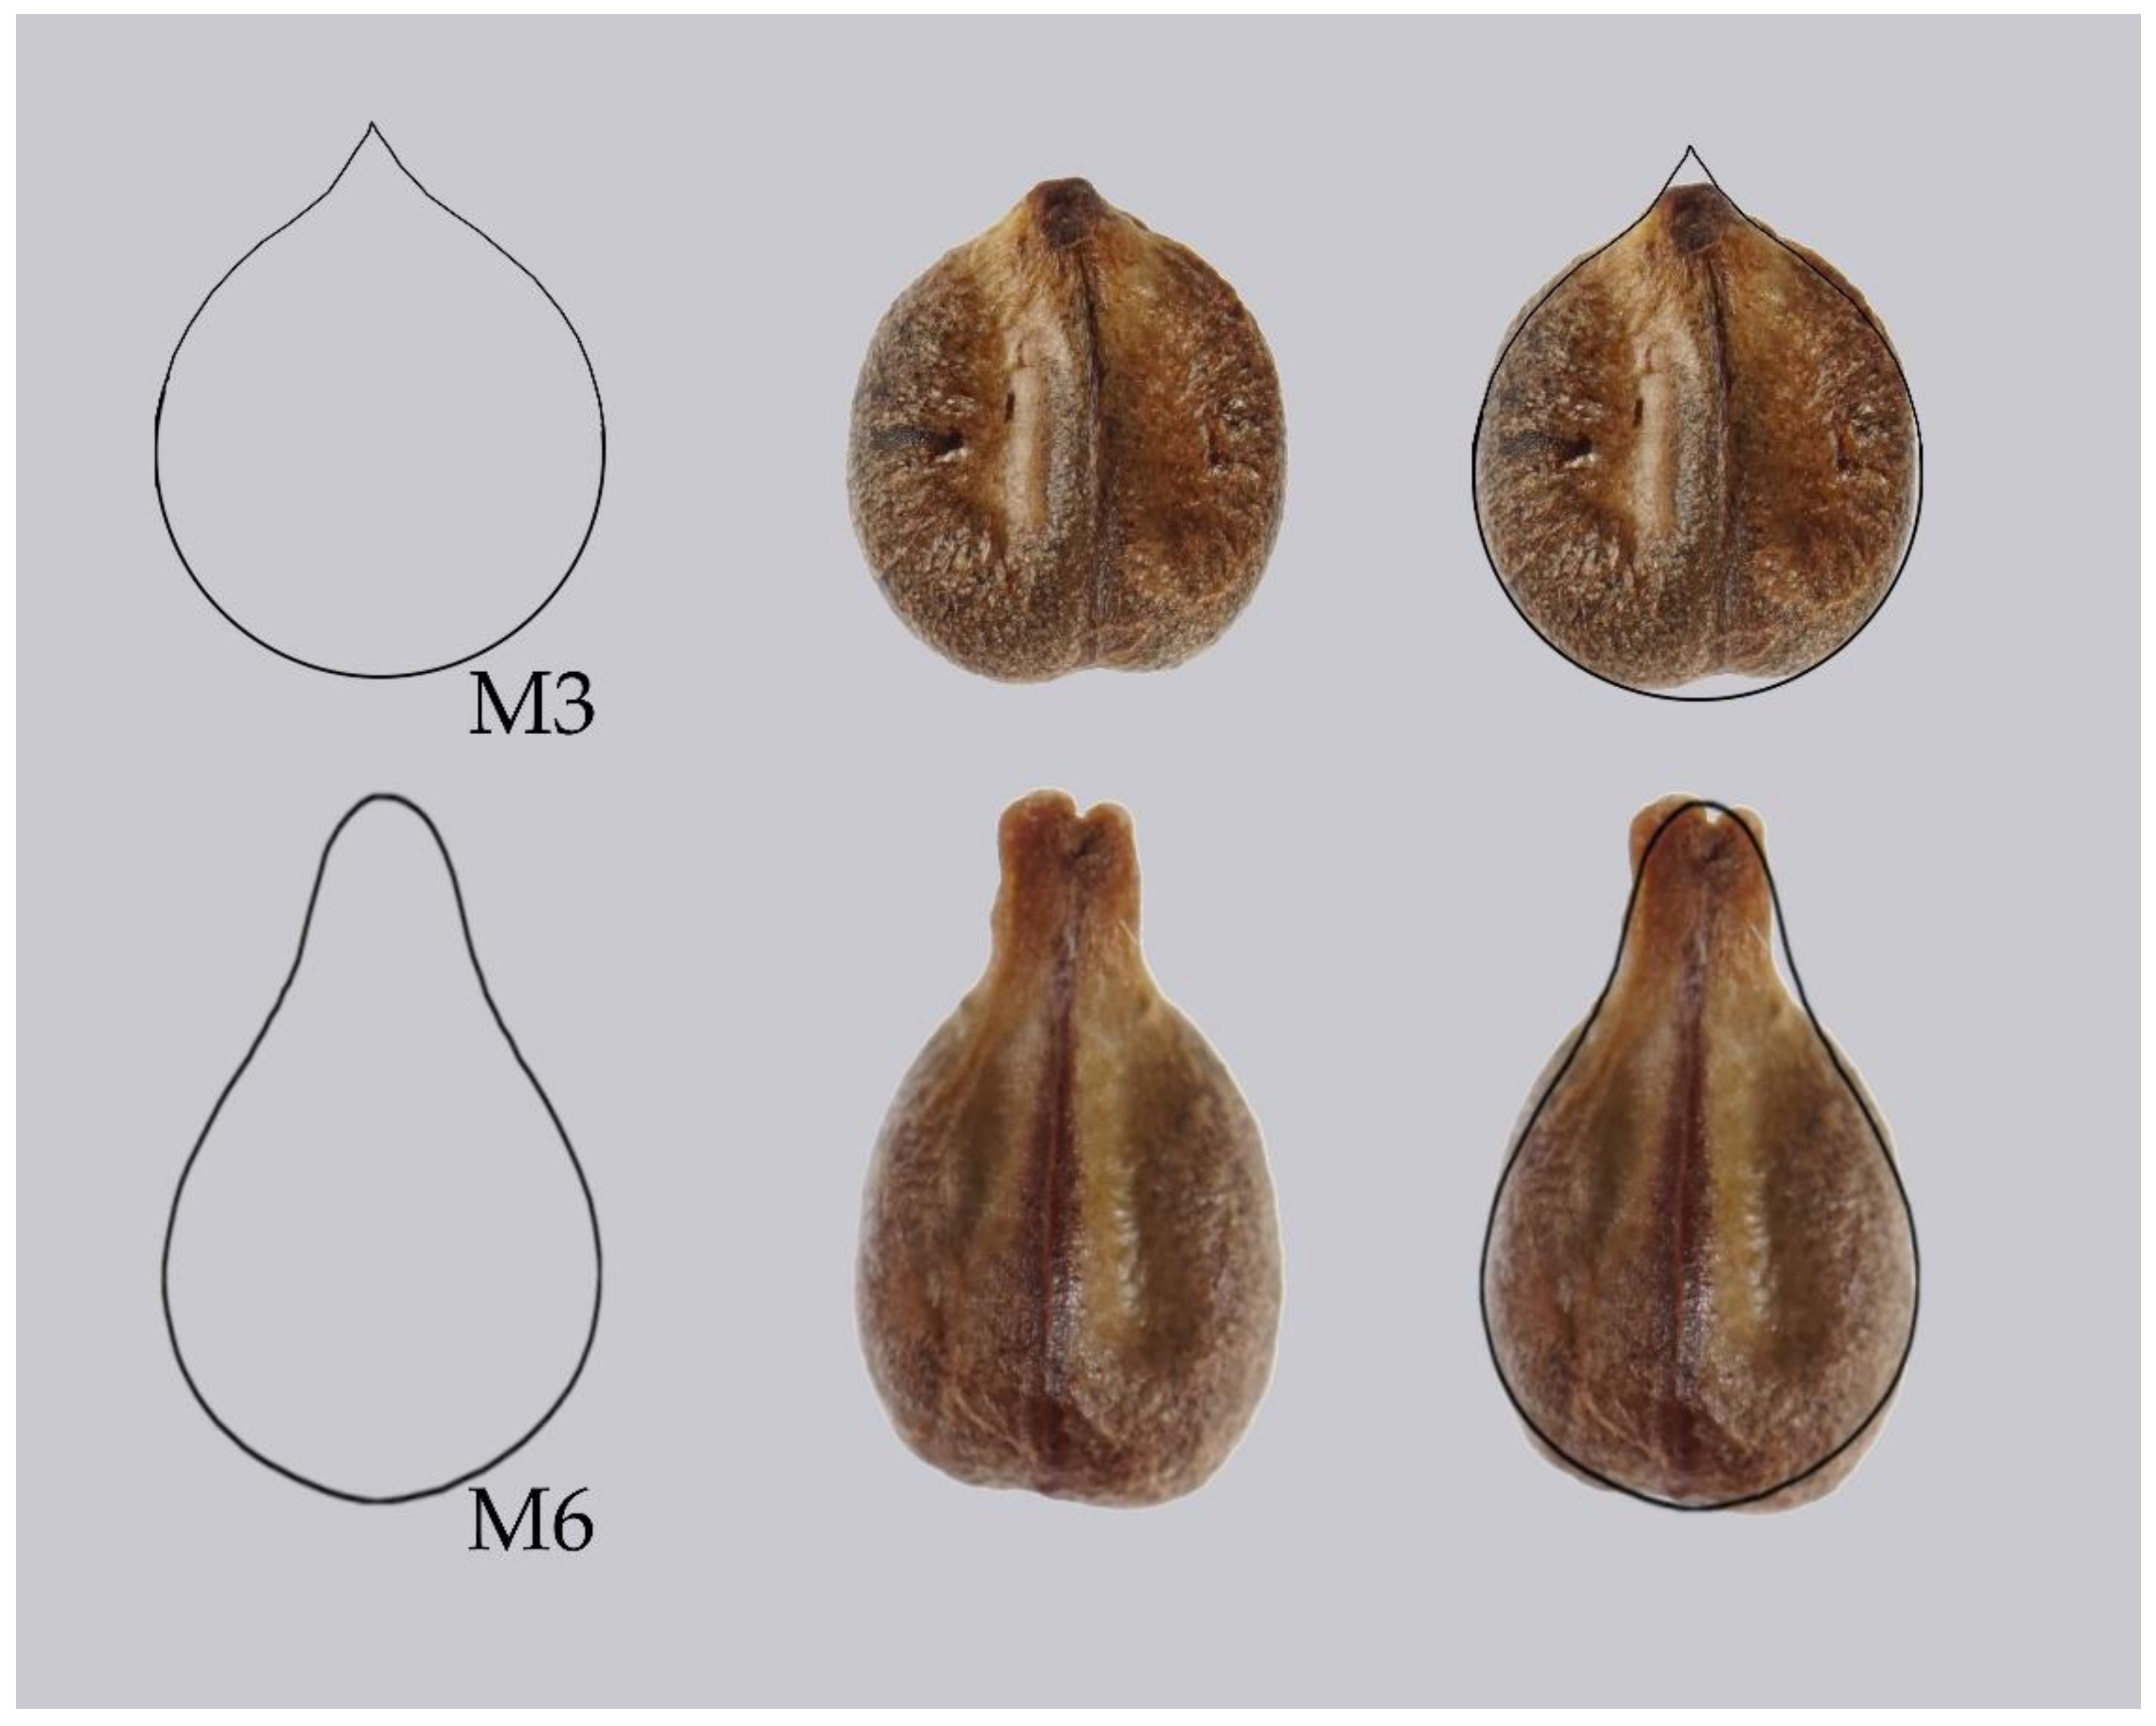
vinifera, because the values of J index obtained with M6 (the Fibonacci’s pear) are higher in the former. The water drop, a rounded heart curve (M3) corresponds better to the rounded seeds of species V. amurensis and V. rupestris than those of V. labrusca, also giving high values of J index with the seeds of Vitis vinifera ssp. sylvestris. Thus, M3 permits to differentiate between V. vinifera ssp. vinifera and V. vinifera ssp. sylvestris, the former giving higher values of J index with this model. The combination of M3, M6 and M7 is useful for the differentiation of V. vinifera ssp. sylvestris from other species of Vitis.
The models proposed are related to previous seed shape descriptions of the Euvitis and Muscadinia taxonomic groups. Models 1, 2 and 3 resemble the Euvitis type, while Models 4, 5, 6 and 7 fit better the Muscadinia shape [9,
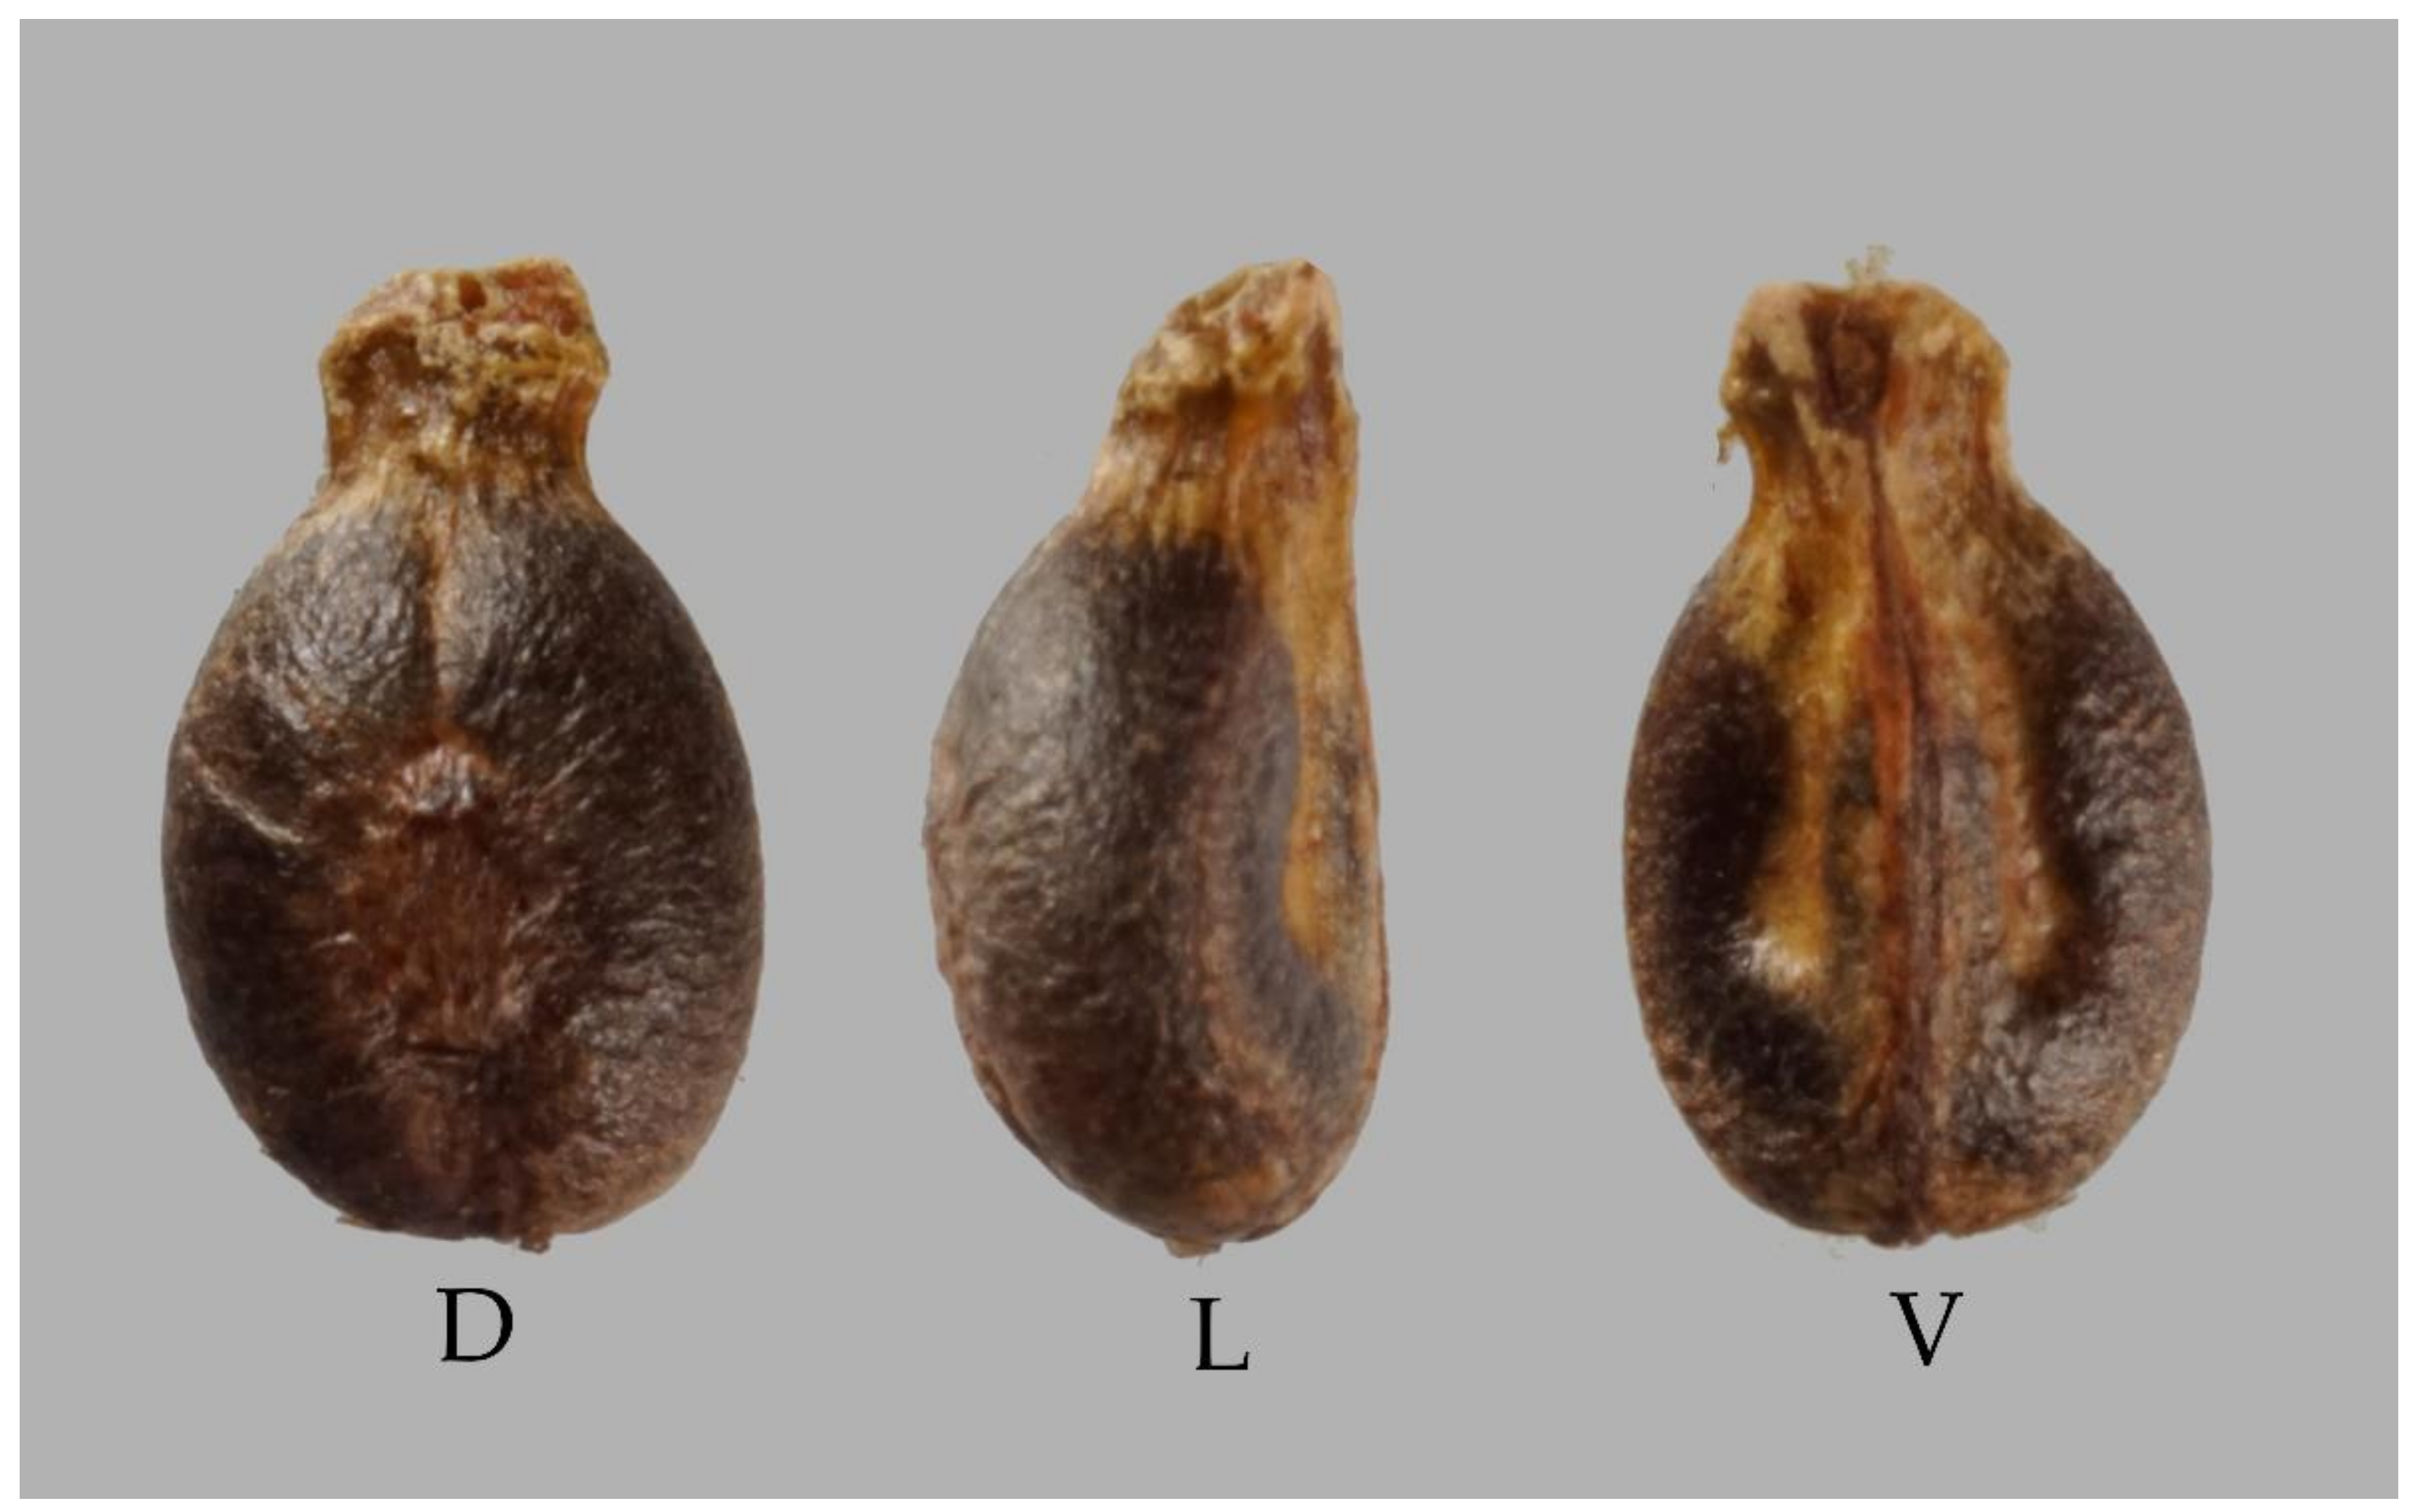
10]. The seeds of wild species are smaller, robust and with a rounded outline resulting in a heart-like shape, often termed as “cordate”, with short stalks and a flat ventral side with sharp angles and a strongly developed chalaza, while those of cultivars are large, elongated, oval or pyriform, with an elongated stalk [9].
The identification of geometric curves resembling the outline of seed images complements the results of morphometric analysis and allows more exactitude in the description of species and cultivars and for their comparison. Among the two subspecies of grape, subspecies sylvestris adjusts better to M3, while subspecies vinifera adjusts better to M6, thus concerning seed shape, V. vinifera ssp. sylvestris resembles more other species of Vitis than V. vinifera ssp. vinifera. This demonstrates a great capacity of variation in the shape of seeds of cultivars, where significant changes in seed shape are due to selection during cultivation [28].
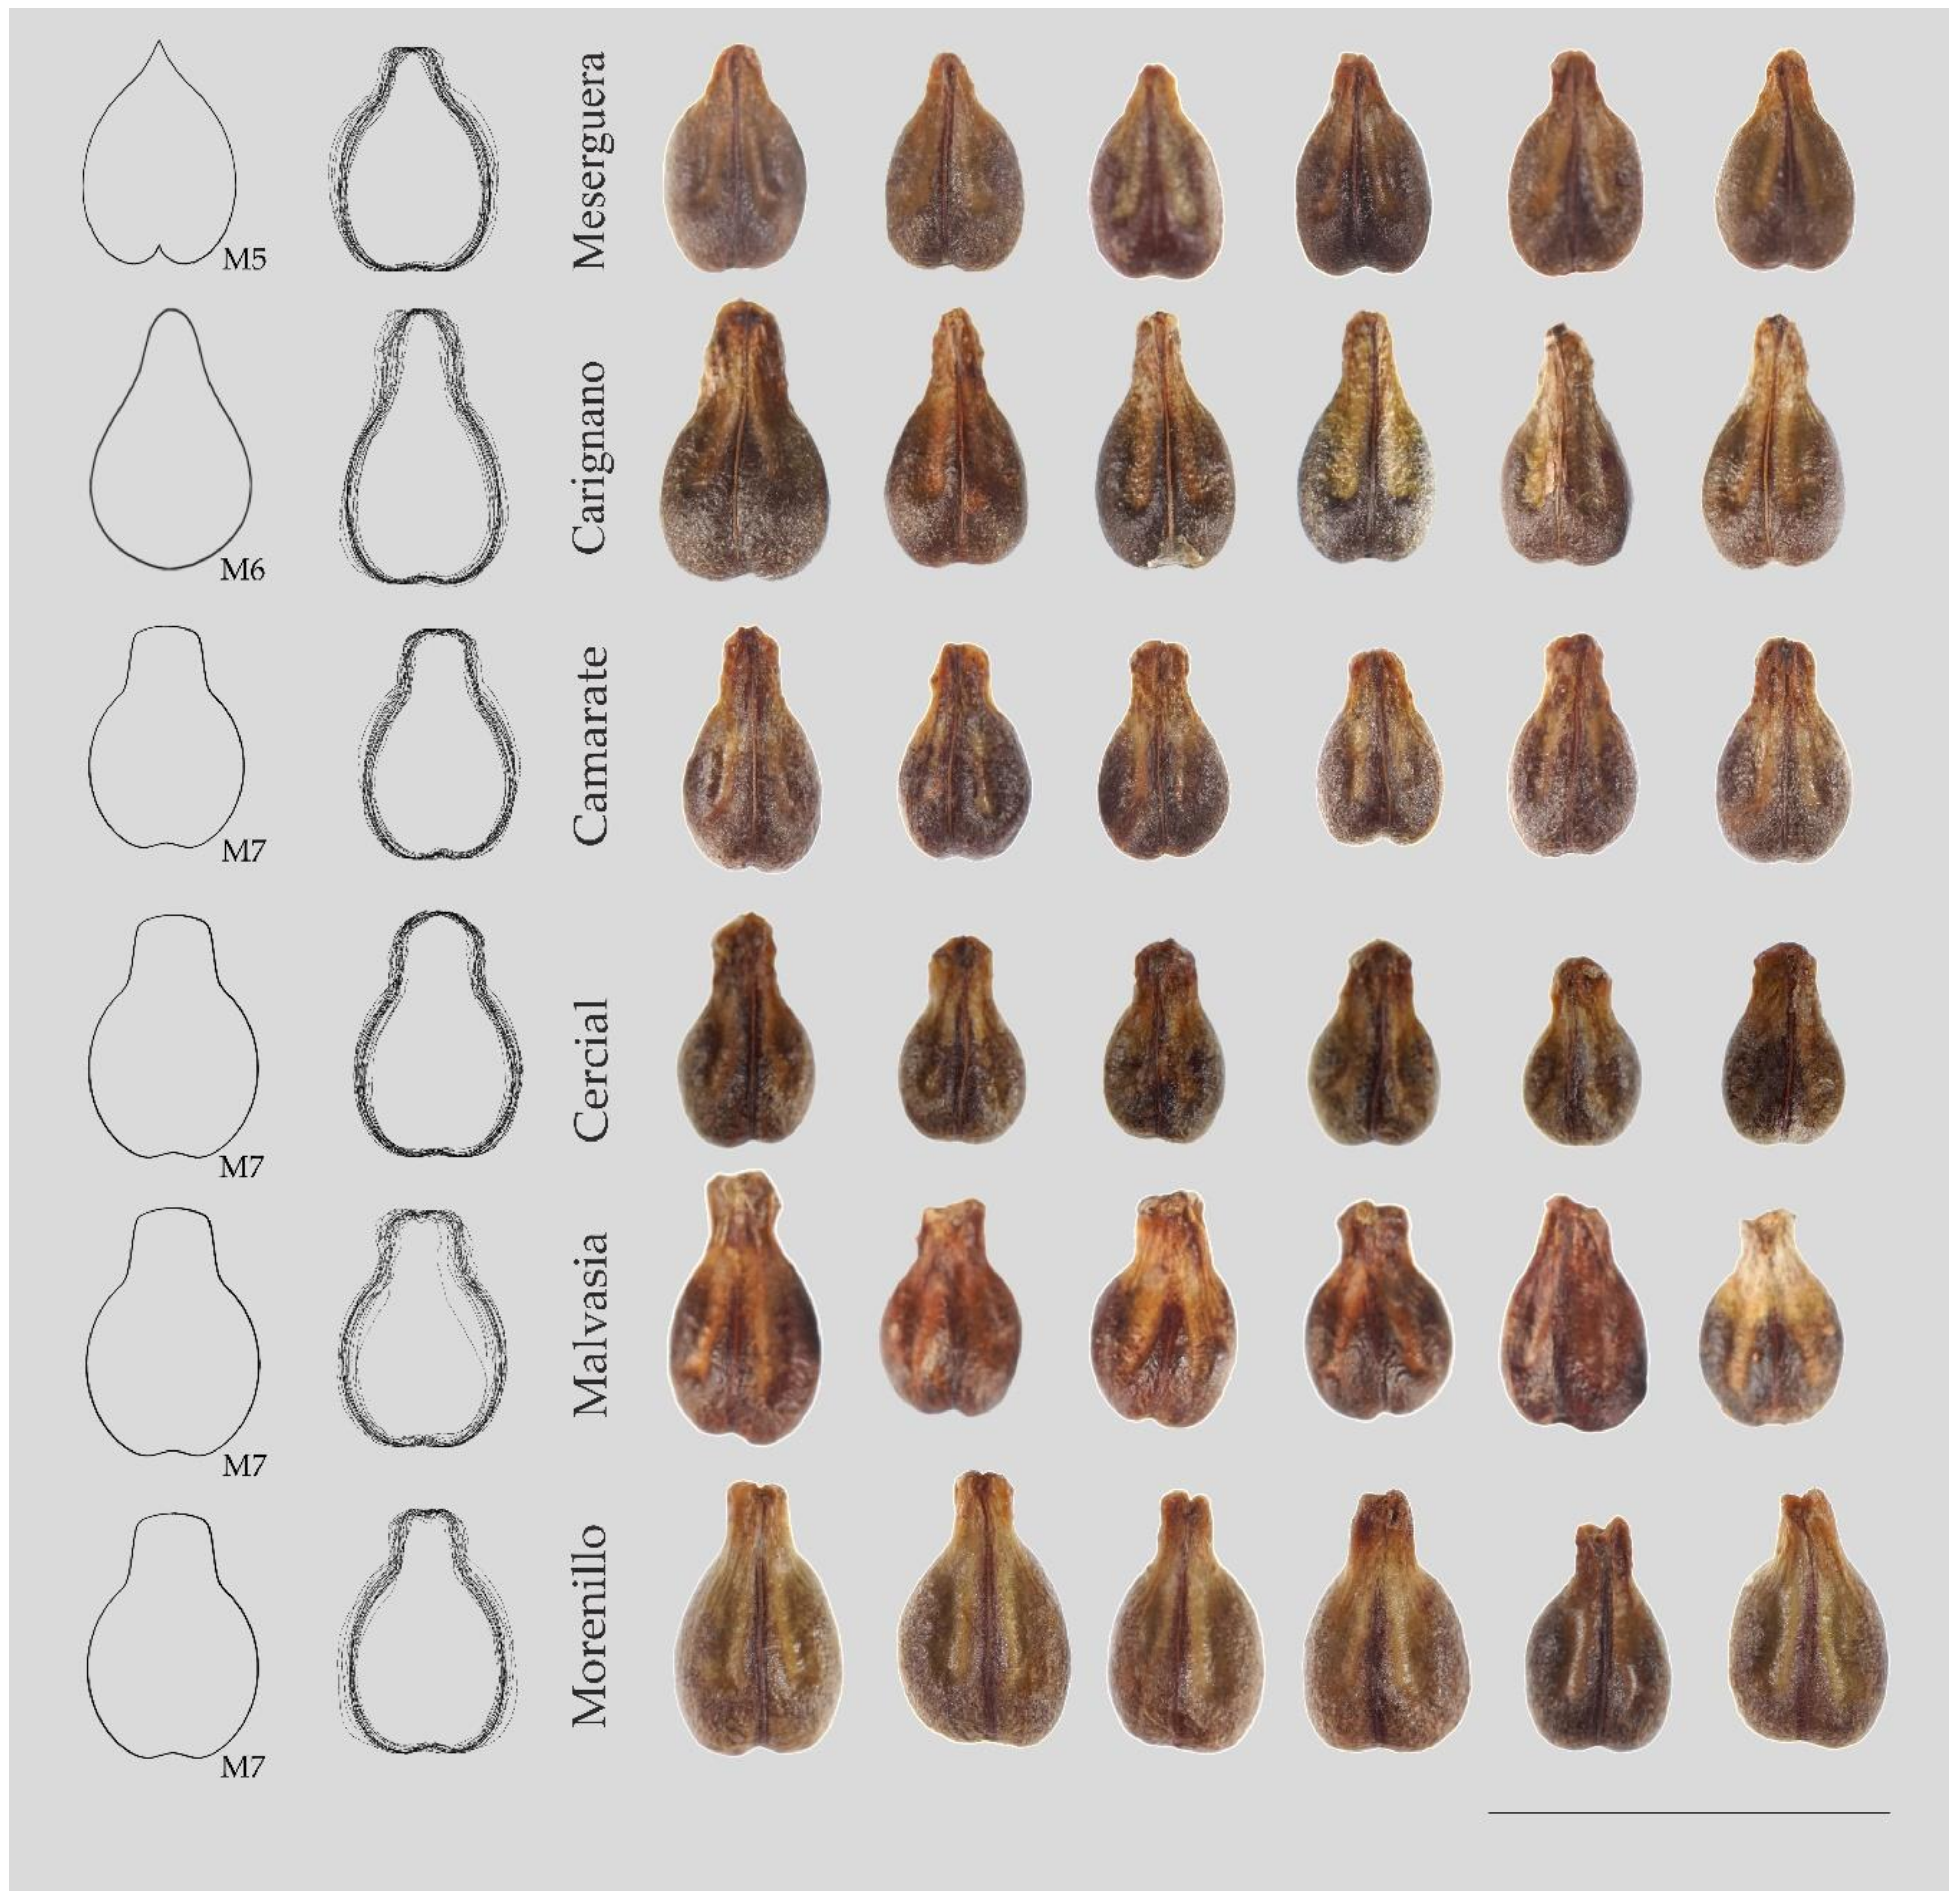
Concerning cultivars, Meserguera gave higher values with the elongated heart curve (M5), while Malvasia seeds adjusted better to M7. New models based on geometrical curves can be useful for the description of seed shape in other cultivars.
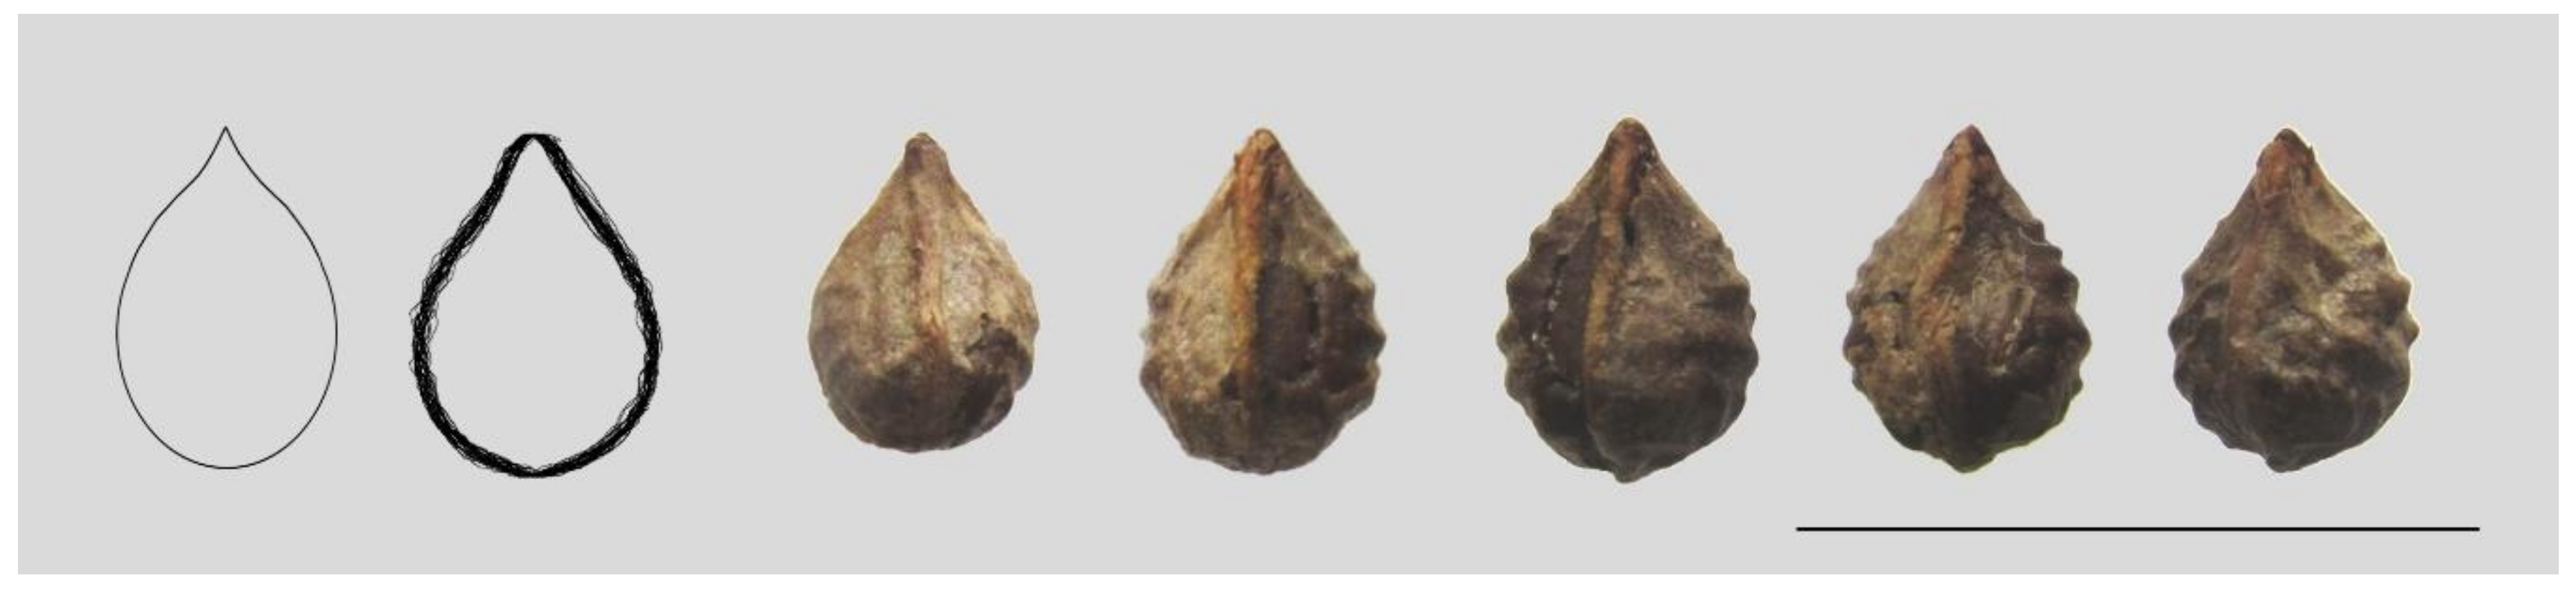
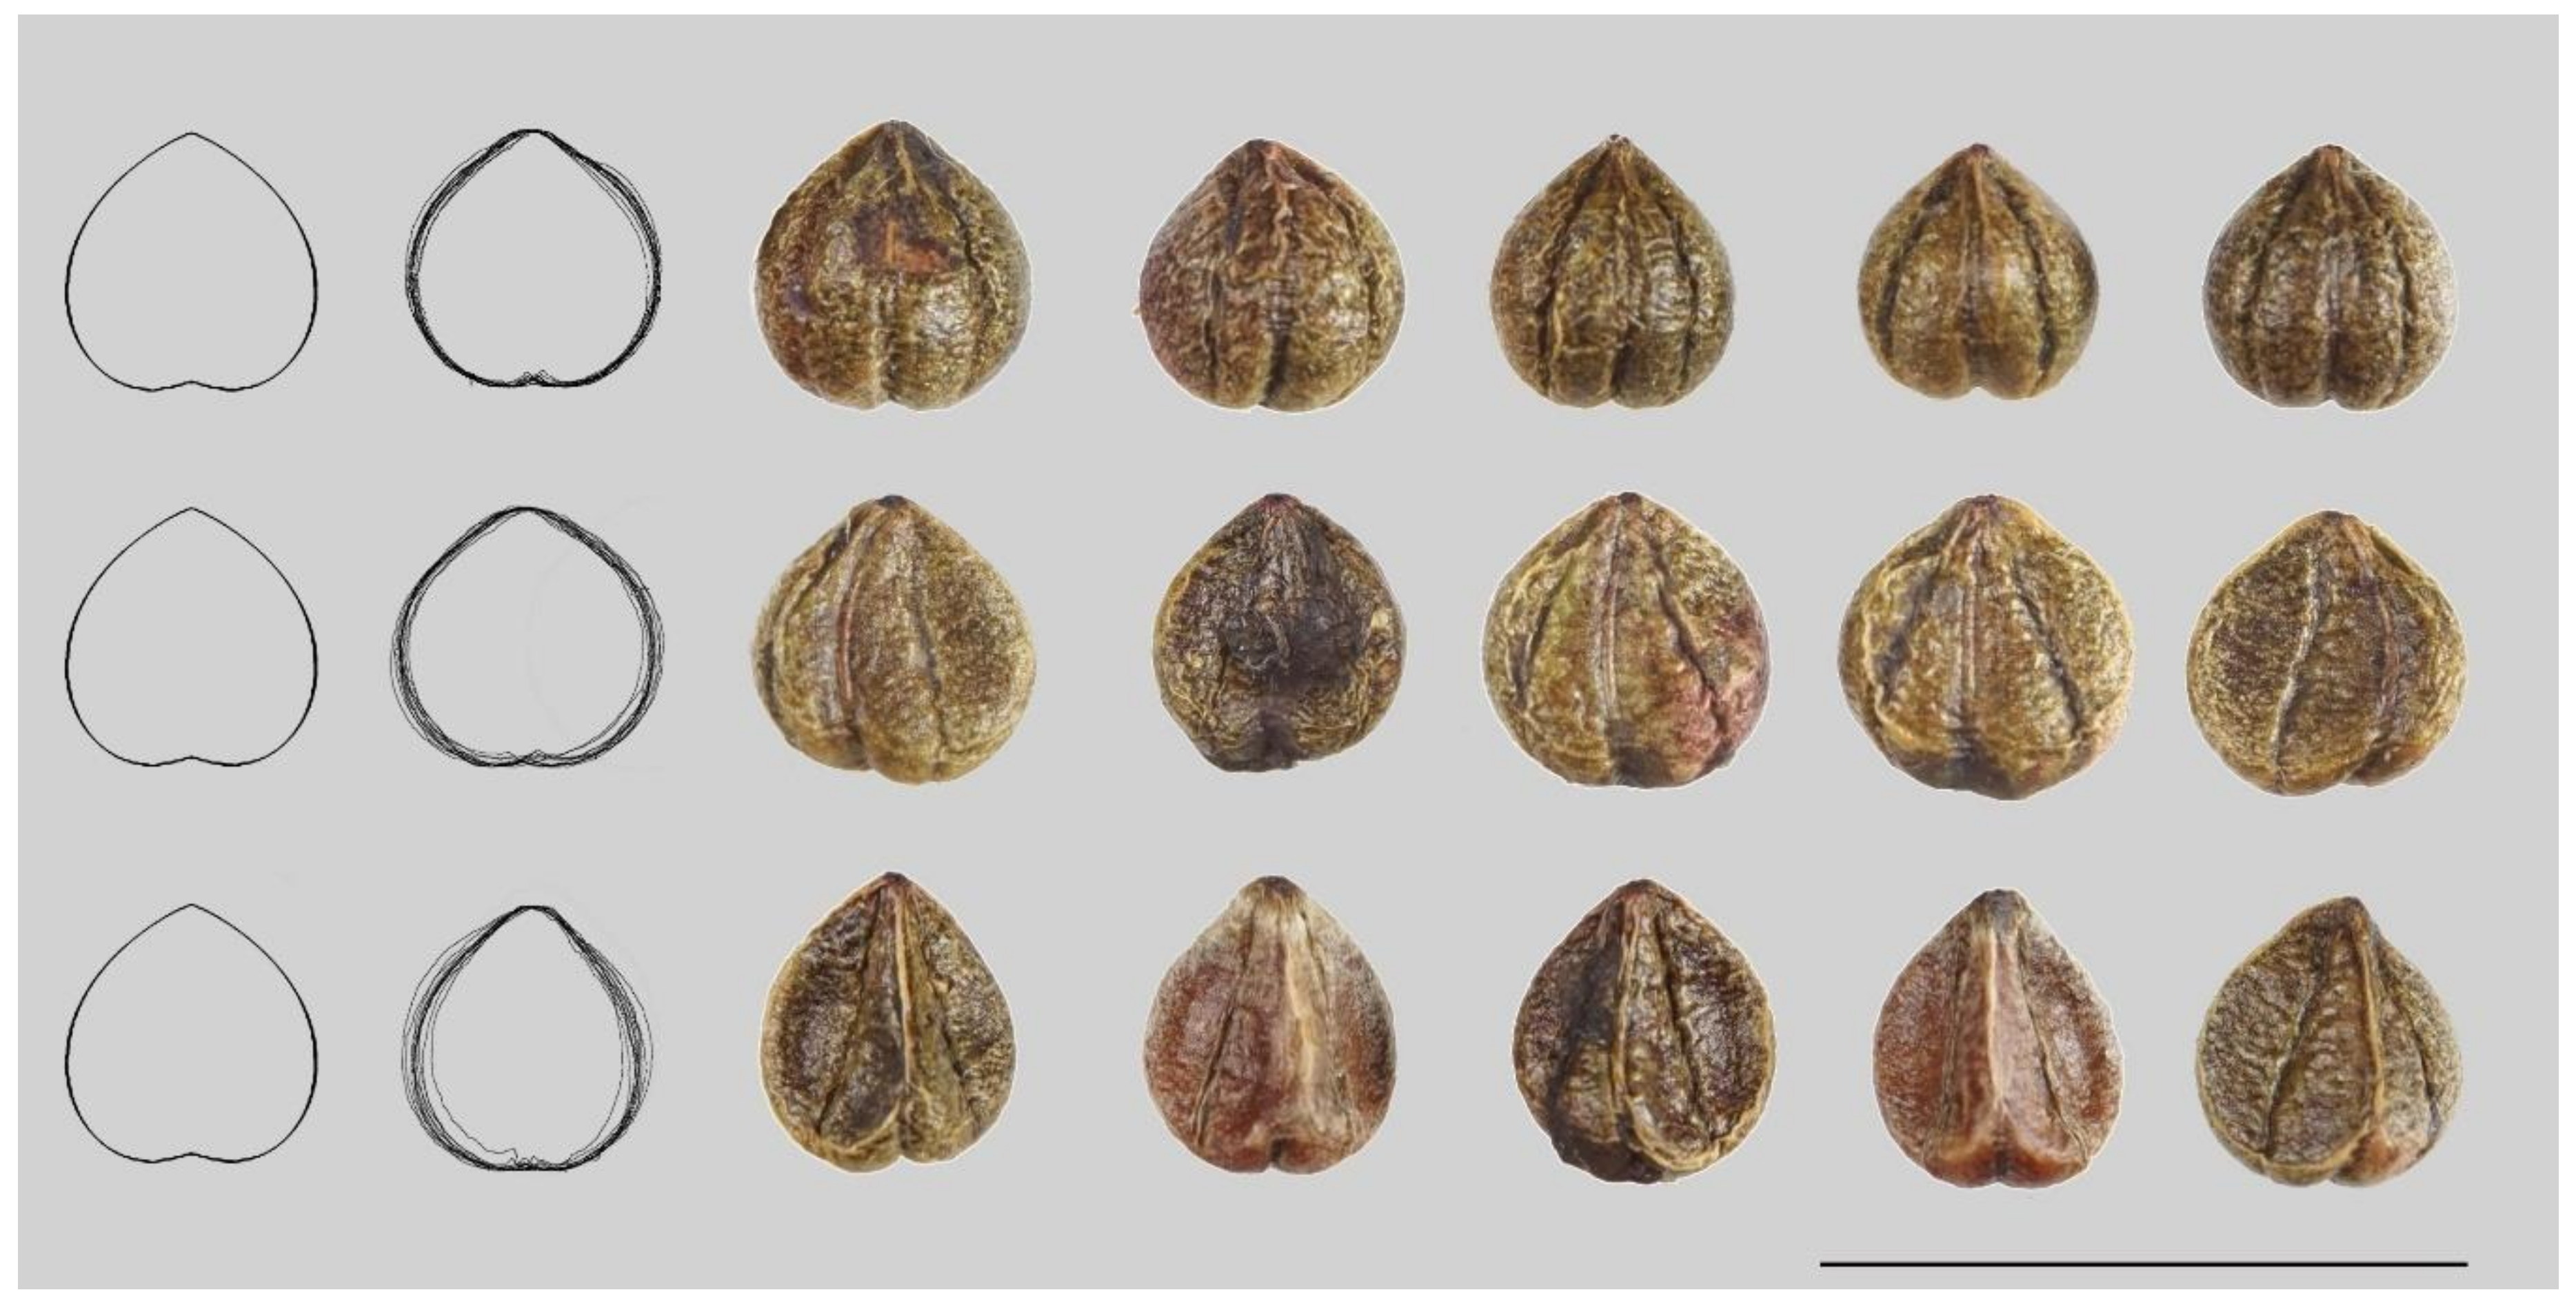
Seeds of Cissus verticillata adjust well to M2, while seeds of the species Parthenocissus tricuspidata adjust better to M4. The quantification of seed shape with M4 shows differences between seeds depending on the number of seeds per fruit. Fruits with one or two seeds have their seeds more rounded and with higher values of J index than the seeds from fruits with three seeds per fruit.
Both C. verticillata and P. tricuspidata seeds resemble more the seeds of V. amurensis, V. labrusca and V. rupestris than those of cultivars of V. vinifera, suggesting that the primitive seed type, associated with a reduced number of seed per fruit, resembles more Model 1.
The seeds in the Vitaceae present a very peculiar shape, for which there is no adaptation to a single geometric model, like the ellipse, the ovoid or the cardioid [30,32], but to more complex figures. This is in contrast with other families, where the ellipse, the ovoid or the cardioid are the models defining seed shape for most species and genera [22,23,24,25,26,27,28,29,30,32].
The magnitudes used in morphology have different information about the shape of a plane figure. Magnitudes such as the area, perimeter, length or width do not give much information on shape, and thus, are of little value on their own to discriminate between cultivars or species. Other measures, such as circularity or roundness are more informative when they are close to the unity, but their usefulness depends on the similarity of the figure with the circle. If the figure is different to a circle, low values are of no informative value. In contrast, J index compares the image of a plane figure with a similar geometric figure selected as a model. In the case of grape seeds, J index is a way to provide valuable information in a single measure and, in consequence, useful in ampelography studies.
The current edition of the OIV Descriptor List for Grape Varieties and Vitis species [39] concerning seeds includes only three variables: length, weight and the presence of transversal ridges on dorsal side of seeds. J index is a new way of describing seeds that allows one to relate the variety studied to its genetic origin. The longer seed varieties are of eastern origin and generally table grapes, as seen in the descriptor, and the varieties of western origin are shorter and rounded linked to the origin of the domestication of most wild vines, as, for example, varieties of French and Spanish origin [40,41]. The work described in this article allows an approximation to elucidate if the variety is of eastern or western origin. Intermediate varieties such as Pinot and Merlot are of mixed origin. Further study of Spanish varieties where there is an Arabic influence would allow us to test this methodology.
The description of seed images by comparison with geometric figures will contribute to the validation of results obtained by automated artificial vision methods, improving the description and identification of species and varieties. It is a new, low-cost and relatively simple technique that can help growers, producers or breeders in seed identification.

5. Conclusions

New geometric models for seed shape quantification in the Vitaceae are described. Model 1, a heart curve, adjusts well the shape of the seeds of species V. amurensis, V. labrusca and V. rupestris. Model 2, a rounded heart curve, defines well the shape of the seeds of P. tricuspidata. Model 3, the water drop, adjusts well the shape of the seeds of V. amurensis and V. rupestris. Model 4 gives a good adjustment with the seeds of C. verticillata. A combination of the models is useful for the differentiation of the seeds of cultivars of V. vinifera, ssp. vinifera. Geometric models provide a new method for the description and classification of grape species and cultivars. Future studies will be directed to the identification of cultivar-specific models.

Author Contributions

Conceptualization, Á.T. and E.C.; Data curation, J.J.M.-G.; Formal analysis, J.J.M.-G., Á.T. and E.C.; Investigation, J.J.M.-G., D.G.D.P., M.U., G.B., F.C.S.D.S., Á.T. and E.C.; Methodology, J.J.M.-G., Á.T. and E.C.; Software, J.J.M.-G. and Á.T.; Supervision, E.C.; Validation, J.J.M.-G., D.G.D.P., M.U., G.B., F.C.S.D.S., Á.T. and E.C.; Writing—original draft, J.J.M.-G., E.C.; Writing—review and editing, J.J.M.-G., D.G.D.P., M.U., G.B., F.C.S.D.S., Á.T. and E.C. All authors have read and agreed to the published version of the manuscript.

Funding

This research was funded by Universidad de Salamanca (Programa XIII para la financiación de grupos GIR).

Conflicts of Interest

The authors declare no conflict of interest.

References

  1. Jacquat, C.H.; Martinoli, D. Vitis vinifera L.: Wild or cultivated? Study of the grape pips found at Petra, Jordan; 150 B.C.-A.D. 40. Veget. Hist. Archaeobot. 1999, 8, 25–30. [Google Scholar] [CrossRef]
  2. Zohary, D. The domestication of the grapevine Vitis vinifera L. in the Near East. In The Origins and Ancient history of Wine; McGovern, P.E., Fleming, S.J., Katz, S.H., Eds.; Gordon and Breach: Amsterdam, The Netherlands, 1995; pp. 23–30. [Google Scholar]
  3. Zohary, D.; Hopf, M.; Weiss, E. Domestication of plants in the old world. The Origin and Spread of Cultivated Plants in West Asia, Europe and the Nile Valley; Oxford University Press: Oxford, UK, 2012. [Google Scholar]
  4. Olmo, H. The origin and domestication of the Vinifera grape. In The Origins and Ancient History of Wine; McGovern, P.E., Fleming, S.J., Katz, S.H., Eds.; Gordon and Breach: Amsterdam, The Netherlands, 1995; pp. 31–43. [Google Scholar]
  5. Cunha, J.; Baleiras-Couto, M.; Cunha, J.P.; Banza, J.; Soveral, A.; Carneiro, L.C.; Eiras-Dias, J.E. Characterization of Portuguese populations of Vitis vinifera L. ssp. sylvestris (Gmelin) Hegi. Genet. Resour. Crop Evol. 2007, 54, 981–988. [Google Scholar] [CrossRef]
  6. Arroyo-García, R.; Lefort, F.; De Andrés, M.; Ibáñez, J.; Borrego, J.; Cabello, F.; Martínez-Zapater, J.M. Haplotypic polymorphisms for chloroplast microsatellites analysis in Vitis. Genome 2002, 45, 1142–1149. [Google Scholar] [CrossRef] [PubMed] [Green Version]
  7. Zecca, G.; De Mattia, F.; Lovicu, G.; Labra, M.; Sala, F.; Grassi, F. Wild grapevine: Silvestris, hybrids or cultivars that escaped from vineyards? Molecular evidence in Sardinia. Plant Biol. 2010, 12, 558–562. [Google Scholar] [CrossRef]
  8. Arroyo-García, R.; Ruiz-García, L.; Bolling, L.; Ocete, R.; López, M.A.; Arnold, C.; Ergul, A.; Soylemezoglu, G.; Uzun, H.I.; Cabello, F.; et al. Multiple origins of cultivated grapevine (Vitis vinifera L. ssp. sativa) based on chloroplast DNA polymorphisms. Mol. Ecol. 2006, 15, 707–714. [Google Scholar]
  9. Rivera, D.; Miralles, B.; Obón, C.; Carreño, E.; Palazón, J.A. Multivariate analysis of Vitis subgenus Vitis seed morphology. Vitis 2007, 46, 158–167. [Google Scholar]
  10. Planchon, J.E. Ampelideae, Monographie des Ampélidées Vraies. In Monographiae Phanerogamarum; De Candolle, A.P., Ed.; Treuttel et Würtz: Paris, France, 1887; Volume 5, pp. 305–368. [Google Scholar]
  11. Viala, P.; Péchoutre, P. Morphologie externe de la graine In Ampélographie; Viala, P., Vermorel, V., Eds.; Masson et Cie.: Paris, France, 1910; pp. 156–166. [Google Scholar]
  12. Stummer, A. Zur Urgeschichte der Rebe und des Weinbaues. Mitt. Anthr. Ges. Wien 1911, 41, 283–296. [Google Scholar]
  13. Mangafa, M.; Kotsakis, K. A new method for the identification of wild and cultivated charred grape seeds. J. Archaeol. Sci. 1996, 23, 409–418. [Google Scholar] [CrossRef]
  14. Orrú, M.; Grillo, O.; Lovicu, G.; Venora, G.; Bacchetta, G. Morphological characterisation of Vitis vinifera L. seeds by image analysis and comparison with archaeological remains. Veget. Hist. Archaeobot. 2012, 22, 231–242. [Google Scholar] [CrossRef]
  15. Orrú, M.; Grillo, O.; Venora, G.; Bacchetta, G. Seed morpho-colorimetric analysis by computer vision: A helpful tool to identify grapevine (Vitis vinifera L.) cultivars. Grape Wine Res. 2015, 21, 508–519. [Google Scholar] [CrossRef]
  16. Helpful tool to identify grapevine (Vitis vinifera L.) cultivars. Aust. J. Grape. Wine Res. 2015, 21, 508–519.
  17. Rovner, I.; Gyulai, F. Computer-assisted morphometry: A new method for assessing and distinguishing morphological variation in wild and domestic seed populations. Econ. Bot. 2007, 61, 154–172. [Google Scholar] [CrossRef]
  18. Sonka, M.; Hlavac, V.; Boyle, R. Image Processing Analysis and Machine Vision, 3rd ed.; Thomson Learning: Toronto, ON, Canada, 2008; 829p. [Google Scholar]
  19. Ucchesu, M.; Orrú, M.; Grillo, O.; Venora, G.; Usai, A.; Serreli, P.F.; Bacchetta, G. Earliest evidence of a primitive cultivar of Vitis vinifera L. during the Bronze Age in Sardinia (Italy). Veget. Hist. Archaeobot. 2015, 24, 587–600. [Google Scholar] [CrossRef]
  20. Ucchesu, M.; Orrú, M.; Grillo, O.; Venora, G.; Paglietti, G.; Ardu, A.; Bacchetta, G. Predictive Method for Correct Identification of Archaeological Charred Grape Seeds: Support for Advances in Knowledge of Grape Domestication Process. PLoS ONE 2016, 11, e0149814. [Google Scholar] [CrossRef] [Green Version]
  21. Milanesi, C.; Costantini, L.; Firmati, M.; Antonucci, F.; Faleri, C.; Buracchi, A.; Cresti, M. Geometric morphometry and archaeobotany: Characterisation of grape seeds (Vitis vinifera L.) by analysis of form. Open Access Libr. J. 2014, 1, e634. [Google Scholar] [CrossRef]
  22. Mravcsik, Z.; Gyulai, F.; Vinogradov, S.; Emödi, A.; Rovner, I.; Gyulai, G. Digital seed morphometry for genotype identification case study of seeds of excavated (15th century Hungary) and current vine grape (Vitis v. vinifera) varieties. Acta Bot. Hunga. 2015, 57, 169–182. [Google Scholar] [CrossRef] [Green Version]
  23. Cervantes, E.; Martín, J.J.; Ardanuy, R.; de Diego, J.G.; Tocino, Á. Modeling the Arabidopsis seed shape by a cardioid: Efficacy of the adjustment with a scale change with factor equal to the Golden Ratio and analysis of seed shape in ethylene mutants. J. Plant. Physiol. 2010, 67, 408–410. [Google Scholar] [CrossRef]
  24. Cervantes, E.; Martín, J.J.; Chan, P.K.; Gresshoff, P.M.; Tocino, Á. Seed shape in model legumes: Approximation by a cardioid reveals differences in ethylene insensitive mutants of Lotus japonicus and Medicago truncatula. J. Plant. Physiol. 2012, 169, 1359–1365. [Google Scholar] [CrossRef] [Green Version]
  25. Saadaoui, E.; Martín, J.J.; Cervantes, E. Seed morphology in Tunisian wild populations of Capparis spinosa L. Acta Biol. Cracov. Ser. Bot. 2013, 55, 99–106. [Google Scholar] [CrossRef]
  26. Martín-Gómez, J.J.; Rewicz, A.; Cervantes, E. Seed Shape Diversity in families of the Order Ranunculales. Phytotaxa 2019, 425, 193–207. [Google Scholar] [CrossRef]
  27. Martín-Gómez, J.J.; del Pozo, D.G.; Cervantes, E. Seed shape quantification in the Malvaceae reveals cardioid-shaped seeds predominantly in herbs. Bot. Lith. 2019, 25, 21–31. [Google Scholar] [CrossRef] [Green Version]
  28. Cervantes, E.; Martín-Gómez, J.J. Seed shape quantification in the order Cucurbitales. Mod. Phytomorphol. 2018, 12, 1–13. [Google Scholar] [CrossRef]
  29. Martín-Gómez, J.J.; Saadaoui, E.; Cervantes, E. Seed Shape of Castor Bean (Ricinus communis L.) Grown in Different Regions of Tunisia. JAERI 2016, 8. ISSN 2394-1073. [Google Scholar]
  30. Saadaoui, E.; Martín, J.J.; Bouazizi, R.; Chokri, B.R.; Grira, M.; Saad, A.; Khouja, M.L.; Cervantes, E. Phenotypic variability and seed yield of Jatropha curcas L Introduced to Tunisia. Acta Bot. Mex. 2015, 110, 119–134. [Google Scholar] [CrossRef] [Green Version]
  31. Martín-Gómez, J.J.; Rewicz, A.; Goriewa-Duba, K.; Wiwart, M.; Tocino, Á.; Cervantes, E. Morphological Description and Classification of Wheat Kernels Based on Geometric Models. Agronomy 2019, 9, 399. [Google Scholar] [CrossRef] [Green Version]
  32. Weisstein, E.W. “Heart Curve.” From MathWorld—A Wolfram Web Resource. Available online: http://mathworld.wolfram.com/HeartCurve.html (accessed on 19 May 2020).
  33. Cervantes, E.; Martín-Gómez, J.J. Seed Shape Description and Quantification by Comparison with Geometric Models. Horticulturae 2019, 5, 60. [Google Scholar] [CrossRef] [Green Version]
  34. Weisstein, E.W. “Pear Curve.” From MathWorld—A Wolfram Web Resource. Available online: http://mathworld.wolfram.com/PearCurve.html (accessed on 19 May 2020).
  35. Soejima, A.; Wen, J. Phylogenetic analysis of the grape family (Vitaceae) based on three chloroplast markers. Am. J. Bot. 2006, 93, 278–287. [Google Scholar] [CrossRef] [PubMed] [Green Version]
  36. Ferreira, T.; Rasband, W. Imagej User Guide-Ij1.46r., 2012, 186p. Available online: http://imagej.nih.gov/ij/docs/guide (accessed on 19 May 2020).
  37. Cox, E.P. A method of assigning numerical and percentage values to the degree of roundness of sand grains. J. Paleontol. 1927, 1, 179–183. [Google Scholar]
  38. Riley, N.A. Projection sphericity. J. Sediment. Pet. 1941, 11, 94–97. [Google Scholar]
  39. Schwartz, H. Two-dimensional feature-shape indexes. Mikroskopie 1980, 37, 64–67. [Google Scholar]
  40. OIV Descriptor List for Grape Varieties and Vitis Species, 2nd ed.; Organisation Internationale de la Vigne et du Vin: Paris, France, 2009; 179p, Available online: http://www.oiv.int/public/medias/2274/code-2e-edition-finale.pdf (accessed on 19 May 2020).
  41. Hidalgo-Fernandez Cano, L.; Hidalgo Togores, J. Tratado de Viticultura I; Editorial Mundi Prensa: Madrid, Spain, 2011; pp. 2–5. [Google Scholar]
Figure 1. Seeds of V. vinifera ssp. sylvestris in three orientations: dorsal (D), lateral (L) and ventral (V). Ventral views are used in all the images, because the seeds are more stable and the orientation occurs in a plane perpendicular to the line of vision. In the dorsal view, the seed tends to oscillate resting on the central rib and a flank, resulting in more variable sub-lateral orientations.
Agronomy 10 00739 g001
Figure 2. Geometric models for the quantification of shape in seeds of the Vitaceae: (M1) The fourth heart curve of Weisstein [31]. (M2) A rounded heart curve modified from M1. (M3) The water drop, obtained from M1, adapting the basis in the heart curve to a circumference overlapping the maximum width of the curve. (M4) Obtained by scalling M3 in the y-axis by a factor of 123/100. (M5) Obtained by scalling M1 in the y-axis by a factor of 123/100. (M6) Fibonacci’s pear, obtained by scalling the pear curve of Weisstein [30] with r = 2 in the y-axis by a factor equal to the Golden Ratio Φ . (M7) Derived from an ellipse.
Agronomy 10 00739 g002
Figure 3. The application of geometric models to seeds of the Vitaceae for the calculation of the J index. Left: two of the models used. Above: seeds of V. amurensis adjust well to M3. Below: Seeds of V. vinifera ssp. vinifera cultivar Morenillo adjust well to M6.
Agronomy 10 00739 g003
Figure 4. Method for obtaining the J index (percentage of similarity between two images; the geometric figure and the seed image). Left: the seed (V. amurensis) and the geometric model (M3). The composed image, in the center contains both the seed and the model. Right: total surface occupied by both figures (top) and shared surface (bottom). The surface comprised in the white perimeter is the common region, C; while total area (C+D) is obtained from the image in the right top figure. The J index is the ratio between the shared and the total area x 100. The bar is equal to 1 cm.
Agronomy 10 00739 g004
Figure 5. From left to right in all rows: Three of the models used (M3, the water drop is applied in rows 1 and 3; M1, the heart curve is applied in row 2; and M7 is applied in rows 5 and 6; a figure composed with the silhouettes of 20 seed images (120 for V. vinifera ssp. vinifera in row 5)), and six representative images of seeds of the following species (top to bottom): V. amurensis (row 1), V. labrusca (row 2), V. rupestris (row 3), V. vinifera ssp. sylvestris (row 4), V. vinifera ssp. vinifera (row 5; the second image contains the composed silhouettes of all six varieties). The bar is equal to 1 cm.
Agronomy 10 00739 g005
Figure 6. From left to right in all rows: Models used (M5, the elongated heart curve is applied in row 1; M6, the Fibonnacci’s pear is applied in row 2; and M7 is applied in rows 3 to 6); a figure composed of silhouettes of 20 seed images; representative images of seeds of the six V. vinifera ssp. vinifera cultivars analyzed. From top to bottom: Meserguera (row 1), Carignano (row 2), Camarate (row 3), Cercial (row 4), Malvasia (row 5) and Morenillo (row 6). The bar is equal to 1 cm.
Agronomy 10 00739 g006
Figure 7. From left to right: Model 4 (an elongated water drop), a figure composed with the silhouettes of 20 seed images, and five representative images of seeds of C. verticillata. The bar is equal to 1 cm.
Agronomy 10 00739 g007
Figure 8. From left to right: Model 2 (three rounded heart curves), three figures composed with the silhouettes of 20 seed images, and five representative images of seeds of P. tricuspidata. The first row contains seeds from one-seed fruits; the second from two-seed fruits and the third, from three seed-fruits. The bar is equal to 1 cm.
Agronomy 10 00739 g008
Table 1. Mean values of the area (A), perimeter (P), length of the major axis (L), length of the minor axis (W), aspect ratio (AR is the ratio L/W), circularity (C) and roundness (R) in the seeds of four species of Vitis analyzed.
NAPLWARCR
V. amurensis440.14a (0.01)1.48a (0.06)0.49a (0.03)0.38b (0.02)1.22a (0.07)0.80d (0.03)0.82d (0.05)
V. labrusca410.27c (0.02)2.13c (0.06)0.71c (0.03)0.55d (0.02)1.23a (0.08)0.76b,c (0.03)0.81c,d (0.06)
V. rupestris330.16b (0.02)1.60b (0.11)0.55b (0.04)0.41c (0.02)1.29a (0.07)0.78c,d (0.02)0.78c (0.04)
V. vinifera ssp. sylvestris1220.16b (0.03)1.66b (0.24)0.58b (0.08)0.39b (0.03)1.49b (0.26)0.73b (0.06)0.69b (0.09)
V. vinifera ssp. vinifera3010.15a,b (0.03)1.64b (0.21)0.58b (0.07)0.36a (0.04)1.71c (0.21)0.68a (0.06)0.60a (0.07)
Vitis amurensis440.14a (0.01)1.48a (0.06)0.49a (0.03)0.38b (0.02)1.22a (0.07)0.80d (0.03)0.82d (0.05)
Vitis labrusca410.27c (0.02)2.13c (0.06)0.71c (0.03)0.55d (0.02)1.23a (0.08)0.76b,c (0.03)0.81c,d (0.06)
Vitis rupestris330.16b (0.02)1.60b (0.11)0.55b (0.04)0.41c (0.02)1.29a (0.07)0.78c,d (0.02)0.78c (0.04)
Vitis vinifera ssp. sylvestris1220.16b (0.03)1.66b (0.24)0.58b (0.08)0.39b (0.03)1.49b (0.26)0.73b (0.06)0.69b (0.09)
Vitis vinifera ssp. vinifera3010.15a,b (0.03)1.64b (0.21)0.58b (0.07)0.36a (0.04)1.71c (0.21)0.68a (0.06)0.60a (0.07)
The values of A are given in cm2; P, L and W, in cm. Standard deviation is given between parentheses. The mean values marked with the same letter in each column do not differ significantly at p < 0.05 (Scheffe’s test). N is the number of seeds used.
Table 2. Mean values of the area (A), perimeter (P), length of the major axis (L), length of the minor axis (W), aspect ratio (AR is the ratio L/W), circularity (C) and roundness (R), obtained for the images of the seeds of six cultivars of V. vinifera ssp. vinifera).
NAPLWARCR
Camarate730.13a.b (0.02)1.54a (0.11)0.55a,b (0.04)0.34a.b (0.02)1.70b,c (0.12)0.69b (0.04)0.59b,c (0.04)
Carignano520.15c (0.02)1.76b (0.16)0.64c (0.04)0.35b (0.03)1.95d (0.12)0.62a (0.06)0.51a (0.03)
Cercial580.12a (0.02)1.46a (0.10)0.52a (0.03)0.32a (0.03)1.75c (0.13)0.69b (0.04)0.58b (0.04)
Malvasia330.17d (0.02)1.75b (0.11)0.61c (0.05)0.39d (0.02)1.63b (0.15)0.70b (0.04)0.62c,d (0.06)
Meserguera 390.14b.c (0.02)1.57ª (0.09)0.56b (0.03)0.36c (0.03)1.51a (0.12)0.73c (0.03)0.67e (0.05)
Morenillo460.18d (0.04)1.84b (0.32)0.65c (0.11)0.40d (0.03)1.63b.c (0.30)0.68b (0.06)0.63d (0.07)
Values of A are given in cm2; P, L and W, in cm. Standard deviation is given between parentheses. The values marked with the same letter in each column do not differ significantly at p < 0.05 (Scheffe’s test).
Table 3. Mean values of the J index in seeds of four species of Vitis, with four of the models used.
NJ Index M1J Index M3J Index M6J Index M7
Vitis amurensis2086.8b (2.65)90.6c (2.16)68.4a (2.77)79.1a (3.02)
Vitis labrusca2089.6b (2.48)88.3b,c (2.08)74.3b (3.78)81.5a,b (4.35)
Vitis rupestris2087.4b (2.74)90.0c (2.03)76.3b (2.50)83.7b (2.38)
Vitis vinifera ssp. sylvestris2078.6a (5.88)86.3b (3.82)80.7c (4.83)88.4c (3.41)
Vitis vinifera ssp. vinifera12075.8a (5.32)77.6a (4.19)87.5d (3.10)88.9c (3.35)
Standard deviation is given between parentheses. Values marked with the same letter in each column do not differ significantly at p < 0.05 (Scheffe’s test).
Table 4. Mean values of the J index in six cultivars of Vitis vinifera ssp. vinifera, with the models used (M5, M6 and M7).
CultivarNJ Index M5J Index M6J Index M7
Camarate2084.5b,c (2.45)88.5a (2.33)89.9b,c (2.18)
Carignano2079.7a (2.08)86.8a (2.91)83.9a (2.39)
Cercial2083.4b (2.44)88.4a (1.83)90.1b,c (2.50)
Malvasia2085.9c,d (3.74)86.3a (2.44)91.7c (3.26)
Meserguera2090.4e (1.80)86.1a (4.35)88.6b (1.93)
Morenillo2088.0d (2.11)88.6a (3.21)89.4b (1.35)
Standard deviation is given between parentheses. Values marked with the same letter in each column do not differ significantly at p < 0.05 (Tukey’s test).
Table 5. Mean values of the area (A), perimeter (P), length of the major axis (L), length of the minor axis (W), aspect ratio (AR is the ratio L/W), circularity (C) and roundness (R) for seeds in the species C. verticillata and P. tricuspidata.
NAPLWARCR
C. verticillata281.15a (0.07)1.43a (0.05)0.50b (0.02)0.35a (0.01)1.40b (0.05)0.71a (0.03)0.72a (0.02)
P. tricuspidata361.40b (0.17)1.45a (0.08)0.45a (0.03)0.41b (0.03)1.10a (0.08)0.83b (0.03)0.93b (0.06)
Values of A are given in cm2; P, L and W, in cm. Standard deviation is given between parentheses. Values marked with the same letter in each column do not differ significantly at p < 0.05 (Scheffe’s test).
Table 6. Mean values of the area (A), perimeter (P), length of the major axis (L), length of the minor axis , aspect ratio (AR is the ratio L/W), circularity (C) and roundness (R) and J index values in seeds of P. tricuspidata (Siebold and Zucc.) Planch has one, two or three seeds per fruit. J index values were obtained with M4 (an elongated water drop).
Seeds/FruitNAPLWARCRJ Index (M2)
1121.25a1.40a0.42a0.40a1.03a0.82a0.97b93.7b
(0.10)(0.06)(0.02)(0.02)(0.02)(0.03)(0.02)(1.29)
2121.52c1.50c0.47b0.43b1.05a0.84a0.95b91.8b
(0.13)(0.07)(0.02)(0.02)(0.02)(0.03)(0.02)(1.47)
3121.38b1.40b0.47b0.40a1.16b0.83a0.86a88.6a
(0.14)(0.07)(0.02)(0.03)(0.08)(0.02)(0.06)(3.71)
Values of A are given in cm2; P, L and W, in cm. Standard deviation is given between parentheses. Values marked with the same letter in each column do not differ significantly at p < 0.05 (Scheffe’s test).

