Changes in Soil Properties and Bacterial Community Composition with Biochar Amendment after Six Years

Agricultural College, Shenyang Agricultural University, Shenyang 110866, China
*
Author to whom correspondence should be addressed.
Agronomy 2020, 10(5), 746; https://0-doi-org.brum.beds.ac.uk/10.3390/agronomy10050746
Submission received: 9 April 2020
/
Revised: 17 May 2020
/
Accepted: 19 May 2020
/
Published: 21 May 2020
(This article belongs to the Special Issue Applications of Biochar and Other Organic Amendments within a Sustainable Agriculture and Circular Economy)
Abstract
:Changes in soil physicochemical properties and bacterial community composition were investigated six years after biochar amendment at 0%, 4%, 8% and 12% (w/w), which were coded as C0, C1, C2 and C3, respectively. Results showed that some soil characteristics were sustainable, as they were still affected by biochar addition after six years. Compared to the control, biochar-treated soils had higher pH, total carbon (TC), C/N, total nitrogen (TN), available phosphorus (AP) and available potassium (AK). Soil pH, C/N and the content of TC, TN and AK all increased along with the increase of biochar dosage. The results of Illumina MiSeq sequencing demonstrated that biochar enhanced soil bacteria diversity and modified the community composition over time. The relative abundance of Nitrospirae and Verrucomicrobia phylum increased but that of Acidobacteria phylum decreased significantly in biochar amended soils. The addition of biochar also enriched some bacterial genera, such as uncultured Nitrosomonadace, uncultured Gemmatimonadac, uncultured Nitrospiraceae and Magnetovibrio. In particular, the relative abundance of uncultured Nitrospiraceae was enhanced by 16.9%, 42.8% and 73.6% in C1, C2 and C3, respectively, compared to C0. Biochar has a potential role in enhancing the abundance of bacteria involved in N cycling. Soil pH, TC, TN, TK and AK, were closely related to alterations in the composition of the soil bacterial community. Meanwhile, these soil properties were significantly influenced by biochar amendment, which indicates that biochar affected the soil microbial community indirectly by altering the soil characteristics in the long term.
1. Introduction
Biochar is a stable, highly aromatic and carbon-rich substance derived from pyrolysis of different biological residues under limited oxygen conditions [1]. As biochar helps to improve soil quality and crop productivity, increases carbon storage, decreases greenhouse gas emissions and environmental remediation, more and more research on biochar has been carried out in the past decade [2,3,4,5,6,7]. Biochar is rich in stable carbon compounds, it has a large specific surface area, high pH and C/N ratio and strong adsorption capacity, which can improve soil structure [8,9], increase soil organic carbon [10,11], improve soil water and aeration conditions [12,13,14] and reduce nutrient losses [5,15,16] after it is added to soil. However, although the application of biochar has brought many benefits, some studies have also reported the negative or non-impact of biochar. For example, biochar reduced wheat and radish biomass [17], and decreased mineral nitrogen availability in soils [5]. The effectiveness of biochar application varies with soil type, crop species, the biomass feedstock and pyrolysis conditions, which highlights the need for further investigation on biochar’s effect when applied to soil.
Biochar amendment directly changes the soil’s physical and chemical characteristics and consequently leads to changes in soil microorganisms [18,19]. Among soil microorganisms, bacteria are the most abundant and significantly influence the soil carbon and nitrogen cycling [20]. Their communities are considerably affected by environmental changes, and are considered as an indicator of soil environmental changes [21]. Hence, studying the response of soil bacteria to biochar addition is important, as they could benefit from biochar application. Variations in soil properties such as pH, nutrient maintenance and water conservation caused by biochar addition could potentially alter microbial abundance and modify their composition, and then modify the circulation and function of soil elements [2,22]. Chen et al. [23] found that bacterial abundance and diversity were increased and the community composition was modified by wheat straw biochar amendment in paddy soil, in particular, the bacteria related to nitrogen cycling were also found to be changed in three different sites in South China.
However, most of the results are from short-term experiments. The physical and chemical characteristics of biochar are changed in nature after being added into the soil, which is known as biochar ageing [24]. Because biogeochemical processes exist in the soil, the biochar ageing process leads to changes in the soil’s chemical and physical parameters over time [25,26]. The study by Zhang et al. [9] suggested that long-term (six years) amendment with wheat straw biochar could improve soil carbon stocks and nutrient pools. An increase in soil pH, available P, total N, organic C, ammonium-N, nitrate-N was also observed during five years of biochar addition in upland red soil [27]. Changes in soil physicochemical characteristics induced by long-term biochar amendment will affect microbial community structure. In the short term, the labile fraction of fresh biochar may increase or decrease the abundance and activity of soil organisms in some cases [2], but, as only a small proportion of biochar can be used by soil microbes it will be completely exhausted in the short term [28,29]. Therefore, long-term changes in microbial communities might be indirectly caused by biochar through changing the physicochemical properties of soil [30].
Nevertheless, the long-term studies of the effect of biochar on soil microbial communities are limited. Due to its stable properties, high carbon content and recalcitrance nature, biochar would have a long-term impact on soil properties and bacterial community composition. The main objectives of the present study were to investigate the effect of biochar on soil physicochemical properties and bacterial community structure six years after addition and to analyzes the relationship between soil physicochemical properties and microbial parameters after biochar application. This study aims to improve our understanding of the long-term influence of biochar application on soil properties and its bacterial community.
2. Materials and Methods
2.1. Experimental Site and Design
The experiment was carried out at the experiment yard of the scientific research base of the Rice Institute Shenyang Agricultural University in Liaoning Province, China (123.34′ E, 41.49′ N). The region has a typical semi-humid temperate continental monsoon climate with a mean annual temperature of 8.5 °C and mean annual precipitation of 698 mm. The soil for the experiment is classified as Hydragric Anthrosol [31]. The properties of the soil are: pH 6.7 (1:2.5 w/v), total nitrogen 1.3 g kg−1, total phosphorus 1.2 g kg−1, total potassium 23.8 g kg−1 and soil organic matter 22.7 g kg−1. Biochar used in this study was produced from corn straw at a pyrolysis temperature of 500 °C for an hour, using combined biomass fast carbonization equipment by Jinhefu Agriculture Development Company, Liaoning, China, and the biochar was milled to pass through a 0.25 mm sieve. The properties of the biochar were as follows: pH 9.2 (1:10 w/v), total C 600 g kg−1, total N 14.5 g kg−1, total P 8.2 g kg−1 and total K 14.5 g kg−1.
The experiment was conducted in specially designed iron troughs (1 m long, 1 m wide and 40 cm high) without drainage on four wheels. Biochar addition rates were 0%, 4%, 8% and 12% (w/w), which were coded as C0, C1, C2 and C3, respectively. Each of the four treatments was established in three replicated troughs in a completely randomized design. The biochar powder was thoroughly mixed into the soil on one occasion on May 2012. No more biochar was applied in the following five years, but every year the soil was turned over manually with a shovel before rice transplanting to ensure the biochar and soil were thoroughly mixed. Fertilizers were applied consistently in each trough. N fertilizer was applied as urea at a rate of 150 kg N ha−1 three times every season, with 40% as a base fertilizer before transplantation, 40% at 7 days after transplantation and 20% at the heading stage. P and K fertilizers were applied once as a basal fertilizer before transplantation at rates of 45 kg P2O5 ha−1 (calcium superphosphate) and 67.5 kg K2O ha−1 (potassium chloride), respectively. As for water management, an approximately 5–10 cm water layer was maintained during the growth period of rice, and the water was not irrigated and it dried naturally during the mature period. Four rows and seven rice plants per row were transplanted into each trough every May for six years.
2.2. Soil Sampling and Measurement
After the rice harvest, soil samples were collected from a depth of 0 to 15 cm on 15 October 2017. Each soil sample was composited and homogenized from five soil cores in each replicated trough. After removing rice roots and stones, the soil samples were thoroughly homogenized and divided into two subsamples. One subsample was used for the determination of soil properties by natural air drying; the other subsample was weighed and stored at −80 °C in an ultralow temperature freezer for subsequent 16SrRNA sequencing.
Soil pH was measured at a soil/water ratio of 1:2.5 using a pH meter. The total carbon (TC) and total nitrogen (TN) contents of soil were determined using an elemental analyzer (Vario MACRO cube, Elementar, Germany). The soil samples were fine-ground to pass through a 0.15 mm sieve for available nitrogen (AN), total phosphorus (TP), total potassium (TK), available phosphorus (AP) and available potassium (AK) content analysis. The content of AN, TP, TK, AP and AK were determined according to the methods described by Bao [32]. The content of AN was measured by the alkali hydrolysis diffusion method, TP content was measured by sodium hydroxide fusing molybdenum blue colorimetric method, the content of TK was measured by sodium hydroxide melting flame photometer method, the content of AP was measured by sodium bicarbonate extraction molybdenum blue colorimetry method, and the content of AK was measured by ammonium acetate extraction flame photometer method [32].
2.3. DNA Extraction and Sequencing
Total soil DNA was extracted from 0.5 g frozen soil samples of each treatment using the Power Soil DNA Isolation Kit (Mo Bio Laboratories, Inc., USA). The V3-V4 hypervariable region of the 16s rRNA gene was amplified using the universal primers 338F (5′-ACTCCTACGGGAGGCAGCA-3′) and 806R (5′-GGACTACHVGGGTWTCTAAT-3′). Purified amplification products were used for high-throughput sequencing on the Illumina MiSeq platform (Biomarker Technologies Co., Ltd., Beijing, China). Pair-end reads sequencing by Illumina HiSeq 2500 were merged using FLASH (v1.2.7, http://0-ccb-jhu-edu.brum.beds.ac.uk/software/FLASH/) [33]. After comparing the combined tags with primers, more than six mismatched tags were discarded by FASTX-Toolkit [34], then Trimmomatic v 0.33 (http://www.usadellab.org/cms/?page=trimmomatic) [35] was used to filter out low-quality tags. The sequence was identified and removed by UCHIME v4.2 [36], and obtained the final effective tags.
2.4. Statistical Analysis
Differences in soil properties and the relative abundance of dominant bacteria were analyzed by one-way ANOVA and the least significant difference (LSD) post hoc comparison tests with SPSS 17.0. Pearson correlation analysis was used to assess the relationships between biochar addition rate and soil physicochemical properties of soils. The operational taxonomic unit (OTU) was clustered with a 97% similarity level with UCLUST [37]. RDP Classifier was used to classify the representative sequences of each OTU [38] and the Silva database (release 119, http://www.arb-silva.de) was used to analyze the species annotation. Alpha-diversity (including Ace, Chao, Shannon and Simpson) were calculated using Mothur software. Beta diversity analysis NMDS was obtained using QIIME run on a biocloud platform. The correlation between the bacterial community structure and the environmental variables was analyzed by redundancy analysis (RDA), which was performed on a biocloud platform.
3. Results
3.1. Soil Properties
The changes in soil properties are shown in Table 1. The addition of biochar changed most of the soil parameters (p < 0.05) significantly, except for TP. As shown in Table 1, TP content was almost the same among the different biochar treatments. The pH of soil samples amended with biochar increased approximately 0.44 units on average compared with non-biochar amended soils. However, there was no significant difference among C1, C2 and C3. Biochar application also significantly (p < 0.05) enhanced the soil C/N ratio and TC from 9.5 to 39.0 and from 11.3 to 76.9 g kg−1, respectively at different biochar addition rates. Besides, the TN of soils significantly (p < 0.05) increased along with the increase in biochar addition rates. The TN of C1, C2 and C3 increased 14.3%, 18.3% and 21.6%, respectively, compared to C0. In terms of TK, only C2 decreased significantly and the other treatments changed slightly with the increase in the biochar addition. As for the available nutrients in the soil, AP and AK content increased with biochar addition. In particular, AK content increased linearly in proportion to the biochar application rate. On the contrary, biochar addition decreased AN significantly, but no significant difference was observed among C1, C2 and C3. The pairwise correlation coefficient was calculated to show the relationship between soil parameters and biochar dosage (Table 2). Significant positive correlations between the biochar addition rate and the soil pH (r = 0.844, p < 0.01), TC (r = 0.961, p < 0.01), TN (r = 0.936, p < 0.01), AK (r = 0.958, p < 0.01), and C/N ratio (r = 0.968, p < 0.01) were found. In contrast, biochar addition was significant negatively correlated with AN (r = −0.650, p < 0.05) (Table 2).
3.2. Bacterial Community Diversity
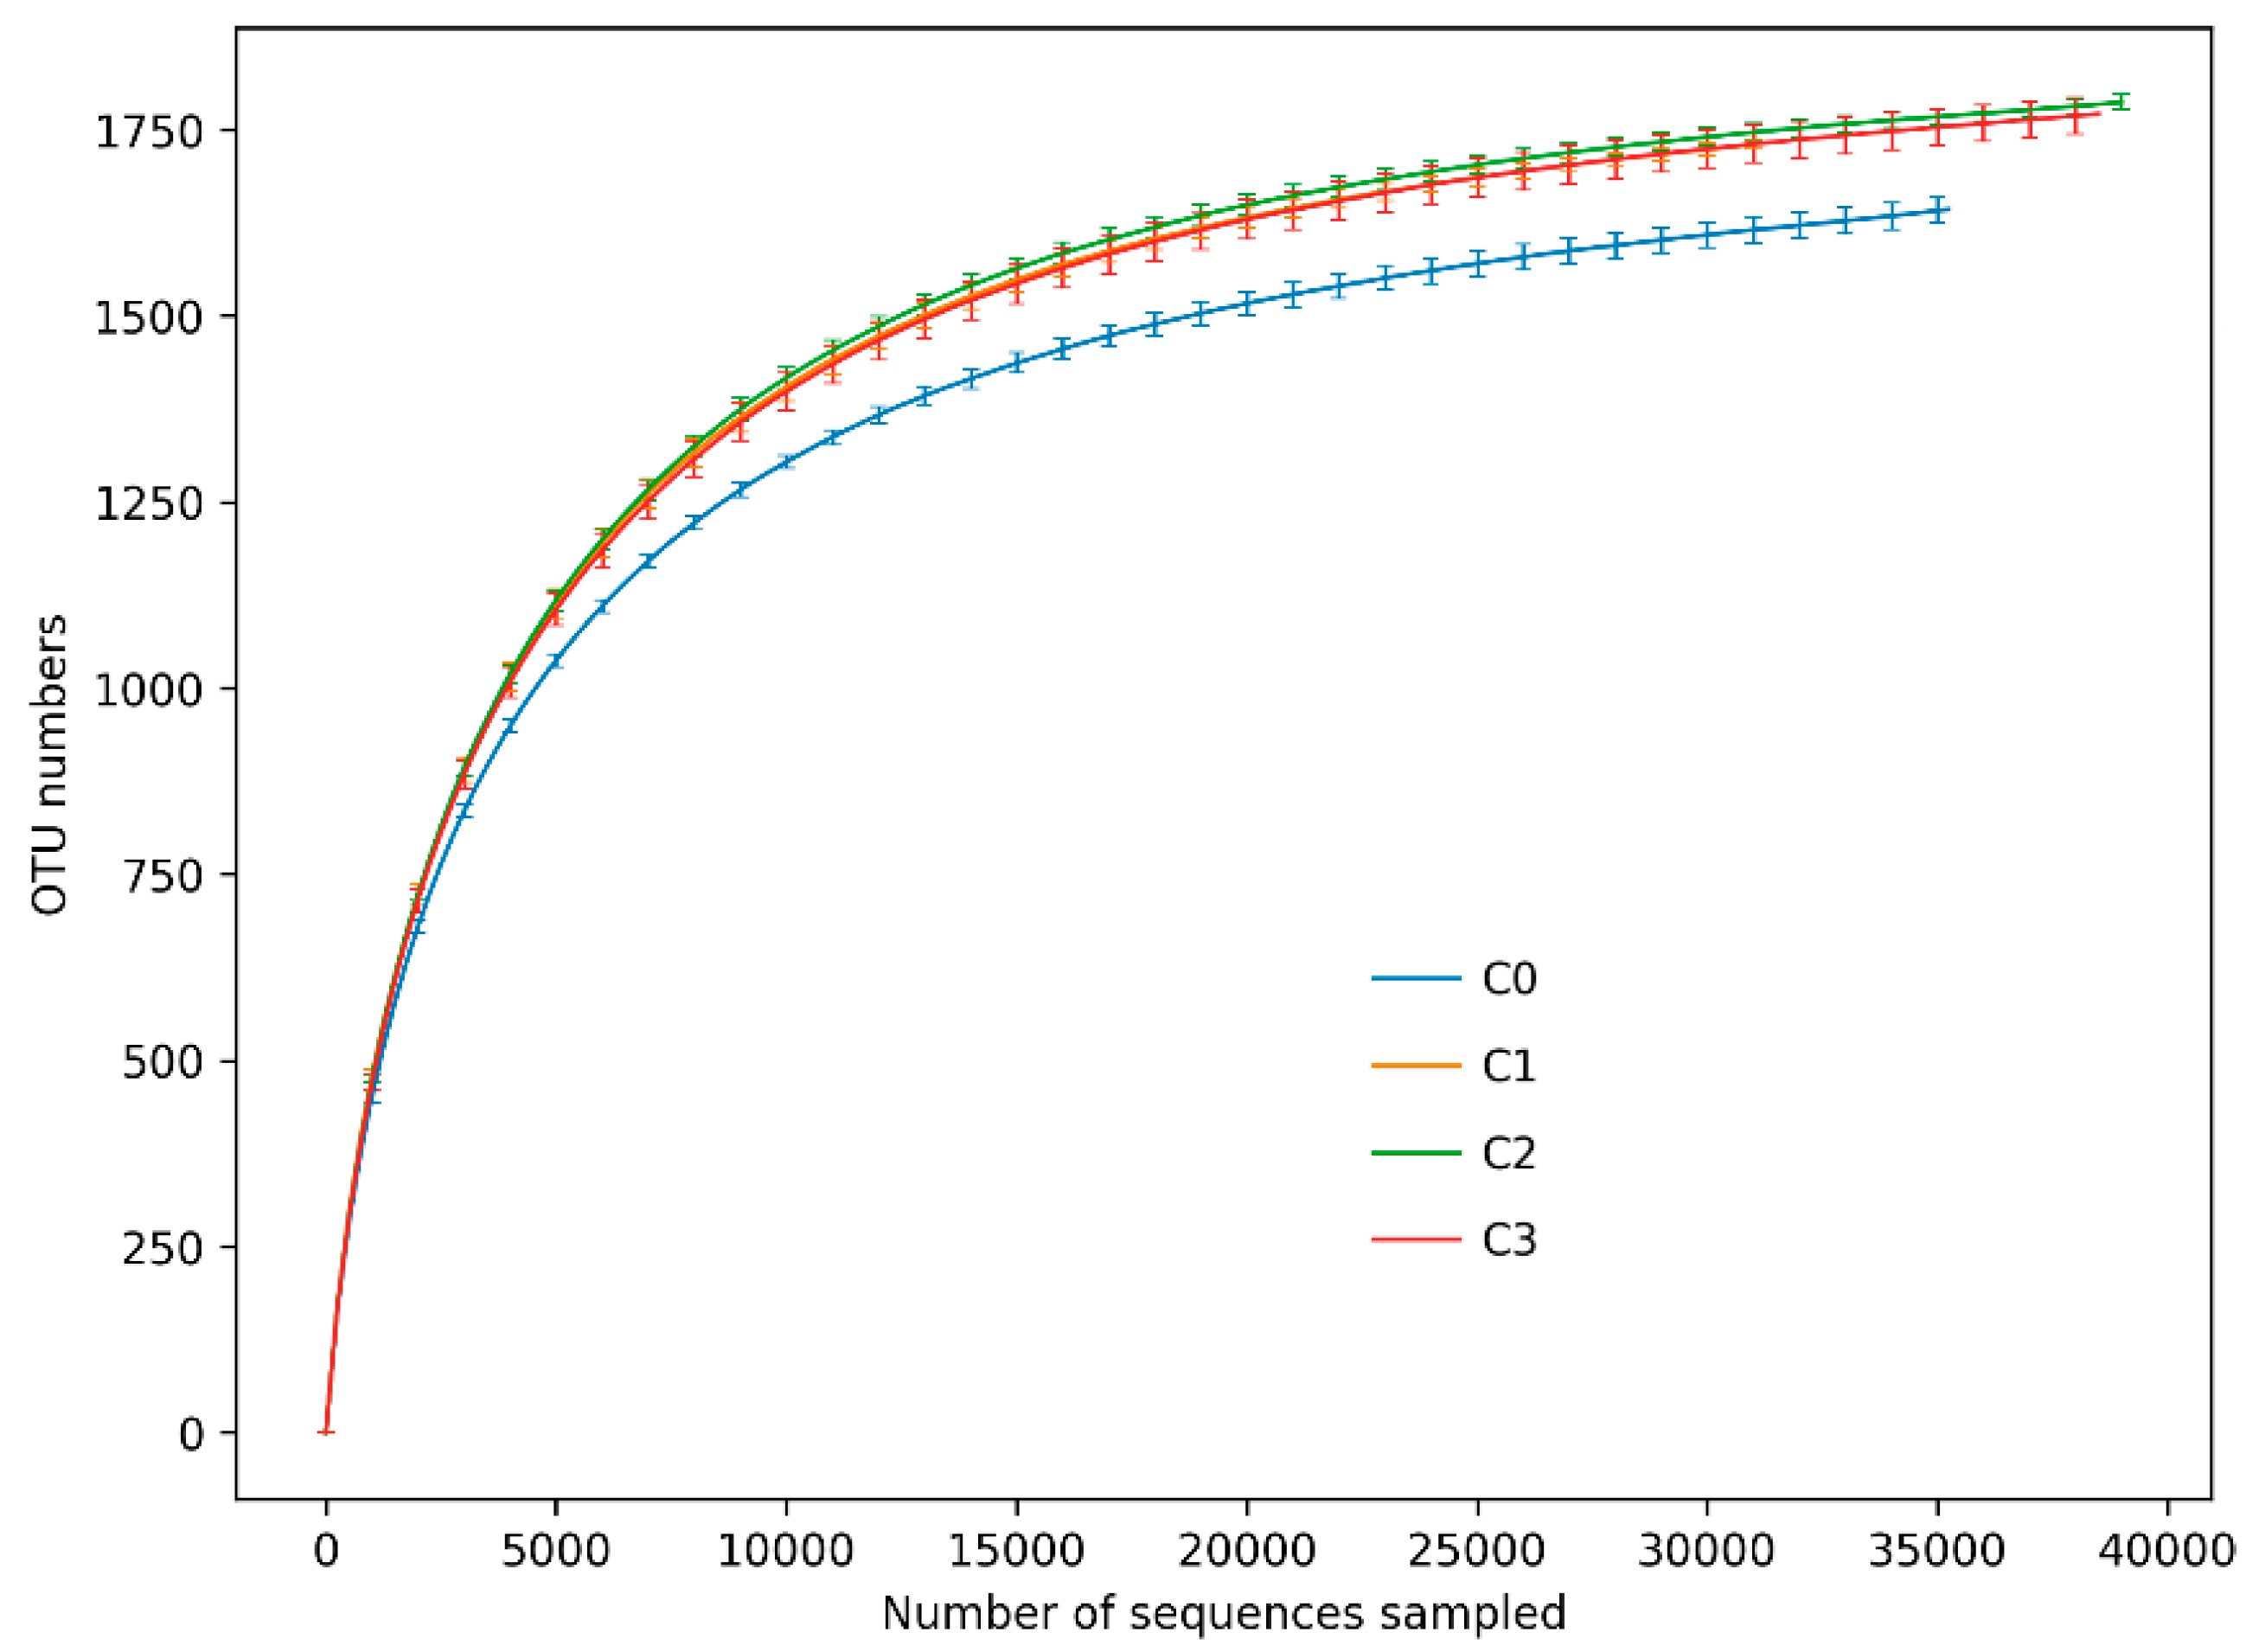
In total, 659,700 quality sequences from all samples with average read lengths of 419 bp were obtained after the raw reads were quality filtered. An average of 1743 bacterial operational taxonomic units (OTUs) per sample was found using 16S rRNA amplicon sequencing (Table 3). As Figure 1 displays, the rarefaction curves of all samples tended to be flat, suggesting that each sample was equally and reasonably sampled. The coverage was over 99% in all samples, revealing that the sequencing depth is enough to capture almost all the diversity of the bacterial community in this study (Table 3). Compared with the non-biochar amended soils, the number of OTUs detected for the bacterial 16S rRNA gene sequences increased significantly (p < 0.05) in biochar amended soils. Among the three biochar treatments, the number of OTUs in the C2 treatment was the highest, and increased by 8.8% compared with C0. Alpha diversity indices, including Ace, Chao, Shannon and Simpson index, were calculated to evaluate the difference in soil bacterial community diversity among different samples (Table 3). The results indicated that biochar addition was most conducive for improving the richness indices of soil bacterial community, such as the Ace and Chao index. Diversity indicators such as Shannon index increased and Simpson index (the smaller the Simpson index, the higher the diversity) decreased with the rate of biochar addition. However, the difference in the diversity index among different biochar treatments was not significant (Table 3). Biochar addition increased the richness of the bacterial communities significantly but only slightly influenced the diversity of the bacterial community.
3.3. Relative Abundance of Soil Bacteria
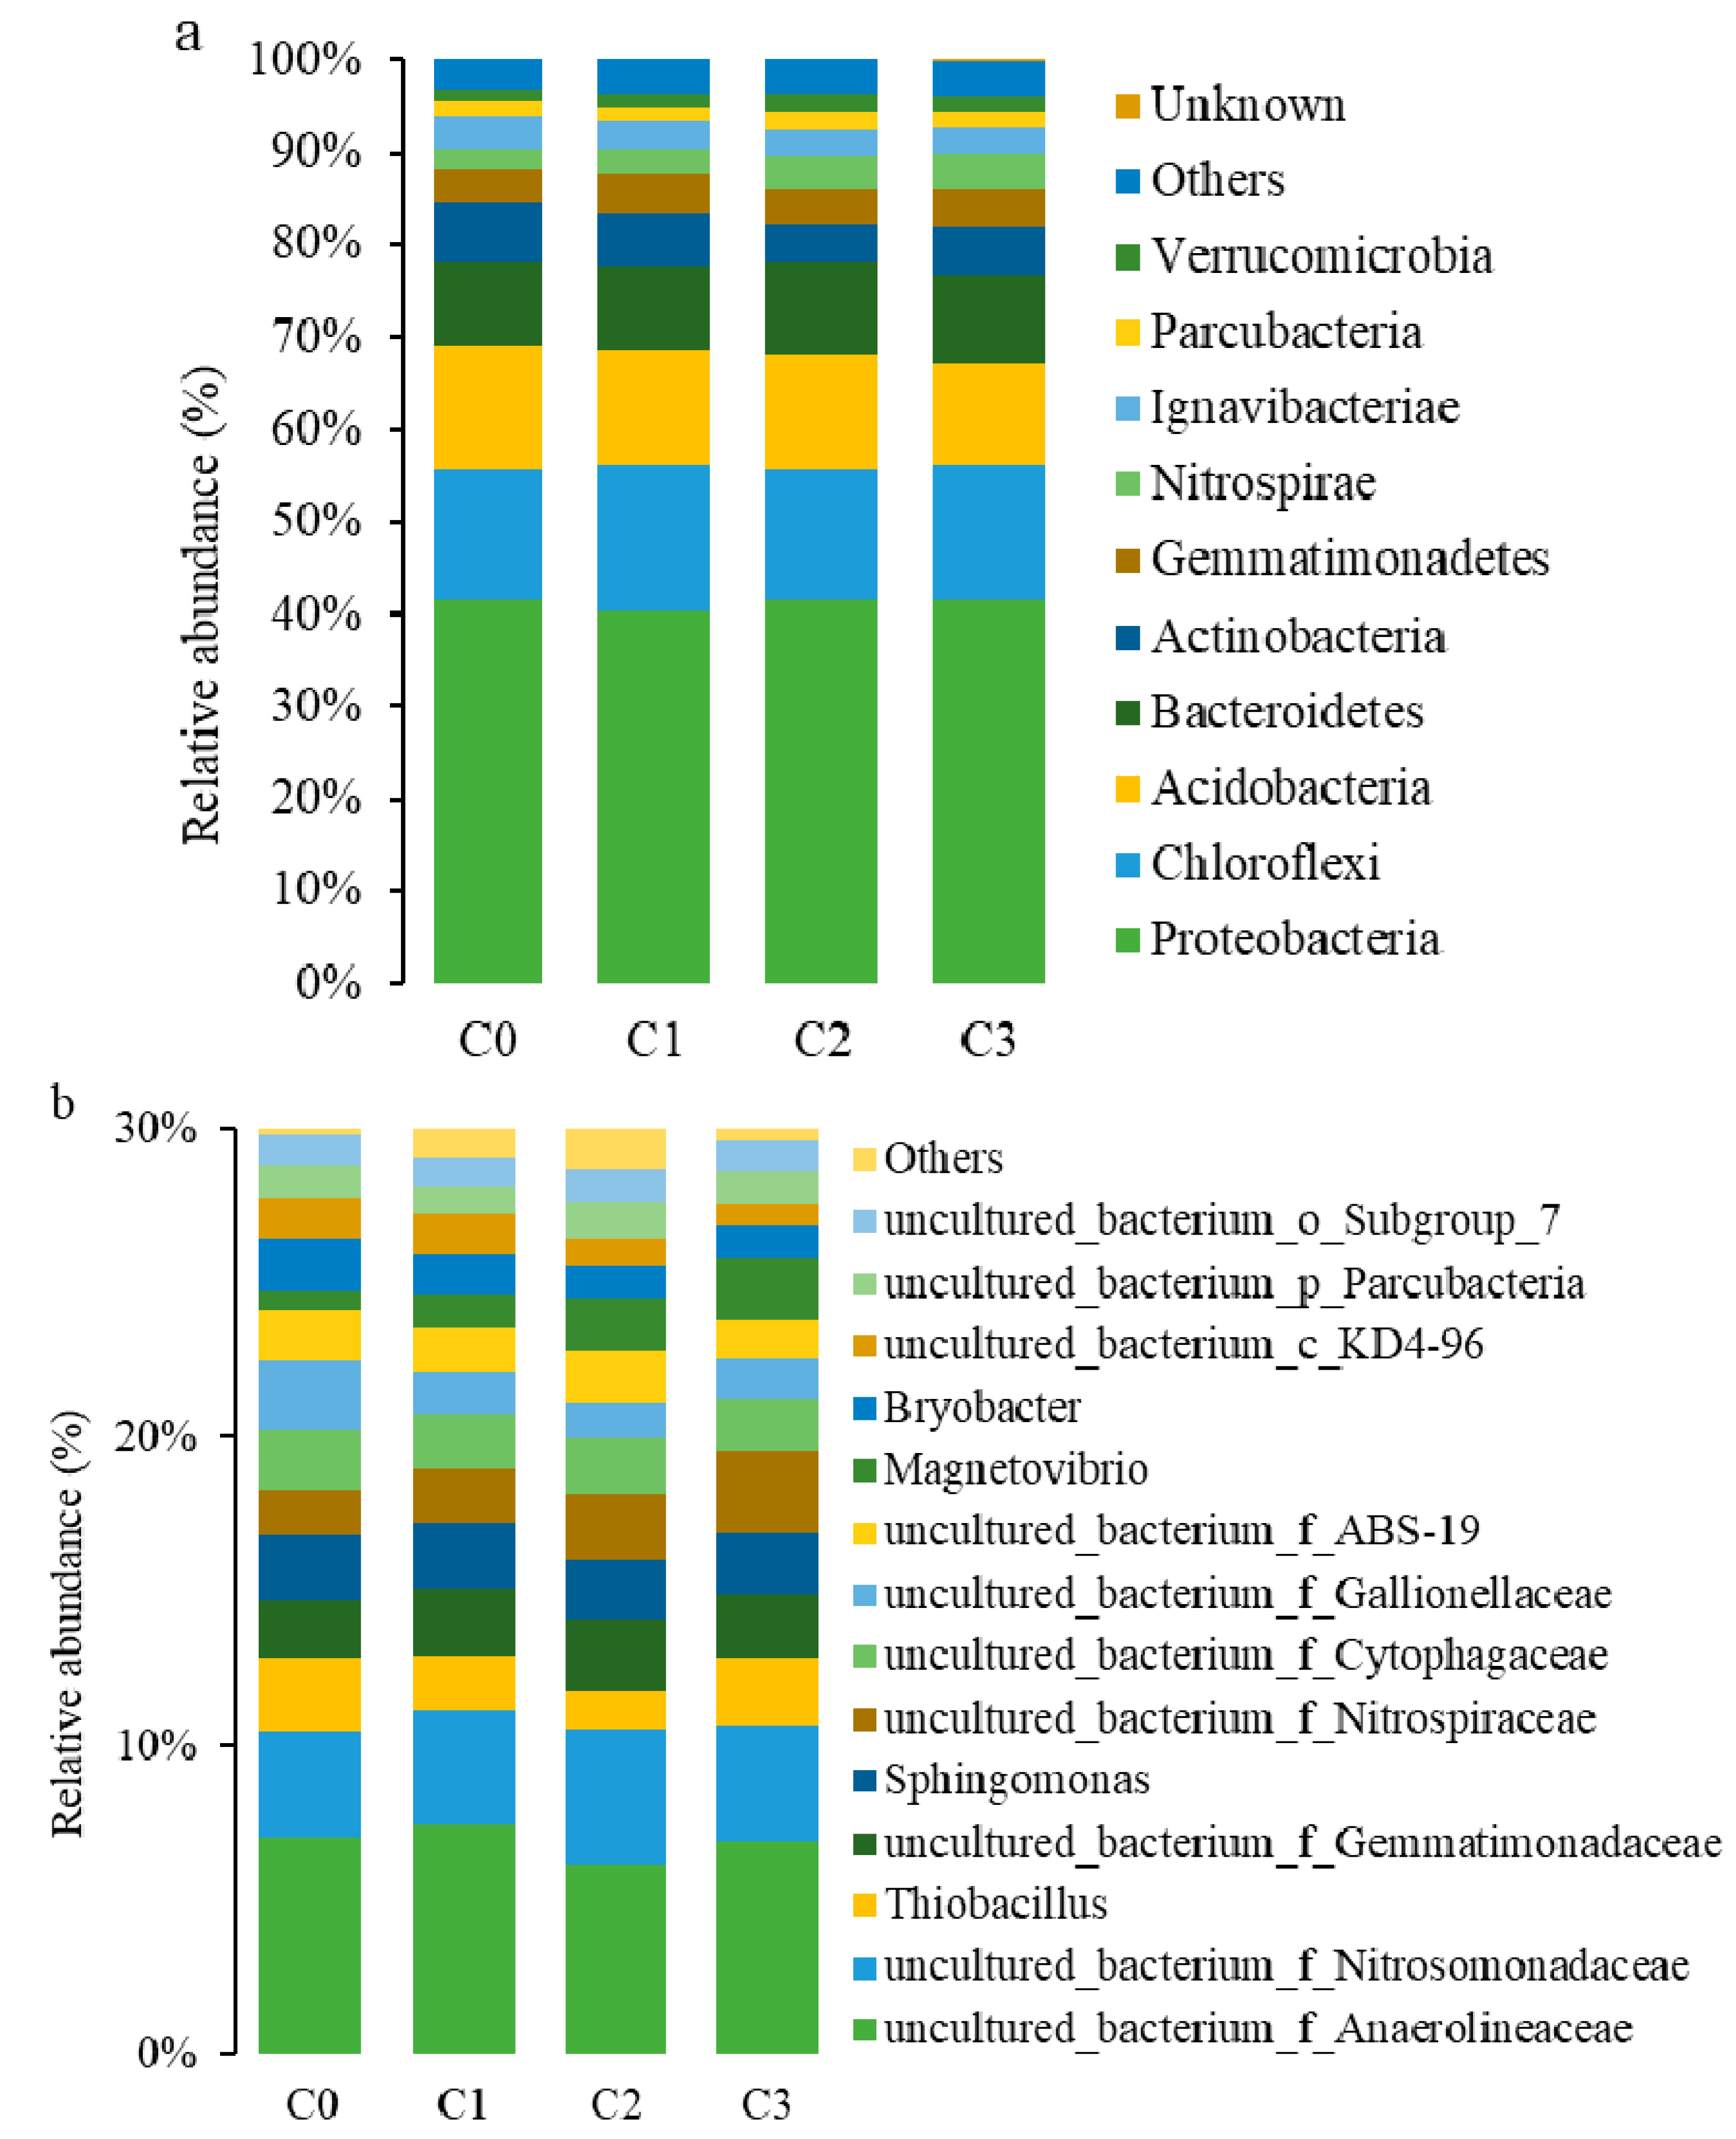
Biochar altered the relative abundance of the soil bacterial phyla. Of the top 10 bacterial phyla, Proteobacteria, Chloroflexi, Acidobacteria, Bacteroidetes, Actinobacteria, Gemmatimonadetes, Nitrospirae, Ignavibacteriae were the predominant phyla (relative abundance > 2%) in four biochar treatments (Figure 2a). The dominant phyla accounted for >89% of the bacterial sequences in all samples. Proteobacteria was the most abundant phyla accounting for 39.0%–40.4% of the total composition, followed by Chloroflexi (13.8%–15.4%), Acidobacteria (10.5%–13.1%), Bacteroidetes (8.6%–9.5%), Actinobacteria (4.1%–6.2%), Gemmatimonadetes (3.7%–4.0%), Nitrospirae (2.2%–3.8%), and Ignavibacteriae (2.6%–3.4%) (Supplementary Materials, Table S1). The relative abundance of Bacteroidetes and Nitrospirae increased whereas that of Acidobacteria and Ignavibacteriae decreased with the increase in the biochar amendment. The relative abundance of other bacterial phyla changed slightly with different biochar treatments. Furthermore, the relative abundance of Nitrospirae and Verrucomicrobia increased significantly (p < 0.05) with the increase in biochar application rates.
In the present study, of the nearly 400 bacterial genera that were classified, the relative abundances of 51 genera showed significant (p < 0.05) differences with different biochar addition rates (Supplementary Materials, Table S2). Fifteen dominant genera (relative abundance > 1%) were found in all treatments (Figure 2b). The relative abundance of dominant genera were 28.7%–29.8% in four treatments. The relative abundance of uncultured Nitrosomonadaceae, uncultured Gemmatimonadaceae, uncultured Nitrospiraceae and Magnetovibrio increased in biochar amended soils. Conversely, the relative abundance of Thiobacillus and uncultured Gallionellaceae decreased with biochar amendments. Of all the bacteria, the relative abundances of uncultured Nitrospiraceae changed most significantly, which increased with increasing biochar application rates (p < 0.05). The relative abundance of uncultured Nitrospiraceae in C1, C2 and C3 were 16.9%, 42.8% and 73.6% higher, respectively, than that of C0. In contrast, the relative abundance of Bryobacter and uncultured KD4-96 declined significantly (p < 0.05) as the biochar dose increased.
3.4. Bacterial Community Structure and Its Correlation with Soil Properties
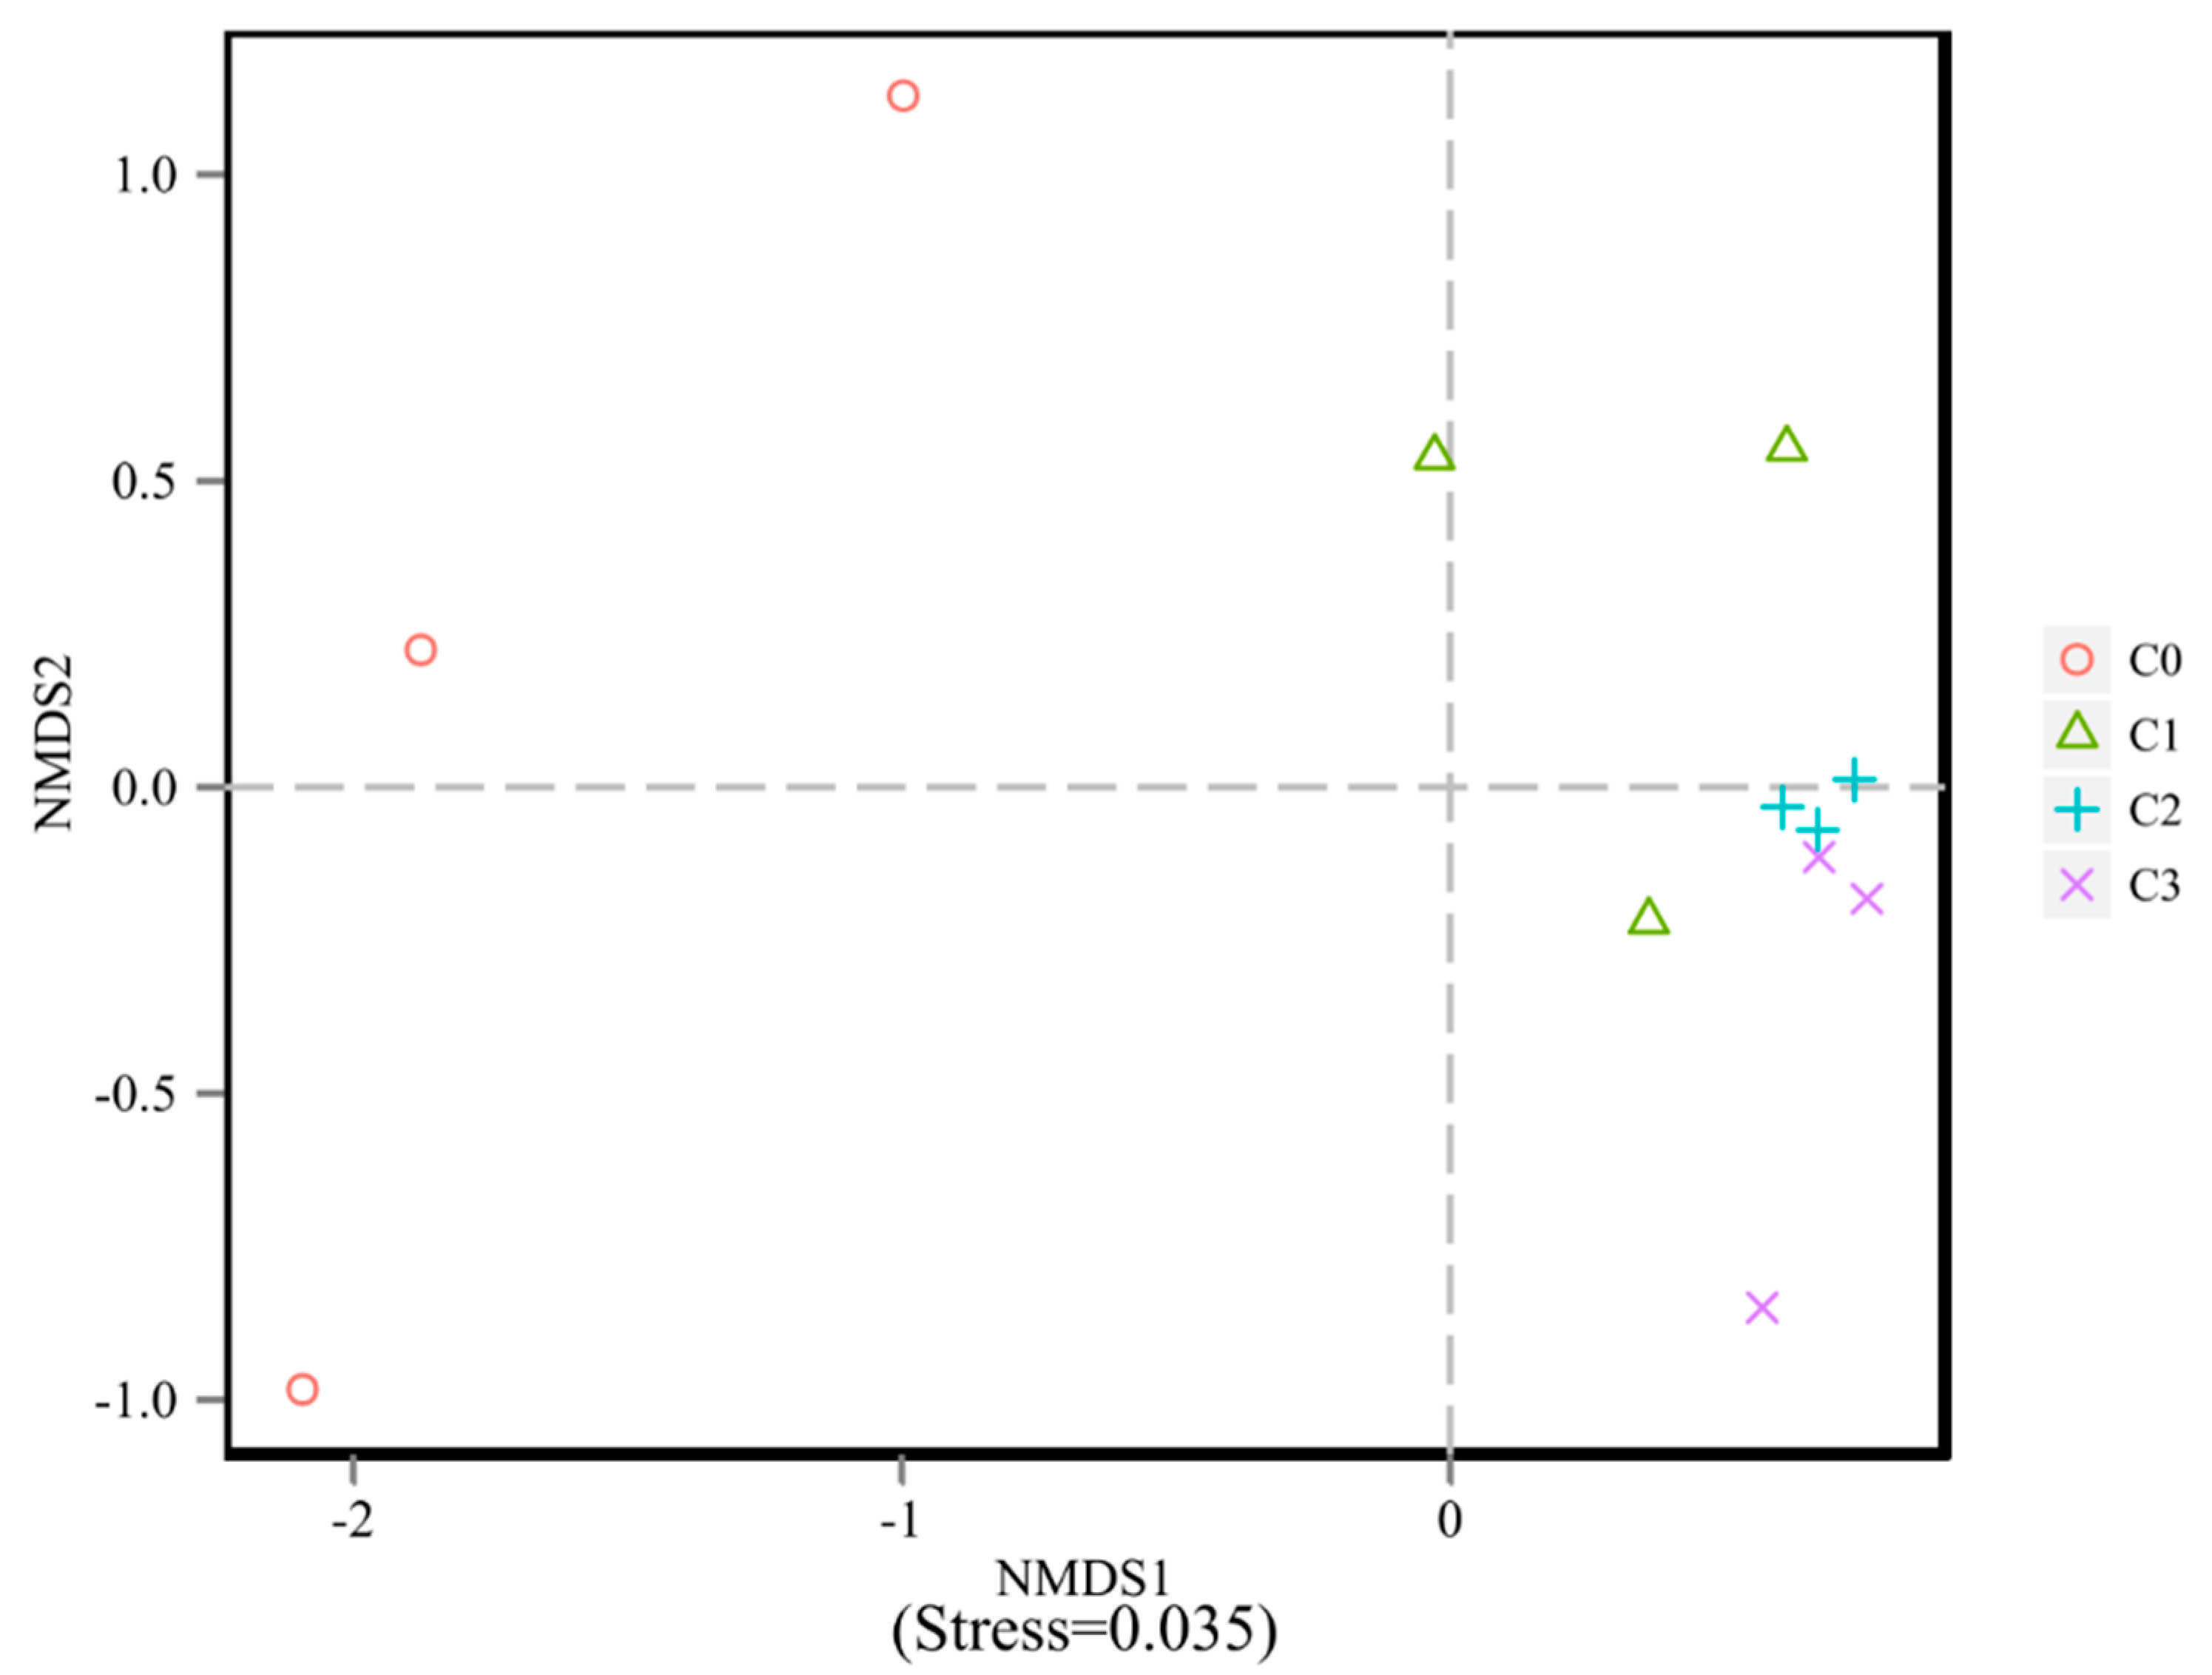
Non-metric multidimensional scaling analysis (NMDS) was used to evaluate the effect of biochar application on the microbial community structure of soil (Figure 3). The bacterial communities sampled at C0 treatment were separated from those sampled at C1, C2 and C3.A higher similarity of soil bacterial community composition was found with the increase in biochar application. The result demonstrated that biochar application changed the bacterial community structure significantly.
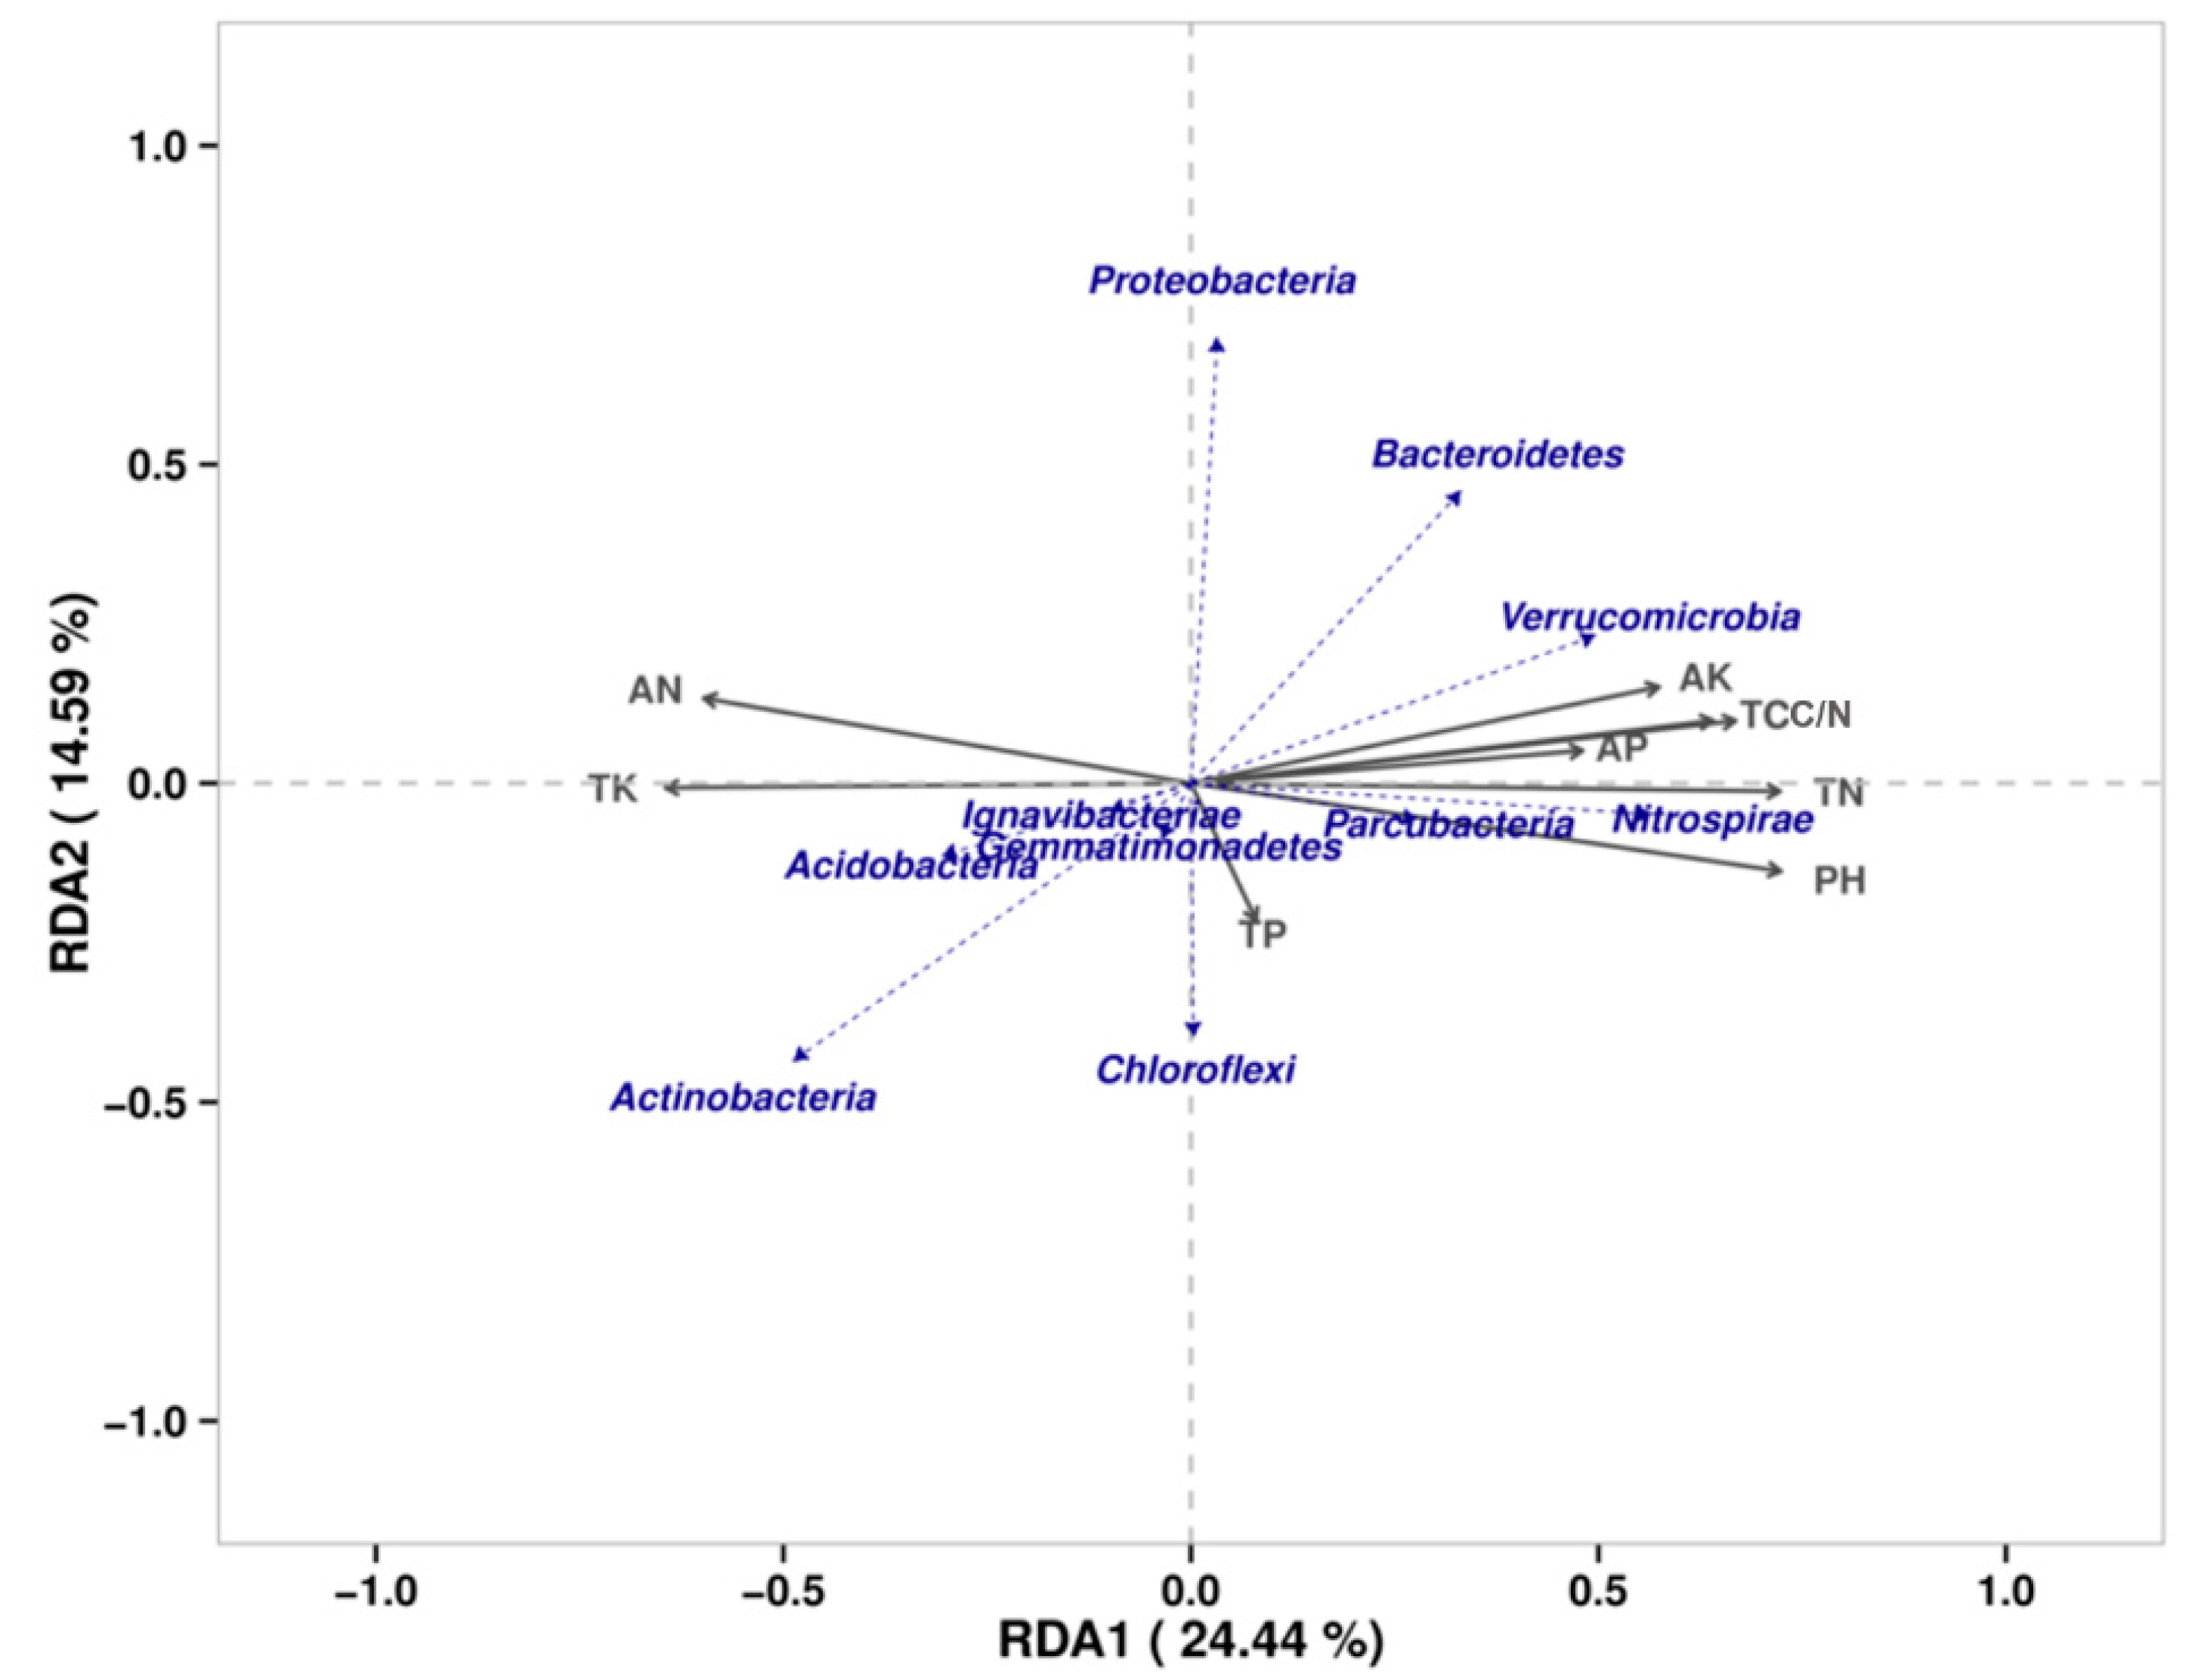
Redundancy analysis (RDA) was performed to further analyze the effects of soil physicochemical properties on the bacterial community composition. As shown in Figure 4, except for AP and TP, the other soil properties had longer projections, which indicated that the pH, TN, C/N, TC, AK, TK and AN significantly impact soil microbial community composition on the first axis, positively or negatively. As shown in Figure 4, correlations between the main bacterial phyla and environmental factors were also observed. Nitrospirae, Parcubacteria and Verrucomicrobia were positively correlated with pH, TN, C/N, TC, AK and AP, while they were negatively correlated with TK and AN. Among them, pH and TN were the most influential factors on the dominant bacteria Nitrospirae. RDA results revealed that biochar amendment could indirectly modify bacterial community structure by altering soil characteristics.
4. Discussion
4.1. Changes in Soil Properties with Biochar Application
Numerous studies have reported that the addition of biochar alters the physicochemical properties of soils, and the effects were determined by the characteristics and the additive amount of biochar [39,40]. Nevertheless, most of these reports were obtained from short-term experiments. In this study, the significant differences in the pH, C/N, total C, total N, total K, available N, available P and available K between biochar amended soils and non-biochar amended soils were found six years after biochar application (Table 1). The results demonstrate that biochar had a long-term influence on soil properties.
The pH of soil is an essential index of the soil properties changed by biochar application. Normally, biochar increases the pH of soil, as many long-term (3–6 years) studies have reflected [12,16,27,41]. Our results were similar to those of Wang et al. [16], who found that soil pH significantly increased over four years when the soil was amended with wheat straw biochar. Biochar addition significantly increased soil pH in this study, but there was no difference among C1, C2 and C3. The results may be due to biochar containing exchangeable cations that would exchange with aluminum and hydrogen in the soil, which consequently improves the pH value of soil mixed with biochar [17,42]. TC, TN and C/N were enhanced significantly along with biochar addition rates (p < 0.05) (Table 1). Additionally, they had a significant linear relationship with the amount of biochar added (Table 2). In this study, TC in the biochar addition treatments (C1, C2 and C3) was 2.6 to 6.8-fold greater than that of C0, which corresponds with the long-term study results of Carvalho et al. [43] and Nan et al. [44]. Biochar application promoted the carbon content of soil due to its inherent carbon content and the difficulty of it being degraded by soil microorganisms [45]. Less than 1% of carbon from the biochar initially applied was detected in microorganisms after nearly four years [46]. In our study, 18.2, 32.8 and 65.6 g kg−1 C of the added carbon still remained in soils of C1, C2 and C3 after six years compared to C0, which amounted to 75.8%, 68.3% and 91.6% of the initial carbon input, respectively. Similar to TC, biochar application also increased the TN content of soil, which has been confirmed by many studies [11,12,16]. Increases in TN retention in soils may be due to less N leaching or enhanced N immobilization by soil microorganisms [47]. As for the soil C/N, the results regarding the effect of biochar were inconsistent. Oladele [12] reported that the C/N ratio decreased after adding rice husk biochar to Alfisol for three years. In contrast, Yao et al. [26] reported that, in northeast China, the soil C/N ratio increased after 3-year biochar application, which is consistent with our study. The increase in the soil C/N ratio may promote immobilization of soil mineral N, thus reducing nitrification or denitrification in soil amended with biochar [48]. Biochar had little effect on soil TP. The content of TP was almost equal among different biochar treatments. Tan et al. [18] also found that there was almost no change in total P after biochar application. Biochar amendment negatively affected the TK content, which decreased slightly. As for available nutrients, the content of AN decreased but that of AP and AK increased significantly with the increase in biochar addition. The AN content of C1, C2 and C3 was 5.3%–8.1% lower than that in non-biochar addition soil (C0). The results were consistent with those obtained by Huang et al. [49], who found that the content of available nitrogen in Phragmites rhizosphere soil decreased. In contrast, biochar addition significantly increased the content of available P and K contents in soil, implying that biochar might be a source of P and K [50]. Similarly, aside from the direct addition of nutrients by biochar, another possible reason might be that biochar decreased runoff and leaching from the soil due to its greater surface area and higher CEC [15,47,51].
Overall, biochar enhanced soil pH, C/N, total C, total N, available P and available K significantly six years after amendment. The results suggest that biochar had long-term positive effects on soil properties, which will undoubtedly alter the microbial community composition of soil.
4.2. Changes in Soil Bacterial Diversity with Biochar Application
The Alpha diversity index of soil microorganism reflects the species richness and the community’s distribution, and higher indices indicate that the microbial diversity of soil is more abundant and the function of the soil micro-ecosystem is more complex and stable [52]. The Chao and ACE indexes reflect the actual number of species in the community. Generally, a larger Chao or ACE index indicates higher community richness. The results showed that the Ace index and Chao index increased by 7.6% and 6.4% on average compared with non-biochar treatment, and biochar significantly increased the species richness in the soil bacterial community [53]. This is due to the pore structure of biochar and its adsorption of water and nutrients, which can provide a suitable habitat for microorganisms [2]. At the same time, an appropriate amount of biochar can stimulate microbial metabolism and increase the species richness of microbial community. The Shannon index and Simpson index show the community species richness and evenness. Compared with non-biochar treatment, the Shannon index increased 5.5% while the Simpson index decreased 25.2% on average. Doan et al. [54] found that biochar enhanced the Shannon index significantly. In this study, the Shannon index increased and Simpson index decreased with biochar treatments, but there was an insignificant difference among the four different rates of biochar application (Table 3). Our findings are consistent with those of Cole et al. [55], who found that biochar influenced alpha-diversity indices (Shannon and Simpson) insignificantly after three years of biochar amendment. Overall, our results demonstrate that long-term biochar addition increases soil bacterial diversity, which is essential to maintain the stability and functionality of soil.
4.3. Changes in Bacterial Abundance with Biochar Application
Biochar changes the soil microbial community distribution because the inhibition or enhancement of specific bacterial communities is induced by adsorption or nutrients supplied by biochar [56]. In the present study, Proteobacteria, Chloroflexi, Acidobacteria, Bacteroidetes, Actinobacteria, Gemmatimonadetes, Nitrospirae as well as Ignavibacteriae were the predominant (>2%) phyla in all four treatments (Figure 2a). Proteobacteria occupied the highest proportions (39.1%–40.4%) of the bacterial sequences under four treatments, which supported the findings of other researchers [19,57,58]. Furthermore, the relative abundance of Chloroflexi, Bacteroidetes and Nitrospirae increased in the soil amended with biochar. In contrast, Acidobacteria, Actinobacteria and Ignavibacteriae decreased with biochar amendments. Among them, it was observed that Acidobacteria and Nitrospirae were the most sensitive phyla (Figure 1). Meanwhile, the relative abundance of Acidobacteria declined (from 13.1% to 10.5%) significantly with the increase in biochar dosage, probably because biochar increased soil pH, as observed by Xu et al. [59]. Acidobacteria are generally the dominant bacteria in oligotrophic and low pH soils [57,60], and their decline in abundance might result from an enhancement of soil pH after biochar amendment. However, the relative abundance of Nitrospirae increased (from 2.2% to 3.8%) significantly along with the increase in biochar dosage. Nitrospirae are important N cycling bacteria that participate in nitrification in agricultural soils [59], which could be related to significantly higher total N content in biochar amended soil (Table 1).
At the genus level, the bacteria abundance was significantly distinct between biochar amended and non-amended samples (Figure 2b, Supplementary Materials, Table S2). Among them, the relative abundance of uncultured Nitrosomonadaceae, uncultured Gemmatimonadaceae, uncultured Nitrospiraceae and Magnetovibrio increased in biochar amended soils. Previous researchers have revealed that the variation in environmental factors affected bacterial community structure through both direct and indirect mechanisms [61]. Among these factors, soil pH has the most influence on microbial community structure. More than half of the total changes in soil microorganisms resulted from the change of soil pH [62]. Nielsen et al. [63] revealed that among all the chemical variables of soil, pH had the strongest correlation with the microbial community, and an increase of 0.2–0.3 units after biochar amendment can cause changes in the microbial community. Our study showed that the average pH of biochar amended soils increased by 0.44 units over non-biochar treatment soils (Table 1), which may be an essential reason for the changes in bacterial abundance in biochar-added soils. Moreover, the relative abundance of beneficial bacteria with nitrogen cycling functions was altered in biochar-added soils. Meanwhile, the relative abundance of uncultured Nitrospiraceae and uncultured Nitrosomonadaceae was increased in the biochar-amended soils, both of which are functional bacterial genera directly involved with nitrogen cycling of soil. The relative abundance of uncultured Nitrospiraceae in C1, C2 and C3 were 16.9%, 42.8% and 73.6% higher than that in C0, respectively (Figure 2b). Previous studies have proved that the growth in nitrogen cycling microorganisms was stimulated by biochar [23,62], and the higher relative abundance of the two kinds of bacteria indicate that biochar could effectively promote the nitrogen cycle in soil. Our study demonstrated that biochar has a long term effect on the alteration of the relative abundance of soil bacteria. In addition, the proportion of some functional bacteria increased, which could promote nitrogen cycling in the soil.
4.4. Relationship between Bacterial Community Structure and Soil Parameters
Many recent studies have reported that the structure of the soil microbial community could be affected by biochar application [15,26,55]. The present study demonstrated similar results to those of previous studies. NMDS indicated that six-year biochar application caused a clear and considerable difference in bacterial community structure between biochar-added and non-biochar-added soils (Figure 3). The result was consistent with that of Yao et al. [26] and Zhang et al. [64], where biochar amendment not only changed the soil parameters but also induced bacterial community separation in soil. In the long term, the change in soil characteristics caused by biochar was the main reason for the modification of the microbial community, which is different from the short-term experiments. The labile C in biochar can degrade rapidly in a short period, while it is difficult to use the remaining stable carbon of biochar as substrate for microorganisms [2]. The study of Kuzyakov et al. [28] also showed that the ratio of 14C, labeled black carbon incorporated into microorganism was below 3% after incubating for 624 days. However, the physicochemical changes in soil properties induced by biochar addition were still observed in biochar amended soils in the long term. Therefore, long-term addition of biochar might indirectly change soil microbial community composition through the change in soil properties [30].
The variations in the composition of the bacterial community are closely correlated with soil parameters, including soil pH [3,65], TC [44], SOC [66] as well as C/N [59], which significantly affects bacterial community composition. Our study showed that biochar significantly changed the soil properties, while the RDA results revealed that soil pH, TN, C/N, TC, TK, AN, AK was closely related to the variations in bacterial communities (Figure 4). Furthermore, soil pH, TN, C/N, TC, TK, AN and AK were closely correlated to biochar application (Table 2), indicating that biochar amendment varied bacterial community composition indirectly via changes in the soil properties. Moreover, the dominant bacterial phyla were correlated with environmental factors. Nitrospirae, Parcubacteria and Verrucomicrobia were positively correlated with PH, TN, C/N, TC, AK and AP, but negatively correlated with TK and AN. Among them, the relative abundance of Nitrospirae increased significantly with the biochar addition rate. The results indicated that long-term biochar addition was conducive to improving the nitrification of soil, thus reducing nitrogen loss.
5. Conclusions
Biochar amendment improved a number of soil physicochemical properties, including pH, TC, TN, TK and AK six years after addition in soils. Meanwhile, biochar increased bacterial diversity and modified bacterial community structure, and the relative abundance of bacteria changed significantly at phylum and genus levels. It was also found that the relative abundance of nitrogen cycling bacteria such as uncultured Nitrospiraceae and uncultured Nitrosomonadaceae increased, indicating that biochar may be beneficial for nitrogen utilization. Furthermore, the variations in bacterial communities were closely related to the change in soil pH, TN, C/N, TC, TK, AN and AK caused by biochar addition, thus, biochar affected the soil microbial community indirectly by modifying soil properties in the long term. Overall, long-term amendment with biochar promoted some aspects of soil quality and altered the composition of the soil bacterial community. Due to the variety of sources of biochar, the long-term effect of biochar derived from different organic biomass on soil quality and microbial community composition should be further studied.
Supplementary Materials
The following are available online at https://0-www-mdpi-com.brum.beds.ac.uk/2073-4395/10/5/746/s1, Table S1: Relative abundances (%) of the dominant bacterial phylum of soil with different biochar amendment, Table S2: Significant differences in taxa at the genus level.
Author Contributions
S.F. conceived and designed the experiments; S.F., J.Z. and H.D. performed the experiments and analyzed the data; S.F. wrote the paper. All authors have read and agreed to the published version of the manuscript.
Funding
This research was funded by the National Natural Science Foundation of China (31101105), Natural Science Foundation of Liaoning Province (201602657) and National Key Research and Development Program of China (2017YFD0300706).
Conflicts of Interest
The authors declare no conflict of interest.
References
- Harter, J.; Krause, H.M.; Schuettler, S.; Ruser, R.; Fromme, M.; Scholten, T.; Kappler, A.; Behrens, S. Linking N2O emissions from biochar-amended soil to the structure and function of the N-cycling microbial community. ISME J. 2014, 8, 660–674. [Google Scholar] [CrossRef]
- Lehmann, J.; Rillig, M.C.; Thies, J.; Masiello, C.A.; Hockaday, W.C.; Crowley, D. Biochar effects on soil biota—A review. Soil Biol. Biochem. 2011, 43, 1812–1836. [Google Scholar] [CrossRef]
- Wang, N.; Chang, Z.Z.; Xue, X.M.; Yu, J.G.; Shi, X.X.; Ma, L.Q.; Li, H.B. Biochar decreases nitrogen oxide and enhances methane emissions via altering microbial community composition of anaerobic paddy soil. Sci. Total Environ. 2017, 581–582, 689–696. [Google Scholar] [CrossRef] [PubMed]
- Zhang, A.F.; Cheng, G.; Hussain, Q.; Zhang, M.; Feng, H.; Dyck, M.; Sun, B.H.; Zhao, Y.; Chen, H.X.; Chen, J.; et al. Contrasting effects of straw and straw–derived biochar application on net global warming potential in the Loess Plateau of China. Field Crops Res. 2017, 205, 45–54. [Google Scholar] [CrossRef]
- Bruun, E.W.; Ambus, P.; Egsgaard, H.; Hauggaard-Nielsen, H. Effects of slow and fast pyrolysis biochar on soil C and N turnover dynamics. Soil Biol. Biochem. 2012, 46, 73–79. [Google Scholar] [CrossRef]
- Li, S.L.; Liang, C.T.; Shangguan, Z.P. Effects of apple branch biochar on soil C mineralization and nutrient cycling under two levels of N. Sci. Total Environ. 2017, 607–608, 109–119. [Google Scholar] [CrossRef]
- O’Connor, D.; Peng, T.Y.; Zhang, J.L.; Tsang, D.C.W.; Alessi, D.S.; Shen, Z.T.; Bolan, N.S.; Hou, D.Y. Biochar application for the remediation of heavy metal polluted land: A review of in situ field trials. Sci. Total Environ. 2018, 619–620, 815–826. [Google Scholar] [CrossRef]
- Obia, A.; Børresen, T.; Martinsen, V.; Cornelissen, G.; Mulder, J. Effect of biochar on crust formation, penetration resistance and hydraulic properties of two coarse textured tropical soils. Soil Tillage Res. 2017, 170, 114–121. [Google Scholar] [CrossRef] [Green Version]
- Zhang, Q.Q.; Song, Y.F.; Wu, Z.; Yan, X.Y.; Gunina, A.; Kuzyakov, Y.; Xiong, Z.Q. Effects of six-year biochar amendment on soil aggregation, crop growth, and nitrogen and phosphorus use efficiencies in a rice-wheat rotation. J. Cleaner Prod. 2020, 242, 118435. [Google Scholar] [CrossRef]
- Azeema, M.; Hayat, R.; Hussain, Q.; Ahmed, M.; Pan, G.X.; Tahir, M.I.; Imran, M.; Irfan, M.; Ul-Hassan, M. Biochar improves soil quality and N2-fixation and reduces net ecosystem CO2 exchange in a dryland legume-cereal cropping system. Soil Tillage Res. 2019, 186, 172–182. [Google Scholar] [CrossRef]
- Zhang, J.N.; Zhou, S.; Sun, H.F.; Lü, F.; He, P.J. Three-year rice grain yield responses to coastal mudflat soil properties amended with straw biochar. J. Environ. Manag. 2019, 239, 23–29. [Google Scholar] [CrossRef] [PubMed]
- Oladele, S.O. Changes in physicochemical properties and quality index of an Alfisol after three years of rice husk biochar amendment in rainfed rice—Maize cropping sequence. Geoderma 2019, 353, 359–371. [Google Scholar] [CrossRef]
- Ulyett, J.; Sakrabani, R.; Kibblewhite, M.; Hann, M. Impact of biochar addition on water retention, nitrification and carbon dioxide evolution from two sandy loam soils. Eur. J. Soil Sci. 2014, 65, 96–104. [Google Scholar] [CrossRef]
- Kinney, T.J.; Masiello, C.A.; Dugan, B.; Hockaday, W.C.; Dean, M.R.; Zygourakis, K.; Barnes, R.T. Hydrologic properties of biochars produced at different temperatures. Biomass Bioenerg. 2012, 41, 34–43. [Google Scholar] [CrossRef]
- Liu, Y.X.; Lu, H.H.; Yang, S.G.; Wang, Y.F. Impacts of biochar addition on rice yield and soil properties in a cold waterlogged paddy for two crop seasons. Field Crops Res. 2016, 191, 161–167. [Google Scholar] [CrossRef]
- Wang, C.; Liu, J.Y.; Shen, J.L.; Chen, D.; Li, Y.; Jiang, B.S.; Wu, J.S. Effects of biochar amendment on net greenhouse gas emissions and soil fertility in a double rice cropping system: A 4-year field experiment. Agric. Ecosyst. Environ. 2018, 262, 83–96. [Google Scholar] [CrossRef]
- Van Zwieten, L.; Kimber, S.; Morris, S.; Chan, K.Y.; Downie, A.; Rust, J.; Joseph, S.; Cowie, A. Effects of biochar from slow pyrolysis of papermill waste on agronomic performance and soil fertility. Plant Soil 2010, 327, 235–246. [Google Scholar] [CrossRef]
- Tan, Z.X.; Lin, C.S.K.; Ji, X.Y.; Rainey, T.J. Returning biochar to fields: A review. Appl. Soil Ecol. 2017, 116, 1–11. [Google Scholar] [CrossRef]
- Xu, M.; Xia, H.X.; Wu, J.; Yang, G.; Zhang, X.H.; Peng, H.; Yu, X.Y.; Li, L.; Xiao, H.; Qi, H. Shifts in the relative abundance of bacteria after wine-lees-derived biochar intervention in multi metal-contaminated paddy soil. Sci. Total Environ. 2017, 599–600, 1297–1307. [Google Scholar] [CrossRef]
- Bardgett, R.D.; Freeman, C.; Ostle, N.J. Microbial contributions to climate change through carbon cycle feedbacks. ISME J. 2008, 2, 805–814. [Google Scholar] [CrossRef] [Green Version]
- Griffiths, B.S.; Bonkowski, M.; Roy, J.; Ritz, K. Functional stability: Substrate utilisation and biological indicators of soils following environmental impacts. Appl. Soil Ecol. 2001, 16, 49–61. [Google Scholar] [CrossRef]
- Zhu, X.M.; Chen, B.L.; Zhu, L.Z.; Xing, B.S. Effects and mechanisms of biochar-microbe interactions in soil improvement and pollution remediation: A review. Environ. Pollut. 2017, 227, 98–115. [Google Scholar] [CrossRef] [PubMed]
- Chen, J.H.; Liu, X.Y.; Li, L.Q.; Zheng, J.W.; Qu, J.J.; Zheng, J.F.; Zhang, X.H.; Pan, G.X. Consistent increase in abundance and diversity but variable change in community composition of bacteria in topsoil of rice paddy under short term biochar treatment across three sites from South China. Appl. Soil Ecol. 2015, 91, 68–79. [Google Scholar] [CrossRef]
- Dong, X.L.; Li, G.T.; Lin, Q.M.; Zhao, X.R. Quantity and quality changes of biochar aged for 5 years in soil under field conditions. Catena 2017, 159, 136–143. [Google Scholar] [CrossRef]
- Kookana, R.S.; Sarmah, A.K.; Van Zwieten, L.; Krull, E.; Singh, B. Biochar application to soil: Agronomic and environmental benefits and unintended consequences. Adv. Agron. 2011, 112, 103–143. [Google Scholar]
- Yao, Q.; Liu, J.J.; Yu, Z.H.; Li, Y.S.; Jin, J.; Liu, X.B.; Wang, G.H. Three years of biochar amendment alters soil physiochemical properties and fungal community composition in a black soil of northeast China. Soil Biol. Biochem. 2017, 110, 56–67. [Google Scholar] [CrossRef]
- Jin, Z.W.; Chen, C.; Chen, X.M.; Hopkins, I.; Zhang, X.L.; Han, Z.Q.; Jiang, F.; Billy, G. The crucial factors of soil fertility and rapeseed yield—A five year field trial with biochar addition in upland red soil, China. Sci. Total Environ. 2019, 649, 1467–1480. [Google Scholar] [CrossRef]
- Kuzyakov, Y.; Subbotina, I.; Chen, H.Q.; Bogomolova, I.; Xu, X.L. Black carbon decomposition and incorporation into microbial biomass estimated by 14C labeling. Soil Biol. Biochem. 2009, 41, 210–219. [Google Scholar] [CrossRef]
- Major, J.; Lehmann, J.; Rondon, M.; Goodale, C. Fate of soil-applied black carbon: Downward migration, leaching and soil respiration. Glob. Chang. Biol. 2010, 16, 1366–1379. [Google Scholar] [CrossRef]
- Kolton, M.; Harel, Y.M.; Pasternak, P.; Graber, E.R.; Elad, Y.; Cytryn, E. Impact of biochar application to soil on the root-associated bacterial community structure of fully developed greenhouse pepper plants. Appl. Environ. Microbiol. 2011, 77, 4924–4930. [Google Scholar] [CrossRef] [Green Version]
- IUSS Working Group WRB. World Soil Resources Reports 106. In World Reference Base for Soil Resources 2014, International Soil Classification System for Naming Soils and Creating Legends for Soil Maps; FAO: Rome, Italy, 2015. [Google Scholar]
- Bao, S.D. Soil and Agrochemical Analysis; China Agriculture Press: Beijing, China, 2000. [Google Scholar]
- Magoč, T.; Salzberg, S.L. FLASH: Fast length adjustment of short reads to improve genome assemblies. Bioinformatics 2011, 27, 2957–2963. [Google Scholar] [CrossRef]
- Pearson, W.R.; Wood, T.; Zhang, Z.; Miller, W. Comparison of DNA sequences with protein sequences. Genomics 1997, 46, 24–36. [Google Scholar] [CrossRef] [Green Version]
- Bolger, A.M.; Lohse, M.; Usadel, B. Trimmomatic: A flexible trimmer for illumina sequence data. Bioinformatics 2014, 30, 2114–2120. [Google Scholar] [CrossRef] [Green Version]
- Edgar, R.C.; Haas, B.J.; Clemente, J.C.; Quince, C.; Knight, R. UCHIME improves sensitivity and speed of chimera detection. Bioinformatics 2011, 27, 2194–2200. [Google Scholar] [CrossRef] [Green Version]
- Edgar, R.C. Search and clustering orders of magnitude faster than BLAST. Bioinformatics 2010, 26, 2460–2461. [Google Scholar] [CrossRef] [Green Version]
- Quast, C.; Pruesse, E.; Yilmaz, P.; Gerken, J.; Schweer, T.; Yarza, P.; Peplies, J.; Glӧckner, F.O. The SILVA ribosomal RNA gene database project: Improved data processing and web-based tools. Nucleic Acids Res. 2013, 41, D590–D596. [Google Scholar] [CrossRef]
- Malghani, S.; Kim, J.; Lee, S.H.; Yoo, G.Y.; Kang, H. Application of two contrasting rice-residue-based biochars triggered gaseous loss of nitrogen under denitrification-favoring conditions: A short-term study based on acetylene inhibition technique. Appl. Soil Ecol. 2018, 127, 112–119. [Google Scholar] [CrossRef]
- Chen, Z.M.; Wang, H.Y.; Liu, X.W.; Zhao, X.L.; Lu, D.J.; Zhou, J.M.; Li, C.Z. Changes in soil microbial community and organic carbon fractions under short-term straw return in a rice–wheat cropping system. Soil Tillage Res. 2017, 165, 121–127. [Google Scholar] [CrossRef]
- Futa, B.; Oleszczuk, P.; Andruszczak, S.; Kwiecińska-Poppe, E.; Kraska, P. Effect of natural aging of biochar on soil enzymatic activity and physicochemical properties in long-term field experiment. Agronomy 2020, 10, 449. [Google Scholar] [CrossRef] [Green Version]
- Novak, J.M.; Frederick, J.R.; Bauer, P.J. Rebuilding organic carbon contents in coastal plain soils using conservation tillage systems. Soil Sci. Soc. Am. J. 2009, 73, 622–629. [Google Scholar] [CrossRef]
- Carvalho, M.T.M.; Madari, B.E.; Bastiaans, L.; Van Oort, P.A.J.; Leal, W.G.O.; Heinemann, A.B.; Da Silva, M.A.S.; Maia, A.H.N.; Parsons, D.; Meinke, H. Properties of a clay soil from 1.5 to 3.5 years after biochar application and the impact on rice yield. Geoderma 2016, 276, 7–18. [Google Scholar] [CrossRef]
- Nan, Q.; Wang, C.; Wang, H.; Yi, Q.Q.; Liang, B.Q.; Xu, J.; Wu, W.X. Biochar drives microbially-mediated rice production by increasing soil carbon. J. Hazard. Mater. 2020, 387. [Google Scholar] [CrossRef] [PubMed]
- Laird, D.A.; Fleming, P.; Davis, D.D.; Horton, R.; Wang, B.Q.; Karlen, D.L. Impact of biochar amendments on the quality of a typical Midwestern agricultural soil. Geoderma 2010, 158, 443–449. [Google Scholar] [CrossRef] [Green Version]
- Kuzyakov, Y.; Bogomolova, I.; Glaser, B. Biochar stability in soil: Decomposition during eight years and transformation as assessed by compound specific 14C analysis. Soil Biol. Biochem. 2014, 70, 229–236. [Google Scholar] [CrossRef]
- Laird, D.; Fleming, P.; Wang, B.Q.; Horton, R.; Karlen, D. Biochar impact on nutrient leaching from a Midwestern agricultural soil. Geoderma 2010, 158, 436–442. [Google Scholar] [CrossRef] [Green Version]
- Anderson, C.R.; Condron, L.M.; Clough, T.J.; Fiers, M.; Stewart, A.; Hill, R.A.; Sherlock, R.R. Biochar induced soil microbial community change: Implications for biogeochemical cycling of carbon, nitrogen and phosphorus. Pedobiologia 2011, 54, 309–320. [Google Scholar] [CrossRef]
- Huang, X.F.; Li, S.Q.; Li, S.Y.; Ye, G.Y.; Lu, L.J.; Zhang, L.; Yang, L.Y.; Qian, X.; Liu, J. The effects of biochar and dredged sediments on soil structure and fertility promote the growth, photosynthetic and rhizosphere microbial diversity of Phragmites communis (Cav.) Trin. ex Steud. Sci. Total Environ. 2019, 697, 134073. [Google Scholar] [CrossRef]
- Hussain, M.; Farooq, M.; Nawaz, A.; Al-Sadi, A.M.; Solaiman, Z.M.; Alghamdi, S.S.; Ammara, U.; Ok, Y.S.; Siddique, K.H.M. Biochar for crop production: Potential benefits and risks. J. Soils Sediments 2017, 17, 685–716. [Google Scholar] [CrossRef]
- Liang, B.; Lehmann, J.; Solomon, D.; Kinyangi, J.; Grossman, J.; O’Neill, B.; Skjemstad, J.O.; Thies, J.; Luizão, F.J.; Petersen, J.; et al. Black carbon increases cation exchange capacity in soils. Soil Sci. Soc. Am. J. 2006, 70, 1719–1730. [Google Scholar] [CrossRef] [Green Version]
- Rutgers, M.; Van’t Verlaat, I.M.; Wind, B.; Posthuma, L.; Breure, A.M. Rapid method for assessing pollution-induced community tolerance in contaminated soil. Environ. Toxicol. Chem. 1998, 17, 2210–2213. [Google Scholar] [CrossRef]
- Tian, X.P.; Wang, L.; Hou, Y.H.; Wang, H.; Tsang, Y.F.; Wu, J.H. Responses of soil sicrobial community structure and activity to incorporation of straws and straw biochars and their effects on soil respiration and soil organic carbon turnover. Pedosphere 2019, 29, 492–503. [Google Scholar] [CrossRef]
- Doan, T.T.; Bouvier, C.; Bettarel, Y.; Bouvier, T.; Henry-des-Tureaux, T.; Janeau, L.J.; Lamballe, P.; Van Nguyen, B.; Jouquet, P. Influence of buffalo manure, compost, vermicompost and biochar amendments on bacterial and viral communities in soil and adjacent aquatic systems. Appl. Soil Ecol. 2014, 73, 78–86. [Google Scholar] [CrossRef]
- Cole, E.J.; Zandvakili, O.R.; Blanchard, J.; Xing, B.S.; Hashemi, M.; Etemadi, F. Investigating responses of soil bacterial community composition to hardwood biochar amendment using high-throughput PCR sequencing. Appl. Soil Ecol. 2019, 136, 80–85. [Google Scholar] [CrossRef]
- Chen, Z.; Wang, Y.P.; Xia, D.; Jiang, X.L.; Fu, D.; Shen, L.; Wang, H.T.; Li, Q.B. Enhanced bioreduction of iron and arsenic in sediment by biochar amendment influencing microbial community composition and dissolved organic matter content and composition. J. Hazard. Mater. 2016, 311, 20–29. [Google Scholar] [CrossRef]
- Zheng, J.F.; Chen, J.H.; Pan, G.X.; Liu, X.Y.; Zhang, X.H.; Li, L.Q.; Bian, R.J.; Cheng, K.; Zheng, J.W. Biochar decreased microbial metabolic quotient and shifted community composition four years after a single incorporation in a slightly acid rice paddy from southwest China. Sci. Total Environ. 2016, 571, 206–217. [Google Scholar] [CrossRef]
- Meng, L.L.; Sun, T.; Li, M.Y.; Saleem, M.; Zhang, Q.M.; Wang, C.X. Soil-applied biochar increases microbial diversity and wheat plant performance under herbicide fomesafen stress. Ecotoxicol. Environ. Saf. 2019, 171, 75–83. [Google Scholar] [CrossRef]
- Xu, N.; Tan, G.C.; Wang, H.Y.; Gai, X.P. Effect of biochar additions to soil on nitrogen leaching, microbial biomass and bacterial community structure. Eur. J. Soil Biol. 2016, 74, 1–8. [Google Scholar] [CrossRef]
- Jenkins, J.R.; Viger, M.; Arnold, E.C.; Harris, Z.M.; Ventura, M.; Miglietta, F.; Girardin, C.; Edwards, R.J.; Rumpel, C.; Fornasier, F.; et al. Biochar alters the soil microbiome and soil function: Results of next-generation amplicon sequencing across Europe. GCB Bioenergy 2017, 9, 591–612. [Google Scholar] [CrossRef]
- Peter, H.; Sommaruga, R. Shifts in diversity and function of lake bacterial communities upon glacier retreat. ISME J. 2016, 10, 1545–1554. [Google Scholar] [CrossRef]
- Xu, H.J.; Wang, X.H.; Li, H.; Yao, H.Y.; Su, J.Q.; Zhu, Y.G. Biochar impacts soil microbial community composition and nitrogen cycling in an acidic soil planted with rape. Environ. Sci. Technol. 2014, 48, 9391–9399. [Google Scholar] [CrossRef]
- Nielsen, S.; Minchin, T.; Kimber, S.; Van Zwieten, L.; Gilbert, J.; Munroe, P.; Joseph, S.; Thomas, T. Comparative analysis of the microbial communities in agricultural soil amended with enhanced biochars or traditional fertilisers. Agric. Ecosyst. Environ. 2014, 191, 73–82. [Google Scholar] [CrossRef]
- Zhang, C.S.; Lin, Y.; Tian, X.Y.; Xu, Q.; Chen, Z.H.; Lin, W. Tobacco bacterial wilt suppression with biochar soil addition associates to improved soil physiochemical properties and increased rhizosphere bacteria abundance. Appl. Soil Ecol. 2017, 112, 90–96. [Google Scholar] [CrossRef]
- Lauber, C.L.; Hamady, M.; Knight, R.; Fierer, N. Pyrosequencing-based assessment of soil pH as a predictor of soil bacterial community structure at the continental scale. Appl. Environ. Microb. 2009, 75, 5111–5120. [Google Scholar] [CrossRef] [PubMed] [Green Version]
- Liu, X.Y.; Liu, C.; Gao, W.H.; Xue, C.; Guo, Z.H.; Jiang, L.; Li, F.; Liu, Y. Impact of biochar amendment on the abundance and structure of diazotrophic community in an alkaline soil. Sci. Total Environ. 2019, 688, 944–951. [Google Scholar] [CrossRef] [PubMed]
Figure 1.
Rarefaction curve of 16S rRNA genes of 97% similarity from soils amended with different biochar rate. Bars above the scatter points represent the standard error of three replicates.
Figure 1.
Rarefaction curve of 16S rRNA genes of 97% similarity from soils amended with different biochar rate. Bars above the scatter points represent the standard error of three replicates.

Figure 2.
Relative abundance of dominant microbial taxa at phylum (a) and genus (b) level in different biochar addition rate.
Figure 2.
Relative abundance of dominant microbial taxa at phylum (a) and genus (b) level in different biochar addition rate.

Figure 3.
Non-metric multidimensional scaling (NMDS) ordination of bacterial community in response to biochar addition.
Figure 3.
Non-metric multidimensional scaling (NMDS) ordination of bacterial community in response to biochar addition.

Figure 4.
Redundancy analysis (RDA) of soil microbial community and physiochemical characteristics of biochar amended soils. TC, total carbon; TN, total nitrogen; TP, total phosphorus; TK, total potassium; AN, available nitrogen; AP, available phosphorus and AK, available potassium.
Figure 4.
Redundancy analysis (RDA) of soil microbial community and physiochemical characteristics of biochar amended soils. TC, total carbon; TN, total nitrogen; TP, total phosphorus; TK, total potassium; AN, available nitrogen; AP, available phosphorus and AK, available potassium.


Table 1.
Soil physicochemical properties at different biochar addition rates.
| Treatment | PH | C/N | TC (g kg−1) | TN (g kg−1) | TP (g kg−1) | TK (g kg−1) | AN (mg kg−1) | AP (mg kg−1) | AK (mg kg−1) |
|---|---|---|---|---|---|---|---|---|---|
| C0 | 6.69 ± 0.08 b | 9.5 ± 0.6 d | 11.3 ± 0.8 d | 1.20 ± 0.06 c | 0.97 ± 0.03 a | 14.6 ± 0.1 a | 80.31 ± 1.19 a | 34.4 ± 3.1 b | 69.4 ± 1.7 d |
| C1 | 7.08 ± 0.04 a | 21.8 ± 3.2 c | 29.5 ± 3.5 c | 1.36 ± 0.12 c | 0.96 ± 0.04 a | 14.4 ± 0.2 a,b | 73.9 ± 0.8 b | 36.0 ± 8.9 a,b | 78.8 ± 4.0 c |
| C2 | 7.14 ± 0.04 a | 26.5 ± 2.5 b | 44.1 ± 7.9 b | 1.66 ± 0.16 b | 0.98 ± 0.05 a | 13.9 ± 0.3 b | 76.1 ± 1.3 b | 45.5 ± 4.6 a | 97.6 ± 5.7 b |
| C3 | 7.17 ± 0.06 a | 39.0 ± 3.2 a | 76.9 ± 9.6 a | 1.97 ± 0.15 a | 0.98 ± 0.05 a | 14.2 ± 0.3 a,b | 74.0 ± 2.2 b | 39.6 ± 6.5 a,b | 128.4 ± 6.1 a |
Note: Values (± standard error) are means of three replicates. “a–d”, different letters represent significant difference among treatments (p < 0.05).
Table 2.
The correlation (r) and significance (p) values of the pairwise regressions between biochar dosage and soil properties.
Table 2.
The correlation (r) and significance (p) values of the pairwise regressions between biochar dosage and soil properties.
| Property | r | p |
|---|---|---|
| pH | 0.844 | <0.001 |
| C/N | 0.968 | <0.001 |
| TC | 0.961 | <0.001 |
| TN | 0.936 | <0.001 |
| TP | 0.228 | 0.475 |
| TK | −0.544 | 0.067 |
| AN | −0.650 | 0.022 |
| AP | 0.427 | 0.166 |
| AK | 0.958 | <0.001 |
Note: The bold values represent significant correlations.
Table 3.
Illumina MiSeq sequencing of bacterial data and bacterial community diversity indices (at 97% sequence similarity) based on 16S rRNA gene.
Table 3.
Illumina MiSeq sequencing of bacterial data and bacterial community diversity indices (at 97% sequence similarity) based on 16S rRNA gene.
| Treatment | OTUs | Ace | Chao | Shannon | Simpson | Coverage (%) |
|---|---|---|---|---|---|---|
| C0 | 1649 ± 36 b | 1714 ± 18 c | 1738 ± 25 c | 6.26 ± 0.07 a | 0.0065 ± 0.0013 a | 99.6 |
| C1 | 1751 ± 31 a | 1803 ± 5 b | 1807 ± 8 b | 6.45 ± 0.05 a | 0.0043 ± 0.0004 a | 99.6 |
| C2 | 1794 ± 18 a | 1837 ± 7 a | 1855 ± 10 a | 6.41 ± 0.02 a | 0.0050 ± 0.0002 a | 99.7 |
| C3 | 1780 ± 39 a | 1827 ± 18 a | 1838 ± 14 a | 6.37 ± 0.06 a | 0.0054 ± 0.0006 a | 99.7 |
Note: Values (± standard error) are means of three replicates. “a–c”, different letters represent significant difference among treatments (p < 0.05).
© 2020 by the authors. Licensee MDPI, Basel, Switzerland. This article is an open access article distributed under the terms and conditions of the Creative Commons Attribution (CC BY) license (http://creativecommons.org/licenses/by/4.0/).
Share and Cite
MDPI and ACS Style
Fan, S.; Zuo, J.; Dong, H. Changes in Soil Properties and Bacterial Community Composition with Biochar Amendment after Six Years. Agronomy 2020, 10, 746. https://0-doi-org.brum.beds.ac.uk/10.3390/agronomy10050746
AMA Style
Fan S, Zuo J, Dong H. Changes in Soil Properties and Bacterial Community Composition with Biochar Amendment after Six Years. Agronomy. 2020; 10(5):746. https://0-doi-org.brum.beds.ac.uk/10.3390/agronomy10050746
Chicago/Turabian StyleFan, Shuxiu, Jiacheng Zuo, and Hangyu Dong. 2020. "Changes in Soil Properties and Bacterial Community Composition with Biochar Amendment after Six Years" Agronomy 10, no. 5: 746. https://0-doi-org.brum.beds.ac.uk/10.3390/agronomy10050746
Note that from the first issue of 2016, this journal uses article numbers instead of page numbers. See further details here.