Article

Quality Improvement of Netted Melon (Cucumis melo L. var. reticulatus) through Precise Nitrogen and Potassium Management in a Hydroponic System

1
Department of Bioenvironmental Systems Engineering, National Taiwan University, Taipei 10617, Taiwan
2
Department of Horticulture and Landscape Architecture, National Taiwan University, Taipei 10617, Taiwan
3
Centre for Biotechnology, National Taiwan University, Taipei 10672, Taiwan
*
Author to whom correspondence should be addressed.
Co-first authors.
Submission received: 28 April 2020 / Revised: 31 May 2020 / Accepted: 4 June 2020 / Published: 9 June 2020
(This article belongs to the Collection Nutrition Management of Hydroponic Vegetable Crops)

Abstract

:
The quality-oriented fruit production in well-controlled enclosed hydroponic systems has been greatly enhanced by the technology of precision agriculture. Over-fertilisation has been commonly applied to the traditional hydroponic culture of fruit crops, without considering different nutrient demands during development. Adjusting the nutrient formulations depending on crop developmental stages could enable efficient fertilisation to increase yield quality. In this study, N-reduced and K-modified nutrient solutions were applied for a two-step nutrient manipulation experiment, to improve the fruit quality (Experiment I) and optimise the fertilisation schemes (Experiment II) of hydroponic netted melon (Cucumis melo L. var. reticulatus). The N-reduced and K-modified treatments, before fruiting stage in Experiment I, obtained higher fruit quality with increased fruit weight, dry matter ratio, flesh thickness, and total soluble solids. In Experiment II, fruits cultured under treatment II-3 (applied with 100-75-100% N and 100-125-75% K during VG-PYF-FEM) had the highest overall preferences, with ‘rich’ aroma, ‘dense’ texture, and ‘perfect’ sweetness, compared to all other experimental treatments. Our study successfully improved the fertilisation schemes for a hydroponic netted melon with precise N- and K-nutrient formulations specific to different developmental stages. Our study promotes the future advancement of precise fertilisation to improve fruit quality and reduce environmental pollution from farming activities.

1. Introduction

Hydroponic fruit production has extensively expanded globally in recent decades, due to the ease of nutrient management and increased efficiency of water and fertiliser use. Additionally, manipulating the nutrient levels in hydroponic solutions were effective in controlling the plant growth, yield, and fruit quality [1,2,3,4,5]. In recent years, with the rapid development of precision agriculture, crop cultivation in the closed hydroponic systems has become the best choice for well-maintaining stable cultivation conditions through fertiliser management and nutrient monitoring. Accumulated studies have confirmed the success of hydroponic culture for several vegetable crops, such as tomato, lettuce, and netted melon, through improving water use efficiency and optimising both plant growth and yield quality by finer adjustments on macronutrients, including nitrogen (N), phosphorus (P), potassium (K), calcium (Ca), or magnesium (Mg) [6,7,8,9,10,11]. N and K are the two most important macronutrients determining the plant growth, yield production, and quality [6,8,12,13,14]. This has encouraged more research effort on establishing the precise N and K fertilisation schemes for crop plants to improve yield quality and efficiency of fertiliser use, and reduce the wastage of fertilisers and associated environmental pollution.
N is one of the most important macronutrients for promoting crop growth and yield by playing multiple roles in biochemical and physiological functions in plant development [13,15,16,17]. Previous studies on cucumber, tomato, pineapple, and watermelon have confirmed that the insufficient supply of N to vegetable crops resulted in the retardation of plant development and fruit production related to a decrease in photosynthetic rate through reduction of leaf number, leaf sizes, leaf chlorophyll content, and lowering of fruit yield and biomass [16,18,19,20,21,22,23]. High N fertilisation enhanced vegetative growth in plants, but yield losses were found associated with N over-fertilisation in crop plants, such as lettuce, pineapple, watermelon, sweet cherry, and strawberry [20,21,22,23,24,25]. Additionally, excess N could be toxic to plants by changing the biochemistry and accumulating in the plants, which caused imbalances of different nutrients and poor fruit quality [26,27].
K is one of the major nutrients for the normal growth and development of plants and fruit production, and it is involved in important vital functions, including enzyme activation, charge balance and osmoregulation [28,29,30,31,32]. Maintaining an adequate K supply for fruit crops, including netted melon, tomato, or cucumber could enhance their yield and fruit quality [33,34,35,36]. Increased total soluble solids and vitamin C content were determined in netted melon with regular foliar K applications [29,34]. Additionally, K plays important roles in mitigating biotic and abiotic stresses such as diseases, saline, or cold stresses, promoting crop yield and production [32,37]. Additionally, plant K+ ion transporters and channels can transport excess K+ in exchange of NH4+ for reducing N uptake as alleviation of N toxicity in plants [38].
Netted melon (Cucumis melo L. var. reticulatus) is originated from tropical northern Africa near the equator, and has become widespread worldwide, in particular in the Middle East, Central Asia, and East Asia [39,40]. Being extremely popular in Japan, netted melon is regarded as noble fruit, because of its great appearance and the excellence of its fruit quality [41]. In 2017, a total of 12.2 kilotons netted melon was produced in Japanese nationwide markets, with the total gain of USD 562,000 in the whole year, accounting for ~6% of the Japanese fresh fruit market [41]. In Taiwan, netted melon is one of the most important fruit crops in local markets, with an annual production of 35 kilotons in 2018, bringing the total market value of USD 40,000 [42]. However, the high sensitivity of plant growth and production due to environmental conditions and fertilisation schemes has caused great difficulties of maintaining the fruit quality, and this is considered the main challenge for the cultivation of netted melon [43,44,45]. Therefore, cultivation in the closed hydroponic systems in the controlled greenhouse environment has become an increasingly common practice for growing netted melon, to minimise external abiotic interferences and enable precise nutrient management [3,46,47].
In Taiwan, the greenhouse culture of hydroponic netted melon using Sheen nutrient solution modified from Yamazaki formula has successfully produced this important economic fruit in subtropical regions in recent decades [48,49,50]. However, the success of precision agriculture for netted melon would require the improvement of the previously used nutrient formulations for soilless cultivation for two reasons. First, applying the previous nutrient formulations to modern hydroponic systems could lead to over-fertilisation for crop plants and environmental pollution. Compared to the hydroponic systems developed 30 years ago, the increased effectiveness of maintaining water levels in the modern well-controlled, enclosed hydroponic systems could successfully prevent water and nutrient loss due to leakage or evaporation, and enhance the efficiency of water and fertiliser use by crop plants [1,2,3,4,5,49,50]. Second, previous formulations did not consider the different nutrient uptake by plants during different developmental stages, such as vegetative or fruiting stages. Due to the inconsistent demands of N and K nutrients during plant development [6,12], adjustment for the fertilisation schemes, depending on precise nutrient requirement during different developmental stages, would be a crucial step for agricultural advancement.
In this study, we attempted to optimise the yield and fruit quality of a netted melon by manipulating the nutrient formulations at different developmental stages. We performed two consecutive experiments to determine the best nutrient formula for netted melon cultivated in hydroponic systems. We divided the plant growth into three developmental stages, including vegetative growth (VG), pollinated young fruit (PYF), and fruit enlargement and maturation (FEM), and then designed different nutrient formulations for the experiments. For Experiment I, two N-reduced treatments were designed to examine the effects on plant growth and fruit quality. For Experiment II, the nutrient formulations were finer N and K adjustments, to optimise fruit quality and develop the precise N and K nutrient formulations for hydroponically produced netted melon. During the two experiments, the nutrient levels and water chemistry in the hydroponic systems were regularly monitored, to investigate the nutrient utilisation by plants. Additionally, the major traits of plant growth and fruit quality, such as growth rates, leaf chlorophyll content, fruit morphology, or chemical contents of netted melon plants were measured to reveal the growth responses and fruit quality among the different nutrient treatments. Additionally, blind tasting tests by random respondents were conducted to evaluate the preferences of netted melon fruits cultivated from the different nutrient treatments, for determination of the cultivated fruits for meeting the quality demands of market. Finally, we compared the results of plant growth, fruit quality, and customers’ opinions among the different treatments, to appraise the feasibility of N-reduced and K-adjusted nutrient fertilisation for the hydroponic culture of netted melon.

2. Materials and Methods

2.1. Hydroponic Systems and Plant Materials

The present study was conducted during summer–autumn 2018 and spring–summer 2019 in the experimental greenhouse situated at the Experimental Farm of National Taiwan University, in northern Taiwan (N25.012957, E121.546937). The cultivar of netted melon (Cucumis melo L. var. reticulatus cv. Summer Line 2) was used in the experiments. All experimental individuals of netted melon plants were grown following standing culture supported by nylon ropes under natural light conditions in the hydroponic systems (Figure 1). Each hydroponic system was established from one 960 cm (L) × 28 cm (W) × 18 cm (H) channel, connecting to a 500-L buffer tank with a water pumping device maintaining the circulation of nutrient solution. One fruit per plant was maintained throughout the study.
Netted melon seeds of the study cultivar were commercially available and imported from The Yokohama Nursery Co., Ltd. in Kanagawa, Japan. Seeds were germinated in a growth chamber with an artificial light source of light emitting diode (photosynthetic active radiation in 300–400 μmol·m−2·s−1) for 16 h photoperiod. Twenty-two-day-old seedlings were then transplanted to the hydroponic channels in the greenhouse for the following experiments for growth, until the fruits were harvested. The number of days after transplanting was denoted as DAT, and seedlings of netted melon were planted in the hydroponic channels with 48 cm apart from each other. Nutrient solutions were replenished every 4 days (except for DAT0 to DAT8), based on the nutrient formulations in different treatments (refer to Section 2.2 and Section 2.3 for details of the experimental treatments) to maintain the appropriate water levels and nutrient concentrations according the experimental design. Nutrient solutions were only replenished once at DAT8 for the first 8 days, due to the small amount of water absorbed by the newly transplanted seedlings. Moreover, the pH of the hydroponic solution was adjusted for all treatments every 2 days, to avoid any pH fluctuation during the cultivation periods. The maximum height of all experimental individuals was maintained at 180 cm by pinching at the 25th node. Artificial pollination was undertaken during early PYF, and only flowers located between 12th to 15th nodes were pollinated to maintain the consistency of fruits among all plants. To ensure that every fruit obtained maximum nutrients from their parent plants, only one “good-shape” fruit in each plant was retained at later PYF. During FEM, sodium chloride (NaCl) was added 3 times at the earlier- (275 g), middle- (275 g), and later-stage of FEM (550 g) in each hydroponic channel for taste enrichment of the fruits, as it is common to eat melon flesh with sprinkled salt in Taiwan. Water temperatures in the hydroponic systems were controlled at 28–31 °C (mean = 30) during the whole cultivation period (Figure 2). Moreover, the pesticide was applied once a week in the greenhouse environment to control pests, such as white flies or aphids. Continuous monitoring of pest insects was carried out by installing 4 to 6 yellow sticky papers (21.5 × 15.0 cm) in each experimental treatment.

2.2. Experiment I: Reducing N and Modifying K Fertilisers

The first N-reduction experiments were conducted from August to October 2018. Seedlings of netted melon were transplanted to the hydroponic channels on 7 August 2018 (DAT0). Nutrient solutions were prepared based on the modified Sheen nutrient formula [49]. In this experiment, the nutrient levels were maintained at different concentrations during three developmental stages, vegetative growth, pollinated young fruit, and fruit enlargement and maturation with different formulations (Table 1). The full-strength modified Sheen nutrient solution (100% N, 100% P, and 100% K) contained 168, 31, and 195 mg/L N, P, and K, respectively, in the nutrient solution. Treatment I-1 was designed for N-reduction with 75-75-100% N during VG-PYF-FEM. K was manipulated in 75-125-100% K for I-1 during VG-PYF-FEM (Table 1). Treatment I-2 was designed for full-period N-reduction with 75-75-75% N during VG-PYF-FEM. Increased K during FEM was considered to avoid the negative effects caused by N-reduction, so that K was applied in 75-125-100% K for I-2 during VG-PYF-FEM. In the control treatment (CT), the hydroponic channels were applied with full-strength solution during the whole cultivation period. In Experiment I, the VG, PYF, and FEM stages lasted for 25 (DAT0–24), 13 (DAT25–37), and 42 (DAT38–79) days, respectively, and the nutrient solutions were changed on the first day of each stage for all treatments. The netted melon fruits were manual harvesting during 21–25 October 2018.

2.3. Experiment II: Optimisoptimisation of the Plant Growth and Fruit Quality by Finer Adjustments

The second N and K adjustment experiments were conducted from April to June 2019. Seedlings of netted melon were transplanted to the hydroponic channels on 8 April 2019 (DAT0). Nutrient solutions were prepared based on the results of Experiment I (refer to Section 3 for details). The best fruit quality was obtained from treatment I-1 with nutrient formulations of 75-75-100% N and 75-125-100% K during VG-PYF-FEM. The other three treatments were designed for finer N and K adjustments in Experiment II, for optimising the fruit quality and developing the precise nutrient formulations for hydroponic netted melon.
N and K levels were maintained at 75-75-100% N and 75-125-75% K for II-1, 100-75-100% N and 100-125-100% K for II-2, 100-75-100% N and 100-125-75% K for II-3 during VG-PYF-FEM (Table 2). Treatment I-1# was the control treatment for Experiment II with the same nutrient formulation of I-1 in Experiment I. The “#” was denoted to distinguish the control in Experiment II from treatment I-1 in Experiment I. In Experiment II, VG, PYF, and FEM stages lasted for 24 (DAT0–23), 14 (DAT24–37), and 46 (DAT38–83) days, respectively, and the nutrient solutions were changed on the first day of each stage for all treatments. The netted melon fruits were manually harvested during 24–30 June, 2019.

2.4. Nutrient Solution Monitoring and Water Chemistry Analysis

Regular monitoring for water chemistry parameters including specific conductivity (spEC, μS/cm), salinity (ppt), dissolved oxygen (DO, mg/L), oxidation-reduction potential (ORP, mV), total dissolved solid (TDS, g/L), pH, and water temperature (°C) of the nutrient solutions were carried out using multiparameter-meter (YSI Pro Plus, Yellow Springs, OH, USA) during the cultivation periods for both Experiment I and II. The monitoring of nutrient levels in the hydroponic channels was performed simultaneously with the day of nutrient solution replenishment, by collecting 100 mL water samples with 3 replicates in each treatment. The collected water samples were stored at 4 °C until analyses for nutrient and mineral contents (Ca, Mg, Na, K) in laboratory.
In the laboratory, nutrient analysis including phosphate-phosphorus (PO4-P, mg/L), nitrate- nitrogen (NO3-N, mg/L), and ammonium-nitrogen (NH4-N, mg/L) were conducted using test kits (Merck Spectroquant® Tests: No. 114848, No. 109713, and No. 114752 respectively) by spectrophotometer (Merck Spectroquant® Pharo 100, Darmstadt, Germany), following the standard protocols. Any suspended particle in the water samples was removed by passing through nylon syringe filters (pore size: 0.22 μm) for the analysis of mineral contents of the nutrient, using inductively coupled plasma optical emission spectrometry (ICP-OES). Mineral contents including Ca, Mg, Na, and K (in mg/L) were detected using ICP-OES spectrometer (Agilent 5110, Santa Clara, CA, USA), following manual instructions.

2.5. Plant Growth and Fruit Quality

Plant height at DAT5, 10, 15, and 20 were measured (to nearest 0.01 cm) to the determine growth rates of the different treatments during VG. After pinching terminal buds, the width (mm) of stem between 4th and 5th true leaves were measured by electronic vernier caliper (AnBomb, Japan). The relative leaf chlorophyll content and maximal quantum efficiency of PSII photochemistry (Fv/Fm) were measured in all experimental plant individuals during VG, PYF, and FEM, to assess the efficiency of photosynthesis during the whole experimental period of Experiment I and II. The relative chlorophyll content was measured on 10th or 11th true leaf, using the Chlorophyll Meter SPAD-502 (Konica Minolta, Tokyo, Japan) at DAT14, 32, 37, 56, and 69 for Experiment I, and measured at DAT25, 38, and 63 for Experiment II. Fv/Fm was measured by the Pocket PEA Chlorophyll Fluorimeter (Hansatech, Norfolk, UK) at DAT21, 32, 37, 56, and 69 for Experiment I, and measured at DAT25, 38, and 63 for Experiment II. During FEM, four plants in each treatment were randomly selected for leaf area (cm2) measurement of leaves located in the fruiting nodes using the software Easy Leaf Area [51].
The harvested fruits were examined for the characteristics, including fruit length (mm) and width (mm). Additionally, fruit quality traits, such as fruit weight (g), flesh thickness (mm), dry matter ratio (%), and pulp firmness (N·m2) were evaluated. Flesh thickness was the distances between seed cavity and rind. Dry matter ratio was represented by the ratio of 3-day 80 °C oven-dried pulp over fresh fruit pulp. Pulp firmness was measured by TA.XT plusC Texture Analyser (Stable Micro Systems, Surrey, UK), and the values were presented in the averages of stem-end, equatorial part, and stylar-end of fruits. In addition, fruit compositions, including total soluble solids (TSS, °Brix), total salt content (TSC, mg/g), ascorbic acid (mg/L), and nitrate (mg/L) were analysed from pureed mesocarp samples. TSS and TSC were detected by the digital refractometers (TSS: Atago PAL-1, Tokyo, Japan; TSC: Atago PAL Easy Salt, Tokyo, Japan). Ascorbic acid and nitrate contents were measured from 1-mL pureed liquids by Reflectoquant® test kits (Merck Tests: No.116981 and No.116971 respectively), following the standard protocols. Moreover, 0.5 g oven-dried fruit samples were digested with 5-mL 65% nitric acid for 3 hours at 100 °C, using a graphite digestion block (DigiPerp Jr, Quebec, Canada), following standard protocols. The digested samples were neutralised to a total volume of 25 mL by ultra-pure water. Any suspended particles in the digested samples was removed by passing through nylon syringe filters (pore size: 0.22 μm) for further analysis of fruit mineral contents, including Ca, Mg, Na, and K (in mg/100 g FW), using an ICP-OES spectrometer (Agilent 5110, Santa Clara, CA, USA), following manual instructions.

2.6. Blind Tasting Tests for Customers’ Preferences

A questionnaire was designed for the blind tasting test on the overall preference, fruit aroma, texture, sweetness, and savoury flavour, as an evaluation of the customers’ preferences of fruits cultivated from the different treatments, based on the personal perception of different fruit characteristics by random respondents as “customers’ opinions”. The results were used for determining the extent of fruits cultivated from the different treatments for market preferences. The respondents in Experiment I (N = 31) and II (N = 27) were asked to answer the questions after tasting the netted melon fruits cultivated from the unknown treatments. Each question included 3 to 5 grades from the lowest to the highest levels. The overall preferences were ‘no’, ‘weak’, ‘normal’, ‘high’, and ‘strong’. Fruit aroma was classified to ‘no’, ‘plain’, ‘normal’, ‘rich’, and ‘over’. Fruit texture included ‘watery’, ‘too soft’, ‘soft’, ‘dense’, ‘tough’. Five grades of sweetness were ‘no’, ‘not enough’, ‘normal’, ‘perfect’, and ‘over’. Three grades of savoury flavour were ‘no’, ‘good’, and ‘too much’.

2.7. Statistical Analysis

One-way ANOVA with Tukey’s post hoc test was used to determine the difference in all water chemistry parameters, plant growth parameters, and fruit traits during the three developmental stages (VG, PSF, and FEM) among the different nutrient treatments for Experiment I and II. Moreover, best subset regression was performed, to search for the subset of the most influential nutrient characteristics of the hydroponic solutions, explaining the highest variability of the growth response and fruit quality of netted melon in Experiment I and II. All statistical analyses were performed using Minitab® software (version 16).

3. Results

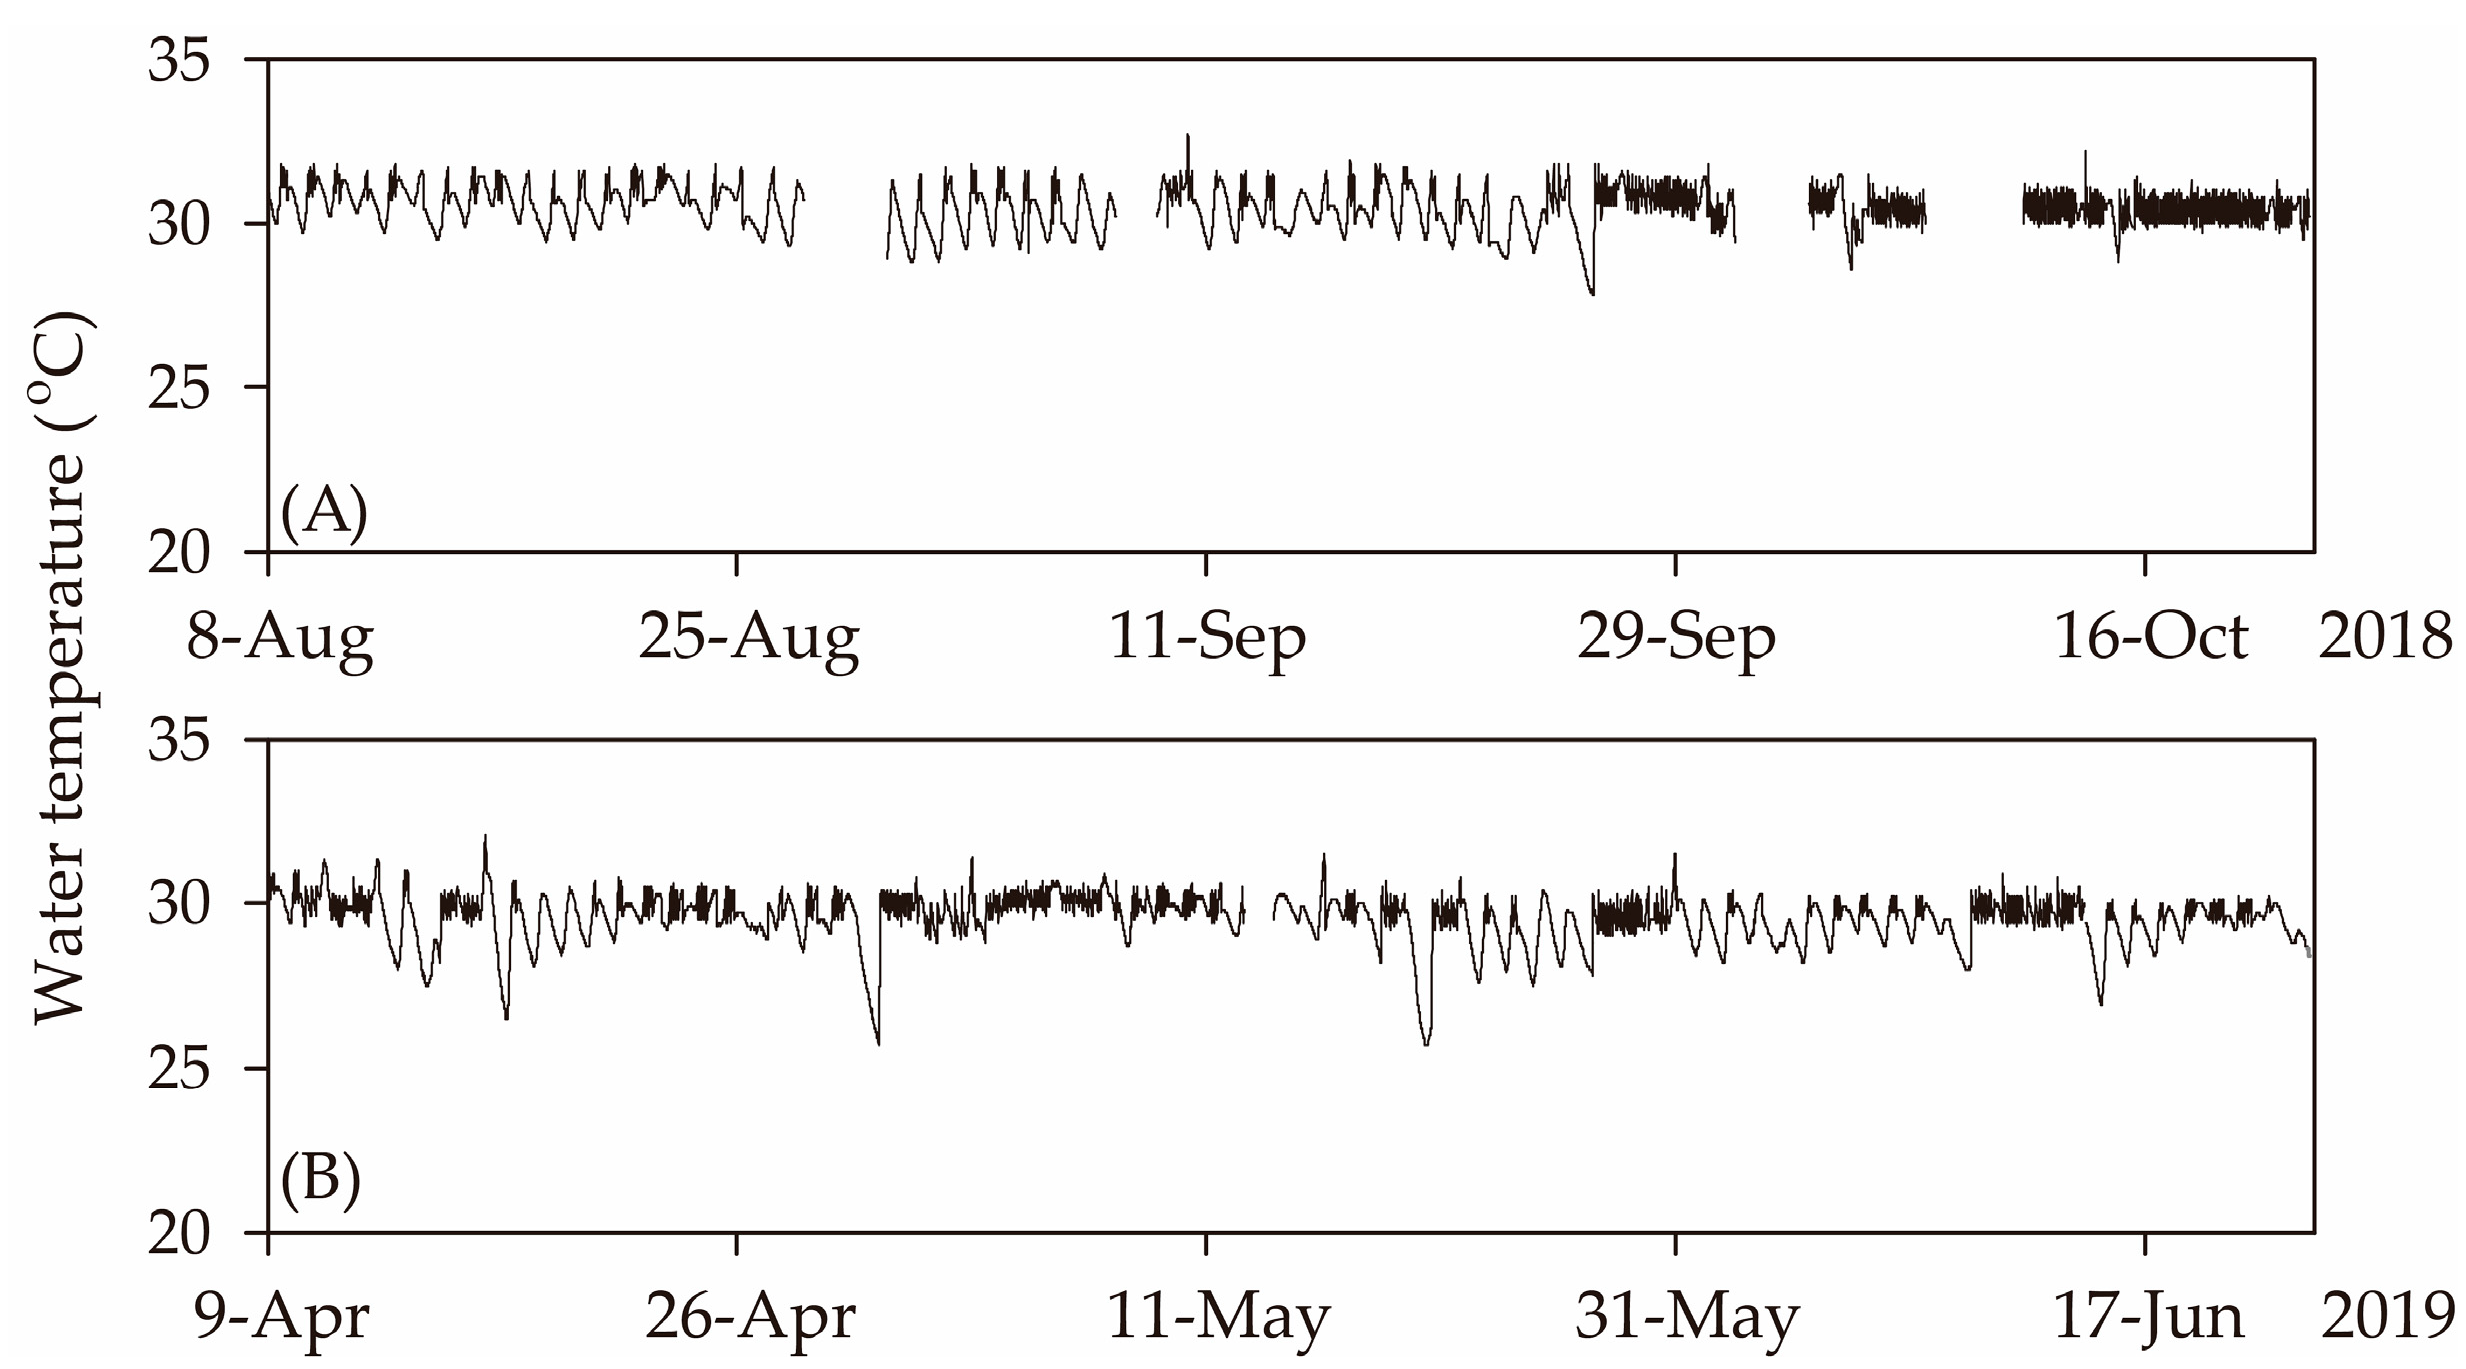
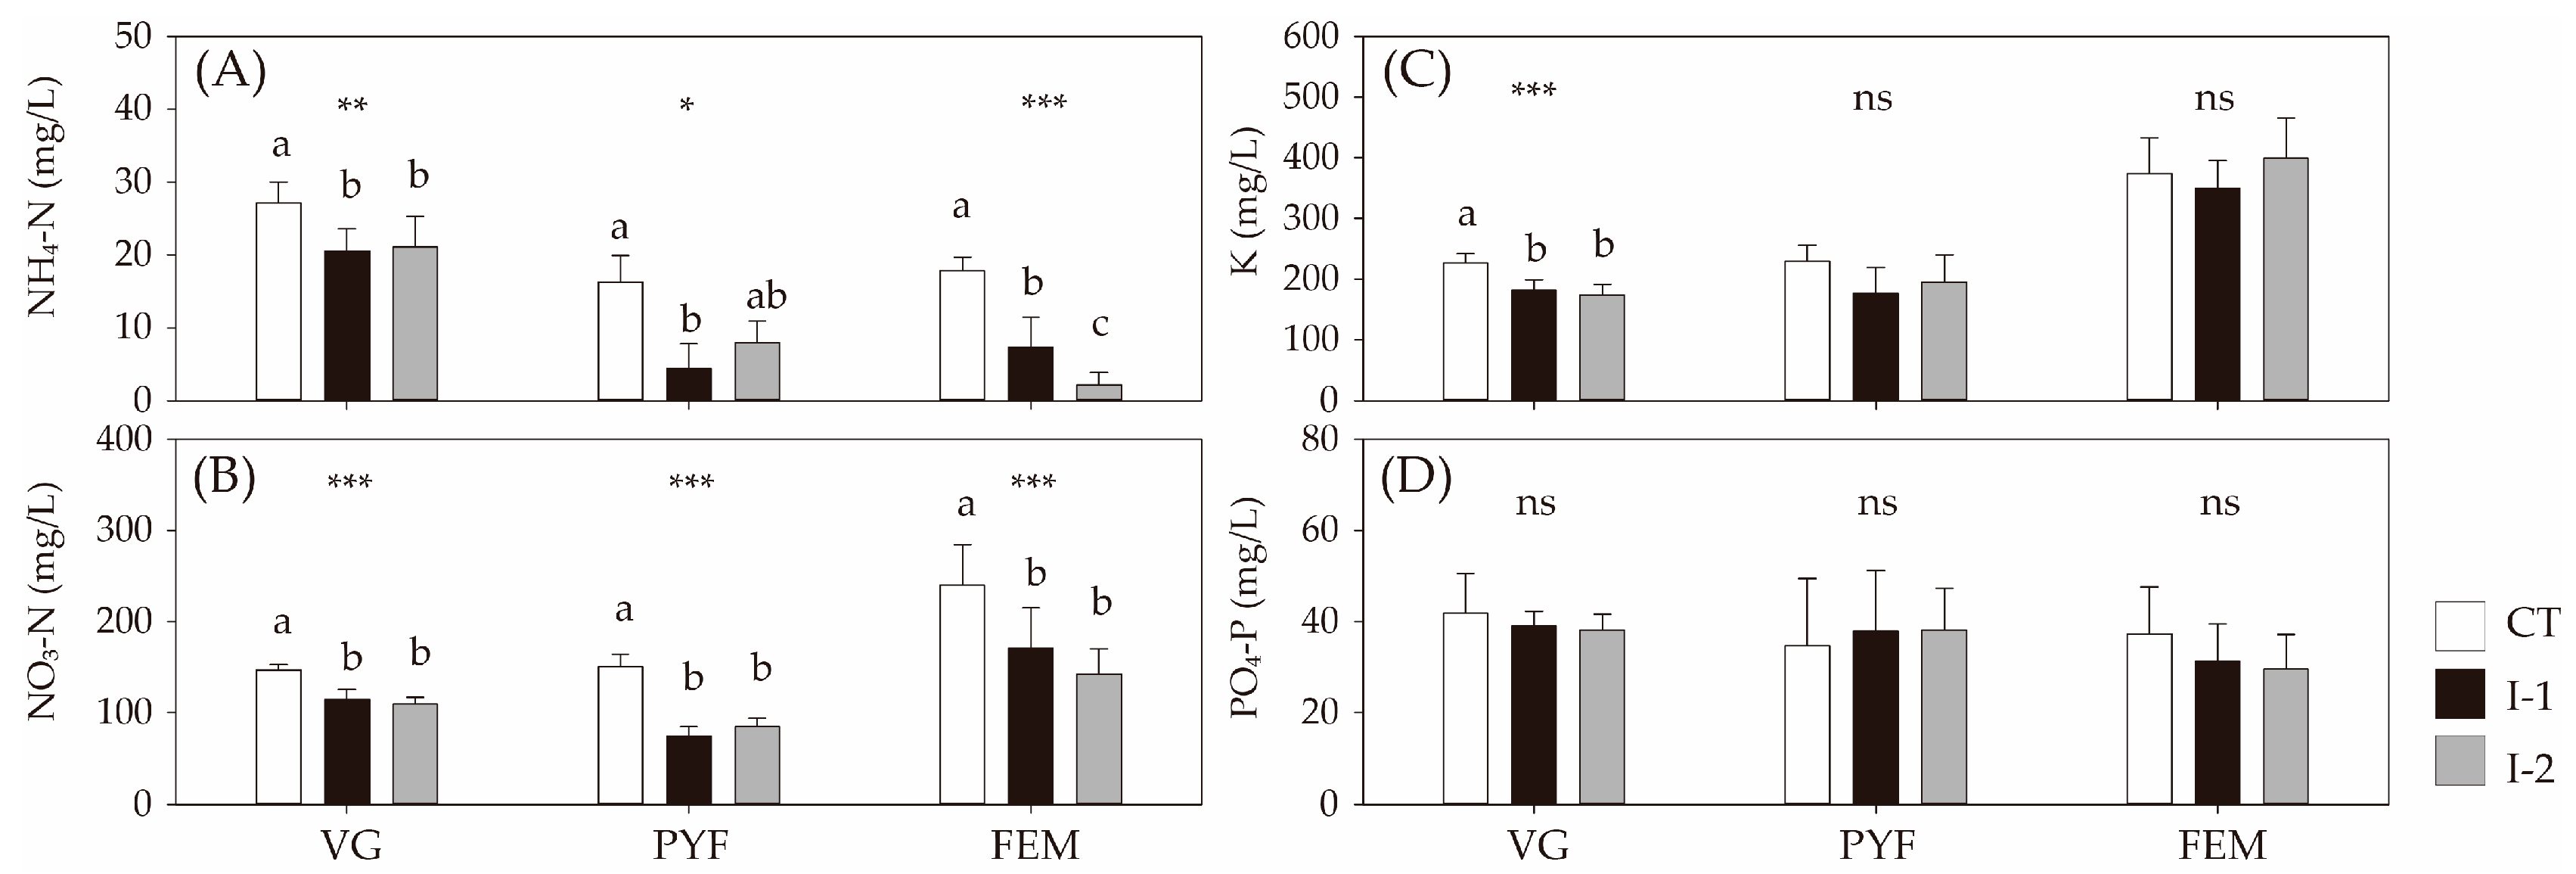
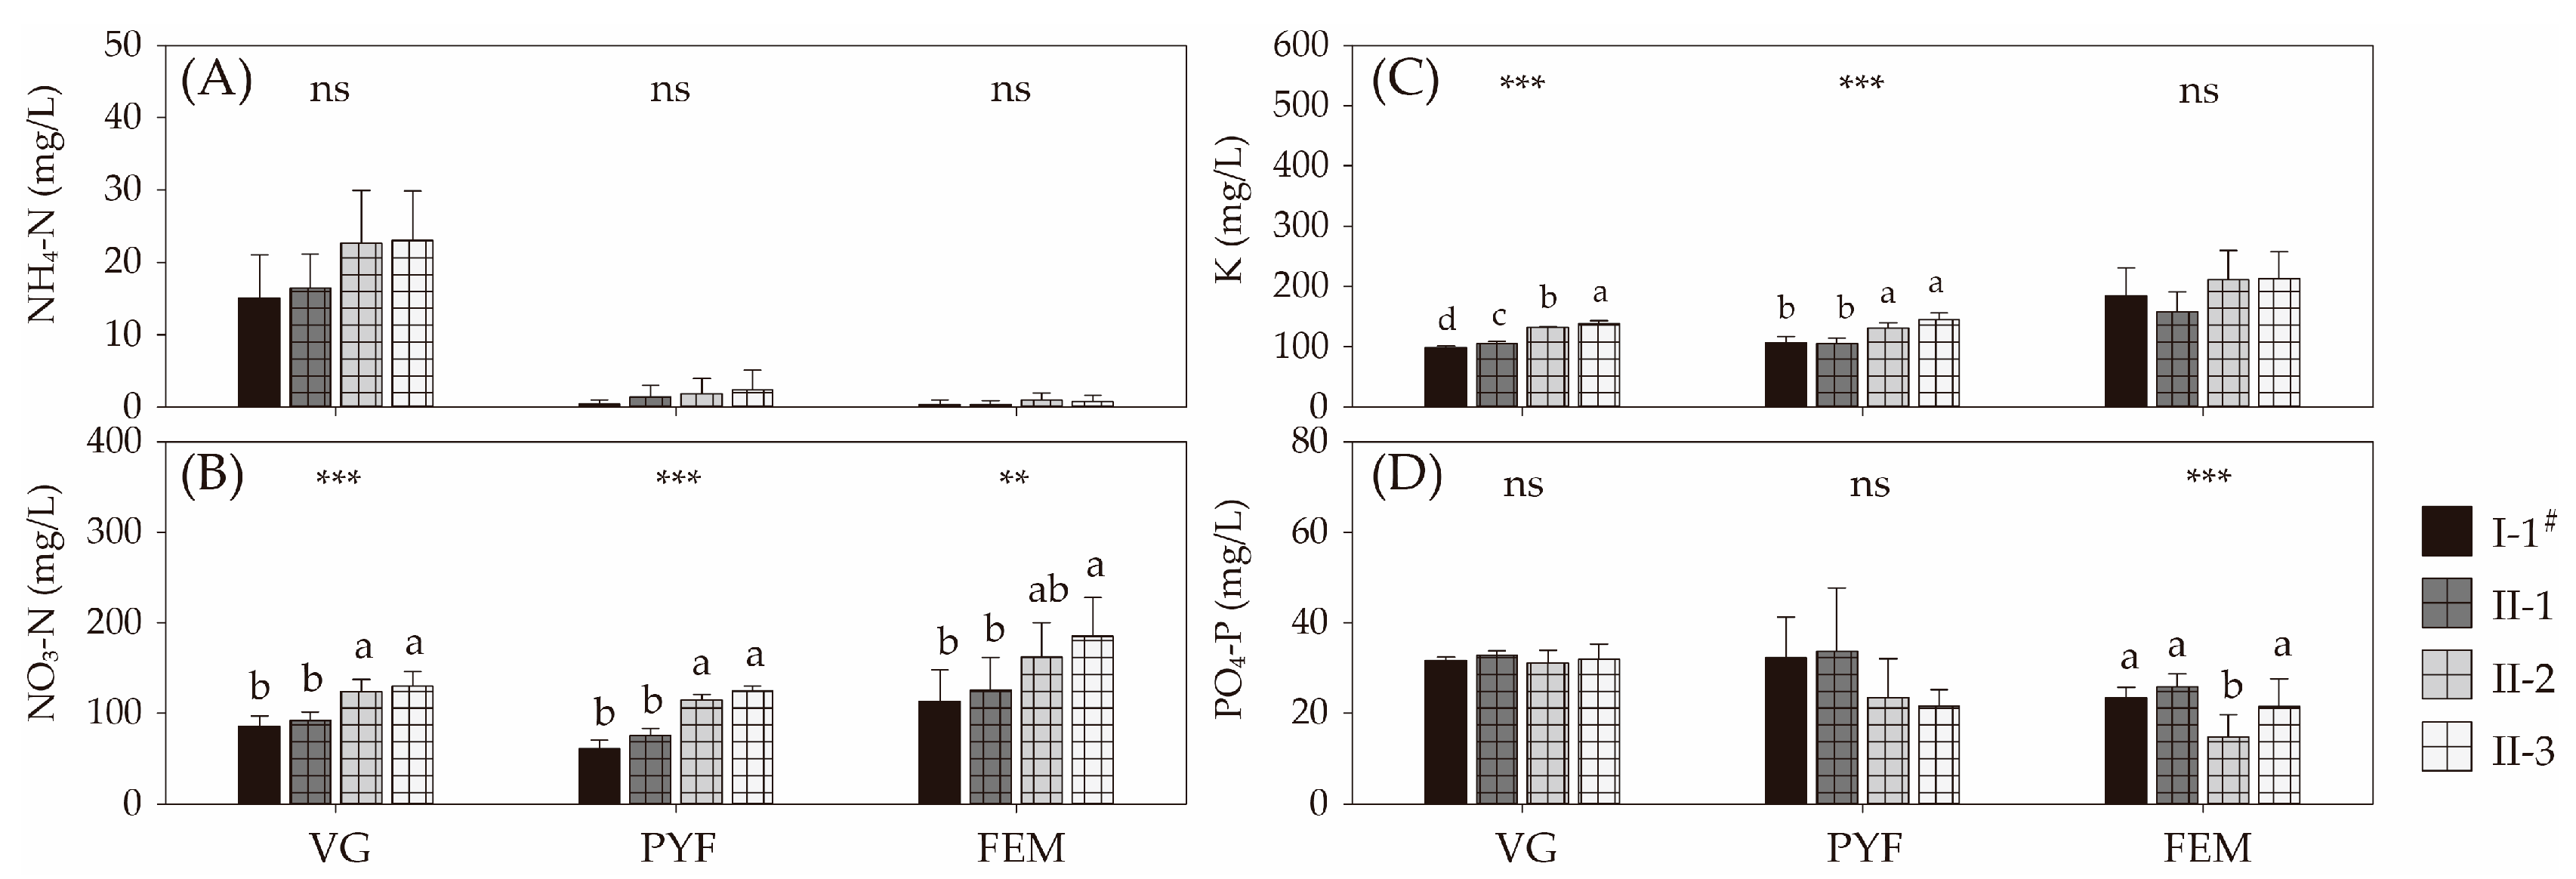
3.1. Changes in Water Chemistry of Nutrient Solution for the Hydroponic Culture

Total N in nutrients for CT were 173.8 mg/L (NH4-N = 27.1 ± 2.9, NO3-N = 146.7 ± 6.6 mg/L) for VG and 166.8 mg/L (NH4-N = 16.3 ± 3.7, NO3-N = 150.5 ± 13.9 mg/L) for PYF showing balanced N uptake by plants and N replenishment (100% N = 168 mg/L) for CT (Figure 3A,B). However, total N in nutrient for CT was 257.6 mg/L (NH4-N = 17.8 ± 1.9, NO3-N = 239.8 ± 45.1 mg/L) for FEM, suggesting less N absorption by plants than N replenishment during fruit development. There were 135.0 mg/L (NH4-N = 29.5 ± 3.0, NO3-N = 114.5 ± 11.3 mg/L) and 130.4 mg/L (NH4-N = 21.1 ± 4.2, NO3-N = 109.3 ± 8.0 mg/L) total N in nutrient solutions for I-1 and I-2, respectively, during VG, also showing balanced N absorption by plants and N replenishment (75% N = 126 mg/L) for treatment I-1 and I-2 (Figure 3A,B). However, total N were 78.3 and 92.4 mg/L during PYF for I-1 (NH4-N = 4.4 ± 3.4, NO3-N = 73.9 ± 10.8 mg/L) and I-2 (NH4-N = 7.9 ± 3.0, NO3-N = 84.5 ± 9.8 mg/L), respectively, demonstrating a reduction in 26.7–37.9% N compared to N replenishment of 75% N (126 mg/L) during PYF. Increased total N levels in nutrient solutions for both I-1 (NH4-N = 7.4 ± 4.0, NO3-N = 171.3 ± 43.5 mg/L) and I-2 (NH4-N = 2.2 ± 1.7, NO3-N = 142.2 ± 28.2 mg/L) during FEM, thus indicated reducing N demands during fruit development.
K concentrations of CT in Experiment I were 227.2 ± 14.9, 229.5 ± 26.0, and 373.7 ± 58.7 mg/L during VG, PYF, and FEM, respectively, indicating low K uptake efficiency by plants for CT, due to accumulation in the nutrient solution (100% K = 195 mg/L, Figure 3C). However, increasing K uptake efficiency was observed for both I-1 and I-2, which were applied for 125% K (243.75 mg/L) during PYF. There were 176.5 ± 42.8 and 194.9 ± 45.1 mg/L K in nutrient solutions for I-1 and I-2, respectively, suggesting high K uptake by plants during PYF (Figure 3C). However, K uptake was reduced during FEM, for both I-1 (349.5 ± 45.6 mg/L) and I-2 (398.8 ± 66.1 mg/L), which were replenished in 100% K and 125% K nutrient solutions, respectively. P concentrations showed constant levels among the three treatments during VG (34.7–41.9 mg/L), PYF (31.3–39.1 mg/L), and FEM (29.6–38.2 mg/L), demonstrating no effects on P uptakes by adjusting N and K among CT, I-1, and I-2 (Figure 3D, one-way ANOVA, p > 0.05).
The results revealed higher N uptake efficiency for both I-1# and II-1 than both II-2 and II-3. Total N during VG, PYF, and FEM revealed 99.8, 61.5, and 113.6 mg/L for I-1# and 108.1, 76.3, and 126.0 mg/L for II-1, indicating reduced 14–21%, 39–51%, and 25–32%, respectively, compared to replenished N levels in 75-75-100% N (Figure 4A,B). In contrast to I-1# and II-1, relatively low N uptake efficiency was shown for both II-2 and II-3. Total N in the hydroponic solutions measured during VG, PYF, and FEM were, respectively, 146.5, 115.9, and 163.4 mg/L for II-2 and 153.1, 127.3, and 186.0 mg/L for II-3, demonstrating consistent N levels, corresponding to the nutrient replenishment from the N formulation of 100-75-100% N. However, NH4-N for all treatments remained at low concentrations in the hydroponic solutions during PYF and FEM ranging from 0.3–2.4 mg/L, indicating the prior use of NH4-N as N sources by plants.
High efficiency of K uptake was shown for all treatments at VG and PYF than FEM in Experiment II. Nutrient solutions were applied 75–125% K for both I-1# and II-1, 100–125% K for both II-2 and II-3 during VG-PYF. Treatment I-1# and II-1 showed 98.9–106.8 and 104.6–105.1 mg/L K, respectively, indicating reduced 28–32% and 56–57% K during VG and PYF, respectively, in nutrient solutions, compared to the hydroponic solutions with replenished K (Figure 4C). Treatment II-2 and II-3 showed 130.5–131.9 and 138.3–144.7 mg/L K, respectively, indicating a reduction of 29–32% and 41–46% K during VG and PYF, respectively, in nutrient solutions, compared to the hydroponic solutions with replenished K (Figure 4C). However, K uptake was highly reduced during FEM for all treatments and K remained excessive in the hydroponic solutions. During FEM, only ~6% of K was constantly absorbed during I-1# (183.9 ± 46.6 mg/L), but no clear evidence of K absorption was observed from the other three nutrient treatments. P concentrations showed constant levels among the four treatments during VG (31.1–32.8 mg/L) and PYF (21.6–33.7 mg/L), demonstrating no effects on P uptakes by adjusting N and K levels among I-1#, II-1, II-2, and II-3 during VG and PYF (Figure 4D, one-way ANOVA, p > 0.05).

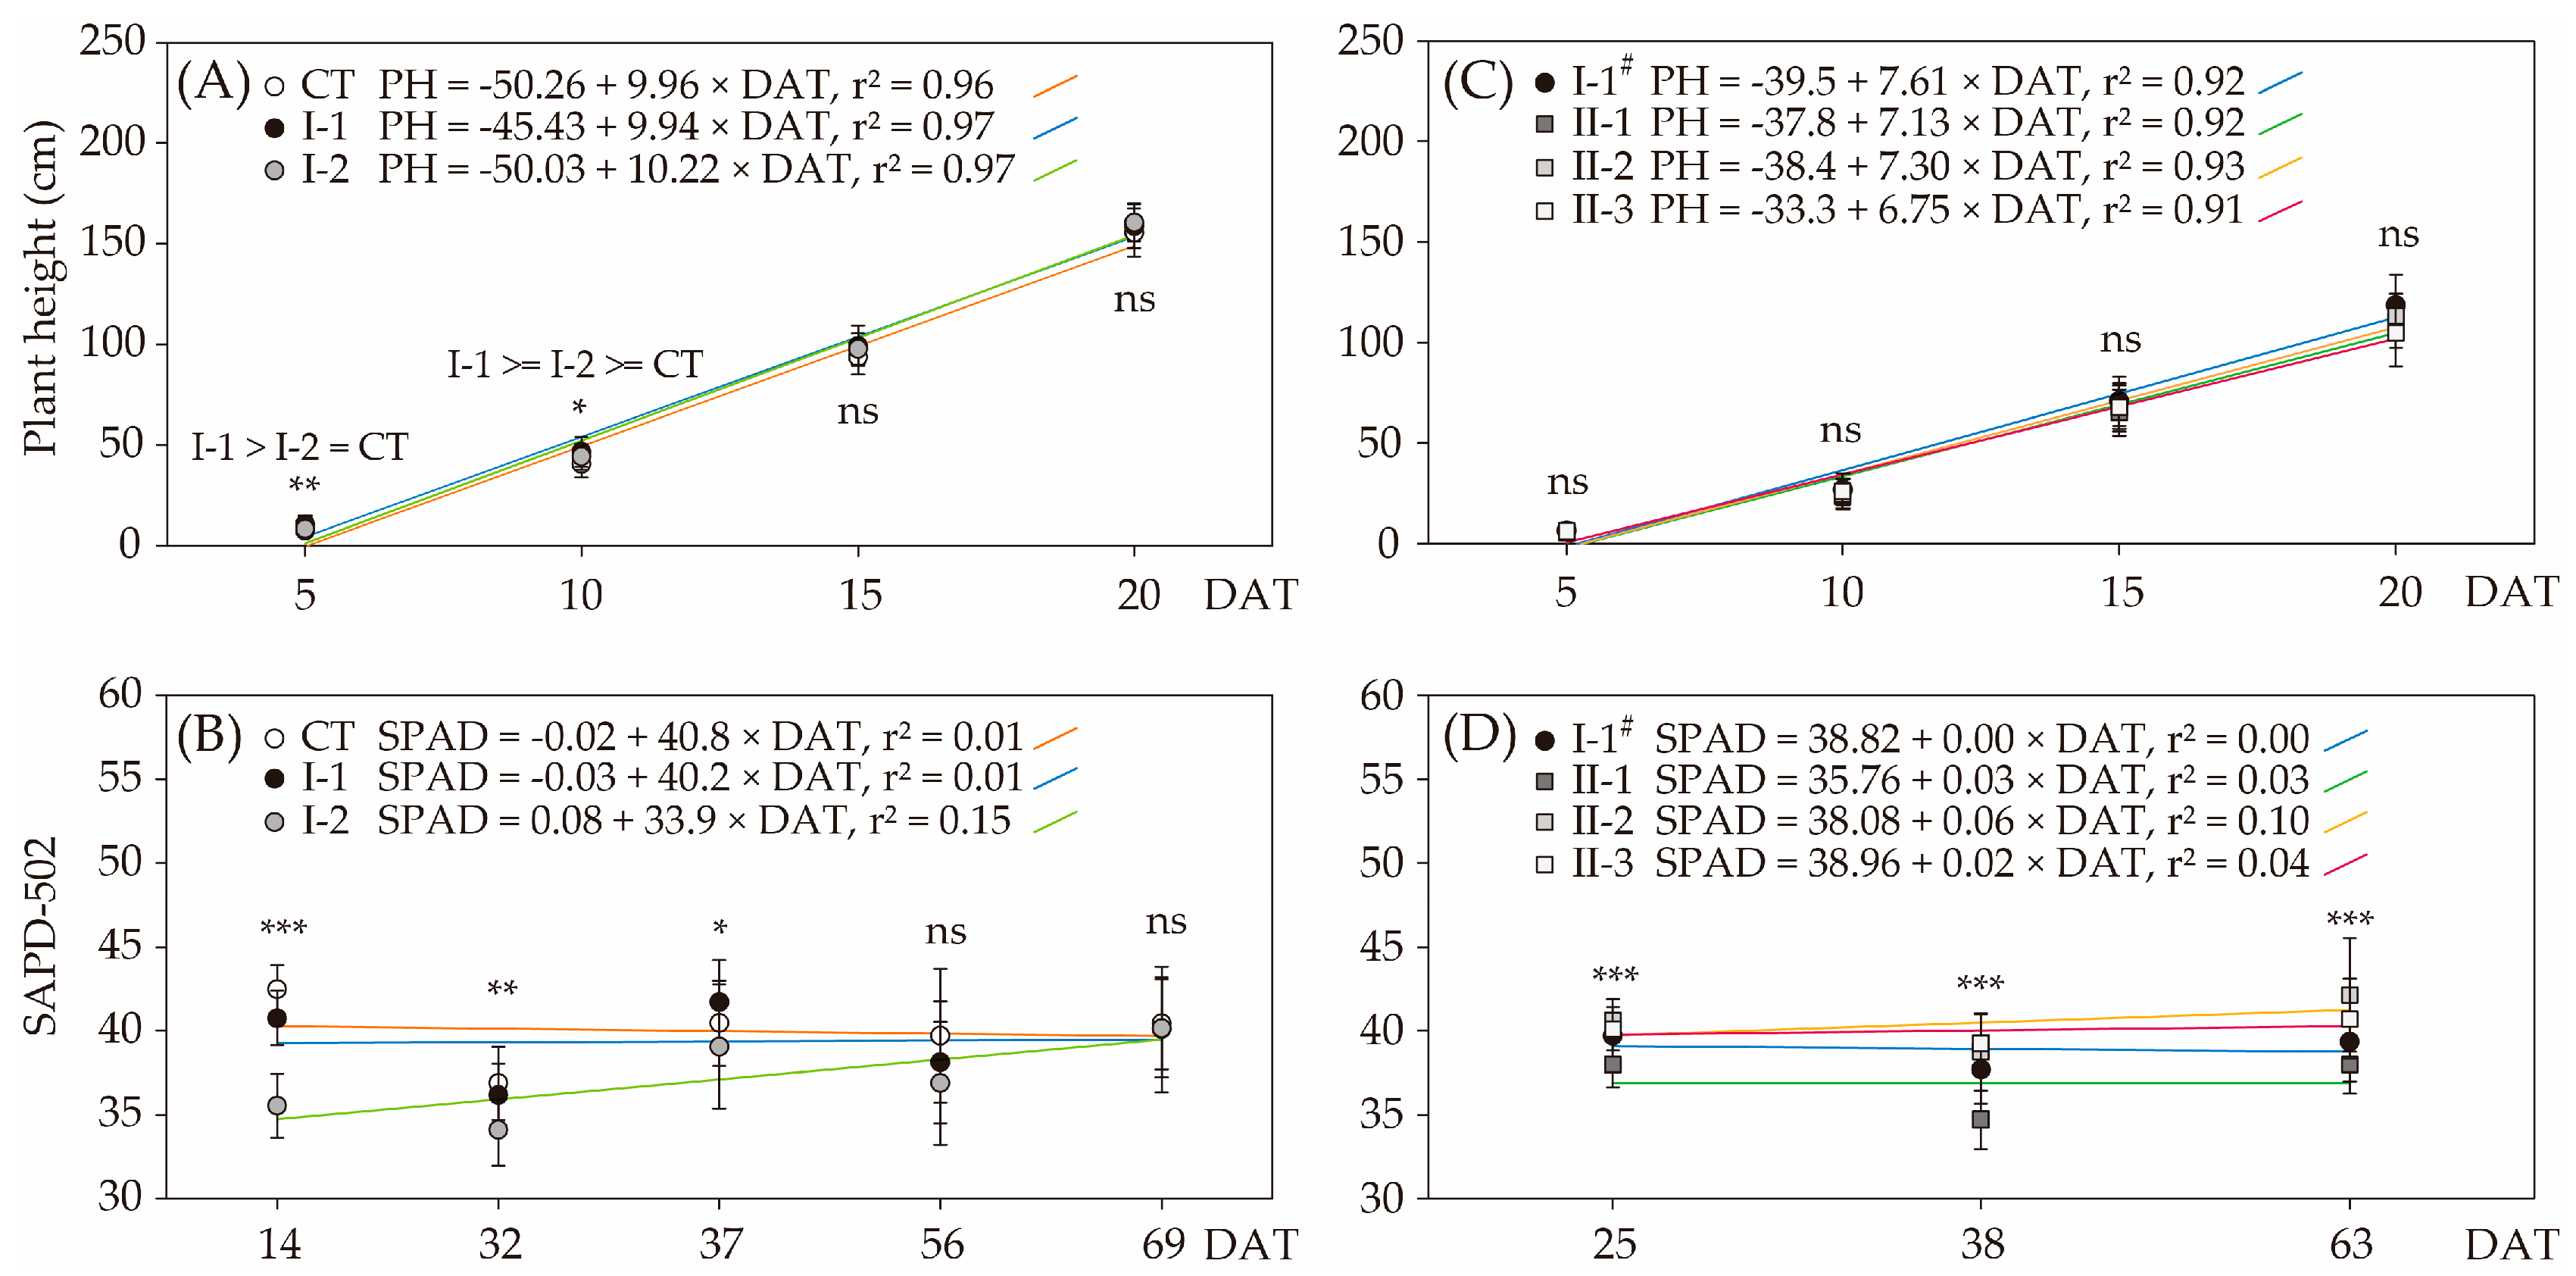
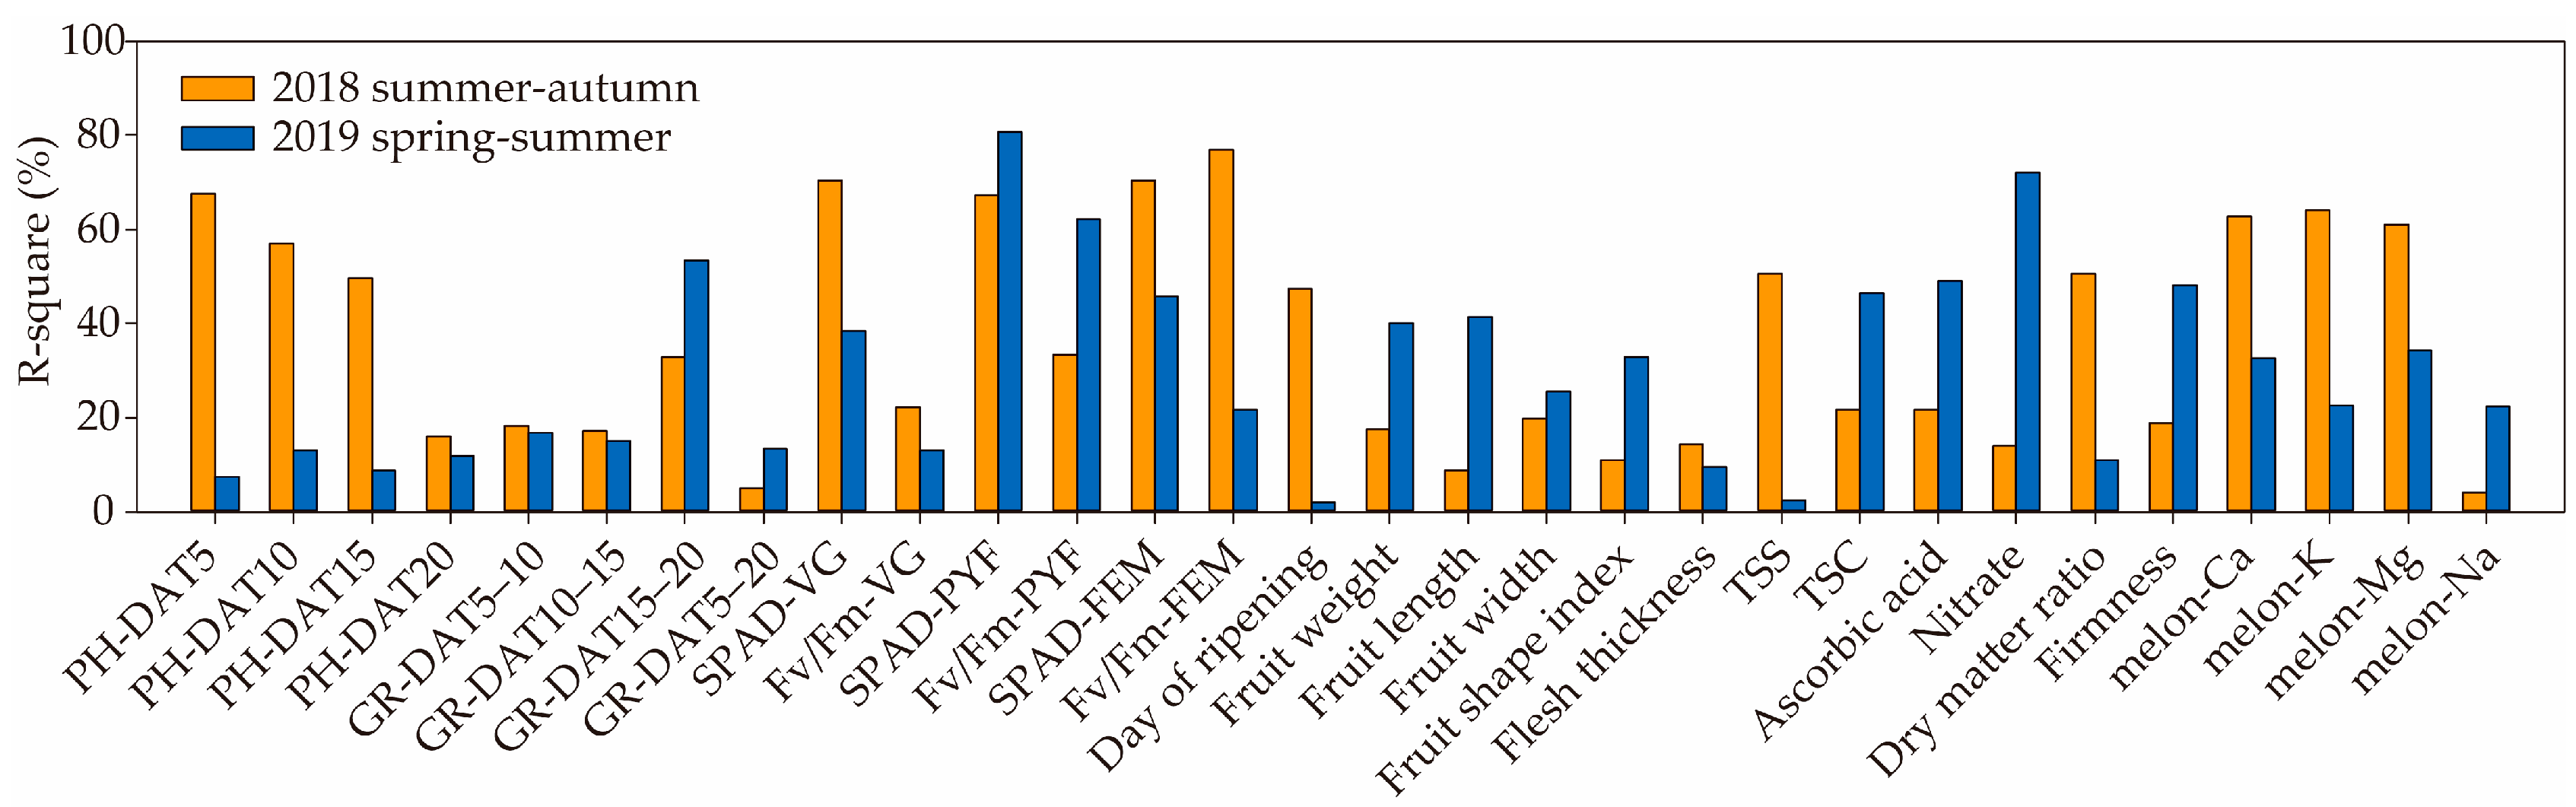
3.2. Plant Growth and Fruit Quality

In Experiment I, the difference in plant growth responses including plant height and relative leaf chlorophyll content were shown among the three treatments (Figure 5A). Mean values (± sd) of plant height were 7.2 ± 1.9, 10.6 ± 4.0, and 8.2 ± 2.5 cm for CT, I-1, and I-2 respectively at DAT5, and the statistical analysis revealed that the highest plant height in I-1 compared to I-2 and CT (Figure 5A; 1oneway ANOVA, p < 0.01). Additionally, plants for I-1 (46.6 ± 7.4 cm) were taller than both I-2 (44.2 ± 6.4 cm) and CT (40.5 ± 6.7 cm) at DAT10 (one-way ANOVA, p < 0.05). The results thus revealed the application of 75% N and K during VG did not retard plant growth for I-1 and I-2 but taller plants instead particularly during earlier VG. Additionally, the overall growth rates between DAT5–20 remained similar among the three treatments, i.e., CT, I-1, and I-2, ranging from 9.94–10.22 (cm/d; one-way ANOVA, p > 0.05).
In Experiment I, relative leaf chlorophyll content was measured highest for CT at DAT14 (42.5 ± 1.4 SPAD-502) and DAT32 (36.9 ± 2.2 SPAD-502), compared to I-1 and I-2 (Figure 5B, one-way ANOVA, p < 0.05), demonstrating reduced photosynthetic efficiency for both I-1 and I-2, which applied 75% N during VG and PYF. However, relative leaf chlorophyll content was not significantly different among the three treatments ranging from 36.9–39.7 at DAT56 and 40.1–40.4 at DAT69 (Figure 5B, one-way ANOVA, p > 0.05). The results thus indicated that, although there was lower photosynthetic efficiency for I-1 and I-2 during plant growth, there were no effects on later fruit development by adjusting N and K levels. Moreover, the leaves located at the fruiting nodes showed no significant difference in surface area (524–550 cm2) among the three treatments (one-way ANOVA, p > 0.05).
In Experiment II, only relative leaf chlorophyll content showed significant difference among the four treatments (Figure 5C). Similar plant heights which ranged from 5.7–6.1 cm at DAT5 to 105–119 cm at DAT20 were observed from all treatments, and the growth rates were 6.8–7.6 cm/day. The results demonstrated no retardation in plant growth for both I-1# and II-1 with 75% N and K, compared to both II-2 and II-3 (with 100% N and K). However, relative leaf chlorophyll content of plants were 37.7–39.4 and 34.7–38.0 SPAD-502 for I-1# and II-1, respectively, during DAT25–63, showing significantly lower content than both II-2 (38.7–42.1 SPAD-502) and II-3 (39.3–40.7 SPAD-502) in Experiment II (Figure 5D, one-way ANOVA, p < 0.01). This indicated that photosynthetic efficiency was lower for both I-1# and II-1, compared to II-2 and II-3. Moreover, the leaves located at fruiting nodes showed areas ranging from 637 to 747 (cm2) for all treatments, but the largest for I-1# and the smallest for II-2 (one-way ANOVA, p < 0.05).
In Experiment I, fruits of netted melon required 1.2–2.4 more days for development into harvestable status under the reduced-N hydroponic treatments, i.e., I-1 and I-2, compared to CT (mean = 54.0 ± 1.3 days, Table 3). The fruit traits, including fruit weight (1506.9 ± 143.7 g), flesh thickness (39.28 ± 3.24 mm), and dry matter ratio (10.76 ± 0.35%) were 9.0%, 9.3%, and 41.0% higher, respectively, for I-1 compared to CT. However, fruit weight was 1356.4 ± 131.1 g for I-2, which was 2% lighter than CT. The dry ratio for I-2 was 9.45 ± 1.02%, which was 23.9% higher than CT. The morphology of the netted melon showed no difference among the three treatments in Experiment I, with the shape index ranging from 0.99–1.00 (Table 3). Higher TSS, TSC, and K contents were shown in fruits from both I-1 and I-2 compared to CT, and this indicated the modified N and K levels in fertilisation scheme effectively changed the chemical contents in netted melon fruits. TSS increased by 8–13% for both I-1 and I-2, compared to CT (12.51 ± 1.19 °Brix). TSC was increased by 2–8% for both I-1 and I-2, compared to CT (0.49 ± 0.06 mg/g). Moreover, modifying K fertilisers resulted in an increase of 23–25% K contents in fruits from I-1 and I-2, compared to CT (327.8 ± 33.6 mg/100 g FW). Both the ascorbic acid (Experiment I = 76.7–86.7; Experiment II = 1.3–3.8 mg/L) and the nitrate contents (Experiment I = 76.7–86.7; Experiment II = 1.3–3.8 mg/L) of the fruits showed no difference among treatments in Experiment I and II (Table 3). Additionally, the levels of Ca, Mg, and Na in the fruits were similar among the three treatments, ranging from 1.2–1.5, 9.7–12.6, and 24.2–28.8 mg/100 g FW, respectively (one-way ANOVA, p > 0.05).
In Experiment II, the netted melon plants required a similar number of days for developing fruit into harvestable status across all treatments, i.e., I-1#, II-1, II-2, and II-3 (54.3–55.1 days, Table 3). Fruit weights also exhibited no difference among treatments ranging from 1107.4–1203.2 g. However, fruits from all treatments in Experiment II in 2019 weighed lighter than Experiment I in 2018. Additionally, fruit shapes, flesh thickness, and dry matter ratios showed no statistical significance among the four treatments. Netted melon fruits from II-3 were 5.07 ± 0.35 N·m2, revealing a significantly softer texture than the other three treatments, i.e., I-1#, II-1, and II-2 (one-way ANOVA, p < 0.01). Chemical contents including TSS, TSC, ascorbic acid, nitrate, and K contents of fruits had no statistical difference among the four treatments in Experiment II (one-way ANOVA, p > 0.05).
The results of the best subsets regressions revealed that combined N and K manipulations in two experiments contributed to different traits of plant growth and fruit traits (Figure 6). For plant growth, the nutrient manipulations in Experiment I made a major contribution to plant height at DAT5–15 with R-square ≥ 50%. However, nutrient adjustments in Experiment II showed fewer effects on plant height. The nutrient treatments in both experiments contributed >35% (R-square) in relative leaf chlorophyll content of plants. For fruit traits, reduced N and adjusted K in Experiment I explained >50% effects on TSS, dry matter ratio, and mineral contents, including Ca, K, and Mg in netted melon fruits. Therefore, nutrient manipulations in Experiment I significantly improved fruit quality, especially sweetness and mineral contents. N and K adjustments in Experiment II contributed to fruit traits such as fruit weight and length, TSC, ascorbic acid, and nitrate contents with >40% R-square. Thus, fruit morphology and chemical contents, i.e., TSS, ascorbic acid, and nitrate, were significantly improved compared to the nutrient treatments in Experiment II.

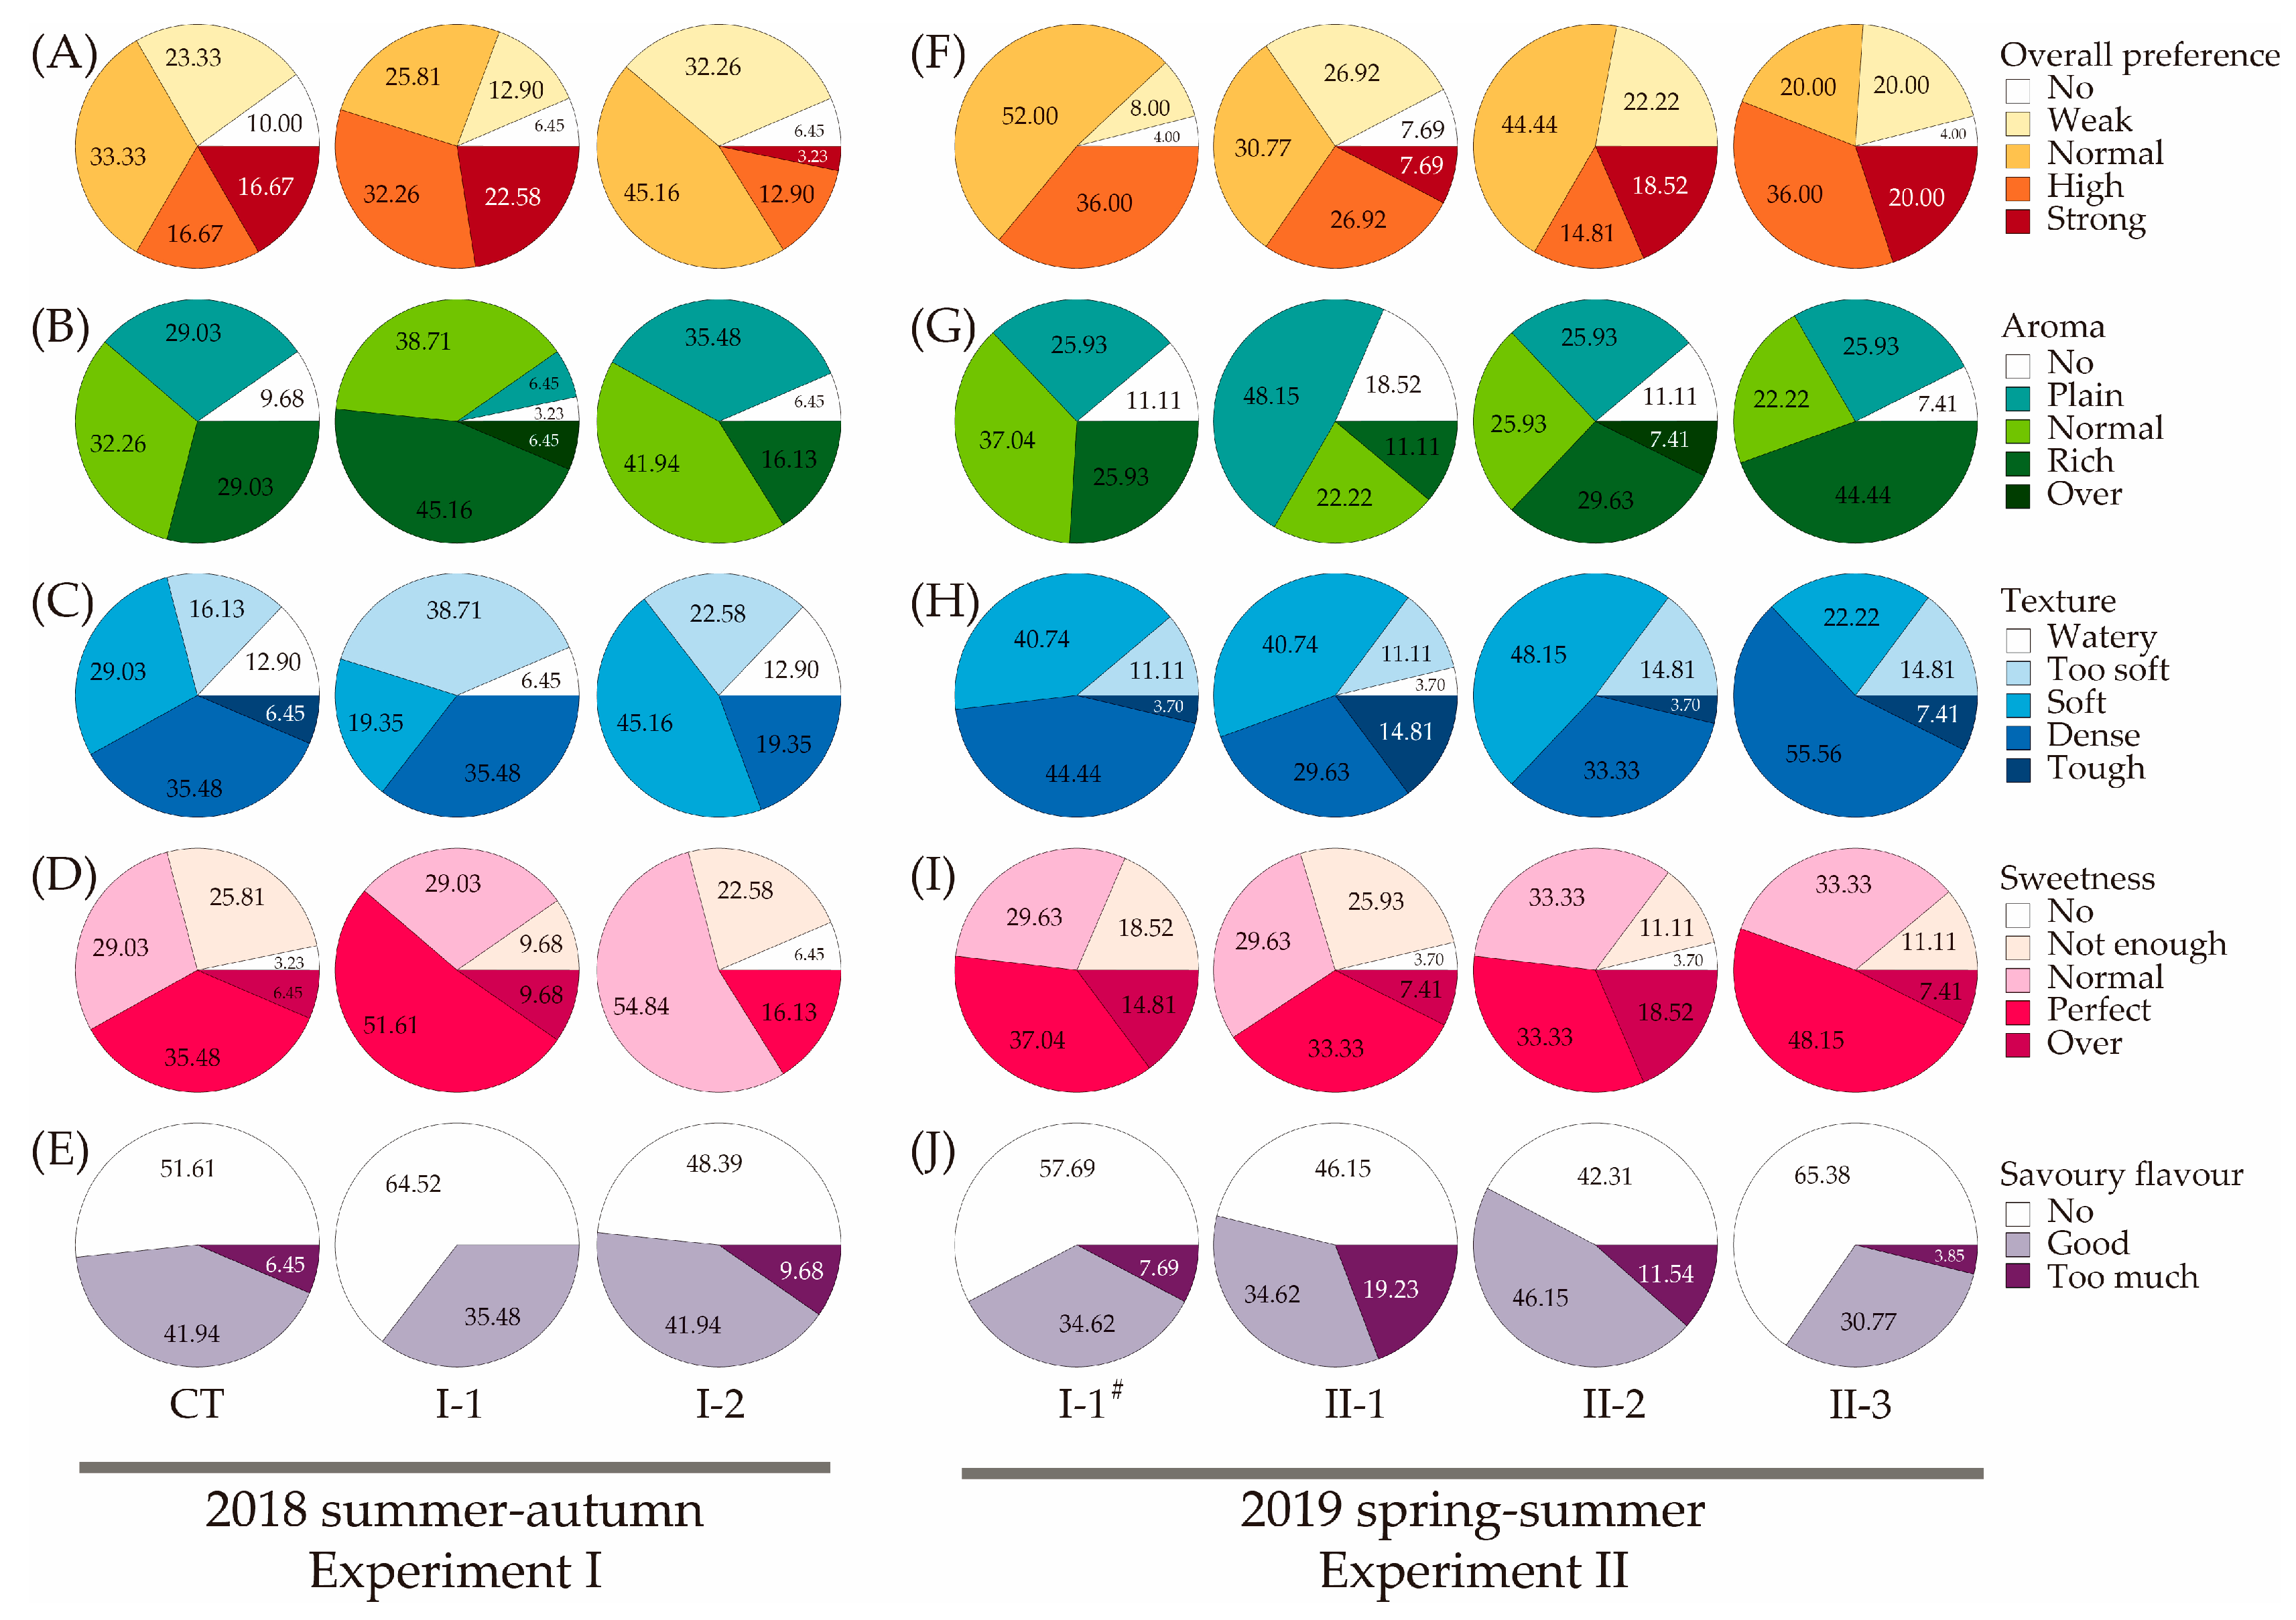
3.3. Blind Tasting Tests for Customers’ Preferences

In the blind tasting test in Experiment I, netted melon fruits from I-1 obtained >50% ‘high’ and ‘strong’ in overall preferences from all respondents, and this demonstrated a 1.7–3.4 times higher preference than that from CT (33%) and I-2 (16%, Figure 7A). For fruit aroma, 45.16% of respondents considered fruits from I-1 as having a ’rich’ aroma, but only 29.03% and 16.13% of respondents preferred CT and I-2 as a ‘rich’ aroma (Figure 7B). However, fruits from I-2 were ranked as a ‘plain’ aroma by 35.48% of the respondents, compared to CT (29.03%). The same number of respondents agreed with the ‘dense’ texture of fruits from I-1 and CT (35.48%), compared to I-2 (19.35%; Figure 7C). There were 45.16% of respondents who indicated that fruits from I-2 were ‘soft’ in texture, rather than ‘dense’. More than a half of respondents (51.61%) perceived fruits from I-1 as ‘perfect’ sweetness, and this was 1.5–3.2 times higher than those from CT (35.48%) and I-2 (16%) (Figure 7D). However, the fruit sweetness from II-2 did not improve by adjusting N and K in the hydroponic solutions, with 54.84% of the respondents ranking fruits as being of ‘normal’ sweetness. For a savoury flavour in netted melon fruits, the same proportion of 41.94% of respondents ranked CT and I-2 as a ‘good’ savoury flavour, which was higher than I-1 (35.48%; Figure 7E). However, more respondents indicated ‘too much’ savoury flavour for I-2 (9.68%) compared to CT (6.45%) and I-1 (0%).
In the blind tasting test for Experiment II, netted melon fruits from II-3 obtained 56.00% ‘high’ and ‘strong’ in overall preferences from all respondents, which was higher than from I-1# (36%), II-1 (35%), and II-2 (33%; Figure 7F). The aroma of fruits from II-3 were considered as having a ‘rich’ aroma by 44.44% of respondents, compared to II-1, II-2, and II-3 (11–30%; Figure 7G). A total of 44–56% of respondents agreed with a ‘dense’ texture in I-1# and II-3, which was higher than both II-1 and II-2, with 30–33% (Figure 7H). The highest proportion of respondents considered fruits from II-1 to have a ‘tough’ texture (14.81%), compared to the other three treatments, i.e., I-1#, II-2, and II-3 (4–7%). A total of 48.15% of respondents perceived fruits from II-3 as being of ‘perfect’ sweetness, and this was higher than that from I-1# (37.04%), II-1 (33.33%), and II-2 (33.33%) (Figure 7I). There were 46.15% of the respondents who indicated a ‘good’ savoury flavour of fruits from II-2, which was better than the other three treatments, i.e., I-1#, II-1 and II-3 (31–35%, Figure 7J).

4. Discussion

The present study included a two-step nutrient manipulation experiment for the hydroponic cultivation of netted melon. In Experiment I, nutrient solutions were applied to N-reduction and K-adjustment to investigate the effects of plant growth and fruit quality. In Experiment II, nutrient solutions were further finer adjusted in N and K to optimise the plant growth and fruit quality. Since N nutrients played important roles in protein metabolism, nucleic acid synthesis, or chlorophyll production, traditional farming practice tended to use fertilisers with excessive N to avoid any adverse effects on yield, due to N deficiency in plants. For soilless cultivations, Hoagland and solution and Cooper nutrient solution, which contained >200 mg/L of N-based nutrients, have been widely applied to many fruit crops, including strawberries and tomatoes [52,53]. However, the excessive N for hydroponic vegetative crop changed in plant growth such as reduced leaves and stunt roots, e.g., lettuce, which applied for 300 mg/L N [10]. Additionally, the NH4-N fraction of total N in the nutrient solution reached 0.15 (NH4-N/total-N), which could restrict vegetative growth, fruit yield, and quality, and the excessive NH4-N is commonly known as nitrogen toxicity for many hydroponic crops, such as tomato and lettuce [54,55]. Moreover, excessive N fertilisation caused environmental problems, such as release to nearby water bodies, leading to eutrophication and algal blooms. The nutrient demands of plants vary through the whole cultivation period depending on their developmental stages. Highest fruit yield was obtained from an optimisation experiment of N application for hydroponic cultured tomato with 50, 60, 90, 140 mg/plant/day at vegetative, early, middle and late reproductive stages, respectively, in Sri Lanka [56]. It would be essential to develop precision fertilisation schemes for vegetable crops. In this study, we designed a series of fertilisation schemes based on modified Sheen nutrient solution with reduced N levels and different levels of K manipulation in the growth experiments of hydroponic netted melon in the greenhouse environment [49]. The water chemistry of the nutrient solutions of each treatment was continuously monitored during the whole experimental period. Parameters of plant growth, fruit yield and quality under different experimental treatments were also measured to reveal the plant responses to different fertilisation schemes.

4.1. Changes in N Levels of Nutrient Solutions for Hydroponic Melon Culture

Our full-strength nutrient solution contained a total of 168 mg/L N (including NO3-N and NH4-N), and the nutrient levels for CT reveal balanced N uptake and N replenishment during VG (173.8 mg/L) and FEM (166.8 mg/L). However, excessive N was observed for CT during FEM, with a total of 257.6 mg/L in nutrient solutions. Both I-1 and I-2 had reduced N to 75% (i.e., 126 mg/L N) during VG and PYF, and N levels were significantly decreased 26.7–37.9% in the nutrient solutions, due to an increase in N uptake from plants, in particular for PYF. The total N concentration for both I-1 (with 100% N during FEM) and I-2 (with 75% N during FEM) increased for FEM with 6.3% and 14.5%, respectively, also representing excessive N in nutrient solutions. Similar trends of N contents in the hydroponic solutions were observed in Experiment II, with more efficiency on total N uptake for both treatment I-1# and II-1 which applied for 75-75-100% N. N was absorbed in 14–51% during the whole cultivation period for I-1# and II-1 in Experiment II. However, the relatively low efficiency of N uptakes was observed for both II-2 and II-3, which applied for 100-75-100% N. There were 9–12% N absorbed by plants during VG for both II-2 and II-3. There was only absorbed in 3–8% during PYF and FEM for II-2, demonstrating a relatively balanced N uptake and N replenishments. Moreover, accumulated 1–10% for II-3 during PYF and FEM indicated excessive N for II-3. Additionally, NO3-N revealed increasing trends in nutrient solutions for Experiment I and II, with 30–63% and 31–42%, respectively, higher during FEM than VG. However, gradually decreasing in NH4-N for all treatments were measured in Experiments I, and dramatically decreased NH4-N for all treatments from VG to PYF in Experiments II. The results suggested an unbalanced uptake of different forms of N nutrients by plants. The preference of N absorption was different among vegetables, and netted melon (Earls Favourite) tended to absorb NH4-N more easily than NO3-N [57]. NH4-N could be more efficient for supporting N utility for photosynthesis in plants because of its higher Rubisco content or activity and regeneration of ribulose-1,5-bisphosphate [58]. However, excessive NH4-N from fertilisers would be toxic to plants, because the uptake of excessive cations could increase plant acidity leading to yield depression, and even mortality [59]. Therefore, using N nutrients with a combination of both NO3-N and NH4-N during plant cultivation was found to be better for promoting plant growth, yield, and photosynthesis in several crop plants, such as sweet corn, eggplant, and netted melon [49,60,61].
Better fruit quality of netted melon associated with higher TSS and fruit weight could be effectively controlled by maintaining the NO3-N/NH4-N ratios at 5:1 in nutrient solutions in Taiwan [38]. In our study, we maintained NO3-N/NH4-N ratios of nutrient solutions in 5:1 during the whole cultivation periods for both Experiment I and II, but extremely low NH4-N levels remained in nutrient solutions during PYF and FEM (<2.5 mg/L) in Experiment II. The results indicated higher use of NH4-N for photosynthesis in plants in Experiment II than Experiment I. In Experiment II, day length was gradually increased from 12.6 to 13.7 h/day [62], and mean day length was 1.5 h/day longer than that for Experiment I from PYF to FEM, which suggested that higher nutrient demands of netted melon were required for photosynthesis in Experiment II.
There was no significant difference in K levels of the hydroponic solutions among the four treatments at FEM, and this indicated that similar K concentrations remained in the hydroponic solutions among treatments. A significant difference in NO3-N levels of hydroponic solutions at FEM was detected among these four treatments, despite the same N-fertiliser concentrations with constant ratio of NO3-N/NH4-N being applied to the four nutrient treatments at PYM and FEM in Experiment II (Table 2). This suggested that N uptake at fruiting stage of netted melon could be affected by the N-fertiliser concentration at VG. The N uptake by plants from Treatment II-2 and II-3 were lower than Treatment I-1# and II-1, as significantly higher NO3-N levels were measured from the hydroponic solutions from Treatment II-2 and II-3. However, in this study, both the pulp firmness of fruits and results of blind tasting test on fruit texture did not demonstrate a consistently softer texture of fruits from Treatment II-2 and II-3 than the other two treatments. A better understanding of the change in fruit quality of netted melon with respect to nutrient management specific to the developmental stages deserves further evaluation.

4.2. Plant Growth and Nutrient Manipulations

Poor plant growth was not demonstrated by netted melon under the reduced-N treatments from both Experiment I and II. The growth rates of plants in Experiment I ranged from 9.94 to 10.22 cm/day during DAT5–20 (VG), with no difference among the three treatments. Experiment II also revealed similar growth rates among the four treatments with 6.75–7.61 cm/day. Moreover, similar heights were recorded for all netted melon plants at DAT20 (Experiment I: range = 158 to 161 cm; Experiment II: range = 105 to 119 cm), regardless the differences in nutrient treatments. There was no significant difference in plant growth rate among all treatments for both experiments. Hence, this suggested that netted melon plants were not retarded in growth in the nutrient solutions with 75% N. Our results also confirmed that 75% N did not affect the N uptake of netted melon, and this supported the present N-reduced nutrient formulations as being the more precise fertilisation schemes for netted melon.
Accumulated studies have suggested that N, as an important nutrient contributing to plant growth and agricultural productivity, particularly for the hydroponic cultivation, has profound effects on vegetative growth of various crops such as netted melon, water melon, cucumber, tomato, and lettuce [18,19,20,58,63,64]. However, excessive N applications could increase vegetative growth at the expense of reproductive growth, resulting in the hindrance of reproductive growth and fruit yield. These effects could be worsened when hydroponic crops are subjected to high ammonium concentrations of nutrient solutions, due to the development of ammonium toxicity symptoms [19,26,27,55,59,63,64,65]. In the present study, the reduced-N treatments did not affect growth rates of netted melon plants during VG, but such manipulations led to significantly slower fruit development, with the fruit ripening time delayed for 1.2–2.4 more days in Experiment I. This slight delay of the reproductive growth of netted melon was inconsistent with other studies on the crop response of N fertilisation, e.g., [19]. In addition, the overall growth rates of netted melon plants decreased by 24–34% in Experiment II, compared to Experiment I. Such detected differences could be primarily due to the differences in air temperature and day length during different growing seasons. Previous studies confirmed that light intensity and air temperature were key factors influencing water uptake and, thus, the absorption of nutrient solution by plants [42,43,44]. Mean air temperature during VG for Experiment II in spring 2019 was 24.3 ± 3.0 °C, which was lower than the Experiment I in summer 2018 (29.0 ± 1.3 °C). Netted melon is a warm-season crop, and the growth rates were reported as being 1.9 times faster at 34 °C than at 22 °C [44,46].
Previous studies indicated that leaf chlorophyll content of plants (SPAD values) were linearly correlated with leaf N concentrations, and this relationship has been commonly used to evaluate and manage N fertilisers for vegetative plants [22,66]. In Experiment I, the SPAD values in plants for I-1 and I-2 showed significantly lower than C1 particularly before DAT37 (VG and PYF), suggesting low N contents in plants for N-reduced treatments. However, the SPAD values were not different among treatments during FEM (DAT56 and 69), revealing no difference in leaf chlorophyll content during fruiting stages. Therefore, N-reduced treated plants for I-1 and I-2 had lower photosynthesis in Experiment I, particularly during VG. In Experiment II, lower photosynthesis effects also showed in plants under N-reduced treatments during VG for I-1# and II-1, compared to II-2 and II-3, which were treated with full-strength nutrients during VG. Thus, our results suggested that N-reduced manipulation in nutrient solutions caused lower photosynthesis effects in plants. To sum up, the nutrient manipulations explained 39–70% of the variation of leaf chlorophyll content corresponding to the overall plant growth in both Experiment I and II. This highlighted the strong influence of nutrient regulations on the plant photosynthetic effects.

4.3. Fruit Quality and Nutrient Manipulations

Sufficient N fertilisers for vegetative cultivations could enhance fruit quality, such as yield and fruit mass [19,20,67]. However, excessive N could result in poor quality of netted melon fruits by reducing flesh ratios, due to the increased central cavity and the decreased edible part [19,45]. Our results in Experiment I revealed higher weight, flesh thickness, and dry matter ratios of fruits from I-1 than that of CT, thus this represented better fruit quality grown with N-reduced nutrient solutions before fruiting stages. Additionally, increasing TSC was shown in I-1 compared to CT, suggesting positive effects of N-reduced manipulation on fruit sweetness. Despite the increased dry matter ratio and TSC in netted melon fruits from I-2 compared to CT, I-1 revealed the highest fruit quality among the three treatments, rather than I-2. Therefore, instead of consistent N-reduction treatment throughout the cultivation period, i.e., 75-75-75% N, it was important to raise N fertilisation to 100% at FEM, after maintaining reduced-N treatments at 75% during VG and PYF for the production of good-quality fruits.
K modification of the nutrient solutions was conducted during PYF and FEM in Experiment I. Although K element was reported for its important roles in regulating enzyme activities in plants, the effects of K fertilisation for the fruit quality of netted melon was not consistent in previous studies. Inadequate K fertilisation could result in poor fruit quality with lower TSS and ascorbic acid [33]. However, the decline in fruit yield, TSS, and ascorbic acid was not observed with restricting K supply for netted melon cultivation [65]. In our study, we modified K contents to 125% during PYF for both I-1 and I-2, to ensure sufficient K for fruit growing. We manipulated K only during PYF for I-1 and during PYF and FEM for I-2, to investigate the precise timing for increasing K fertilisation. Our results showed higher TSS of fruits from I-1 and I-2 than CT. However, smaller fruits and lower dry matter ratios were observed for I-2 compared to I-1, indicating that increasing K fertilisers during FEM did not improve the fruit quality of netted melon.
Based on the best fruit quality from I-1 in Experiment I, the nutrient solutions were applied with finer N and K adjustment in Experiment II. N and K were more finely adjusted during VG and FEM aiming to further improve the quality of hydroponic netted melon fruits. As K plays important role in ion transportation in cells, excessive K could result in unbalanced absorptions of the other nutrients, such as Ca in plants [68,69,70]. Additionally, reducing K contents in netted melon fruits could offer another diet option for chronic kidney disease patients, which affects more than 750 million people globally [8]. Our results revealed only pulp firmness were statistically different among the four treatments in Experiment II. A simple correlation between texture firmness and K contents in fruits suggested that higher K could lead to an increase in fruit firmness [71]. However, our results did not show a linear correlation between K-reduced fertilisation and a decrease in fruit firmness. Additionally, Ca levels in the hydroponic solution could influence the fruit firmness, since Ca plays important roles in plants by stabilising cell walls of fruits [72]. Levels of Ca was recorded in highest concentrations in nutrient solutions for II-3 during whole cultivation periods (VG: 144.1 ± 14.4, PYF: 176.2 ± 14.6, FEM: 264.4 ± 48.7 mg/L), compared to the other three treatments (VG: 132.3–138.9, PYF: 159.9–162.9, FEM: 225.5–235.9 mg/L), indicating less Ca uptake by plants for II-3. Additionally, excessive N was reported as being undesirable for decreased fruit firmness [73,74]. Thus, fruit softening was observed for II-3 (100–75–100% N) compared to both I-1# and II-1 (75-75-100% N) in Experiment II.
To sum up, among the overall fruit quality in two experiments, the manipulations in Experiment I contributed the most in terms of TSS, dry matter ratio, and mineral contents in netted melon fruits. By the first N-reduction test, we selected the precise nutrient manipulation for fruit quality with a high TSS and dry matter ratio. Then, finer adjustments on nutrient solutions in Experiment II contributed to the modifications of fruit traits, including fruit weight, length, TSC, ascorbic acid, and nitrate.

4.4. Blind Tasting Tests for Customers’ Preferences

In Experiment I, netted melon fruits from I-1 obtained the highest overall preferences from respondents, with the highest proportion on ‘rich’ aroma, ‘dense’ texture, and ‘perfect’ sweetness, compared to CT and I-2. Fruit from I-1 with a ‘dense’ texture could correspond to the highest dry matter ratios and flesh thickness, with no difference in pulp firmness compared to CT and I-2. Additionally, a high proportion of respondents suggested the most perfect sweetness fruits from I-1 correspondent to the highest TSS in fruit. In Experiment II, fruits from II-3 obtained the highest overall preferences from all respondents, with the highest proportion on ‘rich’ aroma, ‘dense’ texture, ‘perfect’ sweetness. However, the fruit traits, including flesh thickness, dry matter ratios, or sweetness, did not show a difference among the four treatments. Thus, there could be other minor effects on physiological mechanisms in plants after finer nutrient adjustments in Experiment II, leading to different customers’ preferences. In this study, we added the same amount of salt for each treatment during FEM, to cater to Taiwanese taste, and TSC showed 0.49–0.53 mg/g in fruits for each treatment in both experiments. However, our results of blind tests revealed no consistent savoury flavour among all treatments. There were 6% more respondents indicated ‘good’ savoury for CT and I-2 than I-1 in Experiment I, and 12–16% more respondents ranked ‘good’ savoury for II-2 than I-1#, II-1, and II-3.
Moreover, previous studies applied the addition of NaCl to the hydroponic cultivation of netted melon, which was intended to help investigate the change of water use efficiency and yield with saline irrigation, e.g., [75,76]. Hence, our study was the first research examined the enhancement of fruit flavour to match the taste-quality demand of Taiwan populations by NaCl addition during netted melon cultivation. Although the present results revealed that salt addition to the hydroponic solutions was not an effective method to consistently control the savoury flavour of fruits among the different treatments, our study provided important information for the taste enhancement investigation of hydroponic netted melon in the future.

5. Conclusions

Our findings confirmed that the N nutrient level of full-strength Sheen nutrient solution could be excessive for the hydroponic culture of netted melon in Taiwan [49], and the over-fertilisation of N could result in a reduction in the fruit weight, dry matter ratio, or TSS of fruits. N-reduced and K-modified treatments for plants before fruiting stage (I-1) in Experiment I obtained high fruit weight and higher fruit quality, including dry matter ratio, flesh thickness, and TSS. Additionally, I-1 plants met the most customer taste preferences, with ‘rich’ aroma, ‘dense’ texture, and ‘perfect’ sweetness, compared to plants that were treated with full-strength nutrients or full-period N-reduction. Hence, we suggested that it would be essential to adjust the precise fertilisation schemes for hydroponic crops with respect to different developmental stages, rather than maintaining consistently excessive nutrient levels during the whole cultivation period. In Experiment II, finer nutrient adjustments in the hydroponic solutions based on the results of Experiment I indicated that netted melon fruits cultured under treatment II-3 (100-75-100% N and 100-125-75% K) had the highest overall preferences, with ‘rich’ aroma, ‘dense’ texture, and ‘perfect’ sweetness, compared to all other experimental treatments in the present study. Therefore, our study successfully improved the traditional fertilisation schemes with different formulation for N- and K-fertilisers at the three developmental stages, i.e., VG, PYM and FEM, of hydroponic netted melon for enhancing plant growth and fruit quality. Additionally, our results provide important details for the future advancement of hydroponic netted melon culture, based on the precise fertilisation schemes to improve fruit quality and reduce environmental pollution due to farming activities.

Author Contributions

Conceptualisation, R.S.W.Y. and H.-F.L.; methodology, R.S.W.Y., C.F. and H.-F.L.; experiment conduction, R.S.W.Y., Y.-T.F., and J.-T.L.; chemical analysis, Y.-T.F. and J.-T.L.; data analysis, R.S.W.Y. and Y.-T.F.; writing, R.S.W.Y., Y.-T.F., J.-T.L., C.F. and H.-F.L. All authors have read and agreed to the published version of the manuscript.

Funding

This research was funded by National Taiwan University Core Consortiums, project numbers. 106R891006, 107L892605, 109L891309.

Acknowledgments

The authors would like to thank Horticulture Section, Agricultural Experimental Farm from the College of Bio-resources & Agriculture of National Taiwan University for the research support.

Conflicts of Interest

The authors declare no conflict of interest.

References

  1. Rouphael, Y.; Colla, G. Growth, yield, fruit quality and nutrient uptake of hydroponically cultivated zucchini squash as affected by irrigation systems and growing seasons. Sci. Hortic. 2005, 105, 177–195. [Google Scholar] [CrossRef]
  2. Amalfitano, C.; Del Vacchio, L.; Somma, S.; Cuciniello, A.; Caruso, G. Effects of cultural cycle and nutrient solution electrical conductivity on plant growth, yield and fruit quality of ‘Friariello’ pepper grown in hydroponics. Hortic. Sci. 2017, 44, 91–98. [Google Scholar] [CrossRef] [Green Version]
  3. Croft, M.M.; Hallett, S.G.; Marshall, M.I. Hydroponic production of vegetable amaranth (Amaranthus cruentus) for improving nutritional security and economic viability in Kenya. Renew. Agric. Food Syst. 2017, 32, 552–561. [Google Scholar] [CrossRef]
  4. Cardoso, F.B.; Martinez, H.E.P.; Da Silva, D.J.H.; Do Carmo Milagres, C.; Barbosa, J.G. Yield and quality of tomato grown in a hydroponic system, with different planting densities and number of bunches per plant. Pesq. Agropec. Trop. 2018, 48, 340–349. [Google Scholar] [CrossRef]
  5. Miceli, A.; Moncada, A.; Sabatino, L.; Vetrano, F. Effect of gibberellic acid on growth, yield, and quality of leaf lettuce and rocket grown in a floating system. Agronomy 2019, 9, 382. [Google Scholar] [CrossRef] [Green Version]
  6. Cuquel, F.L.; Motta, A.C.V.; Tutida, I.; De Mio, L.L.M. Nitrogen and potassium fertilization affecting the plum postharvest quality. Rev. Bras. Frutic. 2011, 33, 328–336. [Google Scholar] [CrossRef] [Green Version]
  7. Cole, J.C.; Smith, M.W.; Penn, C.J.; Cheary, B.S.; Conaghan, K.J. Nitrogen, phosphorus, calcium, and magnesium applied individually or as a slow release or controlled release fertilizer increase growth and yield and affect macronutrient and micronutrient concentration and content of field-grown tomato plants. Sci. Hortic. 2016, 211, 420–430. [Google Scholar] [CrossRef] [Green Version]
  8. Asaduzzaman, M.; Talukder, M.R.; Tanaka, H.; Ueno, M.; Kawaguchi, M.; Yano, S.; Ban, T.; Asao, T. Production of low-potassium content melon through hydroponic nutrient management using perlite substrate. Front. Plant Sci. 2018, 9, 1382. [Google Scholar] [CrossRef] [PubMed] [Green Version]
  9. Sambo, P.; Nicoletto, C.; Giro, A.; Pii, Y.; Valentinuzzi, F.; Mimmo, T.; Lugli, P.; Orzes, G.; Mazzetto, F.; Astolfi, S.; et al. Hydroponic solutions for soilless production systems: Issues and opportunities in a smart agriculture perspective. Front. Plant Sci. 2019, 10, 923. [Google Scholar] [CrossRef] [PubMed]
  10. Sapkota, S.; Sapkota, S.; Liu, Z. Effects of nutrient composition and lettuce cultivar on crop production in hydroponic culture. Horticulturae 2019, 5, 72. [Google Scholar] [CrossRef] [Green Version]
  11. Sanjuan-Delmás, D.; Josa, A.; Muñoz, P.; Gassó, S.; Rieradevall, J.; Gabarrell, X. Applying nutrient dynamics to adjust the nutrient-water balance in hydroponic crops. A case study with open hydroponic tomato crops from Barcelona. Sci. Hortic. 2020, 261, 108908. [Google Scholar] [CrossRef]
  12. Kaur, H.; Bedi, S.; Sethi, V.P.; Dhatt, A.S. Effects of substrate hydroponic systems and different N and K ratios on yield and quality of tomato fruit. J. Plant Nutr. 2018, 41, 1547–1554. [Google Scholar] [CrossRef]
  13. Janpen, C.; Kanthawang, N.; Inkham, C.; Tsan, F.Y.; Sommano, S.R. Physiological responses of hydroponically-grown Japanese mint under nutrient deficiency. PeerJ 2019, 7, e7751. [Google Scholar] [CrossRef] [PubMed]
  14. Yang, X.; Chen, L.; Cao, M.; Zhang, X.; Li, S. Effects of leaf potassium content on growth dynamics of muskmelon and developing a coupling model of nitrogen and potassium. HortScience 2019, 54, 1397–1408. [Google Scholar] [CrossRef] [Green Version]
  15. Ma, Q.; Longnecker, N.; Dracup, M. Nitrogen deficiency slows leaf development and delays flowering in narrow-leafed lupin. Ann. Bot. 1997, 79, 403–409. [Google Scholar] [CrossRef] [Green Version]
  16. Souri, M.K.; Dehnavard, S. Tomato plant growth, leaf nutrient concentrations and fruit quality under nitrogen foliar applications. Adv. Hortic. Sci. 2017, 32, 41–47. [Google Scholar] [CrossRef]
  17. Xiong, Q.; Tang, G.; Zhong, L.; He, H.; Chen, X. Response to nitrogen deficiency and compensation on physiological characteristics, yield formation, and nitrogen utilization of rice. Front. Plant Sci. 2018, 9, 1075. [Google Scholar] [CrossRef] [Green Version]
  18. Roorda van Eysinga, J.P.N.L.; Smilde, K.W. Nutritional Disorders in Glasshouse Tomatoes, Cucumbers and Lettuce; Centre for Agricultural Publishing and Documentation: Wageningen, The Netherlands, 1981; p. 130. [Google Scholar]
  19. Castellanos, M.T.; Cabello, M.J.; Cartagena, M.D.C.; Tarquis, A.M.; Arce, A.; Ribas, F. Growth dynamics and yield of melon as influenced by nitrogen fertiliser. Sci Agric. 2011, 68, 191–199. [Google Scholar] [CrossRef]
  20. Omotoso, S.O.; Akinrinde, E.A. Effect of nitrogen fertiliser on some growth, yield and fruit quality parameters in pineapple (Ananas comosus L. Merr.) plant at Ado-Ekiti Southwestern, Nigeria. IRJAS 2013, 3, 11–16. [Google Scholar]
  21. Peña-Fleitas, M.T.; Gallardo, M.; Thompson, R.B.; Farneselli, M.; Padilla, F.M. Assessing crop N status of fertigated vegetable crops using plant and soil monitoring techniques. Ann. Appl. Biol. 2015, 167, 387–405. [Google Scholar] [CrossRef]
  22. Mendoza-Tafolla, R.O.; Juarez-Lopez, P.; Ontiveros-Capurata, R.-E.; Sandoval-Villa, M.; Alia-Tejacal, I.; Alejo-Santiago, G. Estimating nitrogen and chlorophyll status of romaine lettuce using SPAD and at LEAF readings. Not. Bot. Horti. Agrobot. Cluj-Napoca 2019, 47. [Google Scholar] [CrossRef] [Green Version]
  23. Cavalcante, V.S.; Prado, R.D.M.; Vasconcelos, R.D.L.; Almeida, H.J.D.; Silva, T.R.D. Growth and nutritional efficiency of watermelon plants grown under macronutrient deficiencies. HortScience 2019, 54, 738–742. [Google Scholar] [CrossRef] [Green Version]
  24. Andriolo, J.L.; Erpen, L.; Cardoso, F.L.; Cocco, C.; Casagrande, G.S.; Jänisch, D.I. Nitrogen levels in the cultivation of strawberries in soilless culture. Hortic. Bras. 2011, 29, 516–519. [Google Scholar] [CrossRef] [Green Version]
  25. Neilsen, G.; Kappel, F.; Neilsen, D. Fertigation and crop load affect yield, nutrition, and fruit quality of ‘Lapins’ sweet cherry on Gisela 5 rootstock. HortScience 2007, 42, 1456–1462. [Google Scholar] [CrossRef] [Green Version]
  26. Goyal, S.S.; Huffaker, R.C. Nitrogen Toxicity in Plants. In Nitrogen in Crop Production; Hauck, R.D., Ed.; American Society of Agronomy: Madison, WI, USA, 1984; pp. 97–118. [Google Scholar] [CrossRef]
  27. Fernández-Escobar, R.; Beltrán, G.; Sánchez-Zamora, M.A.; García-Novelo, J.; Aguilera, M.P.; Uceda, M. Olive oil quality decreases with nitrogen over-fertilisation. HortScience 2006, 41, 215–219. [Google Scholar] [CrossRef] [Green Version]
  28. Cochrane, T.T.; Cochrane, T.A. The vital role of potassium in the osmotic mechanism of stomata aperture modulation and its link with potassium deficiency. Plant Signal. Behav. 2009, 4, 240–243. [Google Scholar] [CrossRef] [Green Version]
  29. Lester, G.E.; Jifon, J.L.; Makus, D.J. Impact of potassium nutrition on postharvest fruit quality: Melon (Cucumis melo L) case study. Plant Soil 2010, 335, 117–131. [Google Scholar] [CrossRef]
  30. Mondal, M.F.; Asaduzzaman, M.; Ueno, M.; Kawaguchi, M.; Yano, S.; Ban, T.; Tanaka, H.; Asao, T. Reduction of potassium (K) content in strawberry fruits through KNO3 management of hydroponics. Hort. J. 2017, 86, 26–36. [Google Scholar] [CrossRef] [Green Version]
  31. Singh, S.K.; Reddy, V.R. Potassium starvation limits soybean growth more than the photosynthetic processes across CO2 levels. Front. Plant Sci. 2017, 8, 991. [Google Scholar] [CrossRef] [Green Version]
  32. Hasanuzzaman, M.; Bhuyan, M.H.M.B.; Nahar, K.; Hossain, M.S.; Mahmud, J.A.; Hossen, M.S.; Masud, A.A.C.; Fujita, M. Potassium: A vital regulator of plant responses and tolerance to abiotic stresses. Agronomy 2018, 8, 31. [Google Scholar] [CrossRef] [Green Version]
  33. Lin, D.; Huang, D.; Wang, S. Effects of potassium levels on fruit quality of muskmelon in soilless medium culture. Sci. Hortic. 2004, 102, 53–60. [Google Scholar] [CrossRef]
  34. Lester, G.E.; Jifon, J.L.; Rogers, G. Supplemental foliar potassium applications during muskmelon fruit development can improve fruit quality, ascorbic acid, and beta-carotene contents. J. Am. Soc. Hort. Sci. 2005, 130, 649–653. [Google Scholar] [CrossRef]
  35. Çolpan, E.; Zengin, M.; Özbahçe, A. The effects of potassium on the yield and fruit quality components of stick tomato. Hortic. Environ. Biotechnol. 2013, 54, 20–28. [Google Scholar] [CrossRef]
  36. Corrêa, C.V.; de Sousa Gouveia, A.M.; Martins, B.N.M.; Lanna, N.D.B.L.; Tavares, A.E.B.; Mendonça, V.Z.; Jorge, L.G.; Inácio Cardoso, A.I.; Evangelista, R.M. Effect of top-dressed potassium fertilisation on the yield and quality of cucumber. J. Plant Nutr. 2018, 41, 1345–1350. [Google Scholar] [CrossRef] [Green Version]
  37. Wang, M.; Zheng, Q.; Shen, Q.; Guo, S. The critical role of potassium in plant stress response. Int. J. Mol. Sci. 2013, 14, 7370–7390. [Google Scholar] [CrossRef] [Green Version]
  38. Hoopen, F.T.; Cuin, T.A.; Pedas, P.; Hegelund, J.N.; Shabala, S.; Schjoerring, J.K.; Jahn, T.P. Competition between uptake of ammonium and potassium in barley and arabidopsis roots: Molecular mechanisms and physiological consequences. J. Exp. Bot. 2010, 61, 2303–2315. [Google Scholar] [CrossRef] [Green Version]
  39. Berdiyev, M.; Arslan, D.; Özcan, M.M. Nutritional composition, microbiological and sensory properties of dried melon: A traditional turkmen product. Int. J. Food Sci. Nutr. 2009, 60, 60–68. [Google Scholar] [CrossRef]
  40. Schaffer, A.A.; Paris, H.S. Melons, Squashes, and Gourds. In Reference Module in Food Science; Elsevier: Amsterdam, The Netherlands, 2016. [Google Scholar] [CrossRef]
  41. MAFF. The 93rd Statistical Yearbook of Ministry of Agriculture, Forestry and Fisheries; Ministry of Agriculture, Forestry and Fisheries: Tokyo, Japan, 2019. Available online: https://www.maff.go.jp/e/data/stat/93th/index.html (accessed on 13 March 2020).
  42. Agriculture and Food Agency. Basic Agricultural Statistics 2018; Agriculture and Food Agency, Council of Agriculture: Taiwan, 2019. Available online: https://agrstat.coa.gov.tw/sdweb/public/book/Book.aspx (accessed on 13 March 2020). (In Chinese)
  43. Bouwkamp, J.C.; Angell, F.F.; Schales, F.D. Effects of weather conditions on soluble solids of muskmelon. Sci. Hortic. 1978, 8, 265–271. [Google Scholar] [CrossRef]
  44. Baker, J.T.; Reddy, V.R. Temperature effects on phenological development and yield of muskmelon. Ann. Bot. 2001, 87, 605–613. [Google Scholar] [CrossRef] [Green Version]
  45. Wiangsamut, B.; Koolpluksee, M.; Makhonpas, C. Yield, fruit quality, and growth of 4 cantaloupe varieties grown in hydroponic system and drip irrigation systems of substrate and soil culture. Int. J. Agric. Technol. 2017, 13, 1381–1394. [Google Scholar]
  46. Rodriguez, J.C.; Cantliffe, D.J.; Shaw, N.L.; Karchi, Z. Soilless media and containers for greenhouse production of ‘Galia’ type muskmelon. HortScience 2006, 41, 1200–1205. [Google Scholar] [CrossRef] [Green Version]
  47. Singer, S.M.; El-Tanahy, A.M.M.; El-Behairy, U.A.; El-Samad, E.H.A. Growth and productivity of cantaloupe plants grown under different soilless culture systems. J. Appl. Sci. Res. 2013, 9, 5294–5302. [Google Scholar]
  48. Yamasaki, K.; Suzuki, Y.; Shinohara, Y. Studies on water culture of several vegetables with special reference to the control of nutrient solution and ratio of nutrients absorption per water consumption. In Memoirs of the Faculty of Agriculture; Tokyo University of Education: Ibaraki, Japan, 1976. [Google Scholar]
  49. Sheen, T.F. Effects of NO3/NH4 ratio and depth of nutrient solution on growth of greenhouse muskmelon. J. Agric. Res. China 1989, 38, 53–71. (In Chinese) [Google Scholar]
  50. Sheen, T.F.; Hsu, M.M. Studies on nutrient uptake of greenhouse muskmelon (Cucumis melo L.) by hydroponics. J. Agric. Res. China 1990, 39, 55–64. (In Chinese) [Google Scholar] [CrossRef]
  51. Lobet, G.; Draye, X.; Périlleux, C. An online database for plant image analysis software tools. Plant Methods 2013, 9, 38. [Google Scholar] [CrossRef] [PubMed] [Green Version]
  52. Chow, K.K.; Price, T.V.; Hanger, B.C. Nutritional requirements for growth and yield of strawberry in deep flow hydroponic systems. Sci. Hortic. 1992, 52, 95–104. [Google Scholar] [CrossRef]
  53. Guo, X.; van Iersel, M.W.; Chen, J.; Brackett, R.E.; Beuchat, L.R. Evidence of association of salmonellae with tomato plants grown hydroponically in inoculated nutrient solution. Appl. Environ. Microbiol. 2002, 68, 3639. [Google Scholar] [CrossRef] [Green Version]
  54. Akl, I.A.; Savvas, D.; Papadantonakis, N.; Lydakis-Simantiris, N.; Kefalas, P. Influence of ammonium to total nitrogen supply ratio on growth, yield and fruit quality of tomato grown in a closed hydroponic system. Eur. J. Hortic. Sci. 2003, 68, 204–211. [Google Scholar]
  55. Hoque, M.M.; Ajwa, H.A.; Smith, R. Nitrite and ammonium toxicity on lettuce grown under hydroponics. Commun. Soil Sci. Plant Anal. 2007, 39, 207–216. [Google Scholar] [CrossRef]
  56. Erabadupitiya, H.R.U.T.; Weerakkody, W.A.P.; Nandasena, K.A. Determination of optimum nitrogen concentrations in hydroponics for tomato grown in coir medium in tropical greenhouse. Trop. Agric. Res. 2019, 30, 97–103. [Google Scholar] [CrossRef] [Green Version]
  57. Ikeda, H.; Osawa, T. Nitrate- and ammonium-N absorption by vegetables from nutrient solution containing ammonium nitrate and the resultant change of solution pH. J. Jpn. Soc. Hortic. Sci 1981, 50, 225–230. [Google Scholar] [CrossRef] [Green Version]
  58. Guo, S.; Zhou, Y.; Shen, Q.; Zhang, F. Effect of ammonium and nitrate nutrition on some physiological processes in higher plants-growth, photosynthesis, photorespiration, and water relations. Plant Biol. 2007, 9, 21–29. [Google Scholar] [CrossRef] [PubMed]
  59. Britto, D.T.; Kronzucker, H.J. NH4+ toxicity in higher plants: A critical review. J. Plant Physiol. 2002, 159, 567–584. [Google Scholar] [CrossRef] [Green Version]
  60. Huffman, J.R. Effects of enhanced ammonium nitrogen availability for corn. J. Agron. Educ. 1989, 18, 93–97. [Google Scholar] [CrossRef]
  61. Claussen, W.; Lenz, F. Effect of ammonium and nitrate on net photosynthesis, flower formation, growth and yield of eggplants (Solanum melongena L.). Plant Soil 1995, 171, 267–274. [Google Scholar] [CrossRef]
  62. Central Weather Bureau, Taiwan. Climate Statistics. Available online: https://www.cwb.gov.tw/V8/C/ (accessed on 10 March 2020).
  63. Ferrante, A.; Spinardi, A.; Maggiore, T.; Testoni, A.; Gallina, P.M. Effect of nitrogen fertilisation levels on melon fruit quality at the harvest time and during storage. J. Sci. Food Agric. 2008, 88, 707–713. [Google Scholar] [CrossRef]
  64. Sete, P.B.; Comin, J.J.; Nara Ciotta, M.; Almeida Salume, J.; Thewes, F.; Brackmann, A.; Toselli, M.; Nava, G.; Rozane, D.E.; Loss, A.; et al. Nitrogen fertilization affects yield and fruit quality in pear. Sci. Hortic. 2019, 258, 108782. [Google Scholar] [CrossRef]
  65. Asao, T.; Asaduzzaman, M.; Mondal, M.F.; Tokura, M.; Adachi, F.; Ueno, M.; Kawaguchi, M.; Yano, S.; Ban, T. Impact of reduced potassium nitrate concentrations in nutrient solution on the growth, yield and fruit quality of melon in hydroponics. Sci. Hortic. 2013, 164, 221–231. [Google Scholar] [CrossRef]
  66. Padilla, F.M.; de Souza, R.; Peña-Fleitas, M.T.; Gallardo, M.; Giménez, C.; Thompson, R.B. Different responses of various chlorophyll meters to increasing nitrogen supply in sweet pepper. Front. Plant Sci. 2018, 9, 1752. [Google Scholar] [CrossRef] [Green Version]
  67. Wahocho, N.A.; Maitlo, A.A.; Baloch, Q.B.; Kaleri, A.A.; Rajput, L.B.; Talpur, N.A.; Sheikh, Z.A.; Mengal, F.H.; Wahocho, S.A. Effect of varying levels of nitrogen on the growth and yield of muskmelon (Cucumis melo L.). J. Basic Appl. Sci. 2017, 13, 448–453. [Google Scholar]
  68. Johansen, C.; Edwards, D.G.; Loneragan, J.F. Interactions between potassium and calcium in their absorption by intact barley plants. I. Effects of potassium on calcium absorption. Plant Physiol. 1968, 43, 1717. [Google Scholar] [CrossRef] [PubMed] [Green Version]
  69. Voogt, W. The growth of beefsteak tomato as affected by K/Ca ratios in the nutrient solution. Acta Hortic. 1988, 155–166. [Google Scholar] [CrossRef]
  70. Bar-Tal, A.; Pressman, E. Root restriction and potassium and calcium solution concentrations affect dry-matter production, cation uptake, and blossom-end rot in greenhouse tomato. J. Am. Soc. Hort. Sci. 1996, 121, 649–655. [Google Scholar] [CrossRef] [Green Version]
  71. Preciado-Rangel, P.; Salas-Pérez, L.; Gallegos-Robles, M.Á.; Ruiz-Espinoza, F.H.; Ayala-Garay, A.V.; Fortis-Hernández, M.; Murillo-Amador, B. Increasing doses of potassium increases yield and quality of muskmelon fruits under greenhouse. Hortic. Bras. 2018, 36, 184–188. [Google Scholar] [CrossRef]
  72. Hawkesford, M.; Horst, W.; Kichey, T.; Lambers, H.; Schjoerring, J.; Møller, I.S.; White, P. Functions of Macronutrients. In Marschner’s Mineral Nutrition of Higher Plants, 3rd ed.; Marschner, P., Ed.; Academic Press: San Diego, CA, USA, 2012; pp. 135–189. [Google Scholar] [CrossRef]
  73. Sams, C.E. Preharvest factors affecting postharvest texture. Postharvest Biol. Technol. 1999, 15, 249–254. [Google Scholar] [CrossRef]
  74. Wiesler, F. Nutrition and Quality. In Marschner’s Mineral Nutrition of Higher Plants, 3rd ed.; Marschner, P., Ed.; Academic Press: San Diego, CA, USA, 2012; pp. 271–282. [Google Scholar] [CrossRef]
  75. Elbashier, M.A.M.; Xiaohou, S.; Ali, A.S.A.; Mohmmed, A. Effect of digestate and biochar amendments on photosynthesis rate, growth parameters, water use efficiency and yield of Chinese melon (Cucumis melo L.) under saline irrigation. Agronomy 2018, 8, 22. [Google Scholar] [CrossRef] [Green Version]
  76. Rodríguez-Ortega, W.M.; Martínez, V.; Nieves, M.; Simón, I.; Lidón, V.; Fernandez-Zapata, J.C.; Martinez-Nicolas, J.J.; Cámara-Zapata, J.M.; García-Sánchez, F. Agricultural and physiological responses of tomato plants grown in different soilless culture systems with saline water under greenhouse conditions. Sci. Rep. 2019, 9, 6733. [Google Scholar] [CrossRef]
Figure 1. Hydroponic netted melon cultivated in the greenhouse in the present study. (A) Arrangement of the experimental set-up in the greenhouse; and (B) a hydroponic system.
Agronomy 10 00816 g001
Figure 2. Continued monitoring of water temperature at 5 min interval in the hydroponic channels of control treatment in the greenhouse during the experimental periods, (A) 8 August–25 October 2018; and (B) 9 April–30 June 2019. Empty spaces on the data curves due to missing data.
Agronomy 10 00816 g002
Figure 3. Mean (+ sd) of (A) NH4-N, (B) NO3-N, (C) K, and (D) PO4-P concentrations of the hydroponic solutions measured during VG, PYF, and FEM from the three different nutrient treatments in Experiment I. Bars of different colours represented different nutrient treatments. Statistical significances tested with one-way ANOVA were denoted by asterisk: p < 0.05 *, p < 0.01 **, p < 0.001 ***. Codes and details for the experimental treatments refer to Table 1.
Agronomy 10 00816 g003
Figure 4. Mean (+ sd) of (A) NH4-N, (B) NO3-N, (C) K, and (D) PO4-P concentrations of the hydroponic solutions measured during VG, PYF, and FEM from the four different nutrient treatments in Experiment II. Bars of different colours represented different nutrient treatments. Statistical significances tested with one-way ANOVA were denoted by asterisk: p < 0.05 *, p < 0.01 **, p < 0.001 ***. Codes and details for the experimental treatments refer to Table 2.
Agronomy 10 00816 g004
Figure 5. The growth characteristics of netted melon from different nutrient treatments in Experiment I and II. (A) Plant height, PH (cm); and (B) relative leaf chlorophyll content, SPAD-502, measured from Experiment I. (C) Plant height (cm), PH; and (D) relative leaf chlorophyll content, SPAD-502, measured in from Experiment II. Statistical significances tested with one-way ANOVA were denoted by asterisk: p < 0.05 *, p < 0.01 **, p < 0.001 ***. Codes and details for the experimental treatments refer to Table 1 and Table 2.
Agronomy 10 00816 g005
Figure 6. Regression coefficients (R-square values) of the best-subset regression comparing each plant growth and fruit characteristics of netted melon to nutrient characteristics of the hydroponic solutions from Experiment I and II. PH: plant height; GR: growth rate; TSS: total soluble solid; TSC: total salt content; DAT: number of days after transplanting; VG: vegetative growth; PYF: pollinated young fruit; and FEM: fruit enlargement and maturation.
Agronomy 10 00816 g006
Figure 7. Pie charts showing the fractions (%) of opinions from the blind tasting tests of netted melon fruits cultivated from different nutrient treatments in Experiment I and II. In Experiment I: (A) overall preference; (B) fruit aroma; (C) fruit texture; (D) sweetness; (E) savoury flavour in %. In Experiment II: (F) overall preference; (G) fruit aroma; (H) fruit texture; (I) sweetness; (J) savoury flavour in %. Codes and details for experimental treatments refer to Table 1 and Table 2.
Agronomy 10 00816 g007
Table 1. Nutrient solution formulations of the three different treatments for the three developmental stages, including vegetative growth (VG), pollinated young fruit (PYF), and fruit enlargement and maturation (FEM) of hydroponic netted melon in Experiment I during summer–autumn 2018. Nitrogen (N), phosphorus (P), and potassium (K) concentrations (percent) in mg/L.
TreatmentsPlant Developmental Stage
VGPYFFEM
NPKNPKNPK
CT168 (100)31 (100)195 (100)168 (100)31 (100)195 (100)168 (100)31 (100)195 (100)
I-1126 (75)31 (100)146.25 (75)126 (75)31 (100)243.75 (125)168 (100)31 (100)195 (100)
I-2126 (75)31 (100)146.25 (75)126 (75)31 (100)243.75 (125)126 (75)31 (100)243.75 (125)
Table 2. Nutrient solution formulations of the four different treatments for the three developmental stages, including vegetative growth (VG), pollinated young fruit (PYF), and fruit enlargement and maturation (FEM) of hydroponic netted melon in Experiment II during spring–summer 2019. Nitrogen (N), phosphorus (P), and potassium (K) concentrations (percent) in mg/L.
TreatmentsPlant Developmental Stage
VGPYFFEM
NPKNPKNPK
I-1#126 (75)31 (100)146.25 (75)126 (75)31 (100)243.75 (125)168 (100)31 (100)195 (100)
II-1126 (75)31 (100)146.25 (75)126 (75)31 (100)243.75 (125)168 (100)31 (100)146.25 (75)
II-2168 (100)31 (100)195 (100)126 (75)31 (100)243.75 (125)168 (100)31 (100)195 (100)
II-3168 (100)31 (100)195 (100)126 (75)31 (100)243.75 (125)168 (100)31 (100)146.25 (75)
Table 3. Fruit morphological and chemical characteristics of netted melon fruits cultured from different nutrient treatments in Experiment I and II. The superscript letters indicated the results of post hoc tests. Statistical significances tested with one-way ANOVA were denoted by asterisk: p < 0.05 *, p < 0.01 **, p < 0.001 ***. Codes and details for experimental treatments refer to Table 1 and Table 2.
TreatmentsDays to Harvest
(d)
Fruit Weight
(g)
Fruit Shape Index
(Length/Width)
Flesh Thickness
(mm)
Pulp Firmness
(N·m2)
Dry Matter Ratio
(%)
TSS
(°Brix)
TSC
(mg/g)
Ascorbic Acid
(mg/L)
Fruit K
(mg/100 g FW)
Nitrate
(mg/L)
Experiment I, summer–autumn 2018
Day length: decreasing trend from 13.18 to 11.28 h/d
CT54.0 c ± 1.31383.1 ab ± 118.80.99 ± 0.0435.95 b ± 1.922.58 ± 0.447.63 c ± 0.6112.51 b ± 1.190.49 b ± 0.0676.8 ± 18.1327.8 b ± 33.63.0 ± 6.2
I-156.4 a ± 0.71506.9 a ± 143.71.00 ± 0.0339.28 a ± 3.242.51 ± 0.8810.76 a ± 0.3514.09 a ± 0.930.50 ab ± 0.0386.7 ± 26.2410.3 a ± 22.01.3 ± 4.6
I-255.2 b ± 1.11356.4 b ± 131.10.99 ± 0.0236.50 b ± 2.902.15 ± 0.789.45 b ± 1.0213.55 a ± 0.570.53 a ± 0.0582.5 ± 29.1402.0 a ± 22.33.8 ± 5.8
F ratio14.99 ***4.47 *0.09 ns5.08 *1.14 ns33.94 ***9.00 **3.36 *0.47 ns8.80 *0.59 ns
Experiment II, spring–summer 2019
Day length: increasing trend from 12.60 to 13.68 h/d
I-1#54.7 ± 2.11192.0 ± 88.61.02 ± 0.0335.43 ± 1.955.77 ab ± 0.7311.27 ± 0.74 0.49 ± 0.04176.3 ± 37.5523.8 ± 46.012.4 ± 14.8
II-154.4 ± 3.01107.4 ± 84.61.00 ± 0.0334.22 ± 2.266.07 a ± 0.6210.78 ± 0.7213.52 ± 0.710.53 ± 0.05156.1 ± 42.1508.9 ± 71.48.8 ± 6.0
II-254.3 ± 2.11194.8 ± 63.71.02 ± 0.0435.31 ± 3.075.27 ab ± 0.4110.44 ± 1.1213.44 ± 0.820.53 ± 0.02135.6 ± 20.8598.9 ± 119.44.4 ± 5.3
II-355.1 ± 2.11203.2 ± 122.11.03 ± 0.0234.71 ± 2.405.07 b ± 0.3510.93 ± 1.1213.61 ± 0.980.50 ± 0.05140.3 ± 33.1554.9 ± 25.28.0 ± 9.0
F ratio0.19 ns2.13 ns0.97 ns0.47 ns4.79 **1.18 ns0.33 ns2.07 ns2.59 ns0.86 ns1.06 ns

