Article

Temporal Variability in the Rhizosphere Bacterial and Fungal Community Structure in the Melon Crop Grown in a Closed Hydroponic System

1
Department of Bioenvironmental Systems Engineering, National Taiwan University, Taipei 10617, Taiwan
2
Department of Horticulture and Landscape Architecture, National Taiwan University, Taipei 10617, Taiwan
3
Department of Agronomy, National Taiwan University, Taipei 10617, Taiwan
*
Author to whom correspondence should be addressed.
Submission received: 4 March 2021 / Revised: 2 April 2021 / Accepted: 6 April 2021 / Published: 9 April 2021
(This article belongs to the Collection Nutrition Management of Hydroponic Vegetable Crops)

Abstract

:
Microbes can establish a pathogenetic or symbiotic relationship with plants in soil and aquatic ecosystems. Although change in bacterial and fungal community in soil and their interaction with plants have been widely studied, little is known about their community structure in hydroponic systems across plant growth stages under different nutrient treatments. This study used next-generation sequencing analysis to assess the temporal changes in melon rhizosphere bacterial and fungal community structure across six different nutrient treatments. We found significant changes in the microbial community composition (especially for bacteria) between growth stages (R = 0.25–0.63, p < 0.01) than nutrient treatments. Proteobacteria dominated the bacterial community at the phylum level across melon growth stages (59.8% ± 16.1%). The genera Chryseobacterium, Pseudomonas, and Massilia dominated the rhizosphere in the flowering and pollination stage, while Brevibacillius showed the highest relative abundance in the harvesting stage. However, the rhizosphere was dominated by uncultured fungal taxa, likely due to the application of fungicides (Ridomil MZ). Further, linear regression analysis revealed a weak influence of bacterial community structure on melon yield and quality, while fruit weight and quality moderately responded to Mg and K deficiency. Nevertheless, the relative abundance of bacterial genus Chryseobacterium in the vegetative stage showed a strong correlation with fruit weight (R2 = 0.75, p < 0.05), while genera Brevibacillus, Lysobacter, and Bosea in late growth stages strongly correlated with fruit sweetness. Overall, temporal variability in the microbial (especially bacterial) community structure exceeds the variability between nutrient treatments for the given range of nutrient gradient while having little influence on melon yield.

1. Introduction

The use of closed hydroponic systems (CHS) for fruit and vegetable production has become widespread in recent decades because of its many advantages over soil cultures (open loop systems) [1,2]. In conventional farming, nutrients in soil (e.g., ammonium and nitrate) that are at levels exceeding those required by plants and usually leach down from the root zone, threatening the environment and aquatic ecosystem [3,4]. By contrast, in a CHS, nutrient effluent is not discharged, resulting in substantial nutrient recycling and a consequent increase in potential yield per unit input; this is because nutrient recycling does not typically affect plant growth and quality [5,6]. However, water recycling in a CHS carries various challenges; these include first, the accumulation of cations (e.g., Ca+2, Na+, and NH 4 + ) and anions (Cl and NO 3 ) in the root zone due to accumulated plant water consumption (UC) over a long period of plant growth [7,8,9,10] and second, rapid microbial spread (including pathogens), where such contamination threatens the viability of a crop [11,12] and blunts the benefits of a CHS.
Microbes play various direct or indirect roles in carbon and nitrogen dynamics [13,14], and plant morphogenesis [15,16] at different stages of plant growth. Microbes are capable of detecting the plant host and colonizing the rhizosphere, and plants are capable of recognizing microbe-derived compounds and initiating their defense and growth strategies depending on the type of microorganisms encountered [17,18]. This change in communication results in different plant–microbe interactions ranging from pathogenesis to symbiosis [19]. Moreover, the addition of plant growth-promoting microorganisms (PGPMs) has been reported to improve plant quality and productivity, probably by stabilizing the microbial community in the root zone, competing with pathogens, and enhancing plant tolerance to stress conditions [20,21]. By contrast, the strong competition between plants and microbes for nutrients can reduce plant productivity and yield. For instance, the contamination of a CHS with ammonia oxidizers and denitrifiers can potentially reduce the amounts of ammonia and nitrate that are available for plant growth [22,23,24].
The abundance and diversity of microbial groups in a CHS are affected by multiple factors such as the crop type, the source of microbial contamination (e.g., substrates or irrigation water) [12], and the presence or absence of PGPMs [21]. In addition, the taxonomic diversity of fungi and bacteria is substantially affected by both abiotic and biotic variables and exhibits contrasting diversity patterns in response to environmental variables in various niches [13,25]; these may affect nutrient dynamics and, to some extent, pathogen survival (bacterial–fungal antagonism) in a CHS. Furthermore, literature suggests adapting the different composition of the nutrient solution at least three times during the cropping period of melon is recommended [26]. Therefore, change in salt and nutrient accumulation in the root zone can result in the environmental filtering of specific microbes in a CHS due to the differential responses of microbial communities to nutrient and salt availability [27,28]. However, no studies have examined the cumulative effect of nutrient concentration along melon growth stages on temporal changes of microbial communities in CHS system.
In this study, we used 16S rRNA- and ITS-targeted sequencing to assess changes in bacterial and fungal community structures in a CHS, which had a recirculating nutrient solution, along the nutrient treatments and growth stages of a melon crop. Melon was selected due to its relatively low sensitivity to salt accumulation among food crops when grown in a recirculated irrigation [7,29]. We hypothesized that: (1) bacterial and fungal community would be influenced by both nutrient treatments and melon growth stages, and (2) melon yield and quality would be affected by change in rhizosphere microbial community.

2. Materials and Methods

2.1. Experimental Design

Experiments were conducted at National Taiwan University from April to July. We selected muskmelon (Cucumis melo var. reticulatus Naud.) as the crop, which is commonly grown by local greenhouse farmers in Taiwan. Each hydroponic circuit had continuous recirculation, measured 9.7 m in length and 0.28 m in width, and accommodated 14 melon plants per season. Polyvinyl chloride and polyethylene plastic were used for tubing and solution reservoir and growth tray. To understand the effect of different nutrient levels, six nutrient solution (NS) concentrations were applied. For each treatment, N and K concentrations varied from 0% to 100% for each growth stage (Table 1). In each hydroponic circuit, a single catchment tank was used to supply and collect the returning NS. Deionized water without sterilization was used to prepare nutrient solution. Water loss through evaporation was negligible (data are not shown). The average greenhouse temperature over the growing season was 28.63 °C. The samples for molecular analysis were collected from rhizosphere (water surrounding the root zone).
Regarding melon sowing and transplantation of seedling, the seeds were soaked in the water for 3 h and then put on the rinsed filter papers on the glass petri dishes in the growth chamber with 28/25 °C, RH 70%~85% and darkness. When the radicals reached to 2.0~2.5 cm long, the seeds were transferred to 4 × 4 × 4 cm3 polyurethane sponges and then to the tubes in the plastic boxes. Light emitting diode with photosynthetic active radiation of 300~400 μmol·m−2·s−1 with light and dark interval for the period of 16 h and 8 h, respectively. The sponges were kept wet with water. On the 7th day, 1/2 concentration of Sheen′s formula [30] was applied and the nutrient was replaced every 4 days and then transferred to greenhouse. To prevent damping-off, vine blight and silver-leaf whitefly, the melon crop was sprayed with difenoconazole, pymetrozine, polyoxins, thiophanate-methyl, acetamiprid, azoxystrobin, pyriproxyfen, procymidone, deltamethrin at four-week rotation, and treated with, metalyxyl, mancozed at two-week rotation, while Ridomil MZ at low concertation were used as fungicide.

2.2. Analytical Methods

The nutrient solution was collected every 4 days from the planting to fruit harvesting stages and stored at 4 °C. Each sample was diluted 10- and 100-fold in a 1.5-mL sample vial for cation or anion analyses, respectively. All chemicals were of high purity and prepared per supplier′s guidelines. Standard solutions of anions and cations (High Purity Standards, North Charleston, SC, USA) were prepared to plot calibration curves, and they were composed of a blank solution and constituents with at least six different concentrations. Eluents were prepared daily, and an aqueous solution containing 9 mM sodium carbonate (Na2CO3; Sigma-Aldrich, St. Louis, MO, USA) was used for anions and 20 mM methanesulfonic acid (CH3SO3H; Sigma-Aldrich) was used for the elution of cations in Milli-Q water (18.2 MΩ; Merck Millipore, Burlington, MA, USA).
All analyses were performed using a Dionex Aquion ion chromatography system (comprising a Dionex AS-AP Autosampler; ThermoFisher Scientific, Sunnyvale, CA, USA). Separation for anions was conducted on a Dionex IonPac AS9-HC analytical column (250 msubsetsm × 4 mm i.d.) with an associated Dionex IonPac AG9-HC guard column (50 msubsetsm × 4 mm i.d.); separation for cations was conducted on a Dionex IonPac CS12A-HC analytical column (250 msubsetsm × 4 mm i.d.) with an associated Dionex IonPac CG12A guard column (50 msubsetsm × 4 mm i.d.). The eluents were suppressed using a Dionex AERS 500 (4 mm) suppressor for anions and Dionex CDRS 600 (4 mm) suppressor for cations. The analytes were detected in terms of suppressed conductivity at 30 °C. All retention data were collected at a column temperature of 30 °C and an eluent flow rate of 1.0 mL/min. An injection volume of 25 μL was used throughout this work. Windows-based Thermo Scientific Dionex Chromeleon chromatography data system software (version 7.2.9) was used for instrument control and data acquisition. Fruits were collected at the end of the mature stage, which is when they are completely ripe and when clear juice can be extracted from each fruit. Furthermore, we placed a drop of the fruit sample on a refractometer prism, PAL-1 (ATAGO, Tokyo, Japan), and then measured the Brix value (%). The ascorbic acid level was measured by placing a drop of the sample on an ascorbic acid test strip (Reflectoquant, EMD Millipore, Burlington, MA, USA), and the strip was then inserted into the reflectometer (RQflex 10, EMD Millipore). Flesh thickness (cm), expressing the thickness of the largest pulp, were measured with a pachymeter. Shape index was calculated by using ratio between the maximum height to maximum width of melon fruit. The complete procedure about experimental design and analytical analysis can be found in previous study [31].

2.3. DNA Extraction and Molecular Analysis

Nutrient solution samples were used to isolate total DNA by using a Qiagen′s DNeasy PowerWater Kit (Qiagen, Hilden, Germany). The concentration and purity of the total DNA isolate in the samples were measured using a NanoDrop 1000 spectrophotometer (ThermoFisher Scientific, Carlsbad, CA, USA). For bacterial 16S rRNA gene sequencing, the V3–V4 region was amplified using a specific primer set (319F: 5′-CCTACGGGNGGCWGCAG-3′, 806R: 5′-GACTACHVGGGTAT CTAATCC-3′), producing a fragment of 488 bp; this was conducted per the 16S metagenomic sequencing library preparation procedure (Illumina). The PCR products of bacteria were examined on 1.5% agarose gel, and samples were purified using the AMPure XP beads. The sequencing library was prepared according to the 16S metagenomisc sequencing library preparation procedure (Illumina). In brief, a secondary PCR was performed using the 16S rRNA V3–V4 region PCR amplicon and Nextera XT Index Kit with dual indices and Illumina sequencing adapters (Illumina). The quality of the indexed PCR product was assessed on the Qubit 4.0 Fluorometer (Thermo Scientific) and Qsep100TM system. An equal amount of the indexed PCR product was mixed to generate the sequencing library. Finally, the library was sequenced, and paired 300-bp reads were generated using an Illumina MiSeq platform. Sequences with ≥97% similarity were assigned to the same operational taxonomic units (OTUs).
For the fungi, ITS sequences (ITS1 region) were amplified using the forward primer of ITS5-1737F (5′-GGAAGTAAAAGTCGTAACAAGG-3′) and reverse primer of ITS2-2043R (5′-GCTGCGTTCTTCATCGATGC-3′). Amplicon sequencing was performed by using 307 bp paired-end raw reads and the entire paired-end reads were assembled using FLASH (v.1.2.11, Center for Computational Biology, College Park, MD, USA). Sequences were chimera-checked using UCHIME to obtain the effective tags and filtered from the data set before the OTUs clustering at 97% sequence identity using the UPARSE function in the USEARCH v.7 pipeline. To analyze the sequence similarities among different OTUs, multiple sequence alignment was conducted by using the PyNAST software (v.1.2.2-4) against the core-set dataset in the UNITE database v.8.2. A phylogenetic tree was constructed with a set of sequences representative of the OTUs using FastTree.
The complete procedure for 16S rRNA and ITS gene amplification was the same as that used by Mukhtar et al. and Lin et al. [13,14].

2.4. Statistical Analysis

Change in bacterial and fungal community composition was quantified using two axes of a nonmetric multidimensional scaling procedure performed on the Bray-Curtis dissimilarity matrix of bacterial and fungal communities in R software by using the vegan package (V-2.5-6, https://CRAN.R-project.org/package=vegan accessed on 8 April 2021). Analysis of similarities (ANOSIM) was used to determine the effect of nutrient treatments and melon growth stages on microbial beta diversity. Fist order (linear) regression analysis was used to determine the correlation between change in relative abundance of microbial taxa and fruit yield and quality. All statistical analyses were performed in R software unless mentioned otherwise.

3. Results

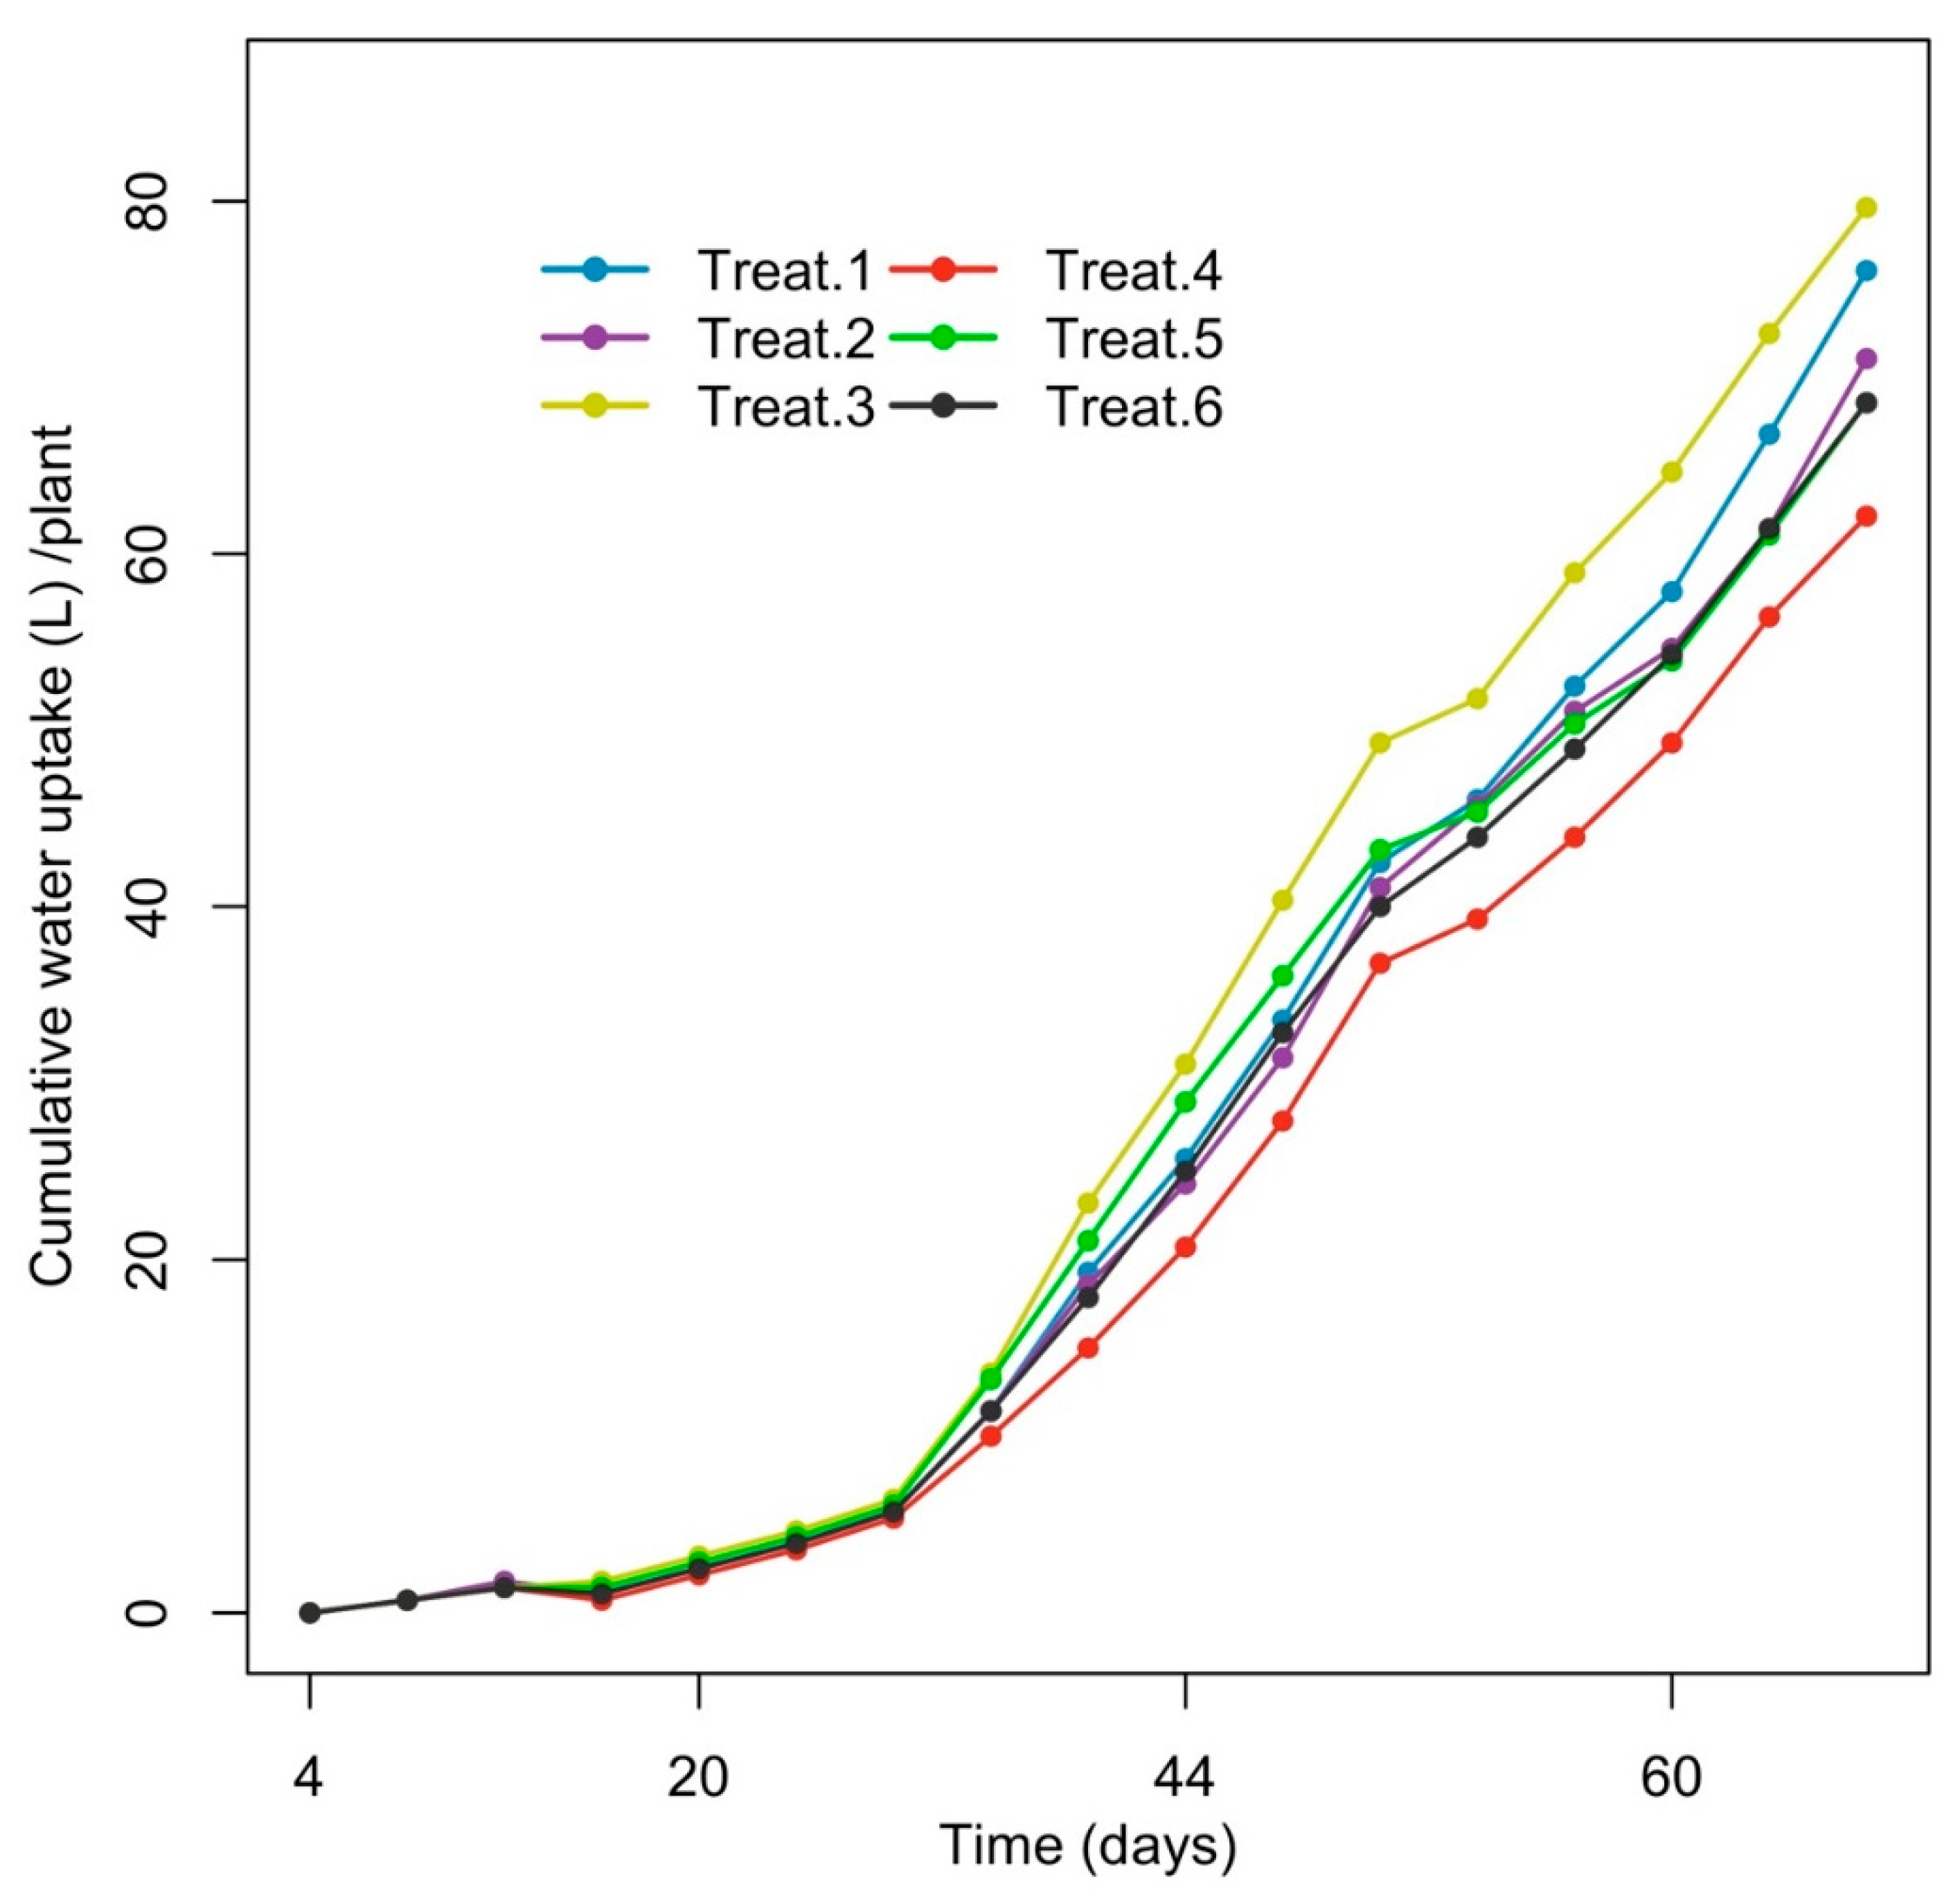
3.1. Cumulative Water Uptake

The water uptake in relation to time expressed as cumulative water uptake per plant (n = 14) is shown in Figure 1. The continuous recycling of the nutrient solution (NS) with the lower Mg concentration (25.0 mg/L of Mg) reduced the cumulative water consumption by melon plants by about 6.57 to 21.97% compared to the high Mg treatments (50.0 mg/L of Mg). Moreover, the highest and lowest cumulative water uptake per plant was observed for treatment 3 and 4, experiencing similar N and K treatments but different Mg concentrations (50 and 25 mg/L, respectively). Correspondingly, the water consumption was approximately 80 and 62 L/plant, respectively, over the growth period of 68 days. However, the water consumption by plants experiencing a lack of potassium in the final growth stages (see Figure 1) showed no considerable difference among Mg treatments.

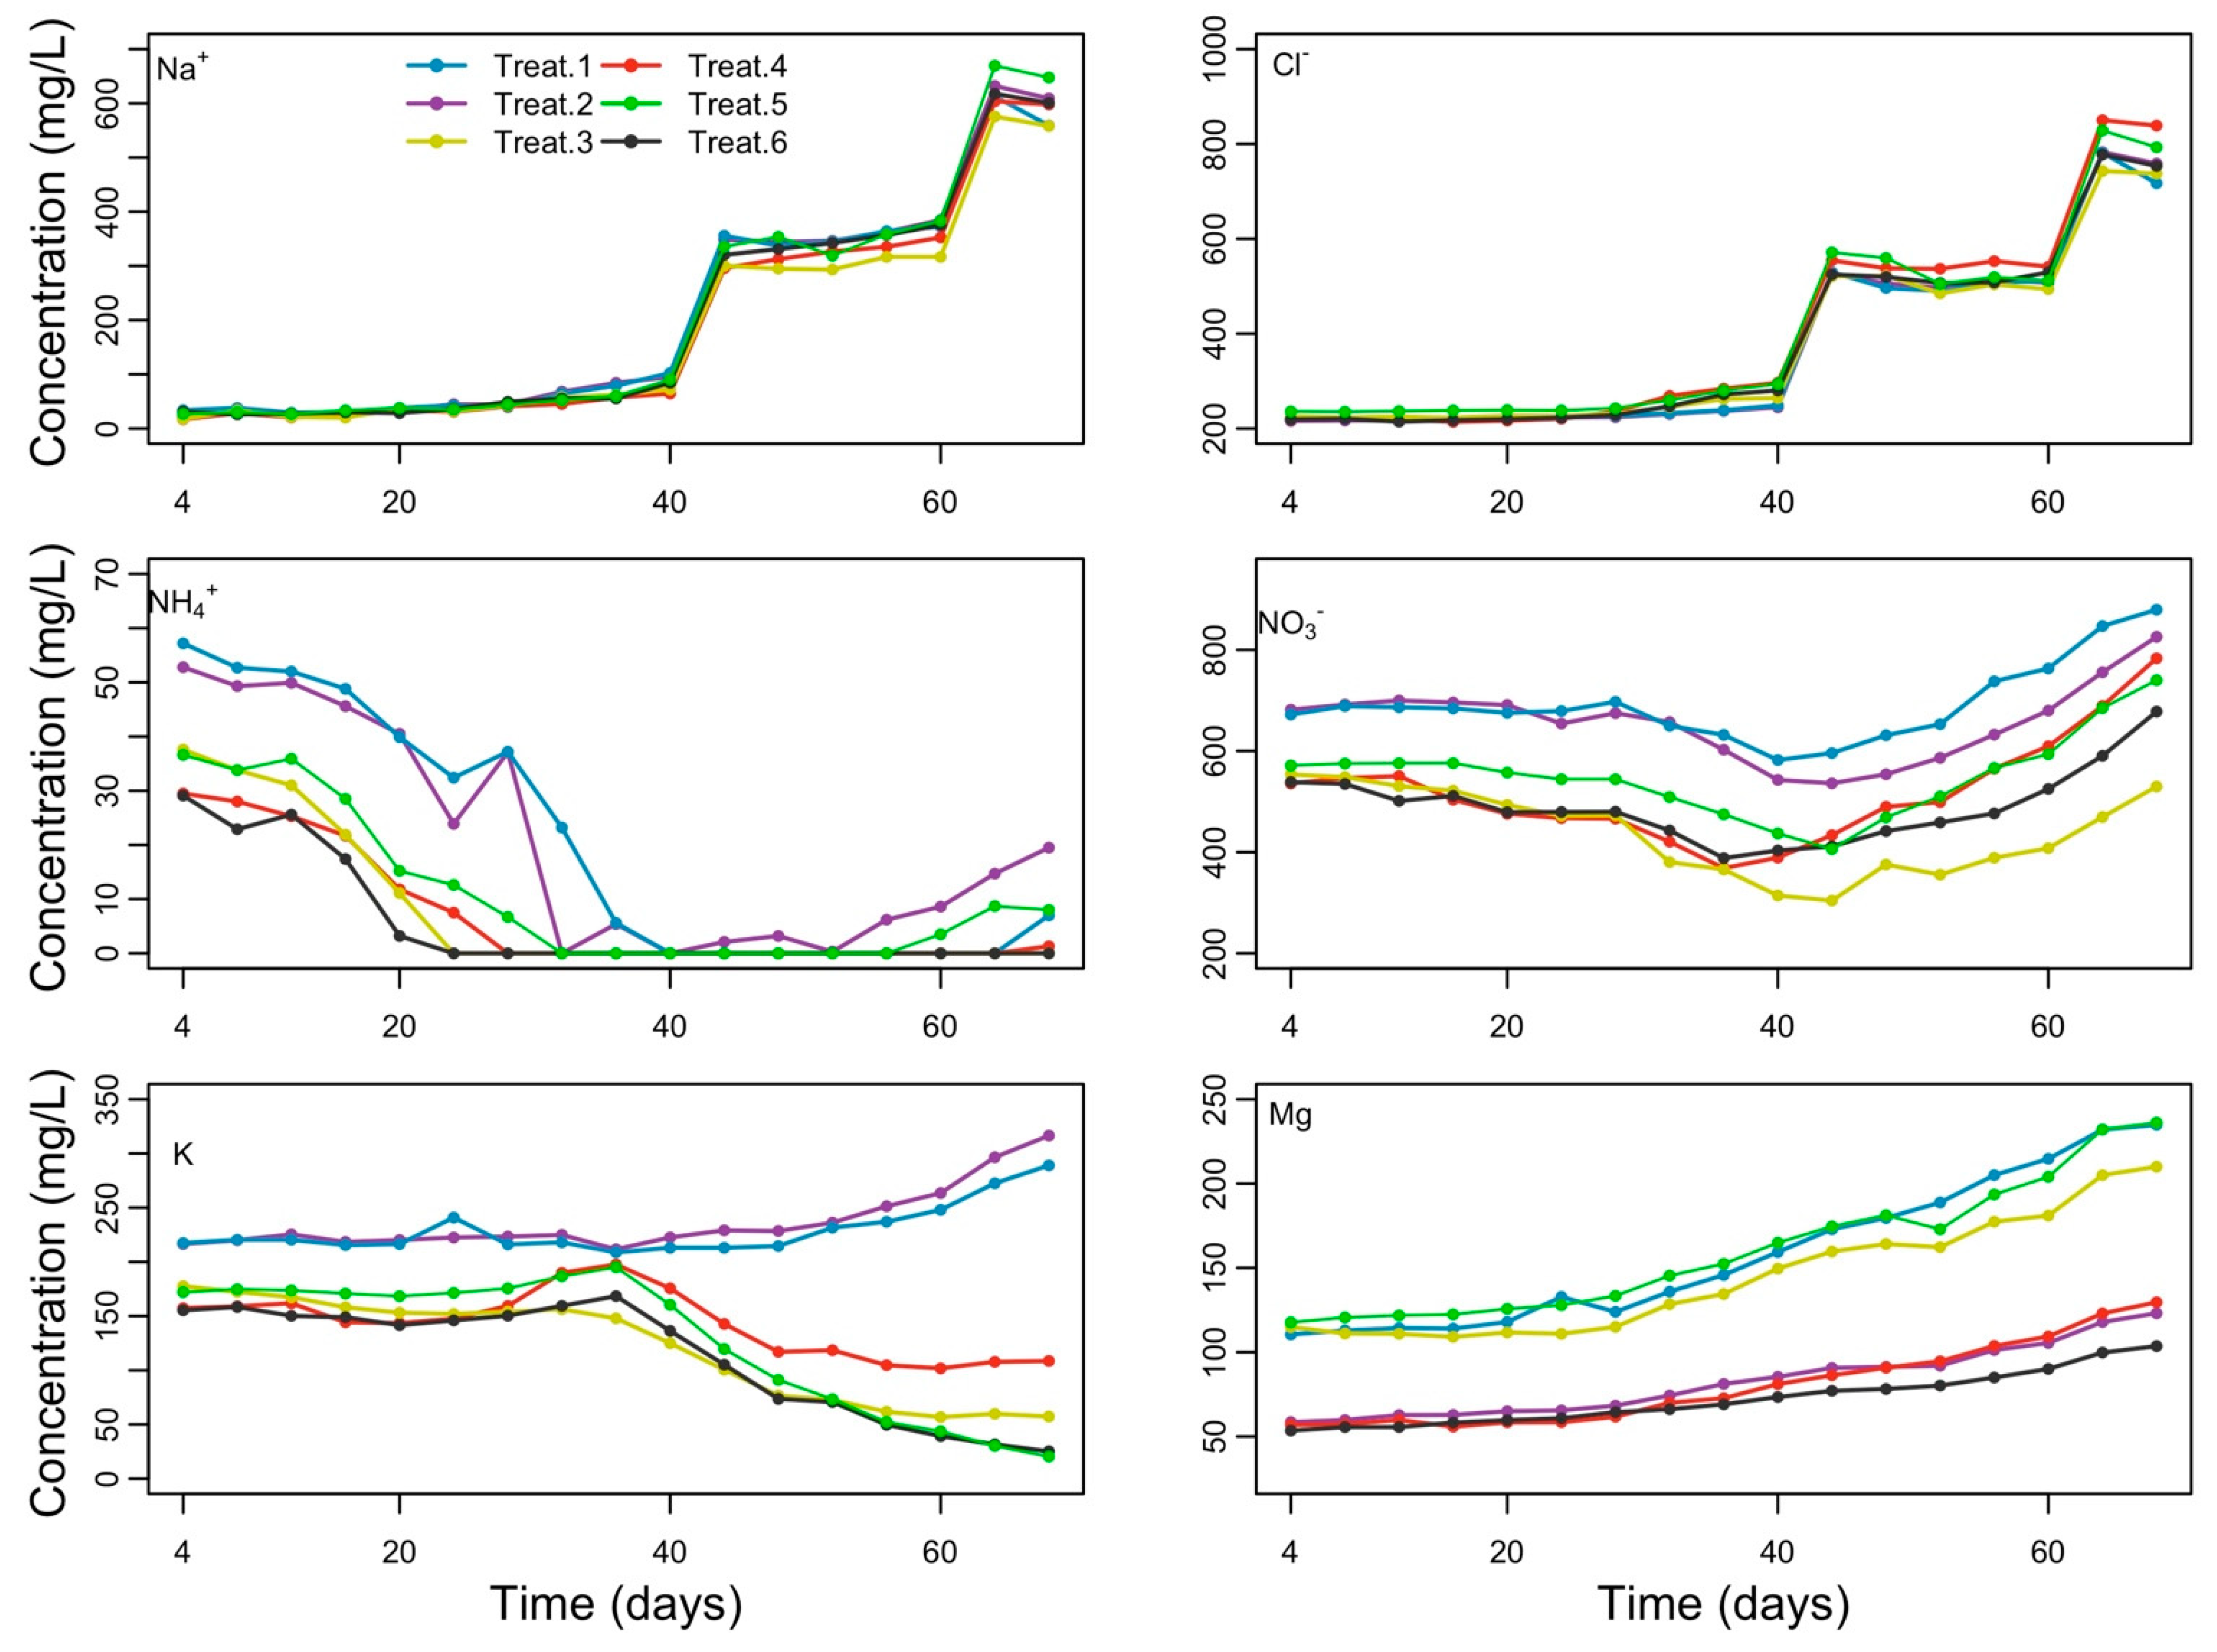
3.2. Nutrient Accumulation in the Root Zone

The mean NO 3 accumulation level in NS solution were 691.4 and 656.6 for treatment 1 and 2, respectively, and varied from 490.6 to 549.1 for the remaining treatment experience the 25% reduction in NO 3 concentration from vegetive to flowering growth stages. The accumulation of Mg linearly increased with time for all treatments. Moreover, despite receiving a high application rate of K at the second growth stage, the K concentration in drainage solution significantly decreased for treatment 3 to 6 experienced little or no application of K in the final growth stages (Figure 2).

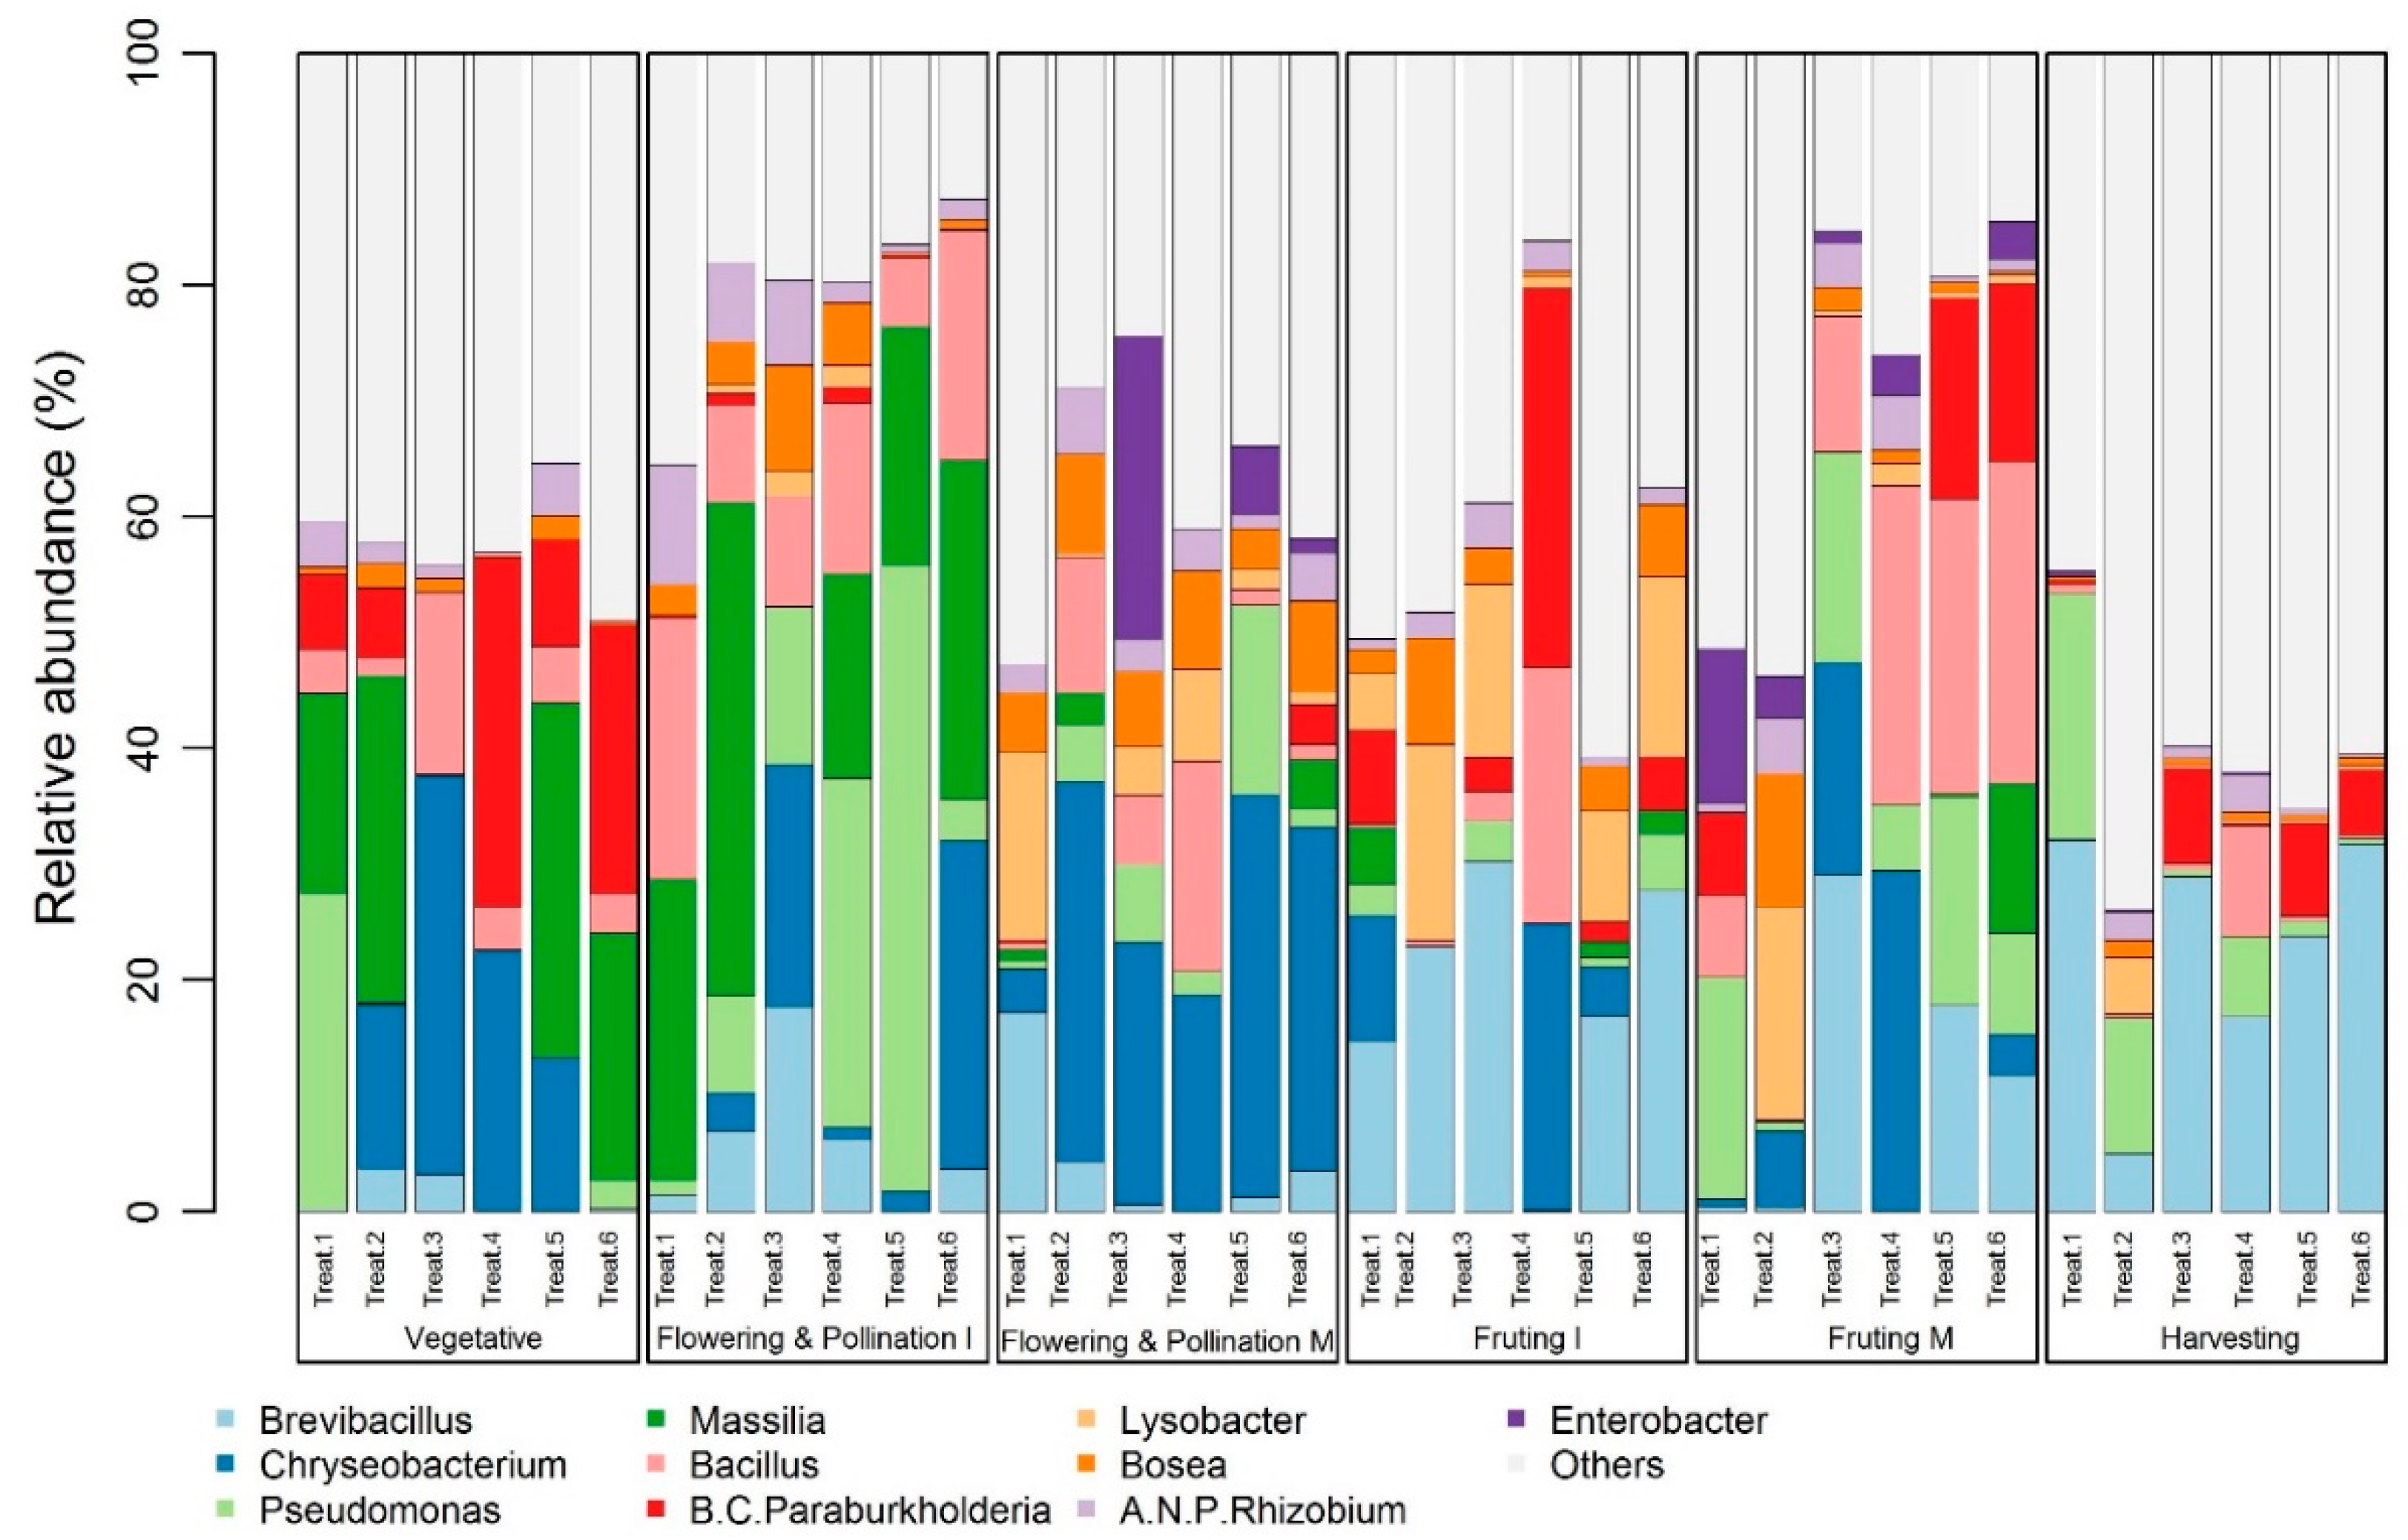
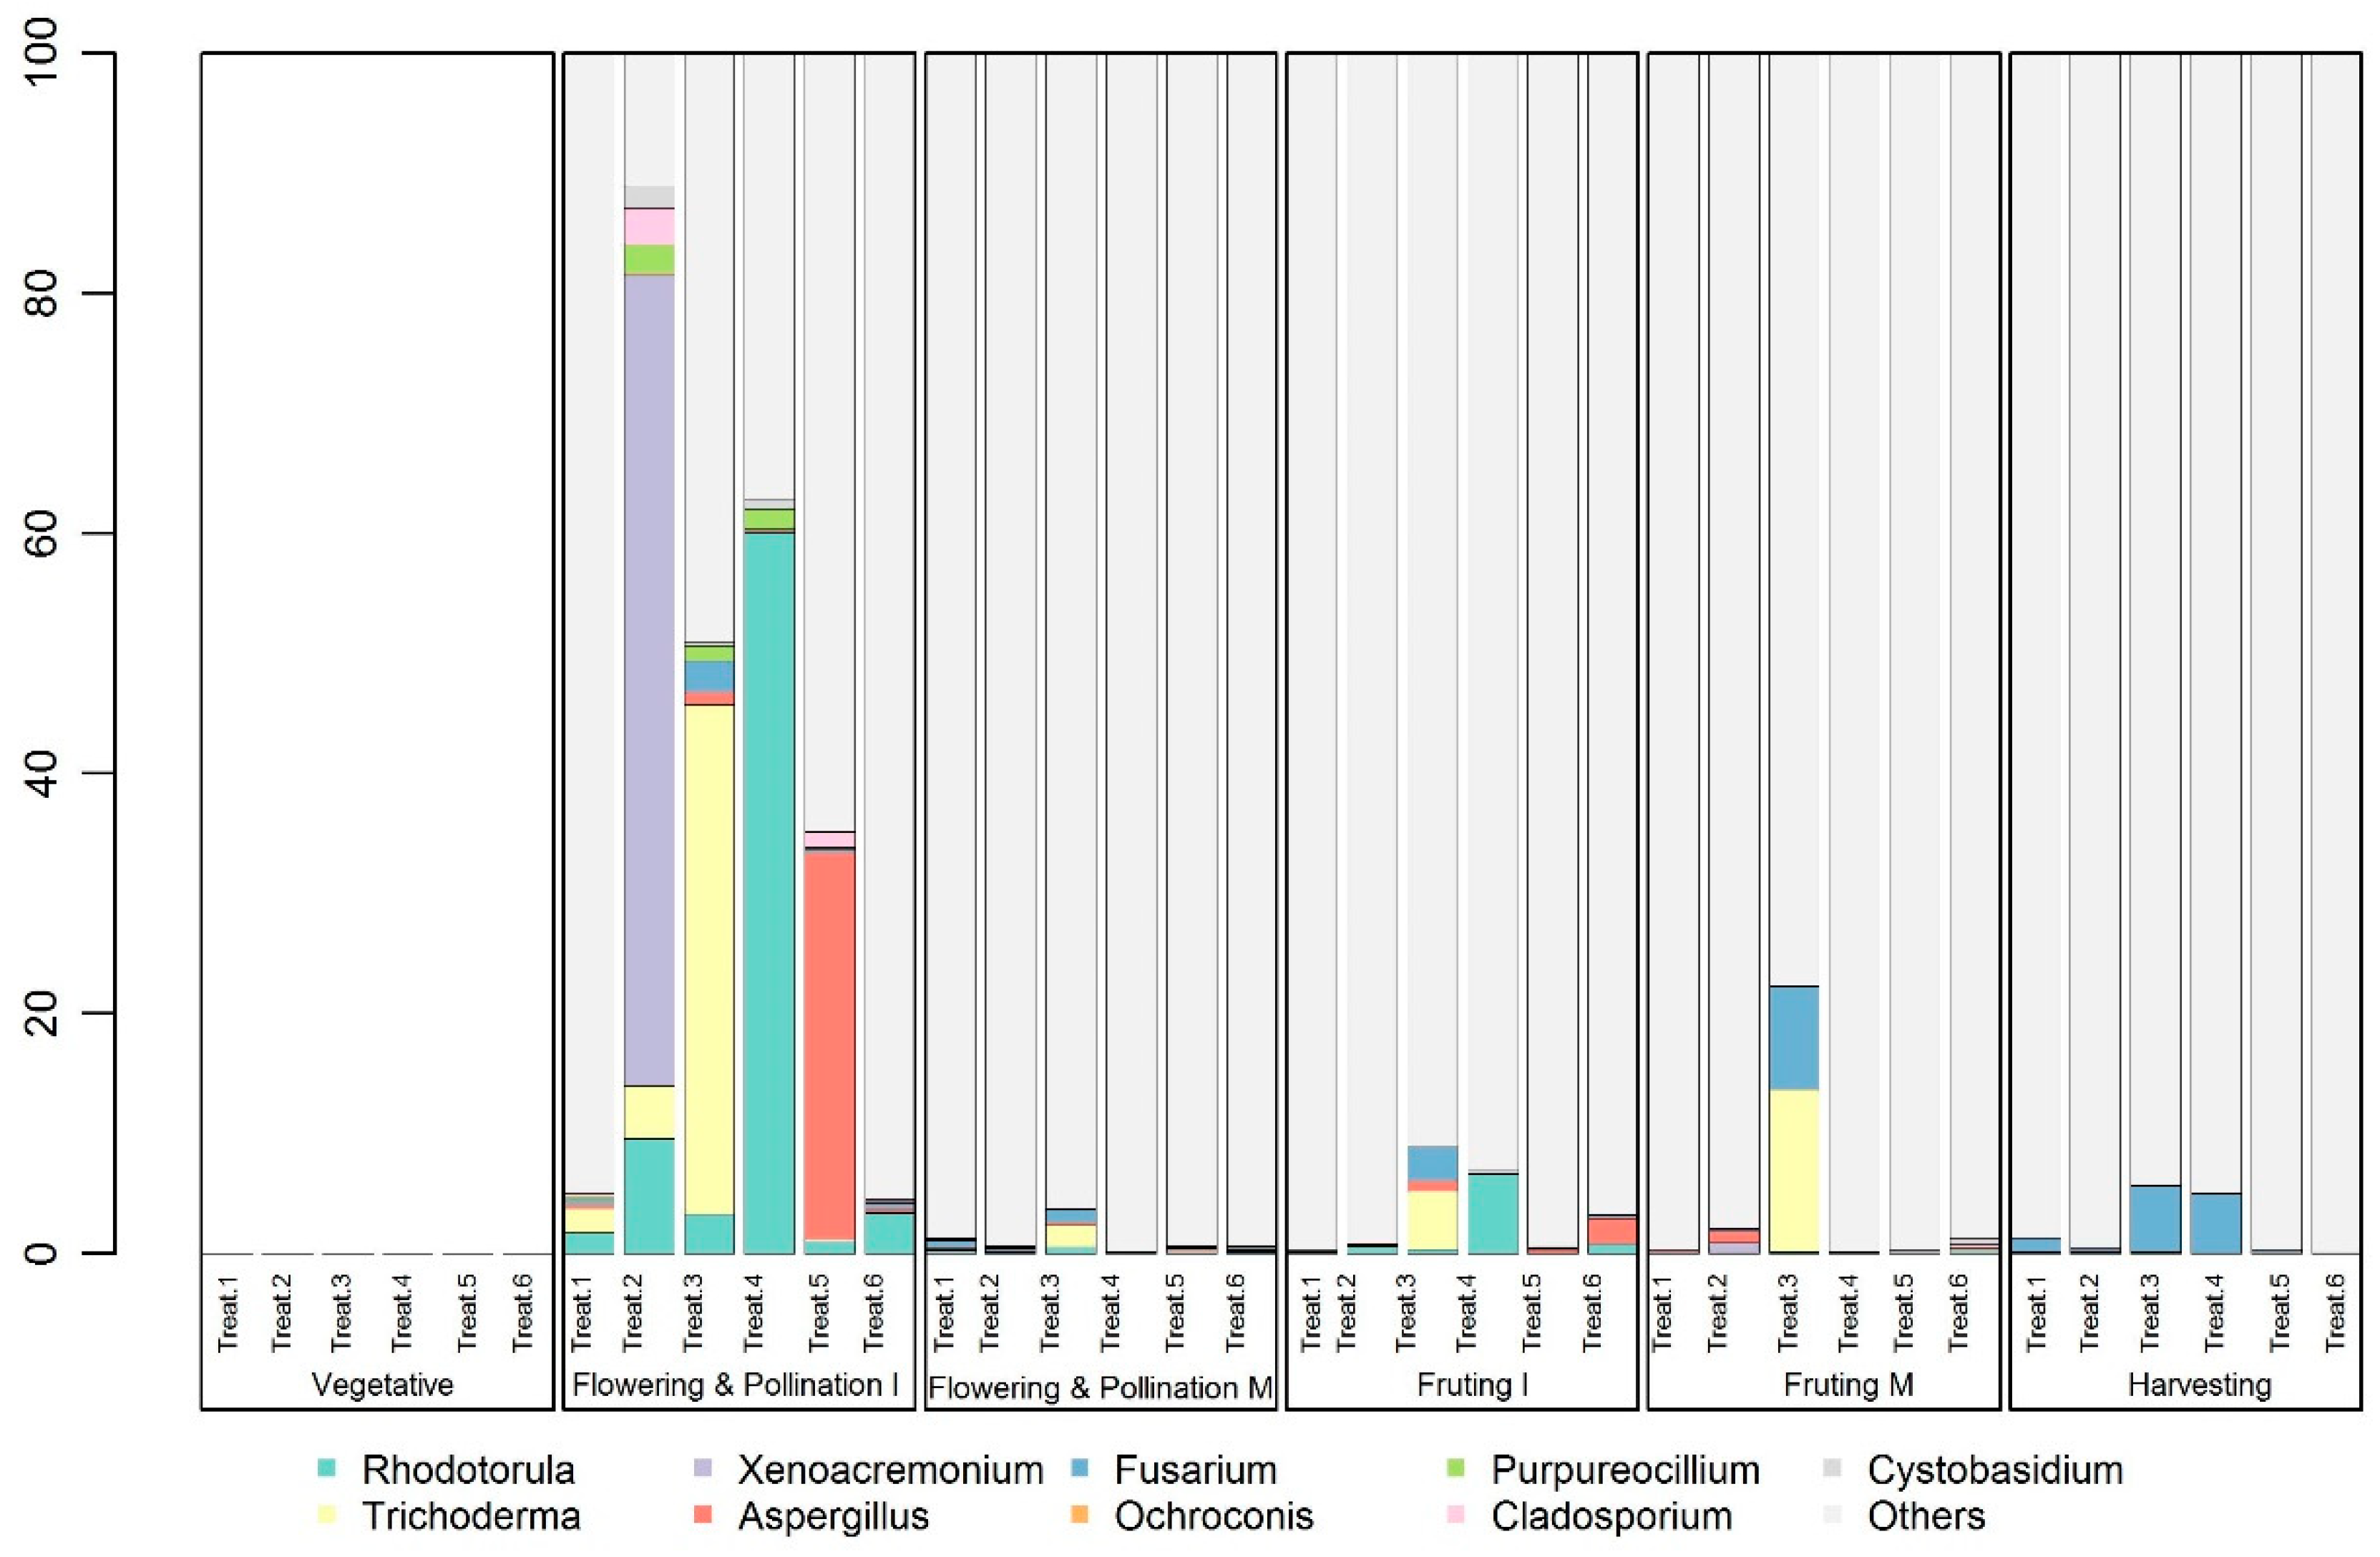
3.3. Shift in Microbial Community Composition in the Melon Plant Rhizosphere

The community compositions of bacteria and fungi significantly (p < 0.01) differed between growth stages. However, the difference was more obvious between the middle and final growth stages. Moreover, bacteria (R = 0.63) exhibited a more distinct community pattern than fungi (R = 0.25) did across melon growth stages (Figure 3). By contrast, bacterial and fungal community compositions did not significantly (p > 0.05) differ between nutrient treatments (Figure 3).

3.4. Shifts in the Relative Abundances of Specific Microbial Taxa

Bacterial communities were dominated by the following three phyla: Proteobacteria, Firmicutes, and Bacteroidetes (Figure 4). By contrast, fungal sequences consisted of largely unclassified sequences at the phylum level except for the harvesting stage, where the phyla were majorly dominated with Ascomycota and Basidiomycota (Figure S1).
The bacterial community in the recycling solution considerably differed over time and mildly differed across nutrient treatments. We found a significant (p < 0.05) increase in the relative abundance of Proteobacteria from vegetative to harvesting stages, whereas a significant decrease was observed for the relative abundance of Bacteroidetes for treatments 1, 2 and 3. However, the relative abundance of fungal communities only significantly (p < 0.05) differed between the harvesting and early growth stages and not among vegetative, and pollination, and fruiting stages. Moreover, the relative abundance of Ascomycota and Basidiomycota significantly differed between nutrient treatments in the harvesting stage.
At the genus level, bacterial communities were dominated by genera Chryseobacterium, Pseudomonas, and Massilia in early growth stages, whereas Brevibacillus and Lysobacter were dominant at the fruiting and harvesting stages (Figure 5). The relative abundance of Brevibacillus increased with the growth stage; the relative abundance was the highest in the harvesting stage and lowest in the vegetative and pollination stages. Fungal taxa primarily consisted of Rhodotorula and Trichoderma in the vegetative stage. Although the fruiting and harvesting stages were dominated by uncultured taxa of fungi at the genus level, Trichoderma and Fusarium exhibited the highest relative abundance compared with other taxa in the fruiting and harvesting stages, respectively (Figure 6).

3.5. Melon Yield and Fruit Quality

The highest fruit weight with maximum flesh thickness and sugar contents was observed for treatment 3, which experienced the highest level of K concentration (244 mg/L) during the flowering and pollination stage and the highest level of Mg concentration (50 mg/L) throughout the growth period. However, K concentration at zero mg/L in the supplied NS in the final growth stage reduced the average melon weight by approximately 8 to 15% compared to other treatments that experienced a partial or no reduction in K concentration (except for treatment 1). Moreover, the decrease in Mg concentration in NS further reduced the melon yield (treatment 4 and 6), while the opposite trend was observed for treatment 2. However, fruit weight significantly different (p < 0.05) only among treatment six and treatment 2 and 3. On the other hand, sugar content showed a slight difference among different treatments except treatments 1 and 2, which showed a significant decrease (p < 0.05) in sugar content with a 50% decrease in Mg concentration in NS (Table 2).
We measured the extent to which relative abundance of bacterial genera influence the melon fruit weight and sweetness (Figure 7). The relative abundance of Chryseobacterium in the vegetative growth stage showed a positive correlation with fruit weight. Moreover, fruit weight decreases with the increasing relative abundance of genus Burkholderia_Caballeronia_Paraburkholderia (R2 = 0.70, p < 0.05). In addition, the relative abundance of Lysobacter in the initial flowering and pollination stage and Allorhizobium_Neorhizobium_Pararhizobium_Rhizobium in the final fruiting growth stage showed a strong and positive correlation with fruit weight (Figure S2, Table S1).
The relative abundance of Lysobacter and Bosea in the fruiting and harvesting stage negatively correlated with fruit sweetness. In contrast, fruit sweetness showed a strong and positive correlation with genus Brevibacillus (R2 = 0.78, p < 0.05). The remaining bacterial genera showed a weak or non-significant correlation with both fruit weight and sweetness (Table S2, Figures S2 and S3).

4. Discussion

The mean plant water consumption was reduced by a decrease in Mg concentration in continuous recycling of the nutrient solution (NS). This observation was true for both treatments experienced partial or no change in macronutrients such as N and K concentration among different growth stages. These changes are likely due to the essential role of Mg in stomatal conductance of plants [32] and root growth, which could be influenced by the decrease in Mg concentration in NS [33,34] and photosynthetic carbon assimilation [35]. However, we found the negligible effect of Mg on plant water consumption for treatments, which also experienced a 100% decrease in K concentration in the final growth stages. These changes are likely associated with the cumulative effect of both K and Mg deficiency on plant growth, resulting in a similar shift in plant water consumption over the growth period.
The nitrogen concentration in the root zone over the crop cycle followed a hyperbolic function: it decreased from the vegetative stage to the fruiting and pollination stage and then increased toward the harvesting stage. These changes in the nutrient level over time are similar to that reported in a previous study on the melon crop [36]. The hyperbolic response of nitrate level could be attributed to: (1) high demand of N by the plant in the early and middle growth stages or (2) deficiency of K in final growth stages, which reduced the N uptake by the melon crop since K promotes energy generation which is required for moving nutrients in the plant, and protein synthesis [37,38,39]. Although the reduction of Mg concentration in NS reduced the melon yield as suggested previously, a partial decrease in K concentration in the final growth stage did not significantly affect the melon yield. This is because the continuous nutrient recycling in CHS enhances the nutrient concentration in NS. Hence, the reduction in K concentration in the final growth stages may be accommodated by K accumulated from previous stages. Therefore, splitting nutrient applications among different growth stages can optimize the nutrient use efficiency in CHS.
The dominance of bacterial (Proteobacteria, Firmicutes, and Bacteroidetes) and fungal (Ascomycota and Basidiomycota) phyla detected in our CHS was the same as that observed in a hydroponic system [21] and soil ecosystems [13,14,40] analyzed in previous studies. This similarity in results can be associated with the (1) high dispersion rate of the aforementioned phyla, which successfully colonized our CHS, or (2) the phyla′s behavior, which is typical of generalists, in relation to nutrient availability and their habitat.
The melon growth stage significantly affected microbial beta diversity. The harvesting, fruiting, and early stages (of vegetation to pollination) harbored significantly distinct microbial communities, especially for bacteria. The unique clustering of the harvesting stage and fruiting stage apart from the early stages was due to the change in the relative abundance of different taxa likely due to resource competition between and within the phyla, their ability to colonize the rhizosphere, bacterial-fungal antagonism [25], plant defense and growth strategies (plant-microbiome interactions), and presence of root exudation. For instance, the relative abundance of Massilia significantly changed over the growth period. These results in accord with those of a previous study, where Massilia was found at very early germinated stages, but the population declined rapidly in the following growth stages [41]. The genus Massilia is a type of copiotroph, and it can rapidly grow in conditions with sufficient carbon and energy [41]. Therefore, the decrease in the abundance of Massilia during muskmelon′s late growth period is potentially due to the paucity of carbon sources in nutrient solutions (or competition with other microorganisms). Our study found that the major bacteria in nutrient solutions changed to the Brevibacillus group at the harvesting stage. The increase in melon root size and nutrient availability over time might increase the relative abundance of Brevibacillus group since it has reported to dominant in wetlands and treatment tanks [42,43].
In this study, the fungal taxa were majorly dominated by uncultured phyla. The application of fungicide Ridomil MZ is likely to suppress the major fungal phyla which may result in the domination of other fungal taxa in CHS. Moreover, the application of Ridomil MZ is reported to enhance bacterial diversity (You et al., [44]), which further enhances the competition between fungal and bacterial taxa for resources and survival. For instance, the abundance of Trichoderma group, which is reported to be opportunistic by nature, antagonists of many phytopathogenic fungi and protect plant from diseases [45], significantly reduce toward harvesting stage. In addition, among fungal taxa at genus level, the major population at the harvesting stage was Fusarium. Yang et al. [46] reported that the muskmelon root exudate functions to stimulate Fusarium oxysporum spore germination and mycelial growth. Plant age as well as plant cultivars, and environmental factors are important factors that affect the composition and quantity of root exudates [47,48]. This might result in age-dependent responses of the Fusarium population, which exhibits an increased abundance toward the harvesting stage.

5. Conclusions

Plant-associated bacterial community was shown to be highly dynamic over time and developmental stage. Moreover, application of fungicide (Ridomil MZ) resulted in the domination of uncultured fungal taxa. However, melon yield and quality showed little response to change in observed microbial community structure; only melon weight and sweetness were correlated with bacterial taxa in final growth stages. Alternatively, melon yields moderately responded to Mg and K deficiency, while a partial decrease in K concentration in the final growth stage showed a negligible influence on melon yield. Though the effect of microbial community on melon yield requires further testing and development, these results would be of great value for the potential pathogen management (if contaminated) and nutrient management for the melon crop in a closed hydroponic system.

Supplementary Materials

The following are available online at https://0-www-mdpi-com.brum.beds.ac.uk/article/10.3390/agronomy11040719/s1, Table S1. Square of the correlation between relative abundance of bacteria genera and fruit weight. * p < 0.05, Table S2. Square of the correlation between relative abundance of bacteria genera and fruit sweetness. * p < 0.05, Figure S1: Change in dominant rhizosphere fungal taxa at the phylum level across different nutrient treatments and melon growth stages, Figure S2: Linear regression between selected bacterial genera and fruit weight, Figure S3: Linear regression between selected bacterial genera and fruit sweetness.

Author Contributions

The scope of this study was developed by Y.-P.L. and H.-F.L. The methods were evaluated by H.-F.L., C.-M.L. and S.-J.W. The data measurements were done by M.-C.K. The data analysis was done by C.-M.L. and Y.-P.L. The first manuscript draft was written by Y.-P.L., and was substantially revised by Y.-P.L., H.M. and S.-J.W. All authors have read and agreed to the published version of the manuscript.

Funding

This research was financially supported by the National Taiwan University (Nos. NTUCC−107L892608 and NTUCC−108L892608).

Acknowledgments

We would like to thank Jing-Tian Lin for his contribution in data collection.

Conflicts of Interest

The authors declare no conflict of interest.

References

  1. Rouphael, Y.; Colla, G. Growth, yield, fruit quality and nutrient uptake of hydroponically cultivated zucchini squash as affected by irrigation systems and growing seasons. Sci. Hortic. (Amst.) 2005, 105, 177–195. [Google Scholar] [CrossRef]
  2. Savvas, D.; Pappa, V.A.; Kotsiras, A.; Gizas, G. NaCl accumulation in a cucumber crop grown in a completely closed hydroponic system as influenced by NaCl concentration in irrigation water. Eur. J. Hortic. Sci. 2005, 70, 217. [Google Scholar]
  3. Shaaban, M.; Van Zwieten, L.; Bashir, S.; Younas, A.; Nunez-Delgado, A.; Chhajro, M.A.; Kubar, K.A.; Ali, U.; Rana, M.S.; Mehmood, M.A. A concise review of biochar application to agricultural soils to improve soil conditions and fight pollution. J. Environ. Manag. 2018, 228, 429–440. [Google Scholar] [CrossRef]
  4. Reis, S.; Bekunda, M.; Howard, C.M.; Karanja, N.; Winiwarter, W.; Yan, X.; Bleeker, A.; Sutton, M.A. Synthesis and review: Tackling the nitrogen management challenge: From global to local scales. Environ. Res. Lett. 2016, 11, 120205. [Google Scholar] [CrossRef]
  5. Savvas, D.; Passam, I. Hydroponic Production of Vegetables and Ornamentals; Savvas, D., Passam, H., Eds.; Embryo Publications: Athens, Greece, 2002; ISBN 9608002125. [Google Scholar]
  6. Raviv, M.; Krasnovsky, A.; Medina, S.; Reuveni, R. Assessment of various control strategies for recirculation of greenhouse effluents under semi-arid conditions. J. Hortic. Sci. Biotechnol. 1998, 73, 485–491. [Google Scholar] [CrossRef]
  7. Neocleous, D.; Savvas, D. NaCl accumulation and macronutrient uptake by a melon crop in a closed hydroponic system in relation to water uptake. Agric. Water Manag. 2016, 165, 22–32. [Google Scholar] [CrossRef]
  8. Neocleous, D.; Savvas, D. Simulating NaCl accumulation in a closed hydroponic crop of zucchini: Impact on macronutrient uptake, growth, yield, and photosynthesis. J. Plant Nutr. Soil Sci. 2017, 180, 283–293. [Google Scholar] [CrossRef]
  9. Neocleous, D.; Vasilakakis, M. Effects of NaCl stress on red raspberry (Rubus idaeus L. ‘Autumn Bliss’). Sci. Hortic. (Amst.) 2007, 112, 282–289. [Google Scholar] [CrossRef]
  10. Läuchli, A.; Grattan, S.R. Plant growth and development under salinity stress. In Advances in Molecular Breeding toward Drought and Salt Tolerant Crops; Springer: Berlin/Heidelberg, Germany, 2007; pp. 1–32. [Google Scholar]
  11. Stewart-Wade, S.M. Plant pathogens in recycled irrigation water in commercial plant nurseries and greenhouses: Their detection and management. Irrig. Sci. 2011, 29, 267–297. [Google Scholar] [CrossRef]
  12. Dankwa, A.S.; Machado, R.M.; Perry, J.J. Sources of food contamination in a closed hydroponic system. Lett. Appl. Microbiol. 2020, 70, 55–62. [Google Scholar] [CrossRef]
  13. Mukhtar, H.; Lin, C.-M.; Wunderlich, R.F.; Cheng, L.-C.; Ko, M.-C.; Lin, Y.-P. Climate and land cover shape the fungal community structure in topsoil. Sci. Total Environ. 2020, 751, 141721. [Google Scholar] [CrossRef]
  14. Lin, Y.-P.; Wunderlich, R.F.; Lin, C.-M.; Uphoff, N.; Schmeller, D.S.; Shipin, O.V.; Watanabe, T.; Mukhtar, H. Topsoil Microbial Community Structure Responds to Land Cover Type and Environmental Zone in the Western Pacific Region. Sci. Total Environ. 2020, 764, 144349. [Google Scholar] [CrossRef] [PubMed]
  15. Van Loon, L.C.; Bakker, P.; Pieterse, C.M.J. Systemic resistance induced by rhizosphere bacteria. Annu. Rev. Phytopathol. 1998, 36, 453–483. [Google Scholar] [CrossRef] [Green Version]
  16. Zhang, H.; Kim, M.-S.; Krishnamachari, V.; Payton, P.; Sun, Y.; Grimson, M.; Farag, M.A.; Ryu, C.-M.; Allen, R.; Melo, I.S. Rhizobacterial volatile emissions regulate auxin homeostasis and cell expansion in Arabidopsis. Planta 2007, 226, 839. [Google Scholar] [CrossRef] [PubMed]
  17. Pascale, A.; Proietti, S.; Pantelides, I.S.; Stringlis, I.A. Modulation of the root microbiome by plant molecules: The basis for targeted disease suppression and plant growth promotion. Front. Plant Sci. 2020, 10, 1741. [Google Scholar] [CrossRef] [PubMed]
  18. Rosier, A.; Medeiros, F.H.V.; Bais, H.P. Defining plant growth promoting rhizobacteria molecular and biochemical networks in beneficial plant-microbe interactions. Plant Soil 2018, 428, 35–55. [Google Scholar] [CrossRef] [Green Version]
  19. Ortíz-Castro, R.; Contreras-Cornejo, H.A.; Macías-Rodríguez, L.; López-Bucio, J. The role of microbial signals in plant growth and development. Plant Signal. Behav. 2009, 4, 701–712. [Google Scholar] [CrossRef] [PubMed] [Green Version]
  20. Lee, S.; Lee, J. Beneficial bacteria and fungi in hydroponic systems: Types and characteristics of hydroponic food production methods. Sci. Hortic. (Amst.) 2015, 195, 206–215. [Google Scholar] [CrossRef]
  21. Sheridan, C.; Depuydt, P.; De Ro, M.; Petit, C.; Van Gysegem, E.; Delaere, P.; Dixon, M.; Stasiak, M.; Aciksöz, S.B.; Frossard, E. Microbial community dynamics and response to plant growth-promoting microorganisms in the rhizosphere of four common food crops cultivated in hydroponics. Microb. Ecol. 2017, 73, 378–393. [Google Scholar] [CrossRef]
  22. Mukhtar, H.; Lin, Y.-P.; Anthony, J. Ammonia Oxidizing Archaea and Bacteria in East Asian Paddy Soils—A Mini Review. Environment 2017, 4, 84. [Google Scholar]
  23. Mukhtar, H.; Lin, Y.-P.; Shipin, O.V.; Petway, J.R. Modeling Nitrogen Dynamics in a Waste Stabilization Pond System Using Flexible Modeling Environment with MCMC. Int. J. Environ. Res. Public Health 2017, 14, 765. [Google Scholar] [CrossRef] [PubMed] [Green Version]
  24. Mukhtar, H.; Lin, Y.-P.; Lin, C.-M.; Petway, J.R. Assessing Thermodynamic Parameter Sensitivity for Simulating Temperature Response of Soil Nitrification. Environ. Sci. Process Impacts 2019, 21, 1596–1608. [Google Scholar] [CrossRef]
  25. Bahram, M.; Hildebrand, F.; Forslund, S.K.; Anderson, J.L.; Soudzilovskaia, N.A.; Bodegom, P.M.; Bengtsson-Palme, J.; Anslan, S.; Coelho, L.P.; Harend, H. Structure and function of the global topsoil microbiome. Nature 2018, 560, 233. [Google Scholar] [CrossRef]
  26. Neocleous, D.; Savvas, D. Effect of different macronutrient cation ratios on macronutrient and water uptake by melon (Cucumis melo) grown in recirculating nutrient solution. J. Plant. Nutr. Soil Sci. 2015, 178, 320–332. [Google Scholar] [CrossRef]
  27. Rath, K.M.; Maheshwari, A.; Rousk, J. Linking microbial community structure to trait distributions and functions using salinity as an environmental filter. mBio 2019, 10. [Google Scholar] [CrossRef] [PubMed] [Green Version]
  28. Hargreaves, S.K.; Williams, R.J.; Hofmockel, K.S. Environmental filtering of microbial communities in agricultural soil shifts with crop growth. PLoS ONE 2015, 10, e0134345. [Google Scholar] [CrossRef] [PubMed]
  29. Cohen, R.; Burger, Y.; Horev, C.; Porat, A.; Edelstein, M. Performance of Galia-type melons grafted on to Cucurbita rootstock in Monosporascus cannonballus-infested and non-infested soils. Ann. Appl. Biol. 2005, 146, 381–387. [Google Scholar] [CrossRef]
  30. Tzay-Fa, S. Effects of NO3/NH4 Ratio and Depth of Nutrient Solution on the Growth of Greenhouse Muskmelon. J. Agric. Res. China 1989, 38, 1. (In Chinese) [Google Scholar]
  31. Lin, J.-T. Effect of nutrient temperature on growth and development of deep flow technique hydroponic netted melon. Master’s Thesis, National Taiwan University, Taipei, Taiwan, July 2018. [Google Scholar]
  32. Cakmak, I.; Kirkby, E.A. Role of magnesium in carbon partitioning and alleviating photooxidative damage. Physiol. Plant. 2008, 133, 692–704. [Google Scholar] [CrossRef]
  33. Senbayram, M.; Gransee, A.; Wahle, V.; Thiel, H. Role of magnesium fertilisers in agriculture: Plant–soil continuum. Crop Pasture Sci. 2016, 66, 1219–1229. [Google Scholar] [CrossRef]
  34. Hermans, C.; Johnson, G.N.; Strasser, R.J.; Verbruggen, N. Physiological characterisation of magnesium deficiency in sugar beet: Acclimation to low magnesium differentially affects photosystems I and II. Planta 2004, 220, 344–355. [Google Scholar] [CrossRef] [PubMed] [Green Version]
  35. Tränkner, M.; Tavakol, E.; Jákli, B. Functioning of potassium and magnesium in photosynthesis, photosynthate translocation and photoprotection. Physiol. Plant. 2018, 163, 414–431. [Google Scholar] [CrossRef] [PubMed] [Green Version]
  36. Pardossi, A.; Falossi, F.; Malorgio, F.; Incrocci, L.; Bellocchi, G. Empirical models of macronutrient uptake in melon plants grown in recirculating nutrient solution culture. J. Plant. Nutr. 2005, 27, 1261–1280. [Google Scholar] [CrossRef]
  37. Usherwood, N.R. The role of potassium in crop quality. Potassium Agric. 1985, 489–513. [Google Scholar]
  38. Ashley, M.K.; Grant, M.; Grabov, A. Plant responses to potassium deficiencies: A role for potassium transport proteins. J. Exp. Bot. 2006, 57, 425–436. [Google Scholar] [CrossRef] [PubMed] [Green Version]
  39. Lawton, K.; Cook, R.L. Potassium in plant nutrition. In Advances in Agronomy; Elsevier: Amsterdam, The Netherlands, 1954; Volume 6, pp. 253–303. ISBN 0065-2113. [Google Scholar]
  40. Karimi, B.; Terrat, S.; Dequiedt, S.; Saby, N.P.A.; Horrigue, W.; Lelièvre, M.; Nowak, V.; Jolivet, C.; Arrouays, D.; Wincker, P. Biogeography of soil bacteria and archaea across France. Sci. Adv. 2018, 4, eaat1808. [Google Scholar] [CrossRef] [PubMed] [Green Version]
  41. Ofek, M.; Hadar, Y.; Minz, D. Ecology of root colonizing Massilia (Oxalobacteraceae). PLoS ONE 2012, 7, e40117. [Google Scholar] [CrossRef] [PubMed]
  42. Bernardes, F.S.; Herrera, P.G.; Chiquito, G.M.; Morales, M.F.; Castro, A.P.; Paulo, P.L. Relationship between microbial community and environmental conditions in a constructed wetland system treating greywater. Ecol. Eng. 2019, 139, 105581. [Google Scholar] [CrossRef]
  43. Choi, M.-J.; Bae, J.-Y.; Kim, K.-Y.; Kang, H.; Cha, C.-J. Brevibacillus fluminis sp. nov., isolated from sediment of estuarine wetland. Int. J. Syst. Evol. Microbiol. 2010, 60, 1595–1599. [Google Scholar] [CrossRef]
  44. You, C.; Zhang, C.; Kong, F.; Feng, C.; Wang, J. Comparison of the effects of biocontrol agent Bacillus subtilis and fungicide metalaxyl–mancozeb on bacterial communities in tobacco rhizospheric soil. Ecol. Eng. 2016, 91, 119–125. [Google Scholar] [CrossRef]
  45. Vinale, F.; Sivasithamparam, K.; Ghisalberti, E.L.; Marra, R.; Woo, S.L.; Lorito, M. Trichoderma–plant–pathogen interactions. Soil Biol. Biochem. 2008, 40, 1–10. [Google Scholar] [CrossRef]
  46. An, P.; Inanaga, S.; Lux, A.; Li, X.J.; Ali, M.E.K.; Matsui, T.; Sugimoto, Y. Effects of salinity and relative humidity on two melon cultivars differing in salt tolerance. Biol. Plant. 2002, 45, 409–415. [Google Scholar] [CrossRef]
  47. Aulakh, M.S.; Wassmann, R.; Bueno, C.; Kreuzwieser, J.; Rennenberg, H. Characterization of root exudates at different growth stages of ten rice (Oryza sativa L.) cultivars. Plant Biol. 2001, 3, 139–148. [Google Scholar] [CrossRef] [Green Version]
  48. Gargallo-Garriga, A.; Preece, C.; Sardans, J.; Oravec, M.; Urban, O.; Peñuelas, J. Root exudate metabolomes change under drought and show limited capacity for recovery. Sci. Rep. 2018, 8, 12696. [Google Scholar]
Figure 1. Cumulative water consumption per plant (n = 14) over time in melons grown by closed hydroponic system treated with different nutrient concentrations.
Agronomy 11 00719 g001
Figure 2. Salt and nutrient accumulation over time in closed hydroponic system.
Agronomy 11 00719 g002
Figure 3. Nonmetric multidimensional scaling of the community structure of bacteria (a,c) and fungi (b,d).
Agronomy 11 00719 g003
Figure 4. Change in dominant rhizosphere bacterial taxa at the phylum level across different nutrient treatments and melon growth stages. The data on fungal taxa can be found in Supplementary Material (Figure S1).
Agronomy 11 00719 g004
Figure 5. Change in dominant rhizosphere bacterial taxa at the genus level across different nutrient treatments and melon growth stages.
Agronomy 11 00719 g005
Figure 6. Change in dominant rhizosphere fungal taxa at the genus level across different nutrient treatments and melon growth stages.
Agronomy 11 00719 g006
Figure 7. Linear regression between selected bacterial genera and (a,b) fruit weight and (ce) fruit sweetness. Blue-square and orange-dotted lines indicate data points and first-order regression fit to the data set, respectively. Row ‘(ae)’ indicate relative abundance of genera Chryseobacterium, Burkholderia_Caballeronia_Paraburkholderia, Brevibacillus, Lysobacter, and Bosea. Linear regression between all top ten dominated bacterial genera and fruit weight and fruit sweetness can be found in Figure S2 and S3 (Supplementary Material), respectively.
Agronomy 11 00719 g007
Table 1. Composition of NS solution used to replenish the water in the CHS among different growth stages.
StageGrowth Stage Treat.1Treat.2Treat.3Treat.4Treat.5Treat.6
1Vegetative NH 4 + 363627272727
NO 3 620620465465465465
K195195146146146146
Mg502550255025
2Flowering and pollination I + flowering and pollination M NH 4 + 363627272727
NO 3 620620465465465465
K195195244244244244
Mg502550255025
3fruiting I + fruiting M + Harvesting NH 4 + 363636363636
NO 3 620620620620620620
K195195484800
Mg502550255025
All measurements are in mg/L
Table 2. The change in fruit weight and quality (n = 6) among different nutrient treatments. * p < 0.05.
TreatmentsWeightShape IndexFlesh ThicknessSugar ContentAscorbic Acid
(kg)(cm)(Brix)(mg·L−1)
Treat. 11.56 ± 0.060.92 ± 0.063.92 ± 0.2411.21 ± 1.63 *155 ± 32.06
Treat. 21.84 ± 0.27 *0.98 ± 0.024.05 ± 0.319.11 ± 0.67 *91.50 ± 39.98
Treat. 31.85 ± 0.27 *1.01 ± 0.064.19 ± 0.2111.35 ± 1.88112.50 ± 44.37
Treat. 41.79 ± 0.131.04 ± 0.034.10 ± 0.1510.95 ± 0.77136.00 ± 46.04
Treat. 51.63 ± 0.201.00 ± 0.054.00 ± 0.1610.82 ± 0.60120.33 ± 39.95
Treat. 61.51 ± 0.09 *1.00 ± 0.044.00 ± 0.1711.00 ± 1.38132.17 ± 21.92
Publisher’s Note: MDPI stays neutral with regard to jurisdictional claims in published maps and institutional affiliations.

