Article

Estimation of the Genetic Diversity and Population Structure of Thailand’s Rice Landraces Using SNP Markers

by
Wanchana Aesomnuk
1,2,
Siriphat Ruengphayak
3,
Vinitchan Ruanjaichon
4,
Tanee Sreewongchai
5,
Chanate Malumpong
6,
Apichart Vanavichit
3,6,
Theerayut Toojinda
4,
Samart Wanchana
4,* and
Siwaret Arikit
3,6,*
1
Center for Agricultural Biotechnology (CAB), Kasetsart University, Kamphaeng Saen Campus, Nakhon Pathom 73140, Thailand
2
Center of Excellence on Agricultural Biotechnology: (AG-BIO/PERDO-CHE), Bangkok 10900, Thailand
3
Rice Science Center, Kamphaeng Saen Campus, Kasetsart University, Nakhon Pathom 73140, Thailand
4
National Center for Genetic Engineering and Biotechnology (BIOTEC), 113 Thailand Science Park, Pahonyothin Road, Khlong Nueng, Khlong Luang, Pathum Thani 12120, Thailand
5
Department of Agronomy, Faculty of Agriculture, Kasetsart University, Bangkhen, Bangkok 10900, Thailand
6
Department of Agronomy, Faculty of Agriculture at Kamphaeng Saen, Kamphaeng Saen Campus, Kasetsart University, Nakhon Pathom 73140, Thailand
*
Authors to whom correspondence should be addressed.
Submission received: 19 April 2021 / Revised: 11 May 2021 / Accepted: 14 May 2021 / Published: 17 May 2021

Abstract

:
Rice is a staple food for more than half of the world’s population. Modern rice varieties have been developed for high yield and quality; however, there has been a substantial loss of diversity. A greater number of genetically dynamic landraces could offer valuable and useful genetic resources for rice improvement. In this study, the genetic diversity and population structure of 365 accessions of lowland and upland landraces from four populations from different geographical regions of Thailand were investigated using 75 SNP markers. Clustering analyses using maximum likelihood, Principal Coordinate Analysis (PCoA), and Discriminant Analysis of Principal Components (DAPC) clustered these landraces into two main groups, corresponding to indica and japonica groups. The indica group was further clustered into two subgroups according to the DAPC and STRUCTURE analyses (K = 3). The analysis of molecular variance (AMOVA) analysis results revealed that 91% of the variation was distributed among individuals, suggesting a high degree of genetic differentiation among rice accessions within the populations. Pairwise FST showed the greatest genetic differentiation between the northeastern and southern populations and the smallest genetic differentiation between the northern and northeastern populations. Isolation-by-distance analysis based on a Mantel test indicated a significant relationship between the genetic distance and geographic distance among the Thai rice landraces. The results from this study provide insight into the genetic diversity of Thai rice germplasm, which will enhance the germplasm characterization, conservation, and utilization in rice genetics and breeding.

1. Introduction

Rice (Oryza sativa L.) is one of the most important cereal grains in the world and serves as a staple food for more than half of the world’s population [1]. Rice is grown in more than 100 countries, with 90% of the global production from Asia [2]. Research has estimated that about 120,000 distinct rice varieties exist in the world [1]. Southeast Asia is important as the main source of rice germplasm and the source of rice diversity [3]. Asian cultivated rice (O. sativa L.) was domesticated from the wild rice species, O. nivara and O. rufipogon [1], and can be assigned to either the subspecies indica or japonica depending on a variety of physiological and morphological characteristics [4]. The subspecies indica is primarily grown in the tropical regions, while the subspecies japonica is grown in either the subtropical and temperate regions of East Asia [5].
Modern rice varieties have been developed for both high yield and high quality [6]. However, these rice varieties exhibit a loss of diversity, which leads to a wide range of effects regarding adaptations to changing environments [7]. Landraces, on the other hand, have been found to be genetically dynamic and display equilibrium with both the environment and pathogens; thus, they could provide valuable and useful genetic resources for crop improvement [8]. Landrace variation has become interesting knowledge for conservation and utilization [9]. However, landraces have declined in popularity, and a number of landraces are gradually being replaced by improved varieties. There is an urgent need to conserve the landraces that are rapidly declining as high-yield varieties become predominant.
Studies on genetic diversity and population structure are critical for characterizing the genetic relationship among germplasm accessions. Genetic variation among populations and their genetic relationships aid in the conservation and parental selection in crop improvement programs [10]. The identification of populations with a high level of genetic variation will become a valuable resource for broadening the genetic base as this enables the identification of superior alleles for several traits [11]. Numerous techniques can be used to determine rice genetic variations in order to comprehend and use accessible gene bank accessions. Initially, isozyme markers were used to evaluate rice genetic diversity [12]; however, these have now been replaced with DNA markers, such as simple sequence repeats (SSRs), microsatellites [13,14], and single nucleotide polymorphisms (SNPs) [15,16,17,18].
Thailand is one of the countries with a significant number of indigenous rice varieties and landraces, which can serve as a valuable genetic resource for future crop improvement to satisfy the ever-increasing demand for food production. Over 17,000 traditional landraces have been conserved at the National Rice Gene Bank collection. To effectively utilize this germplasm, an assessment and classification of the diversity is necessary. While studies on genetic diversity are available for many rice collections around the world [19,20], those for Thai rice germplasm have been conducted on limited sets of accessions [21,22,23,24,25]. According to the previous studies on the genetic structure of Thai rice evaluated using indel and simple sequence repeat (SSR) markers, two distinct groups of rice accessions have been revealed to correspond to indica and japonica groups [23,24]. However, the genetic structures of lowland and upland landraces from different geographical regions of Thailand are still largely unknown.
In this study, we used a set of SNP markers to investigate the genetic diversity and population structure of a collection of lowland and upland landraces, consisting of 365 accessions obtained from four geographical regions of Thailand. The results from this study provide an insight into the genetic diversity of the Thai rice germplasm, which will enhance germplasm characterization, conservation, and utilization in rice genetics and breeding.

2. Materials and Methods

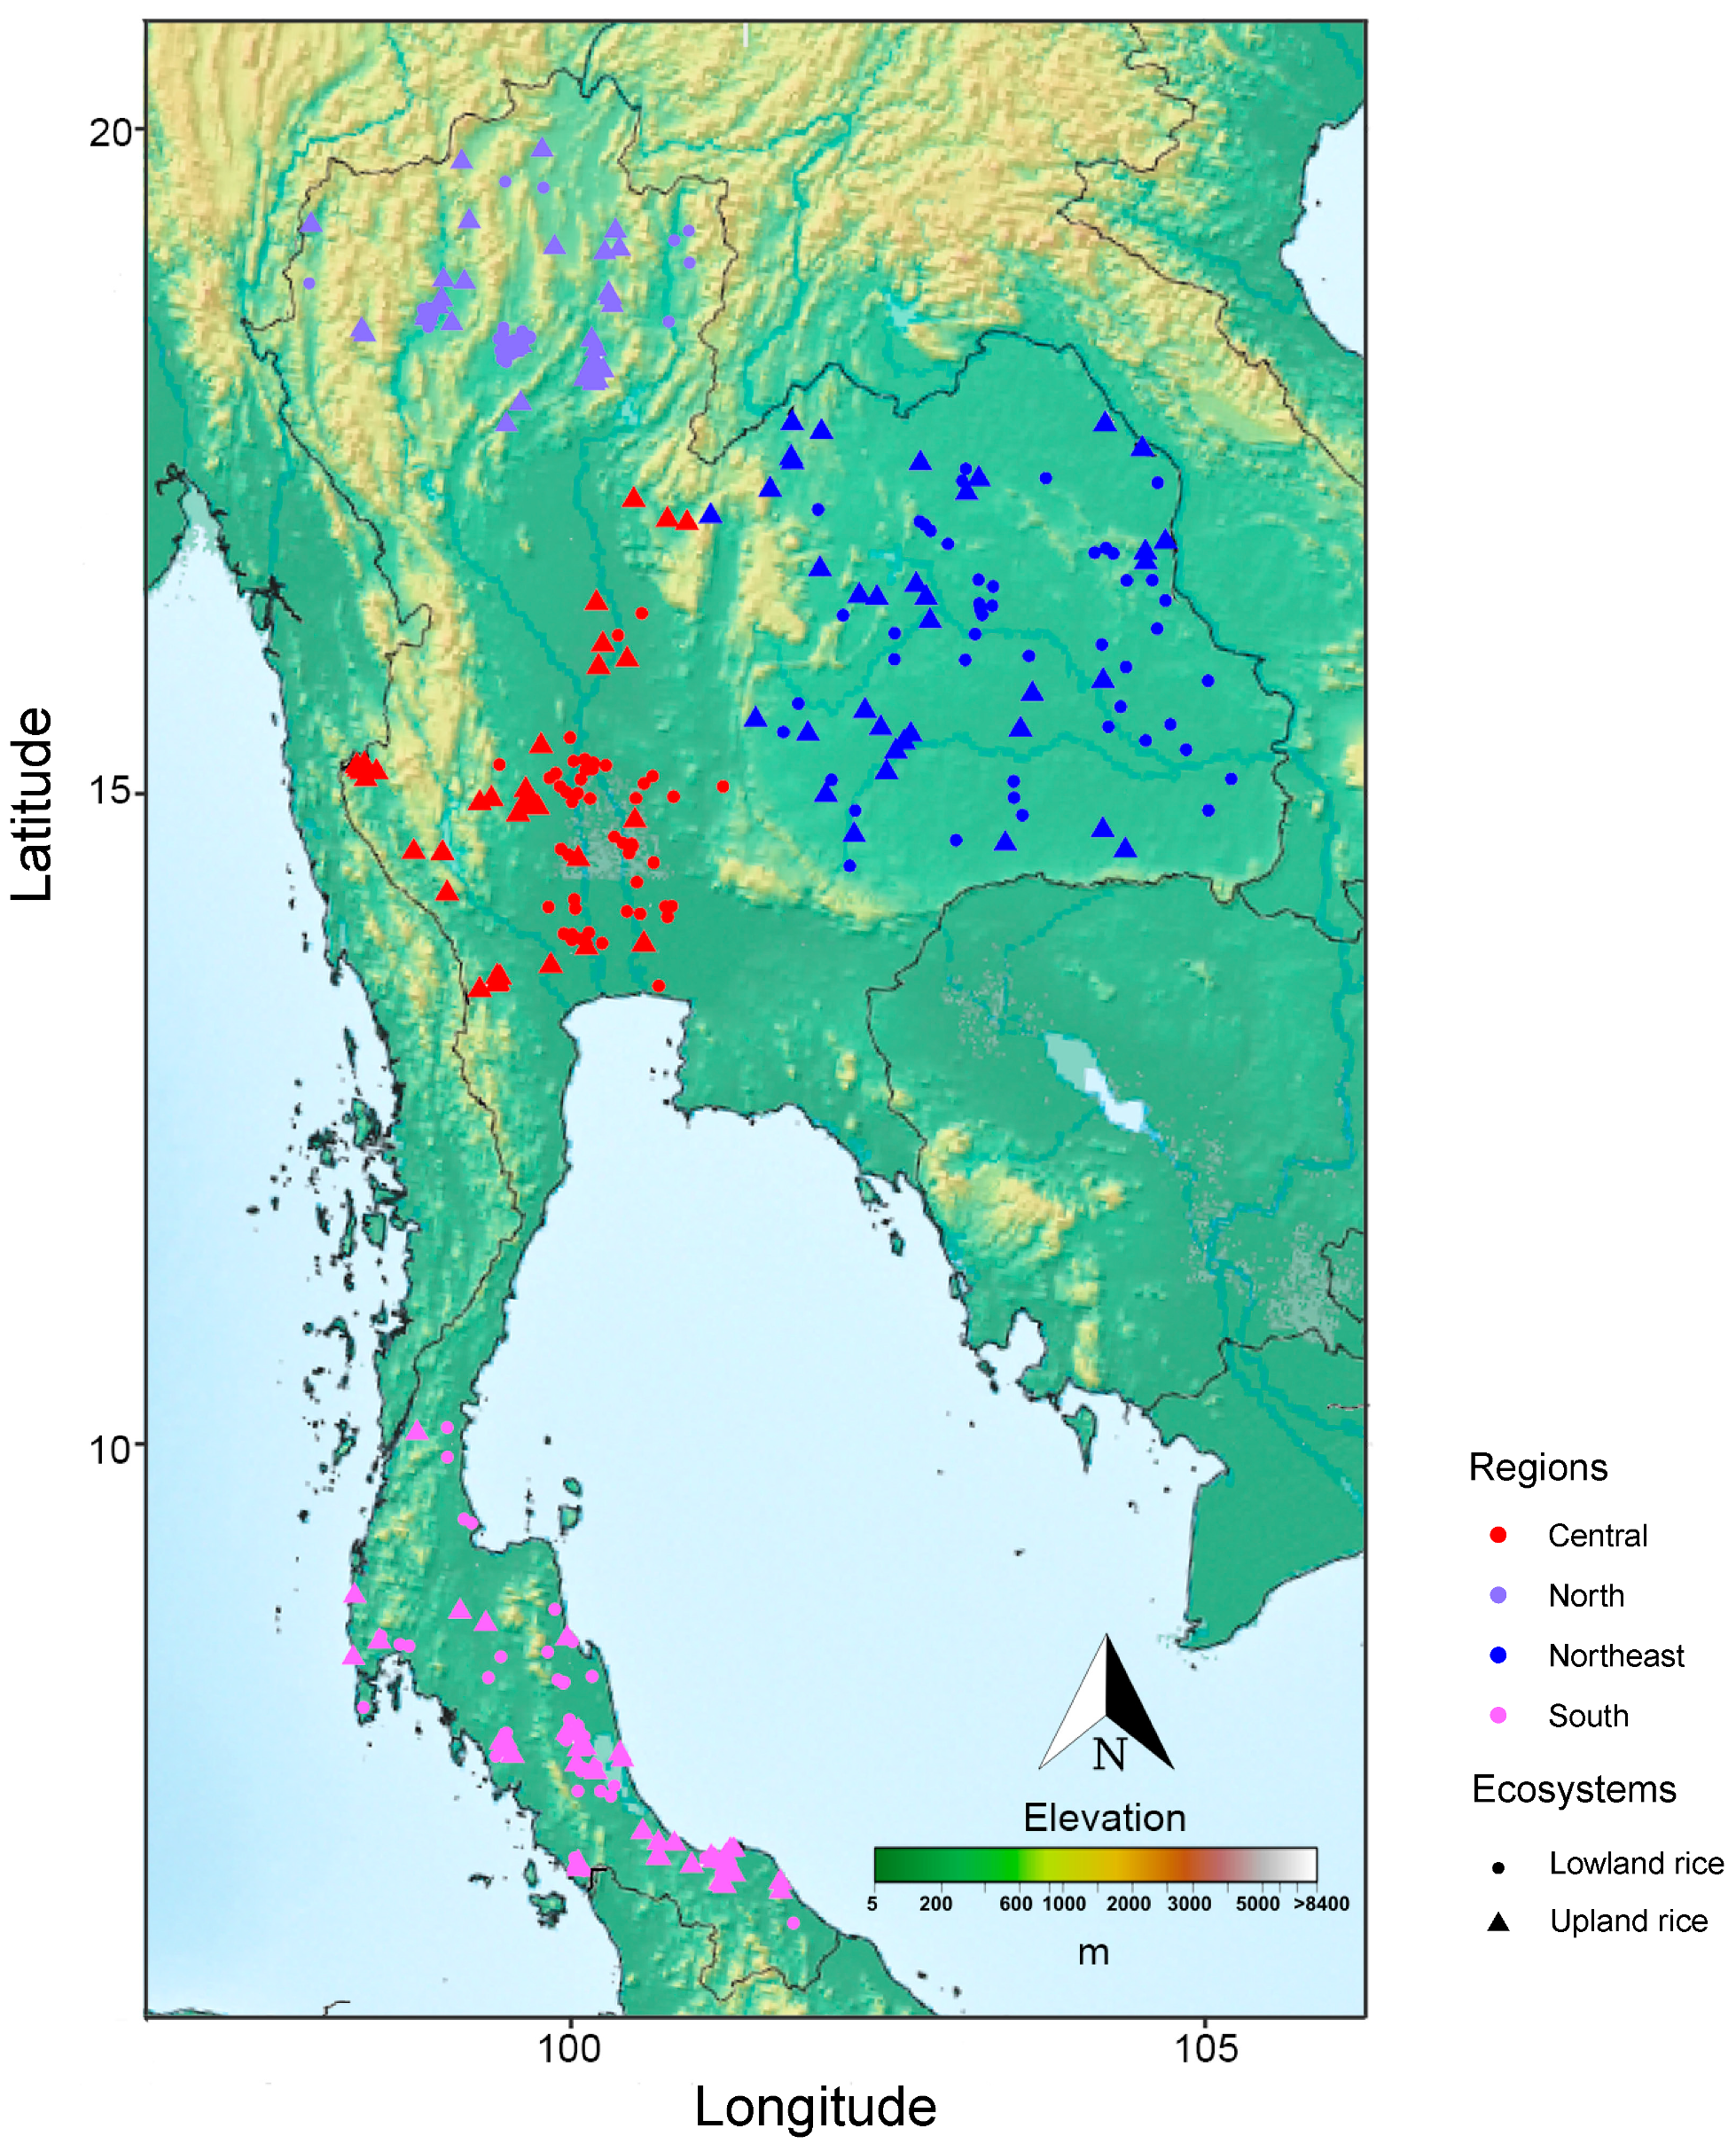
2.1. Plant Materials

A collection of 365 accessions of Thai rice landraces (Oryza sativa L.) was obtained from the National Rice Gene Bank of Thailand. According to the germplasm registry, this collection is composed of 169 and 196 accessions of upland and lowland rice, respectively, which were obtained from different parts of Thailand. Among the upland rice, there were 46, 38, 40, and 45 accessions from northern (N), northeastern (NE), central (C), and southern (S) populations, respectively. Among the lowland rice, there were 50, 48, 49, and 49 from the N, NE, C, and S populations, respectively (Table S1).

2.2. DNA Extraction and SNP Genotyping

The total genomic DNA was extracted from young leaves using a DNA Trap I kit (DNA Technology Laboratory, Thailand). The DNA was quantified using a NanoDrop 8000 Spectrophotometer (Thermo Fisher Scientific, DE, USA) and diluted to a concentration of 5 ng/µL. Genotyping was performed with 102 SNP markers using Kompetitive allele specific PCR (KASP) and the SNPline genotyping system following standard KASP protocols (LGC Genomics, Teddington, UK). The SNP marker set (102 markers) was a courtesy of the Rice Science Center, Kasetsart University, Thailand (data unpublished).

2.3. Data Management and Analysis

The input for all analyses was based on the genotype data from polymorphic SNP markers. The genetic distance was calculated using the Nie’s standard distance [26], and the phylogenetic tree was created using MEGA X [27] based on the Maximum-likelihood method [28].
The major allele frequency (MAF), number of alleles per locus (Na), and gene diversity per locus (He) as well as the polymorphism information content (PIC) value were estimated using PowerMarker version 3.25 [29]. The SNP data of the 72 representatives of 3,000 rice accessions corresponding to the positions of our SNP markers were obtained from the Rice SNP-Seek Database [30] and used to construct a phylogenetic tree referring to five groups of rice (O. sativa), i.e., indica, tropical japonica, temperate japonica, aus, and aromatic (Table S2; Figure S1).
Principal Coordinate Analysis (PCoA), STRUCTURE analysis, and Discriminant Analysis of Principal Components (DAPC) were used to investigate the patterns of population structure. PCoA was performed using DARwin 6.0.021 [31], and PCs were plotted using ggplot2 [32]. The STRUCTURE analysis was performed using a Bayesian model-based clustering algorithm implemented in STRUCTURE version 2.3.4 [33], where the admixture model with the correlated allele frequencies was used. A total of 3 independent replicates were run for each genetic cluster (K) value (K = 1–8), using a burn-in period of 100,000 and a run length of 100,000 iterations. LnP(D) values were derived for each K and plotted to find the plateau of the ΔK [34]. The final population structure was calculated using the structure harvester [35]. DAPC was performed with the adegenet package [36]. The “find.cluster” function was used to identify clusters (k), and the optimal k value was determined according to the Bayesian Information Criterion (BIC). Then, the “dapc” function was used to verify the classification quality. GenAlEx V6.5 [37] was used to compute the pairwise fixation index (FST) among all pairs of populations, in order to investigate the population differentiation. The same tool was used to perform analysis of molecular variance (AMOVA) to estimate the components of the variances of the populations. Mantel tests were conducted using the R package vegan [38].

3. Results

3.1. Genetic Variability of 365 Rice Accessions Based on SNP Markers

A collection of 365 Thai rice accessions were used in this study. These included rice landraces from four geographical regions of Thailand representing different ecosystems: the upland (169 accessions) and lowland (196 accessions) (Figure 1, Table S1). To study the genetic variability among these rice accessions, a total of 102 KASP markers were initially used to genotype the 365 rice accessions (Table S3). After the removal of SNP markers that had missing genotypes above 10% or had a minor allele frequency (MAF) lower than 5%, a total of 75 SNP markers (73.5%) were retained (Table 1). These 75 SNP markers were distributed over the 12 chromosomes, in which the highest number (11 markers) and the lowest number (2 markers) of SNP markers were found on chromosomes 4 and 10, respectively (Figure 2). The polymorphic information content (PIC) ranged from 0.11 to 0.37, with an average of 0.26, and the gene diversity, also known as the expected heterozygosity (He), varied from 0.12 to 0.49 (Table 1). The observed heterozygosity varied from 0 to 0.02. All SNP markers were biallelic, containing only two alleles for each marker. The major allele frequency (MAF) at each locus ranged from 0.50 to 0.94. Most of the markers showed a variable allele frequency compared among different geographical populations (Figure S2).

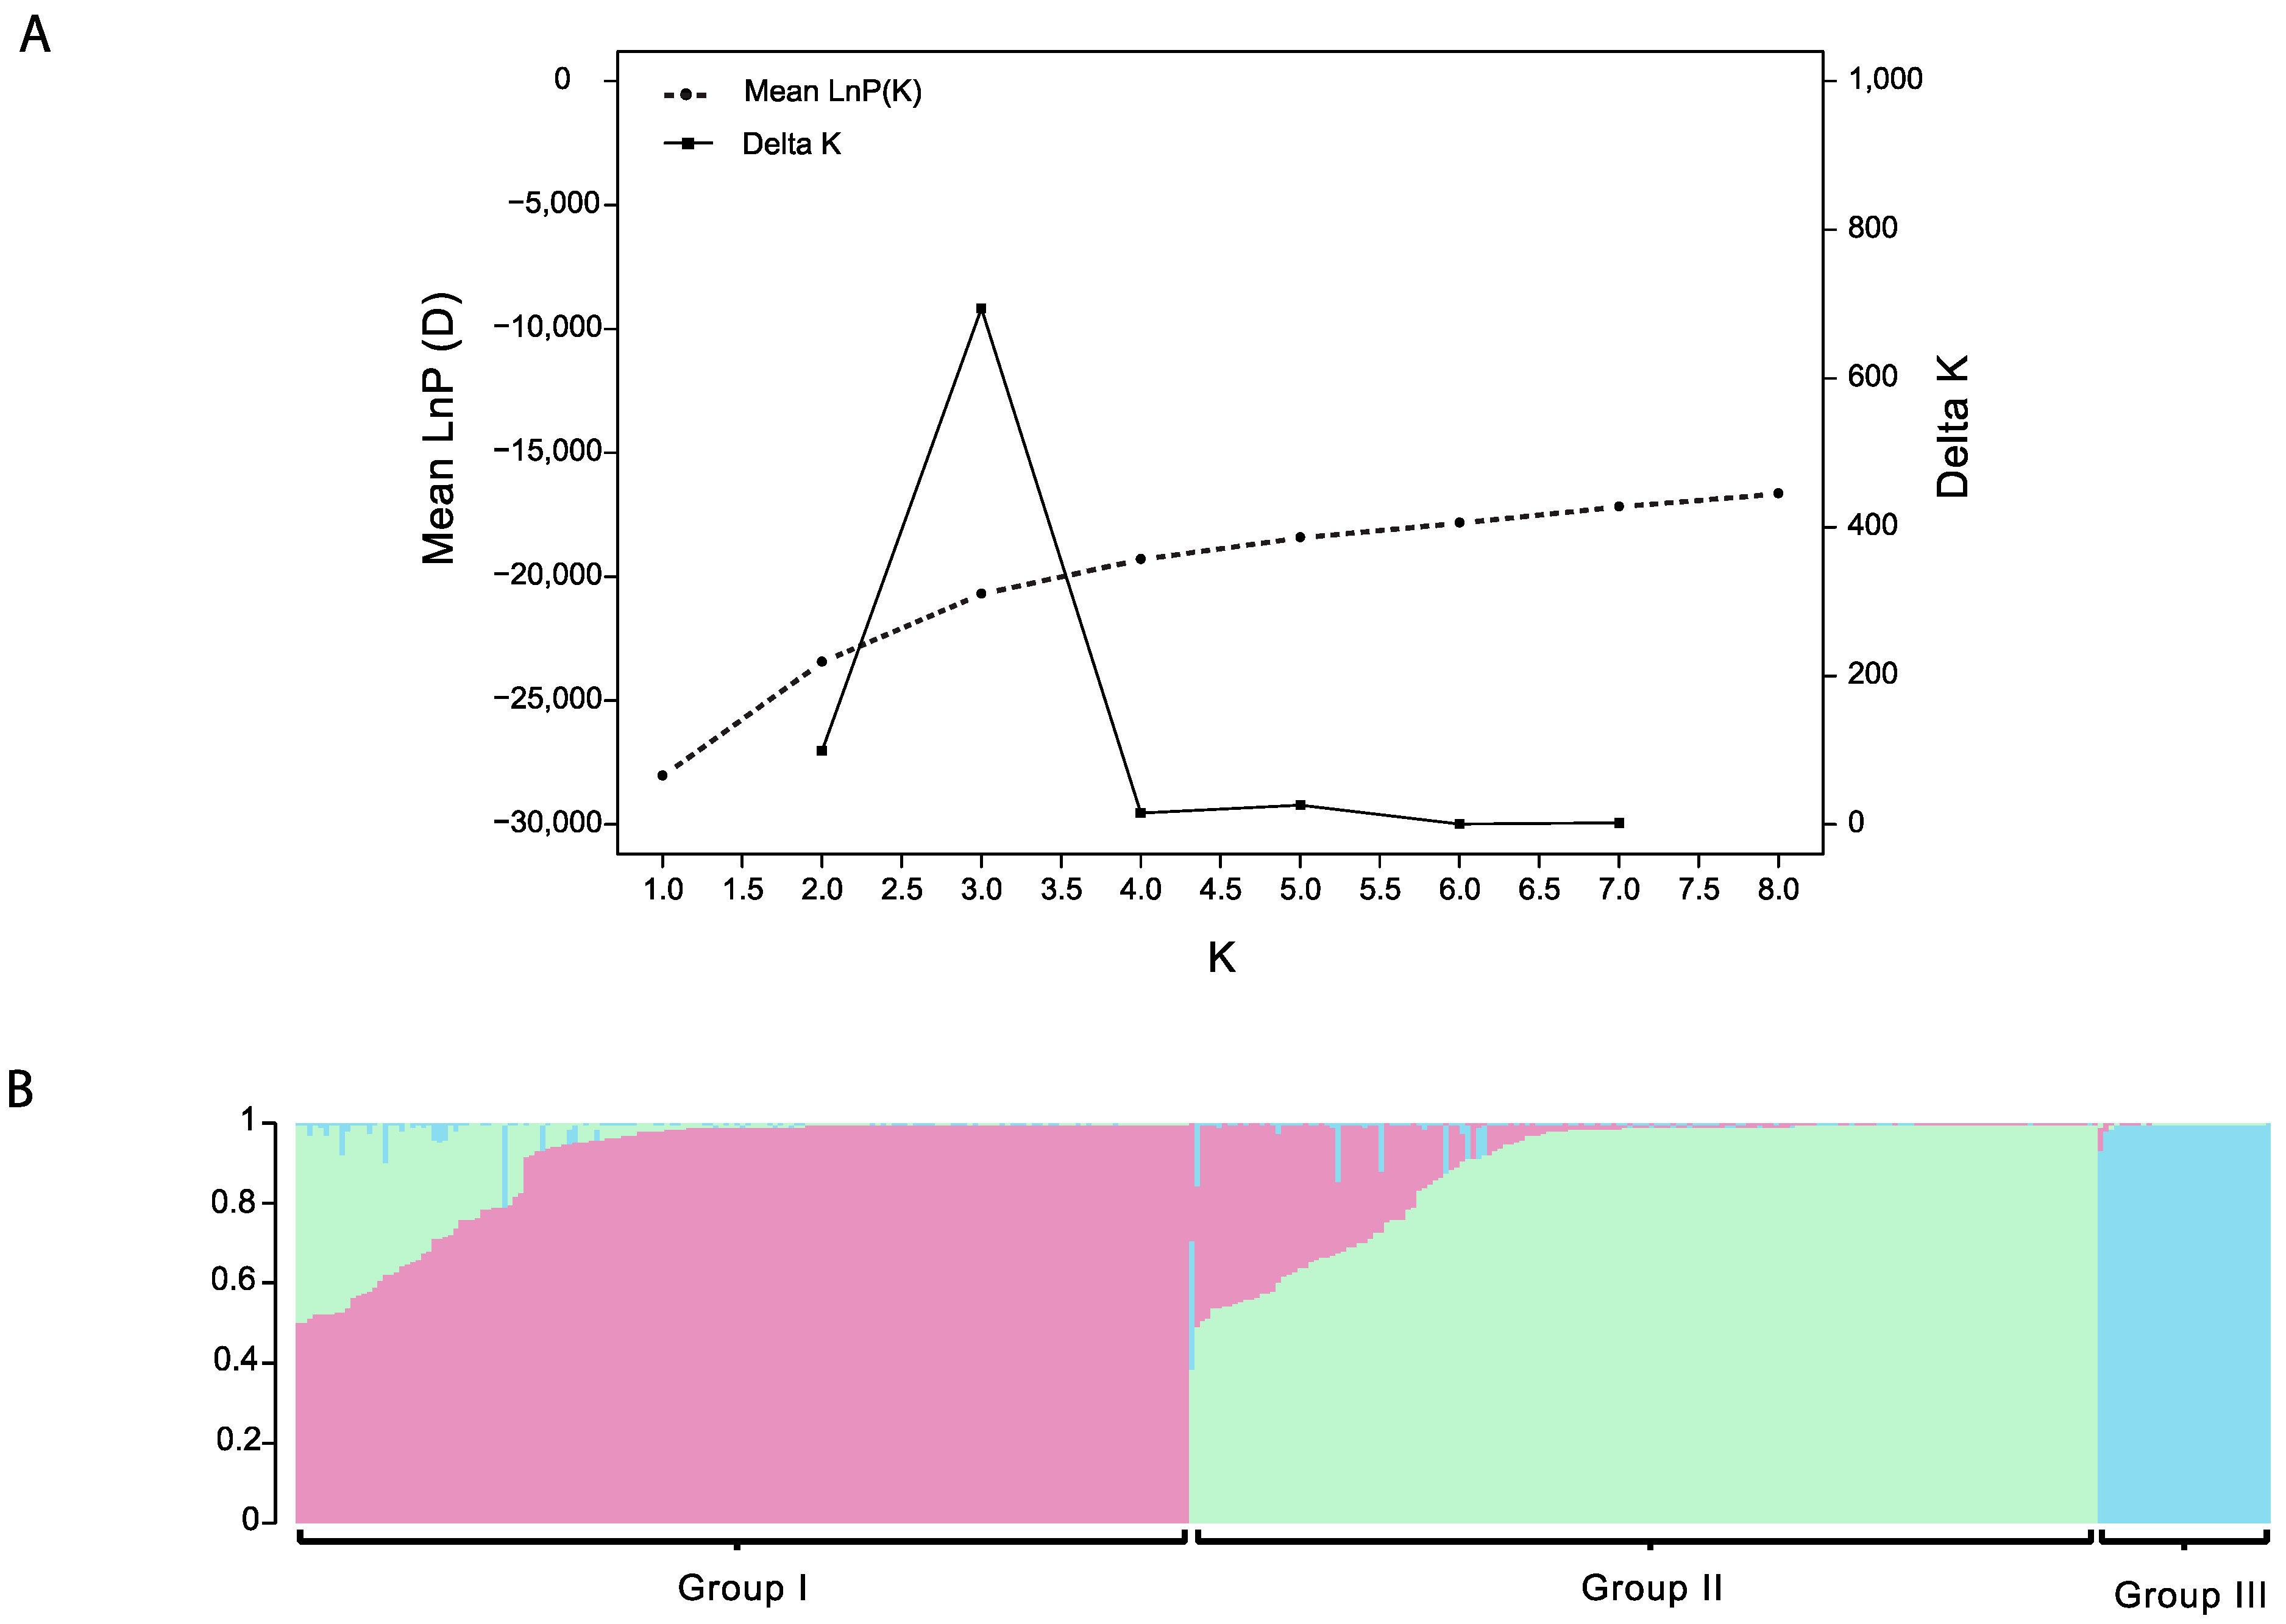
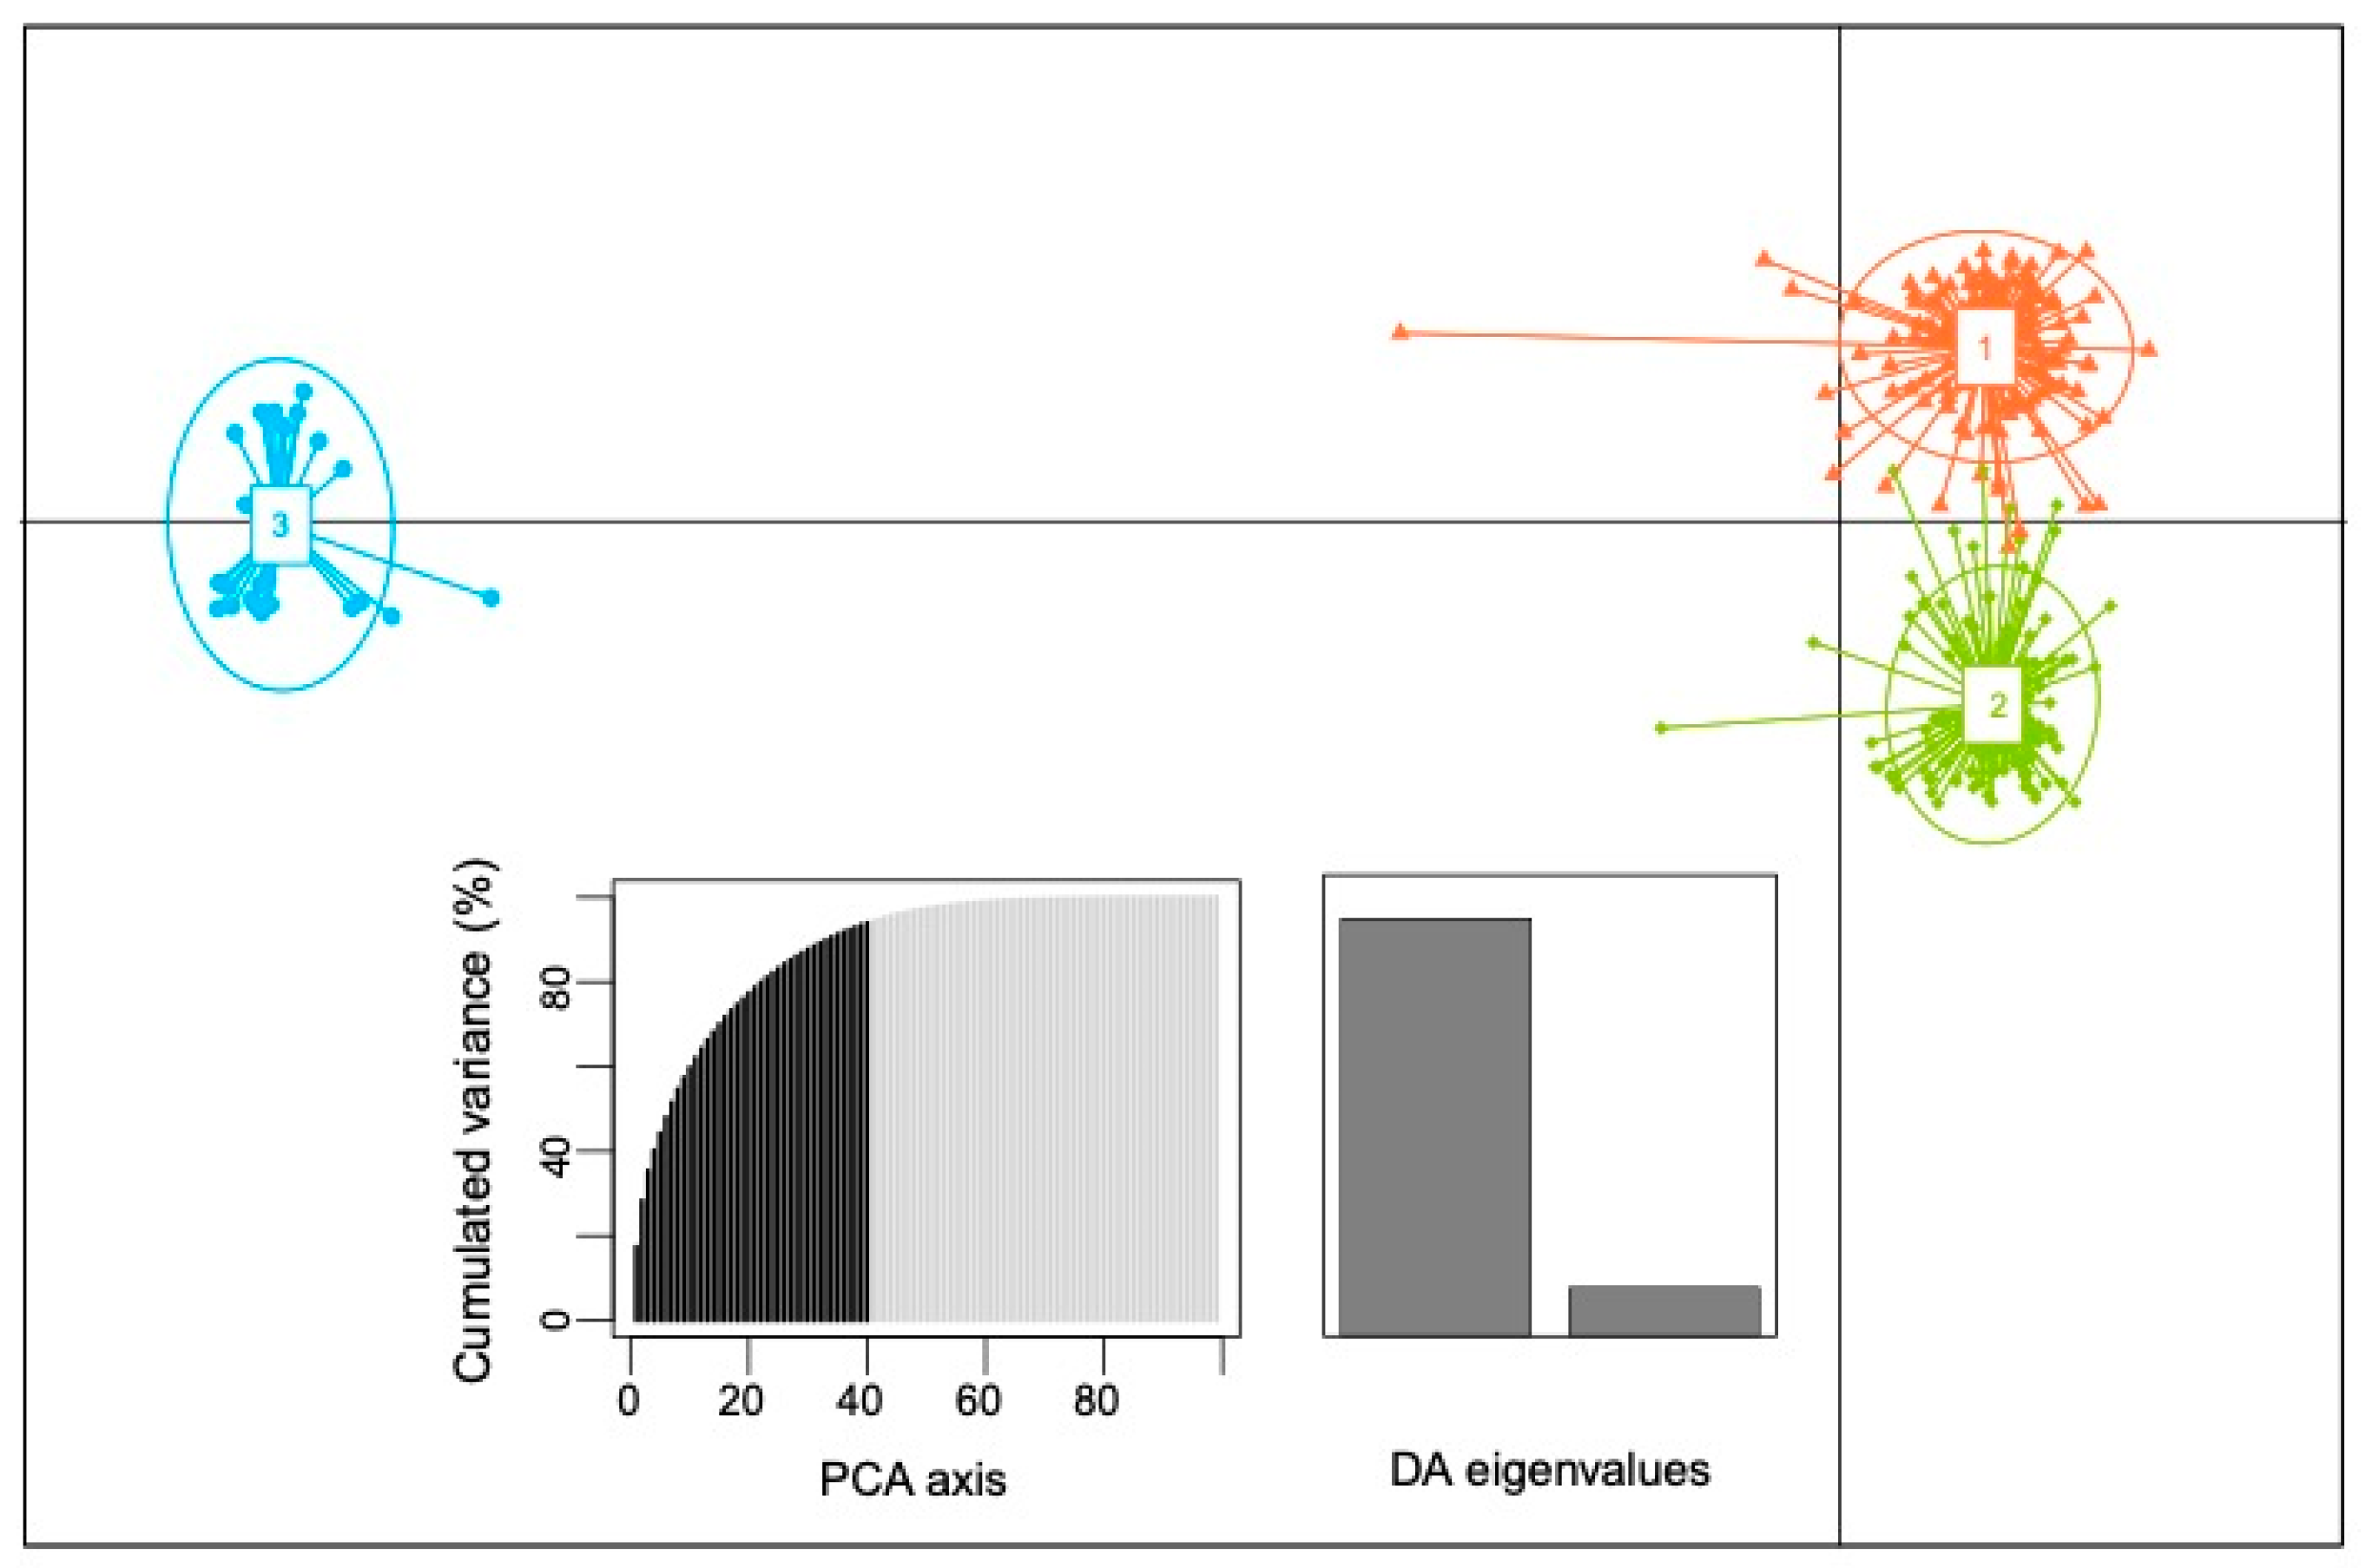
3.2. Population Structure of Thai Landraces

To understand the structure of the overall 365 rice accessions among the four different geographical regions, three different approaches, i.e., STRUCTURE, DAPC, and PCoA, were applied. All analyses were performed based on the genotypes identified by the 75 SNP markers. In STRUCTURE, the number of clusters was estimated based on the ∆K method [34] and the plateau criterion [33]. The results suggested the best grouping number at K = 3 based on the ∆K and the mean log-likelihood (LnP(D)) curve (Figure 3). This suggests that the 365 rice landraces can be grouped into three subpopulations, referred to as Groups I–III (Figure 3).
In each group, accessions with a score higher than 0.80 were assigned to a pure group, while those with a score lower than 0.80 were assigned to be admixture. We found that the accessions assigned into Groups I and II were all indica landraces (Table S4). Group I consisted of 168 accessions where 45.23% were landraces from the southern (S) population and 33.33% were landraces from the central (C) population. Within this cluster, 126 accessions contained pure genotypes, and 42 accessions exhibited an admixed ancestry.
Group II consisted of 165 accessions, 81.21% of which were landraces from the northern (N) and the northeastern (NE) populations. Within this group, 126 accessions contained pure genotypes, and 39 accessions exhibited an admixed ancestry. Group III contained 32 accessions, all of which were japonica landraces, and most of which were upland rice from the N and S populations (Table S4). None of the accessions in this group contained admixed ancestry.
The number of subpopulations and the subpopulation attributions yielded by DAPC were similar to those revealed with STRUCTURE (Figure 4). The three groups were clearly defined as two closely related indica subgroups (Groups 1 and 2) and a distantly related japonica group (Group 3) (Figure 4; Table S4). Similarly, the PCoA result revealed two main clusters corresponding to the two groups, indica and japonica. However, subgroups among the indica landraces were not clearly defined (Figure 5; Table S4).

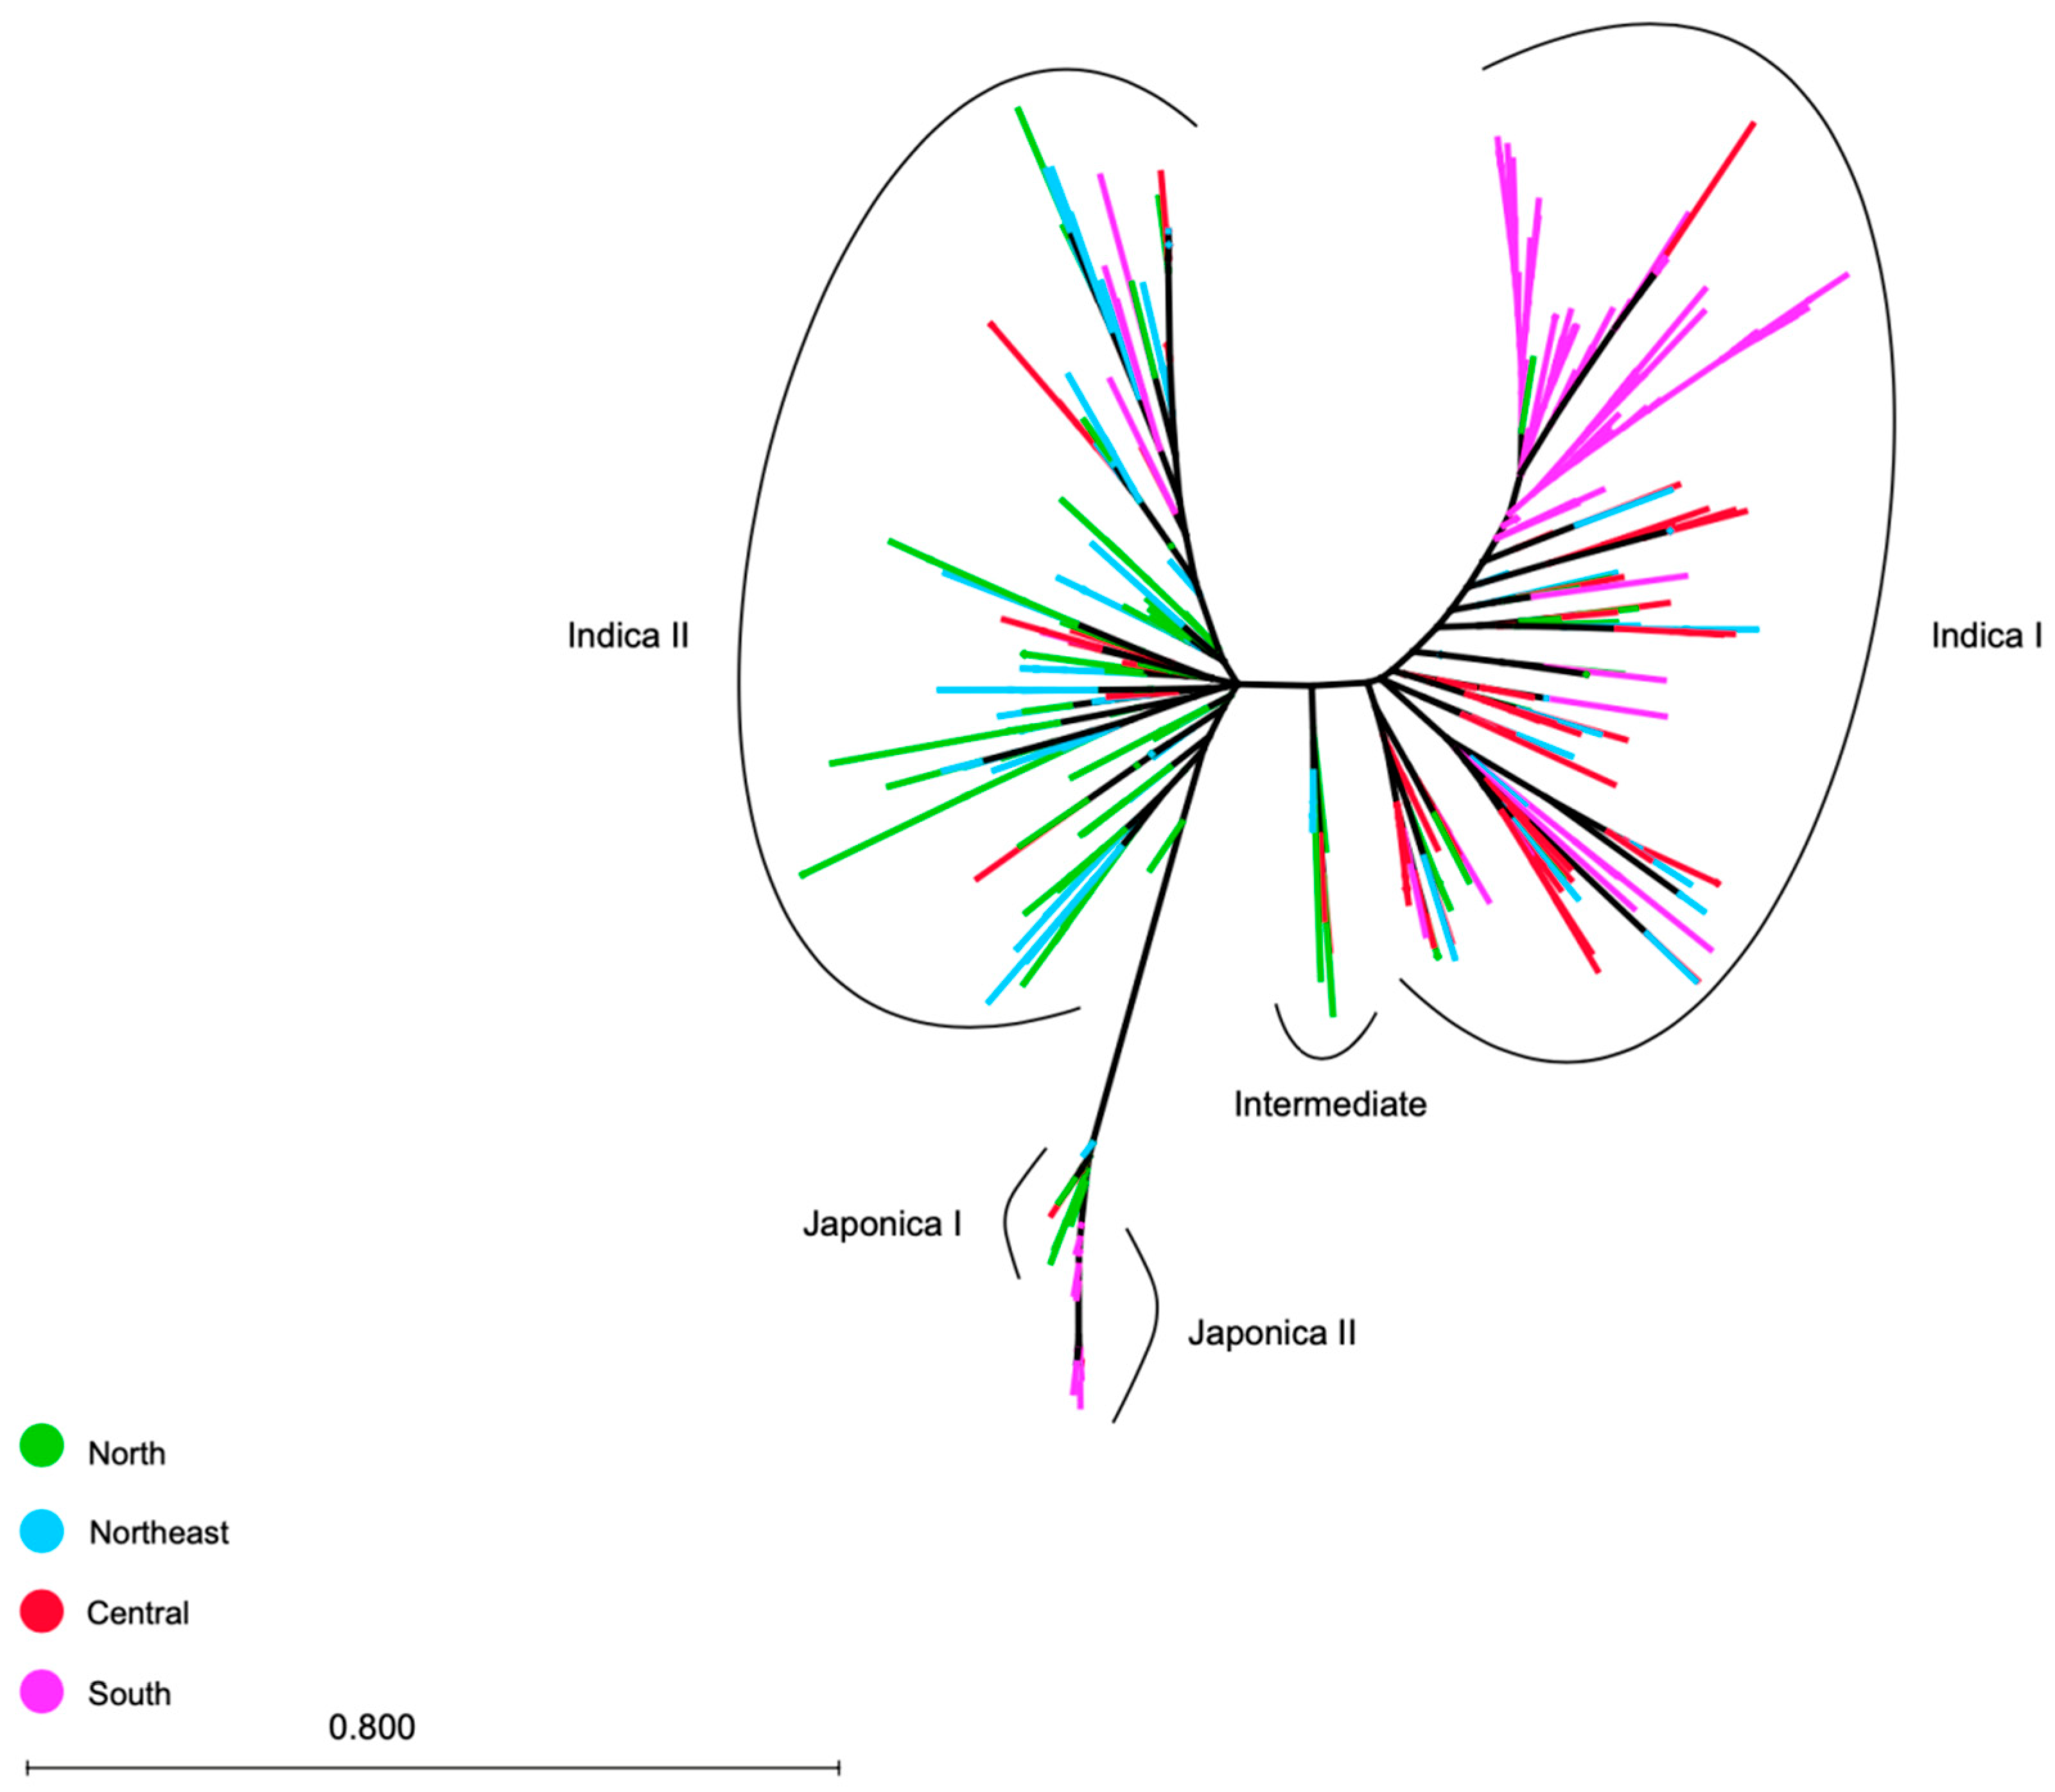
3.3. Genetic Distance and Phylogeny of the 365 Accessions

To examine the genetic relationships among the 365 rice landraces, we calculated the genetic distance based on Nie’s dissimilarity. As a result, two major clusters of these rice landraces, corresponding to indica and japonica groups, were revealed (Figure S3). The phylogenetic tree constructed using the maximum likelihood method clustered these landraces into two major groups, corresponding to indica and japonica, similar to the groups identified by DAPC and PCoA (Figure 6). Among the indica group, two major clusters (namely Indica I and II) were further observed. The Indica I subgroups contained 176 accessions, 74 and 61 of which were rice landraces from the S population and the C population, respectively. Most of the rice landraces in this group were non-glutinous rice (Table S4). The indica II subgroups contained 148 accessions, 122 of which were rice landraces from the N and NE populations. The majority of the rice landraces in this group (72.29%) were glutinous rice. The landraces from the S population were rarely contained in this group (Table S4). There was also a small intermediate group present between the two indica subgroups. This intermediate indica group contained nine rice landraces from the C, N, and NE populations (Table S4). Among the japonica group, two clusters (namely Japonica I and II) were indicated. The Japonica I subgroup predominantly contained the rice accessions from the N population (10/14 accessions), while the Japonica II subgroup predominantly contained the accessions from the S population (15/18 accessions).
While both upland and lowland rice landraces were found in all indica subgroups, the upland rice landraces were predominantly included in the japonica group (Table S4). The overall genetic diversity of the 365 rice accessions was moderate, as revealed by the mean gene diversity (0.33) and mean PIC (0.26) (Table 2). Similar values of gene diversity (0.28–0.32) and PIC (0.23–025) were found among the four geographical populations (Table 2). However, the mean genetic diversity of the japonica group (0.09) was much lower than that of the other two indica subgroups (0.27 and 0.24 for Indica I and II, respectively) (Table 3).

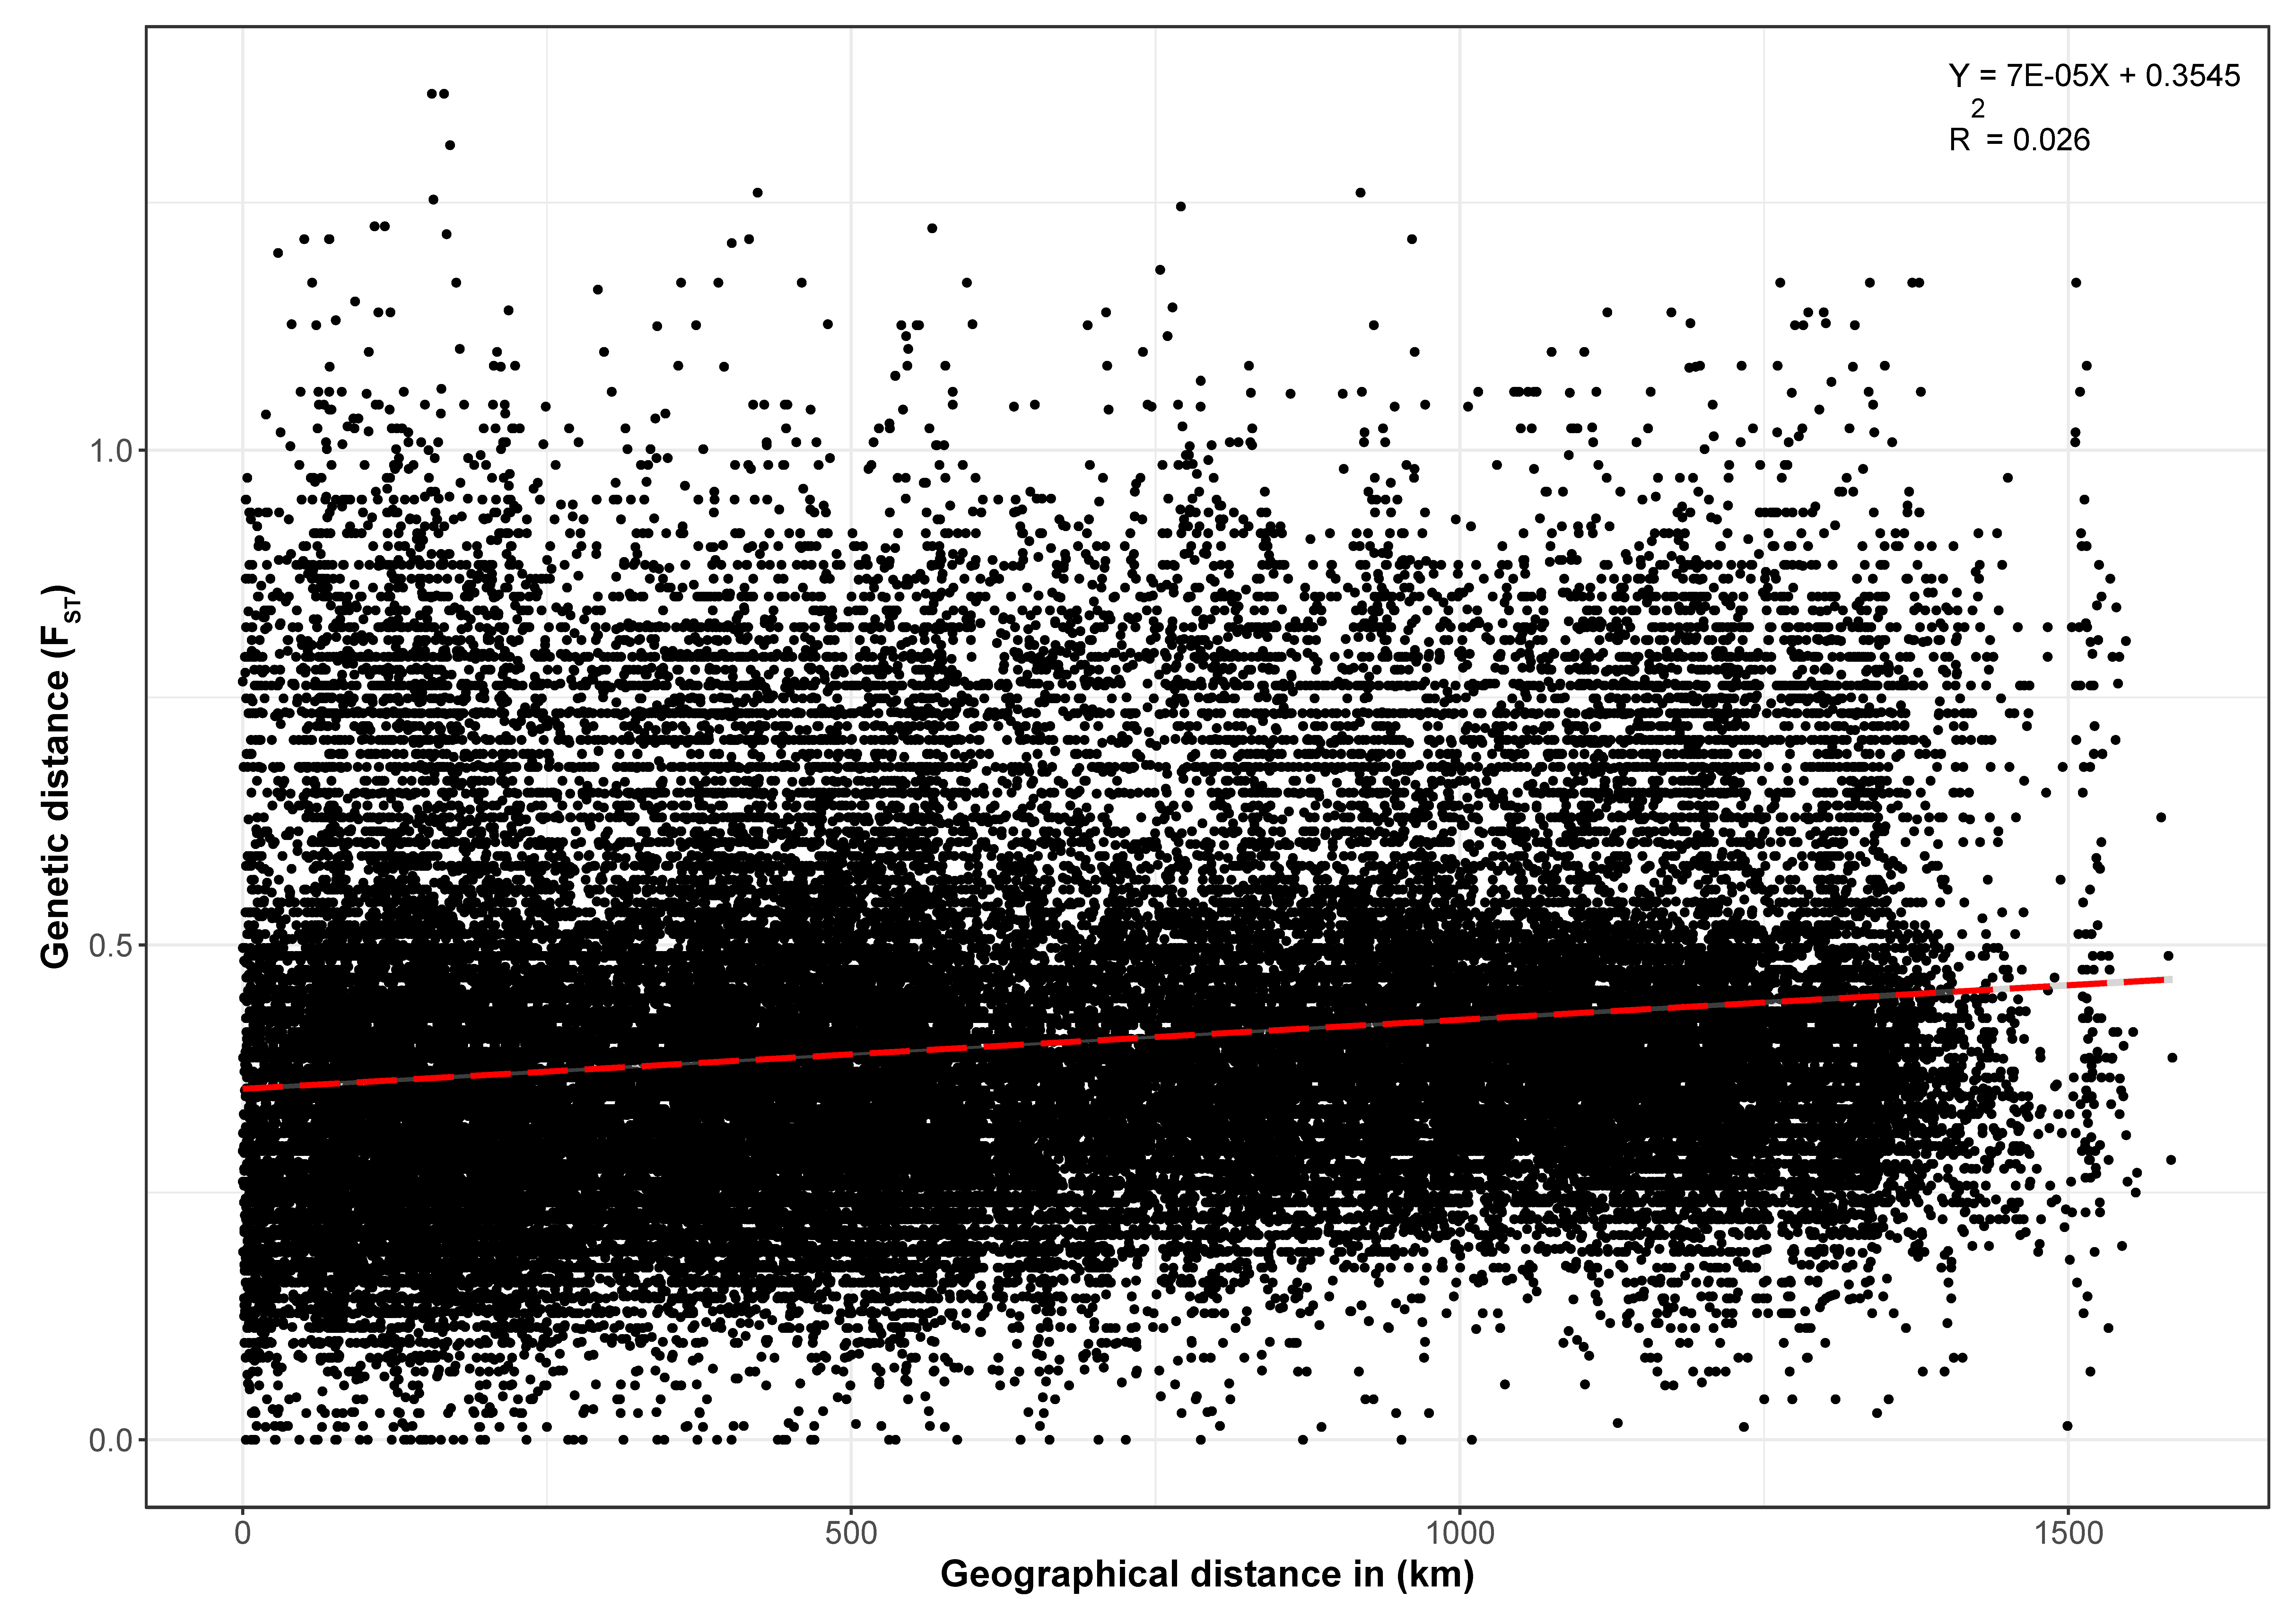
3.4. Genetic Differentiation, AMOVA, and Isolation-by-Distance Analyses

We further quantified the genetic differentiation (FST) between each geographical population using Wright’s test [39]. In practice, an FST of 0.00–0.05 indicates low differentiation, 0.05–0.15 indicates moderate differentiation, and FST of >0.15 indicates a high level of differentiation [40]. Pairwise estimates of the FST values between pairs of subpopulations due to geographical regions revealed low to moderate genetic differentiation, ranging from 0.016 to 0.078 (Table 4). The largest genetic differentiation (FST) was detected between the NE and S populations (0.078), and the lowest genetic differentiation was detected between the N and NE populations (0.016). The levels of genetic differentiation between the S and N populations and between the S and C populations were also moderate as indicated by the FST values of 0.069 and 0.052, respectively.
The analysis of molecular variance (AMOVA) based on the geographical regions revealed significant variations (p < 0.001) among and within the subpopulation groups corresponding to geographic regions (Table 5). Differences within the geographical regions contributed to approximately 91% of the total genetic variations, and these differences were notably and significantly higher than those among regions (only 9% of the total genetic variation was due to differences among regions; Table 5).
Isolation-by-distance (IBD) based on Mantel’s test was also demonstrated when comparing the genetic distances (FST) and geographical distances. A significant positive relationship between the geographical and genetic distances (R2 = 0.026, p < 0.001) was observed in the entire population based on the SNP data (Figure 7). A similar relationship was also observed between the genetic distances (FST) and some climatic factors, i.e., latitude, elevation, temperature, and rainfall, among the 365 accessions (Figures S4–S7).

4. Discussion

This study provides a comprehensive and systematic study of the genetic variation in a large collection of Thai rice landraces. The panel consisted of 365 accessions, which included 169 and 196 accessions of upland and lowland rice, respectively. These accessions were representatives of landraces obtained from four geographic origins: northern (96 accessions from 9 provinces), northeastern (86 accessions from 17 provinces), central (89 accessions from 15 provinces), and southern Thailand (94 accessions from 14 provinces). Based on the 75 SNP markers, the PIC values for all SNPs were less than 0.5, with an average PIC value of 0.26, suggesting that all the SNPs were considered moderate- or low-information markers. This may be due to the bi-allelic nature of the SNPs [41].
The different approaches (STRUCTURE, PCoA, and DAPC) used to analyze the genetic structure of the 365 rice accessions appeared to provide complementary information. The results showed a good consistency between STRUCTURE and DAPC. The population structure analysis using these approaches suggested that the Thai rice landraces could be divided into two main subpopulations, corresponding to indica and japonica groups, similar to the previous reports [21,23,24]. However, the majority of accessions present in our panel were indica rice. The genetic diversity was higher for the indica groups compared to the japonica group.
While both the upland and lowland landraces were distributed among the indica groups, most landraces in the japonica group were upland rice. In Thailand, indica is the dominant rice type and is normally grown in the lowland ecosystem. On the other hand, japonica rice is rarely found in mainstream rice production in Thailand and is, instead, mostly enriched in regions, such as the northern highlands [42].
Based on the rice collection used in this study, japonica rice was likely to be separated into two subgroups, one specific to the northern population and another specific to the southern population. It is possible that both subgroups of Thai japonica rice arose in both regions from different origins. There were also some rice accessions from the central population belonging to the Japonica I subgroup (Figure 6; Table S4). These rice accessions may have the same origin as those in the northern population and may be exchanged by farmers between the two regions. It is also worth determining whether the two classes of japonica have different physiological properties.
FST measures the amount of genetic variance that can be explained by the population structure based on Wright’s F-statistics [39]. An FST value of 0 indicates no differentiation between the subpopulations, while a value of 1 indicates complete differentiation. An FST value greater than 0.15 can be considered as significant in differentiating populations [43]. In the present study, no significant divergence was found among the four regional populations (Table 2). This coincided with the AMOVA results (Table 5), where the vast majority of the total variation (91%) was accounted for by within-subpopulation variation, while only 9% of the total variation was accounted for by among-subpopulation variation. Assuming germplasm exchanges among regions, an independent clustering pattern of landraces from different origins in the maximum-likelihood phylogenetic tree analysis, and the revealed high molecular variance among accessions within populations in AMOVA pointed to human pressure on the dissemination of seeds among populations. This is also supported by the isolation-by-distance analysis result where only a low level of correlation was detected between the genetic distance (FST) and geographic distance for the Thai rice landraces.

5. Conclusions

In this study, the genetic diversity and population structure of 365 Thai rice landraces were investigated using a set of 75 SNP markers. Two main subpopulations, corresponding to indica and japonica, were clearly identified across the whole panel of these rice accessions. Among the indica group, two further subgroups were also indicated. The genetic differentiation among the four geographic populations was not high, which may be due to the occurrence of genetic exchange between populations.
This study provides a detailed understanding of the genetic structure and diversity of Thai landraces, which is crucial for the efficient utilization of rice genetic resources and for developing suitable conservation strategies. This will aid in building a comprehensive collection of landraces in terms of genetic diversity, which is fundamental for other studies, such as genome-wide association studies (GWAS).

Supplementary Materials

The following are available online at https://0-www-mdpi-com.brum.beds.ac.uk/article/10.3390/agronomy11050995/s1, Figure S1: The maximum-likelihood tree of the 72 representative of 3000 rice genomes (highlighted in different colors) and the 365 Thai landrace accessions, Figure S2: Heatmap hierarchical clustering of the genetic distance calculated based on the dissimilarity matrix of 365 rice accessions, Figure S3: Allele frequency of the 75 SNP markers in each geographical population, Figure S4: Correlation of the latitude distance and genetic distance (pairwise FST) among the 365 rice accessions, Figure S5: Correlation of the pairwise elevation difference (in meters) and genetic distance (pairwise FST) among the 365 rice accessions, Figure S6: Correlation of the pairwise difference of average temperature in a year (in degree Celsius) and genetic distance (pairwise FST) among the 365 rice accessions, Figure S7: Correlation of the pairwise difference of average rainfall in a year (in millimeters) and genetic distance (pairwise FST) among the 365 rice accessions, Table S1: List of rice accessions used in the study, Table S2: List of 72 representative of 3000 rice genomes assigned to five genetic groups, Table S3: List of 102 SNP markers used for genotyping, and Table S4: List of 365 rice accessions used in the study.

Author Contributions

Conceptualization, T.S., C.M., A.V., T.T., S.W., and S.A.; Formal analysis, W.A., S.R., and V.R.; Funding acquisition, T.T., T.S., and S.A.; Methodology, W.A. and S.W.; Supervision, T.T., S.W., and S.A.; Writing—original draft, W.A. and S.W.; Writing—review & editing, S.W. and S.A. All authors have read and agreed to the published version of the manuscript.

Funding

This research is supported by the Center of Excellence on Agricultural Biotechnology, Science and Technology Postgraduate Education and Research Development Office, Office of Higher Education Commission, Ministry of Higher Education, Science, Research and Innovation. (AG-BIO/PERDO-CHE), the National Research Council of Thailand (NRCT), grant numbers NRCT5-RSA63002-06 and NRCT-RTA/812/2563, and the Kasetsart University Research and Development Institute (KURDI), Kasetsart University.

Data Availability Statement

The authors confirm that the data supporting the findings of this study are available within the article and its Supplementary Materials.

Acknowledgments

The authors would also like to thank the Thailand Rice Department, Ministry of Agriculture and Cooperatives, for rice material support.

Conflicts of Interest

The authors declare that they have no conflict of interests.

References

  1. Khush, G.S. Origin, dispersal, cultivation and variation of rice. Plant Mol. Biol. 1997, 35, 25–34. [Google Scholar] [CrossRef]
  2. Bandumula, N. Rice production in asia: Key to global food security. Proc. Natl. Acad. Sci. USA 2018, 88, 1323–1328. [Google Scholar] [CrossRef]
  3. Silva, C.N. Urban Planning in Sub-Saharan Africa: Colonial and Post-Colonial Planning Cultures; Routledge: London, UK, 2015; ISBN 9781315797311. [Google Scholar]
  4. Oka, H.-I.; Morishima, H. Phylogenetic differentiation of cultivated rice, XXIII. Potentiality of wild progenitors to evolve the Indica and Japonica types of rice cultivars. Euphytica 1982, 31, 41–50. [Google Scholar] [CrossRef]
  5. Mackill, D.J.; Lei, X. Genetic variation for traits related to temperate adaptation of rice cultivars. Crop Sci. 1997, 37, 1340–1346. [Google Scholar] [CrossRef]
  6. Mackill, D.J.; Khush, G.S. IR64: A high-quality and high-yielding mega variety. Rice 2018, 11, 18. [Google Scholar] [CrossRef] [Green Version]
  7. Singh, R.K. Genetic resource and the role of international collaboration in rice breeding. Genome 1999, 42, 635–641. [Google Scholar] [CrossRef]
  8. Harlan, J.R. Our vanishing genetic resources. Science 1975, 188, 617–621. [Google Scholar] [CrossRef]
  9. Kovach, M.J.; McCouch, S.R. Leveraging natural diversity: Back through the bottleneck. Curr. Opin. Plant Biol. 2008, 11, 193–200. [Google Scholar] [CrossRef] [PubMed]
  10. Govindaraj, M.; Vetriventhan, M.; Srinivasan, M. Importance of genetic diversity assessment in crop plants and its recent advances: An overview of its analytical perspectives. Genet Res Int 2015, 2015, 431487. [Google Scholar] [CrossRef] [PubMed] [Green Version]
  11. Bhandari, H.R.; Bhanu, A.N.; Srivastava, K.; Singh, M.N. Assessment of genetic diversity in crop plants-an overview. Adv. Plants Agric. 2017, 7, 255. [Google Scholar]
  12. Glaszmann, J.C. Isozymes and classification of Asian rice varieties. Theor. Appl. Genet. 1987, 74, 21–30. [Google Scholar] [CrossRef] [PubMed]
  13. Garris, A.J.; Tai, T.H.; Coburn, J.; Kresovich, S.; McCouch, S. Genetic structure and diversity in Oryza sativa L. Genetics 2005, 169, 1631–1638. [Google Scholar] [CrossRef] [Green Version]
  14. Sow, M.; Ndjiondjop, M.-N.; Sido, A.; Mariac, C.; Laing, M.; Bezançon, G. Genetic diversity, population structure and differentiation of rice species from Niger and their potential for rice genetic resources conservation and enhancement. Genet. Resour. Crop Evol. 2014, 61, 199–213. [Google Scholar] [CrossRef]
  15. Caicedo, A.L.; Williamson, S.H.; Hernandez, R.D.; Boyko, A.; Fledel-Alon, A.; York, T.L.; Polato, N.R.; Olsen, K.M.; Nielsen, R.; McCouch, S.R.; et al. Genome-wide patterns of nucleotide polymorphism in domesticated rice. PLoS Genet. 2007, 3, 1745–1756. [Google Scholar] [CrossRef] [PubMed] [Green Version]
  16. Huang, X.; Kurata, N.; Wei, X.; Wang, Z.-X.; Wang, A.; Zhao, Q.; Zhao, Y.; Liu, K.; Lu, H.; Li, W.; et al. A map of rice genome variation reveals the origin of cultivated rice. Nature 2012, 490, 497–501. [Google Scholar] [CrossRef] [PubMed] [Green Version]
  17. Tam, N.T.; Dwiyanti, M.S.; Koide, Y.; Nagano, A.J.; Ky, H.; Tin, H.Q.; Hien, N.L.; Dung, L.V.; Kishima, Y. Profiling SNP and nucleotide diversity to characterize mekong delta rice landraces in southeast asian populations. Plant Genome 2019, 12, 190042. [Google Scholar] [CrossRef] [Green Version]
  18. Zhao, K.; Wright, M.; Kimball, J.; Eizenga, G.; McClung, A.; Kovach, M.; Tyagi, W.; Ali, M.L.; Tung, C.-W.; Reynolds, A.; et al. Genomic diversity and introgression in O. sativa reveal the impact of domestication and breeding on the rice genome. PLoS ONE 2010, 5, e10780. [Google Scholar] [CrossRef] [PubMed] [Green Version]
  19. Sang, T.; Ge, S. Genetics and phylogenetics of rice domestication. Curr. Opin. Genet. Dev. 2007, 17, 533–538. [Google Scholar] [CrossRef]
  20. Sweeney, M.; McCouch, S. The complex history of the domestication of rice. Ann. Bot. 2007, 100, 951–957. [Google Scholar] [CrossRef] [Green Version]
  21. Kladmook, M.; Kumchoo, T.; Hongtrakul, V. Genetic diversity analysis and subspecies classification of Thailand rice landraces using DNA markers. Afr. J. Biotechnol. 2012, 11, 14044–14053. [Google Scholar] [CrossRef]
  22. Nilthong, S.; Chukeatirote, E. Assessment of genetic diversity in Thai upland rice varieties using SSR markers. Aust. J. Crop. Sci. 2020. [Google Scholar] [CrossRef]
  23. Pathaichindachote, W.; Panyawut, N.; Sikaewtung, K.; Patarapuwadol, S.; Muangprom, A. Genetic diversity and allelic frequency of selected thai and exotic rice germplasm using SSR markers. Rice Sci. 2019, 26, 393–403. [Google Scholar] [CrossRef]
  24. Chakhonkaen, S.; Pitnjam, K.; Saisuk, W.; Ukoskit, K.; Muangprom, A. Genetic structure of Thai rice and rice accessions obtained from the International Rice Research Institute. Rice 2012, 5, 19. [Google Scholar] [CrossRef] [PubMed] [Green Version]
  25. Pusadee, T.; Wongtamee, A.; Rerkasem, B.; Olsen, K.M.; Jamjod, S. Farmers Drive Genetic Diversity of Thai Purple Rice (Oryza sativa L.) Landraces. Econ Bot 2019, 73, 76–85. [Google Scholar] [CrossRef]
  26. Nei, M. Genetic Distance between Populations. Am. Nat. 1972, 106, 283–292. [Google Scholar] [CrossRef]
  27. Tamura, K.; Nei, M. Estimation of the number of nucleotide substitutions in the control region of mitochondrial DNA in humans and chimpanzees. Mol. Biol. Evol. 1993, 10, 512–526. [Google Scholar] [CrossRef]
  28. Kumar, S.; Stecher, G.; Li, M.; Knyaz, C.; Tamura, K. MEGA X: Molecular evolutionary genetics analysis across computing platforms. Mol. Biol. Evol. 2018, 35, 1547–1549. [Google Scholar] [CrossRef]
  29. Liu, K.; Muse, S.V. PowerMarker: An integrated analysis environment for genetic marker analysis. Bioinformatics 2005, 21, 2128–2129. [Google Scholar] [CrossRef] [Green Version]
  30. Alexandrov, N.; Tai, S.; Wang, W.; Mansueto, L.; Palis, K.; Fuentes, R.R.; Ulat, V.J.; Chebotarov, D.; Zhang, G.; Li, Z.; et al. SNP-Seek database of SNPs derived from 3000 rice genomes. Nucleic Acids Res. 2015, 43, D1023–D1027. [Google Scholar] [CrossRef]
  31. Perrier, X.; Jacquemoud-Collet, J.P. DARwin software. 2006. Available online: https://darwin.cirad.fr (accessed on 4 May 2021).
  32. Villanueva, R.A.M.; Chen, Z.J. ggplot2: Elegant Graphics for Data Analysis (2nd ed.). Meas. Interdiscip. Res. Perspect. 2019, 17, 160–167. [Google Scholar] [CrossRef]
  33. Pritchard, J.K.; Stephens, M.; Donnelly, P. Inference of population structure using multilocus genotype data. Genetics 2000, 155, 945–959. [Google Scholar] [CrossRef]
  34. Evanno, G.; Regnaut, S.; Goudet, J. Detecting the number of clusters of individuals using the software STRUCTURE: A simulation study. Mol. Ecol. 2005, 14, 2611–2620. [Google Scholar] [CrossRef] [Green Version]
  35. Earl, D.A.; von Holdt, B.M. STRUCTURE HARVESTER: A website and program for visualizing STRUCTURE output and implementing the Evanno method. Conserv. Genet. Resour. 2012, 4, 359–361. [Google Scholar] [CrossRef]
  36. Jombart, T. adegenet: A R package for the multivariate analysis of genetic markers. Bioinformatics 2008, 24, 1403–1405. [Google Scholar] [CrossRef] [PubMed] [Green Version]
  37. Peakall, R.; Genalex, S. 6: Genetic analysis in Excel. Population genetic software for teaching and research. Bioinformatics 2012, 28, 19. [Google Scholar] [CrossRef] [Green Version]
  38. Oksanen, J.; Blanchet, F.G.; Kindt, R.; Legendre, P. Vegan: Community Ecology Package. R-Package Version 2.0-10. 2013. Available online: http://CRAN.R (accessed on 4 May 2021).
  39. Wright, S. Evolution and the genetics of populations, volume 4: Variability within and among natural populations. Biometrics 1979, 35, 359. [Google Scholar] [CrossRef]
  40. Govindaraju, D.R. Variation in gene flow levels among predominantly self-pollinated plants. J. Evol. Biol. 1989, 2, 173–181. [Google Scholar] [CrossRef]
  41. Eltaher, S.; Sallam, A.; Belamkar, V.; Emara, H.A.; Nower, A.A.; Salem, K.F.M.; Poland, J.; Baenziger, P.S. Genetic Diversity and Population Structure of F3:6 Nebraska Winter Wheat Genotypes Using Genotyping-By-Sequencing. Front. Genet. 2018, 9, 76. [Google Scholar] [CrossRef] [PubMed]
  42. Oka, H.I.; Chang, W.T. A note on rice varieties of Japonica type found in northern Thailand. Bot. Bull. Acad. Sinica 1963, 4, 163–168. [Google Scholar]
  43. Frankham, R.; Ballou, J.D.; Briscoe, D.A.; McInnes, K.H. Introduction to Conservation Genetics; Cambridge University Press: Cambridge, UK, 2002; ISBN 9780511808999. [Google Scholar]
Figure 1. The geographical distribution of the 365 rice landrace accessions across the four geographical regions of Thailand. Different colors represent different populations. Circle shapes represent lowland rice and triangle shapes represent upland rice.
Agronomy 11 00995 g001
Figure 2. Distribution of the SNP markers used in this study across the 12 rice chromosomes.
Agronomy 11 00995 g002
Figure 3. The population structure of 365 rice accessions at K= 3. (A) The average log-likelihood of the K-value against the number of K and delta K for different numbers of subpopulations (K); (B) the estimated population structure of the 365 Thai landrace accessions on K = 3.
Agronomy 11 00995 g003
Figure 4. A discriminant analysis of principle components (DAPC) scatter plot of the 365 accessions of Thai rice landraces. The x and y axes represent the discriminant functions one and two, respectively. Dots represent the individual samples, and centroids are indicated with numbers (1–3). The inset bar charts indicate the number of principle components retained by DAPC (right) and the cumulative variation (left).
Agronomy 11 00995 g004
Figure 5. Principal coordinate analysis (PCoA) ordination based on the Nie distance matrix of the genotypes from 75 SNP markers comparing 365 samples. The PCoA is colored according to the regional populations. The circle and triangle symbols depict lowland and upland ecosystems, respectively. The percentage of the variation coordinate is indicated on the axes.
Agronomy 11 00995 g005
Figure 6. Maximum-likelihood dendrogram illustrating the genetic relationship among the 365 landrace accessions using four-region population partitioning.
Agronomy 11 00995 g006
Figure 7. Correlation of the geographical distance (in kilometers) and genetic distance (pairwise FST) among the 365 rice accessions.
Agronomy 11 00995 g007
Table 1. The polymorphism levels detected using the major allele frequency (MAF), number of different alleles (Na), number of effective alleles (Ne), observed heterozygosity (Ho), expected heterozygosity (He), and Polymorphic Information Content (PIC) based on the SNP markers used in the study.
MarkerChr.PositionREFALTMAFNaHoHePIC
R0100268497312684973CA0.65200.460.35
R0100896178118961781CA0.8920.010.190.17
R01023762056123762056GA0.7200.420.33
R01033064986133064986TC0.91200.160.15
R01033454937133454937AT0.64200.460.36
R01034609753134609753CG0.93200.130.12
R01036673058136673058CT0.91200.170.15
R0200830332628303326GA0.8920.010.200.18
R0200831312028313120GT0.6920.010.430.34
R0200831583528315835TA0.94200.120.11
R02010864977210864977GT0.82200.300.25
R02019361361219361361AC0.9200.180.17
R02019361451219361451GT0.9200.180.17
R03016733359316733359AC0.7220.020.400.32
R03017286744317286744GT0.81200.310.26
R03017571575317571575GA0.8420.010.270.23
R03031335170331335170CT0.8420.010.270.23
R03031437173331437173CA0.91200.160.15
R0400101933541019335AG0.79200.330.28
R0400586732045867320TG0.66200.450.35
R0400645193946451939CT0.86200.240.21
R0400696805046968050AG0.93200.130.12
R04011087541411087541GT0.6920.020.430.34
R04011803874411803874TA0.58200.490.37
R04016214692416214692CATG0.57200.490.37
R04016218749416218749TG0.5720.010.490.37
R04022184296422184296AG0.6420.020.460.35
R04023172729423172729TG0.74200.380.31
R04023175725423175725TC0.75200.370.3
R0500367333353673333TC0.6820.010.440.34
R05019155333519155333AG0.5920.010.480.37
R05019155705519155705GT0.520.010.500.37
R05023218617523218617AC0.7200.420.33
R05026487913526487913AG0.91200.170.15
R05028876504528876504AT0.9120.010.160.15
R05028876779528876779AC0.9120.010.160.15
R0600169319461693194GA0.5420.010.500.37
R0600169341161693411AC0.5620.010.490.37
R0600176576061765760GT0.54200.500.37
R0600176800661768006AC0.79200.330.27
R0600176872461768724TC0.82200.290.25
R0600176899761768997CT0.6920.010.430.34
R0600675288666752886GT0.5520.010.490.37
R0700587356375873563GA0.79200.330.28
R07020013105720013105GT0.55200.490.37
R07020826100720826100GT0.8220.010.300.26
R07024350575724350575CT0.91200.170.15
R07025982551725982551AG0.91200.160.15
R07027746661727746661CG0.5320.010.500.37
R0800226928582269285GC0.56200.490.37
R0800289040782890407GA0.63200.460.36
R0800300790083007900CG0.54200.500.37
R08020382861820382861ATTATGGC-:-0.87200.230.2
R08027057202827057202GA0.83200.280.24
R08027176617827176617CA0.72200.400.32
R08027943348827943348GA0.86200.240.21
R0900419818394198183CA0.7720.010.350.29
R0900724520597245205AT0.920.010.180.16
R0900724544897245448CT0.920.010.180.16
R0900724565097245650AG0.9200.170.16
R0900724573997245739CG0.920.010.170.16
R0900724622297246223TG0.920.010.180.16
R0900724680497246804TG0.8520.010.260.23
R100156803161015680316CA0.92200.150.14
R100219550491021955049AG0.9200.180.16
R110138404671113840467AG0.81200.300.26
R110141181351114118135AG0.620.010.480.36
R110141695081114169508CA0.7520.010.370.3
R110214810481121481048ATT-:-0.52200.500.37
R110282092111128209211AT0.7200.420.33
R12009613648129613648AC0.920.010.180.17
R120187592361218759236TG0.85200.250.22
R120188561771218856177GA0.83200.290.24
R120223736431222373643AG0.6920.010.430.34
R120231732651223173265TA0.77200.360.29
Table 2. The genetic diversity parameters of four subpopulations grouped by the four regions of Thailand.
PopulationSample SizeMajor Allele Frequency/LocusMean Gene DiversityMean PIC Value
All subpopulations3650.760.330.26
Central (C)890.770.320.25
Northern (N)960.800.290.24
Northeastern (NE)860.810.280.23
Southern (S)940.770.310.25
Table 3. Genetic diversity parameters of the three subpopulations grouped by STRUCTURE analysis.
PopulationSample SizeMajor Allele Frequency /LocusMean Gene DiversityMean PIC Value
All subpopulations3650.760.320.26
Group I (indica)1670.800.270.21
Group II (indica)1660.820.240.19
Group III (japonica)320.930.090.07
Table 4. The pairwise population FST analysis of the four subpopulations grouped by region of Thailand.
SubpopulationsCentralNorthNortheastSouth
Central (C)0.000
Northern (N)0.0390.000
Northeast (NE)0.0230.0160.000
South (S)0.0520.0690.0780.000
Table 5. The AMOVA analysis for the geographical populations in the collection of 365 landraces.
SourcedfSSMSEstimated VariancePercentage of Total VarianceProbability (p)
Among Pops31463.724487.9084.8359%<0.001
Within Pops36116970.87447.01147.01191%
Total36418434.597 51.846100%
Publisher’s Note: MDPI stays neutral with regard to jurisdictional claims in published maps and institutional affiliations.

