Article

Influence of Nitrogen, Calcium and Nano-Fertilizer on Strawberry (Fragaria × ananassa Duch.) Fruit Inner and Outer Quality

1
Agricultural Institute of Slovenia, Hacquetova ulica 17, SI-1000 Ljubljana, Slovenia
2
Biotechnical Faculty, University of Ljubljana, Jamnikarjeva 101, SI-1000 Ljubljana, Slovenia
*
Author to whom correspondence should be addressed.
Submission received: 31 March 2021 / Revised: 13 May 2021 / Accepted: 15 May 2021 / Published: 18 May 2021
(This article belongs to the Special Issue Preharvest Practices for High-Quality Strawberry Production)

Abstract

:
The production system, especially fertilisation has an important effect on yield and quality of strawberries. In the present study, plants were fertilized with different doses of nitrogen (0–100% recommended doses), calcium chelate, as well as nano fertilizer Lithovit. Strawberry cultivar ‘Clery’ yield and quality parameters (fruit color and firmness) including nutritional indicators (total soluble solids, sugars, organic acids, phenolic and volatile compounds) were monitored. Volatiles were identified and monitored using headspace solid phase microextraction and analysed using gas chromatograph-mass spectrometry (SPME/GC-MS) and sugars, organic acids, and phenolic compounds with high performance liquid chromatography. Organic acids and phenolic compounds were detected with mass spectrometer (HPLC/MS). Both nitrogen and calcium fertilisation had altered sugars, organic acids, volatile and phenolic contents in strawberry fruits. Fertilisation with higher doses of nitrogen and calcium increased the content of unpleasant aromas aldehydes hexanal (up to 3.8-fold) and (E)-2-hexen-1- (up to 3.7-fold). The content of fruity esters was uppermost in fruits fertilised with nano-fertiliser Lithovit (up to 2.3-fold). Fertilisation with N and Ca decreased the strength of ketone and terpenoids fruity aroma. The highest content of total phenols, as well as all individual hydroxycinnamic and hydroxybenzoic acid derivatives were obtained in the nano-fertiliser Lithovit treatment. Fertilisation, especially with nitrogen, had mostly negative impact on strawberry flavour while nano-fertilization with Lithovit improved strawberry phenolic content and aroma.

1. Introduction

Taste is the main reason why strawberries (Fragaria × ananassa Duch.) are one of the most popular fruits with consumers [1]. Due to new technologies and varieties, strawberries are present on the market throughout the year. They can be produced using many different cultivation systems. The goal of all technologies is a high yield and strawberries with good properties and flavour. Nowadays, high yield and adequate fruit quality are often the result of intense, often chemical fertilisation, use of growth promoters, LED lamps, plant protection, and optimal irrigation [2,3]. With less intensive organic production, it is also possible to achieve the same or even better strawberry quality [4], with little or no loss of yield [5]. Bhat et al. [6] concluded in their research that consumers preferred strawberries with a uniform color, sweet taste, intense fruity aroma and that were moderately juicy. Most of these characteristics can be regulated with attentive fertilisation [3]. Taste consists of both the perception in the mouth (sweetness, acidity or bitterness, and juiciness) and the smell (volatile compounds). Fruits produce and emit a considerable number of volatile organic compounds (VOCs) as an indicator of ripening. The content and composition of these molecules exhibit genotypic variation and phenotypic characteristics [7] and are highly dependent on the environment and cultivation [8].
In general, the strawberry can adapt to an extensive range of environments and can thrive in a variety of soils. Slovenia is a very rainy country, and this is one of the reasons why nutrient leaching potential is relatively high especially nitrogen. Strawberry producers have adopted the government [9,10] recommended technology and fertilize with nitrogen at the beginning of the growing period to maximize yield. Strawberries require significant amounts of macro and micronutrients to meet photosynthetic demands and ensure adequate fruit growth from emergence of fluorescence to harvesting, which takes only two to three months [8,11]. Due to shallow roots, nitrogen (N) uptake from deeper soil areas is limited. In the past, intense nitrogen fertilisation was often used, in the belief that it promotes vegetative development and fruit yield [12]. Nitrogen is an essential element for the synthesis of enzymes and amino acids, which are in charge for the construction of all cellular components, required for the development of the plant [13]. N deficit in the strawberry (foliar N content of less than 1.9%) causes chlorosis of the leaves and a decrease in leaf area, root mass, fruit size and anthocyanin content [14]. An excess of N (foliar N content of 4%) promotes vegetative growth, delays maturation, and causes a loss of firmness in the fruit, reducing its quality [12]. In addition, Ojeda-Real L.A. et al. [3] found that higher concentrations, especially of mineral nitrogen fertilisation, have a major negative impact on strawberry taste. Besides N, one of the most important macro-nutrients, calcium (Ca) is also important in terms of fruit quality. Calcium ions have many roles in plant cell physiology. They are significant intracellular messengers, mediating responses to hormones, biotic and abiotic stress signals and a variety of developmental processes [15]. They also are an important part in the structural maintenance of membranes and cell walls. Preharvest treatments with calcium improve fruit firmness [16]. Singh et al. [17] indicated that pre-harvest foliar application of Ca is useful for reducing the incidence of disorders and obtaining higher marketable yield in the ‘Chandler’ strawberry. However, little is known about the efficiency of foliar application of Ca on improving fruit quality or yield of strawberry. Nano-fertilizers are used recently as an alternative to conventional fertilizers for slow release and efficient use by plants. Nano-fertilizers could enhance nutrient use efficiency and decrease the costs of environmental protection [18]. Emara et al. [19] presented interesting results, showing positive effect of Lithovit fertilisation on cotton productivity and Farock et al. [20] on potato yield, but there is no research indicating the influence of Lithovit fertilisation on strawberry performance. Lithovit is CO2 foliar fertilizer that contains calcium carbonate and therefore accelerates photosynthesis. Since aroma is one of the most valued characteristics of the fruit, volatile flavour compounds play a key role in determining consumer acceptance of strawberries. The volatile profile of strawberries consists of more than 360 constituents, including esters, aldehydes, ketones, alcohols, terpenes, furanones and sulphur compounds [21], and it is considered one of the most complex fruit flavours. Many of these compounds are produced in trace amounts that most analytical instruments cannot measure, but humans can detect them with their senses [22]. The diversity of aroma compounds leads to a harmonious taste, but fewer than 20 of them contribute significantly to strawberry flavour [21]. Furanones are considered to be the dominant aroma compounds in strawberries [21], resulting in the typical caramel-like, sweet and fruity aroma. Esters comprise 90% of total volatile compounds in ripe strawberries and represent the largest and one of the most important groups contributing to the strawberry aroma profile [21], providing sweet fruity notes [23]. The second largest group of important volatile fruit components are terpenoids, which account for more than 20% of total volatile components in some strawberry varieties. Terpenoids such as linalool [21], nerolidol and terpineol, which provide spicy and citrus notes, tend to be particularly variety-specific. Other equally important compounds that contribute to strawberry flavour are hexenal, trans-2-hexenal, and cis-3-hexenal, which give strawberries unpleasant green and unripe notes [21]. Primary and secondary metabolites, especially sugars, organic acids and phenolics play an important role in plant existence and human wellbeing. Strawberries have a remarkable nutritional quality, correlated especially to its high levels of vitamin C and phenolic components [24]. Fertilisation has also been shown to affect the phenolic content of strawberry [25].
Since very little work has been done to investigate the influence of specific fertilisation practices on strawberry phenolic, aroma and other quality parameters, especially in relation to yield, the aim of this study was to evaluate the influence of different nitrogen and calcium fertilisation on yield and the content of selected volatile and phenolic compounds contributing to strawberry quality.

2. Materials and Methods

2.1. Plant Material and Growth Conditions

The experiment was carried out in accordance with the integrated production guidelines [9] at the experimental station of the Agricultural Institute of Slovenia, located in Brdo pri Lukovici (latitude, 46°10′ N; longitude, 14°41′ E). Each individual treatment (6 treatments) was repeated in five blocks (one plot for each treatment within one block), with 10 plants included in each plot. The field trial was carried out on silty loam soil rich in potassium and nitrogen and low in phosphorus, equipped with a drip irrigation system. Soil texture is silty loam with pH value of 6.1 and mineral composition of 9.5 mg/100 g P2O5, 27 mg K2O/100 g and C organic matter stock (2017 soil analysis). Frigo strawberry cv. ‘Clery’ plants (Fragaria × ananassa Duch.) were planted in an open field on 7 August 2017 and covered with a non-heated plastic green-house in spring 2018. Slightly raised beds were covered with black polyethylene. Plants were planted in double rows, with 0.25 m × 0.25 m spacing between the plants and 1.3 m spacing between the rows. Average day and night temperatures in the tunnel ranged between 10.5 °C and 24.3 °C during the production period. Light levels (0–757.3 W/m2) and humidity (53.2–99.4%) were under ambient spring conditions. An experiment was conducted to evaluate the application of different doses of nitrogen and calcium on yield and selected strawberry aroma com-pounds. Recommended dose of nitrogen (RDN) is 60 kg N/ha per year [9]. Six treatments were specified: CON (control)–without fertilisation, 33% of RDN (20 kg N/ha), 66% of RDN (40 kg N/ha), 100% RDN (60 kg N/ha), calcium chelate (CA-CH 1 g/L water) and Lithovit (LITH–5 g/L water). For nitrogen fertilisation we used urea, which consists of 46% N. For Ca fertilisation we used nano fertiliser Lithovit forte® (contains 80% calcium carbonate, 4.6% magnesium carbonate, 0.75% Fe) and calcium chelate with 10% Ca. We applied N using drip irrigation and Ca with spraying. The control plants were sprayed with water to unify the spraying with Ca spraying and irrigated with drips using only water. Fertilisation of the plants was performed during the fructification of strawberries weekly from 13 April 2018 (phenological development stages of strawberry [26]—first flower open (BBCH 60) until 15 May 2018 (beginning of harvesting—BBCH 87) early in the morning. For the nitrogen fertilisation treatments, we used 0.172% solution in divided doses, depending on the treatment required to reach the necessary concentrations, to avoid harming the plants due to high concentration. For the foliar application of calcium, the plants were sprayed in the morning, as the leaf stomata are open, and the effectiveness of the product is maximized. Foliar calcium application was performed on 3 April at full bloom (BBCH 65) and on 14 May, when the first fruits were harvested (BBCH 87). Each plant was sprayed until the leaves were completely soaked. Each treatment was repeated for five blocks and each block contained 10 plants. The number of fruits per plant and the total yield per plant were recorded on each harvesting date (from the beginning of harvesting and until the last fruits were harvested—BBCH 87–90): 14, 16, 18, 22, 24, 28, and 31 May, and 4, 7, and 11 June. Only ripe fruits were collected at each sampling date and the corresponding ripeness was determined according to the visual characteristics of the strawberries. Fruit samples for biochemical analysis (sugars, organic acids, phenolics, and volatile compounds) were collected at the third harvest on 18 May. The fruit was picked early in the morning when temperatures did not exceed 15 °C, labelled, immediately shock frozen in liquid nitrogen, stored in plastic bags, taken to the laboratory in liquid nitrogen and stored at −80 °C for up to a week before further analysis was performed.

2.2. Chemicals and Products

The following standards were used to determine volatile compounds: 1-penten-3-ol, 2-heptanone, α-terpineol, cis-2-hexen-1-ol, ethyl-2-methylbutyrate, ethyl-isovalerate, geraniol, hexanal, methyl hexanoate, methyl octanoate, methyl-2-methylbutyrate, nerolidol, octyl acetate, trans-2-hexen-1-al and trans-2-hexen-1-ol from Sigma-Aldrich Chemicals (St. Louis, MO, USA) and deuterated α-terpineol from CDN Istotopes. Water for the samples was double distilled and purified with a Milli-Q system (Millipore, Bedford, MA, USA). A commercially available urea granular nitrogen fertiliser was purchased from Petrokemija d.o.o. (Novi Sad, Srbija), the calcium fertiliser Lithovit forte® (77.9% CaCO3, 8.7% MgCO3, 7.4% Si, 0.20 K2O, 0.02% P, 0.03% Na and minimal amounts of Fe, Al, S, Sr, Ba, Mn and Zn) was provided by Tribodyn (Northeim, Germany) and calcium chelate (10% Ca) was from Valagro (Coral Gables, FL, USA).
Standards used for determination of primary metabolites were fructose, glucose, sucrose, fumaric acid (Fluka Chemie, Buchs, Switzerland), shikimic acid, citric acid (Sigma-Aldrich, Chemie GmbH, Steinheim, Germany) and malic acid (Merck KGaA, Darmstadt, Germany). For phenolic compounds, following standards were used: (−)-catechin (Roth, Karlsruhe, Germany), pelargonidin-3-O-glucoside (Extrasynthèse, Genay, France), caffeic acid, ferulic acid, ellagic acid, p-coumaric acid, procyanidin B1, cyaniding-3-O-glucoside, quercetin-3-O-galactosideand, kempferol-3-O-glucoside (Fluka Chemie). Methanol for all solutions was obtained from Sigma. Formic acid and acetonitrile for the mobile phases were HPLC-MS grade chemicals from Fluka (Chemie GmbH). Double distilled water purified with the Milli-Q- system (Millipore, Bedford, MA, USA).

2.3. Extraction and Determination of Sugars and Organic Acids

For the extraction of primary metabolites, 1 g of fresh fruits (several homogenized fruits in 5 repetitions, n = 5) were homogenized in 5 mL of double distilled water using Ultra-Turrax T-25 (Ika-labortecnik, Straufen, Germany), left for half an hour at room temperature as reported by Tomić et al. [27]. Extracted fruits were centrifugated at 10,000× g for 10 min at 10 °C (Eppendorf Centrifuge 5810 R) and filtered through a 0.20 µm cellulose ester filter (Macherey-Nagel, Duren, Germany) and transmitted into a vial. Analysis of primary metabolites was carried out using high performance liquid chromatography (HPLC) system (Vanquish, Thermo Scientific, San Jose, CA, USA). For sugar identification a Rezex RCM-manosaccharide Ca+2 (8%) column (300 mm × 7.8 mm, Phenomenex, Torrance, CA, USA) and IR detector was used. For organic acids the same HPLC system with UV detector and Rezex ROA-organic acid H+ (8%) column was used. Retention time characteristics were used to identify sugars and organic acids in fruit extracts and its content levels were calculated with the information provided by corresponding external standard and expressed as mg/g fresh weight (FW).

2.4. Extraction of Phenolic Compounds and Determination of Individual Compound Using HPLC-DAD-MSn

Individual phenolic compounds were extracted from 3 g of fresh fruits (several homogenized fruits in 5 repetitions, n = 5) with 6 mL 80% MeOH with 3% formic acid in ultrasonic bath at 0 °C for half an hour. The extract was centrifugated and filtered through 0.2 µm polyamide filter (Macherey-Nagel) and transferred into vials. Phenolic compounds were analyzed on a HPLC system (Dionex UltiMate 3000, Thermo Scientific, San Jose, CA, USA) coupled with a diode array detector at 280 nm, 350 nm and 530 nm as previously described by Tomić et al. [27]. The identification of individual phenolics was done on HPLC system tandem with mass spectrometer (LTQ XL™ Linear Ion Trap, Thermo Scientific, San Jose, CA, USA) with an electrospray ionization (ESI) operating in positive (anthocyanins) and negative (other phenolic group) ion modes. Full scan data dependent MSn scanning from m/z 115 to 1500 was performed for the analyses as described by Tomić et al. [27]. The content of phenolic compounds was calculated from peak areas of the sample and corresponding external standards and expressed in mg per g fresh weight (mg/g FW).
For phenolics of which the external standards were not available, contents are presented as equivalents of related substances (phenolic acids derivatives as their aglycone equivalents, procyanidin dimers as procyanidin B1, quercetin-3-O-glucuronide as quercetin-3-O-galactoside, kaempferol-3-O-hexoside, kaempferol-3-O-acetylglucoside, and kaempferol-3-O-glucuronide as kaempferol-3-O-glucoside equivalents, pelargonidin-malonyl-glucoside and pelargonidin-3-O-rutinoside as pelargonidin-3-O-glucoside).

2.5. Color, Firmness and Soluble Solids Analysis

Portable colorimeter, which has been previously calibrated using calibration plate has been used to measure the surface color of strawberry fruits (CR-10 Chroma; Minolta, Osaka, Japan). Color coordinates L*, a* and b* had been recorded: L* for perceptual lightness, a* for red-green (a* negative green and a* positive red) and b* blue-yellow (b* negative demonstrate blue, b* positive yellow). Fruit firmness, recorded on 10-berry samples for each treatment, was measured on the fruit shoulder through the skin using a penetrometer (T.R. Turoni srl, Forlì, Italy) with a 3 mm-diameter needle and expressed in N (Newton, N) immediately after harvesting. Total soluble solids were determined using a digital handheld refractometer (30PX, Mettler Toledo, Columbus, OH, USA) and the results expressed in °Brix.

2.6. Aroma Compound Analysis

Stock solutions of 15 aroma compounds and internal standard with a concentration of 200 mg/L were prepared in HPLC-grade ethanol. Working solutions were prepared by dilution with MilliQ water. Harvested fruit samples were immediately frozen in liquid nitrogen and stored at −80 °C. Prior to analysis, the fruit was powdered in liquid nitrogen with a blender (IKA), with each sample representing the homogenised powder of 10 fruits. Samples were incubated at 30 °C for 5 min, and then the extracts were prepared. 3 g of NaCl was placed in a 20 mL Solid Phase Microextraction (SPME) vial, followed by 0.1 g of homogenised sample (to determine 2-heptanone, cis-2-hexen-1-ol, geraniol, hexanal, octyl acetate, trans-2-hexen-1-al and trans-2-Hexen-1-ol) or 0.5 g of homogenised sample (for the rest of the aroma compounds). Then 6.5 mL (when 0.5 g of sample was used) or 6.9 mL (when 0.1 g of sample was used) of deionised MiliQ water and 100 µL of deuterated analytical standard d3-α-terpineol (internal standard) with a concentration of 400 μg/L was added. The vial was closed and shaken to dissolve the NaCl. Three technical replicas were performed for each sample. The samples were analysed using a gas chromatograph (GC, Agilent Technologies 7890A, Shanghai, China) equipped with a Gerstel MPS2 multipurpose sampler (Gerstel, Mulheim an der Ruhr, Germany) and column, a DB-WAX (Agilent Technologies, 30 m, 0.25 mm i.d., 0.25 μm film thickness) with a constant flow of helium at 1.5 mL/min. The vial was incubated for 10 min at 30 °C. SPME on PDMS/DVB fibre (Supelco, Bellefonte, PA, USA) was performed for 40 min at 30 °C with constant stirring at 350/min. The GC injector was held at 220 °C for 3 min for the analytes to desorb from the fibre. The GC oven was programmed as follows: 40 °C for 10 min, from 40 to 220 °C at 4 °C/min, held at 220 °C for 15 min. To determine analytes, a mass spectrometer (MS, Agilent Technologies 5975C, upgraded with a triple-axis detector, Palo Alto, CA, USA) was used. The temperature of the ion source was 200 °C, the auxiliary temperature was 220 °C, and the quadrupole temperature was 150 °C. For qualitative determination, retention time and mass spectrum in selective ion monitoring mode (SIM) were used. The ions, scanned in SIM, are presented in Table 1. For the internal standard, the ions scanned in SIM were 62 (target ion), 124 (qualifier ion 1), 139 (qualifier ion 2) m/z. For quantitative determination, the peak area of the target ion was used. Linearity was verified by using standards in water solution, which were also used for calibration. Linearity was checked using 5–10 concentration levels and five repetitions at each level. Linearity and range were determined by multiple linear regressions, using the F test. According to the guidelines for single-laboratory validation [28] R2 should be ≥0.96. The limit of detection (LOD) and the limit of quantification (LOQ) were determined at an S/N ratio of at least 3 and 10, respectively. In cases where the concentrations in samples were high, they were set much higher. To determine precision [29], namely repeatability and reproducibility, two spiked samples of strawberries and two unspiked samples of strawberries were analyzed within a period of 10 days. The standard deviation of repeatability (r) of the level and the standard deviation of reproducibility (R) of the level were both calculated. The uncertainty of repeatability and uncertainty of reproducibility were calculated by multiplying the standard deviation of repeatability and standard deviation of reproducibility by Student’s t factor with 9 degrees of freedom and a 95% confidence level (t95;9 = 2.262). Accuracy was verified by checking the recoveries. Ten spiked samples of strawberries and ten unspiked samples of strawberries were analyzed within a period of one day. The average of the recoveries and the relative standard deviations (RSDs) were calculated. According to the guidelines for single-laboratory validation [28], acceptable mean recoveries are:
-
At a level of >10 μg/kg and ≤100 μg/kg within the range 70–120%, and associated repeatability RSD ≤ 20%.
-
At a level of >100 μg/kg and ≤1000 μg/kg within the range 70–110%, and associated repeatability RSD ≤ 15%.
-
At a level of >1000 μg/kg within the range 70–110%, and associated repeatability RSD ≤ 10%.
The results of method validation are presented in Table 1. Validation shows that the head space SPME-GC-MS method is suitable for quantitative determination of 13 aroma compounds. For determination of nerolidol, R2 for the calibration curve (0.934) was too low and RSD from 10 parallel recoveries (32.9%) was too high. For geraniol RSD from 10 parallel recoveries (20.8%) was too high. Therefore, nerolidol and geraniol were measured semi-quantitatively.

2.7. Statistical Analysis

The data were analysed using the Stat graphics Centurion XVI.I program (Manugistics, Inc., Rockville, MD, USA). Differences between the treatments were determined using one-way analysis of variance (ANOVA). The obtained values were separated using Tukey’s test and considered significant at p < 0.05.

3. Results

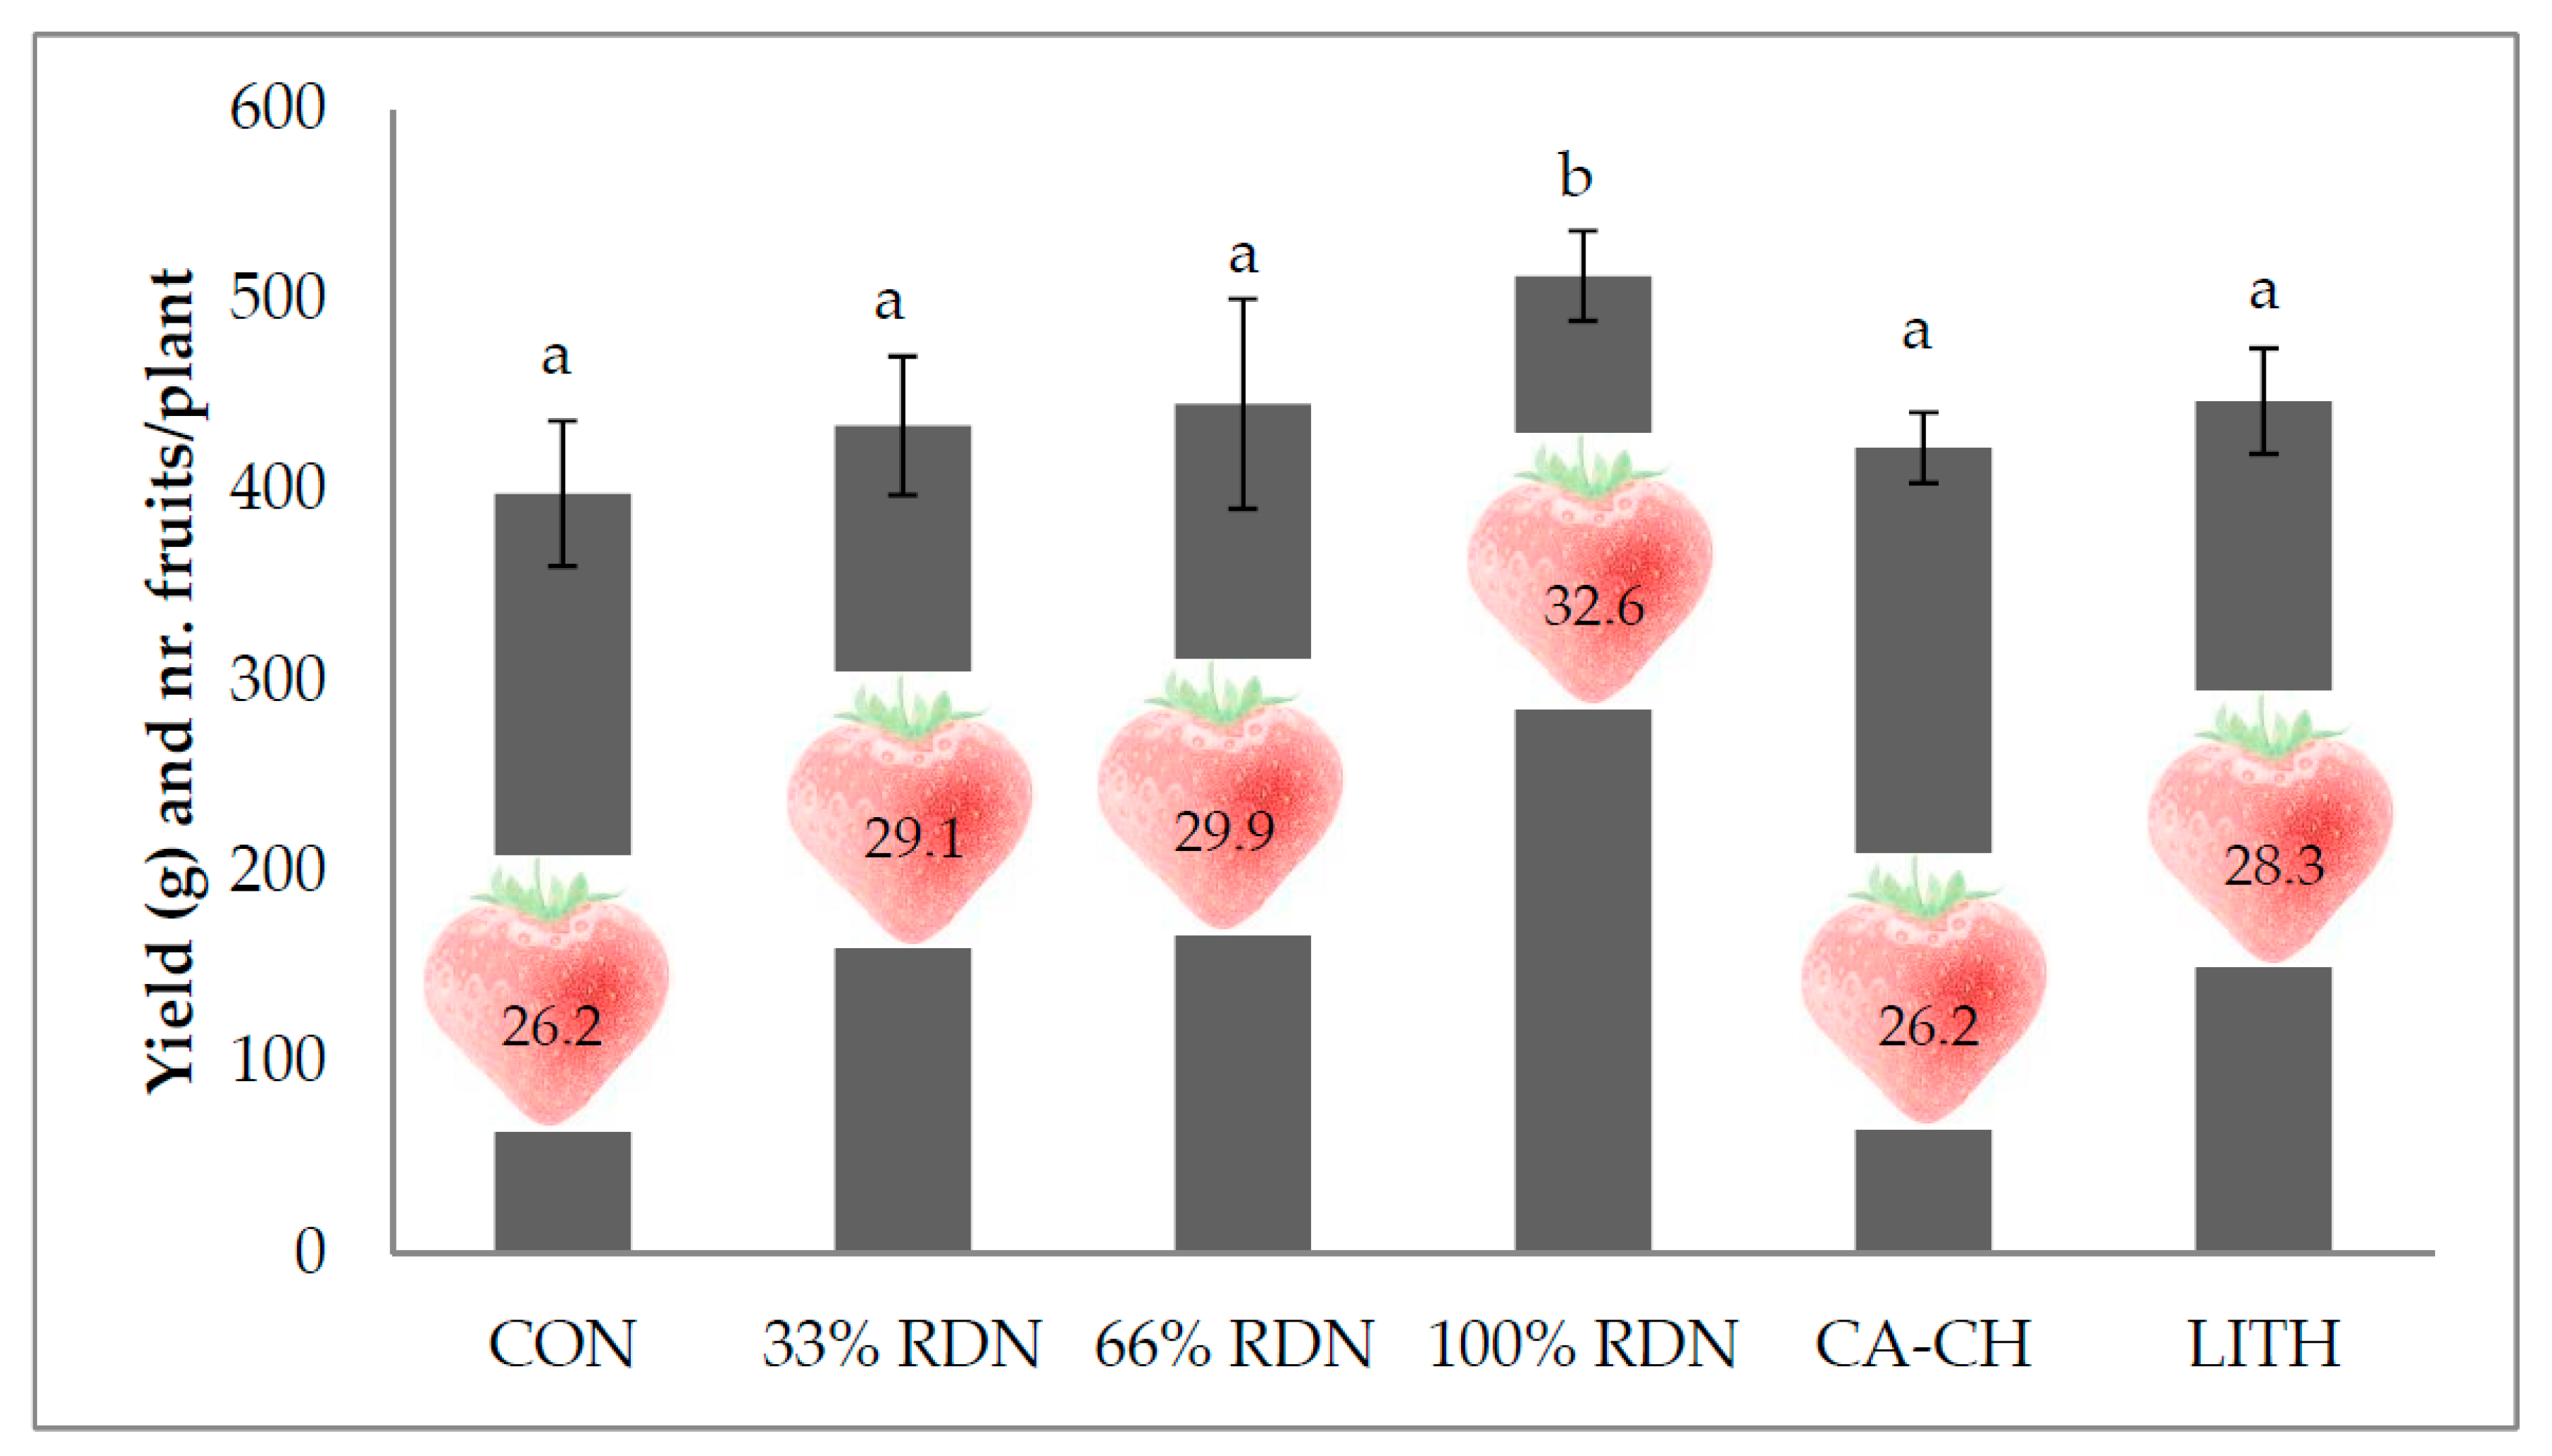
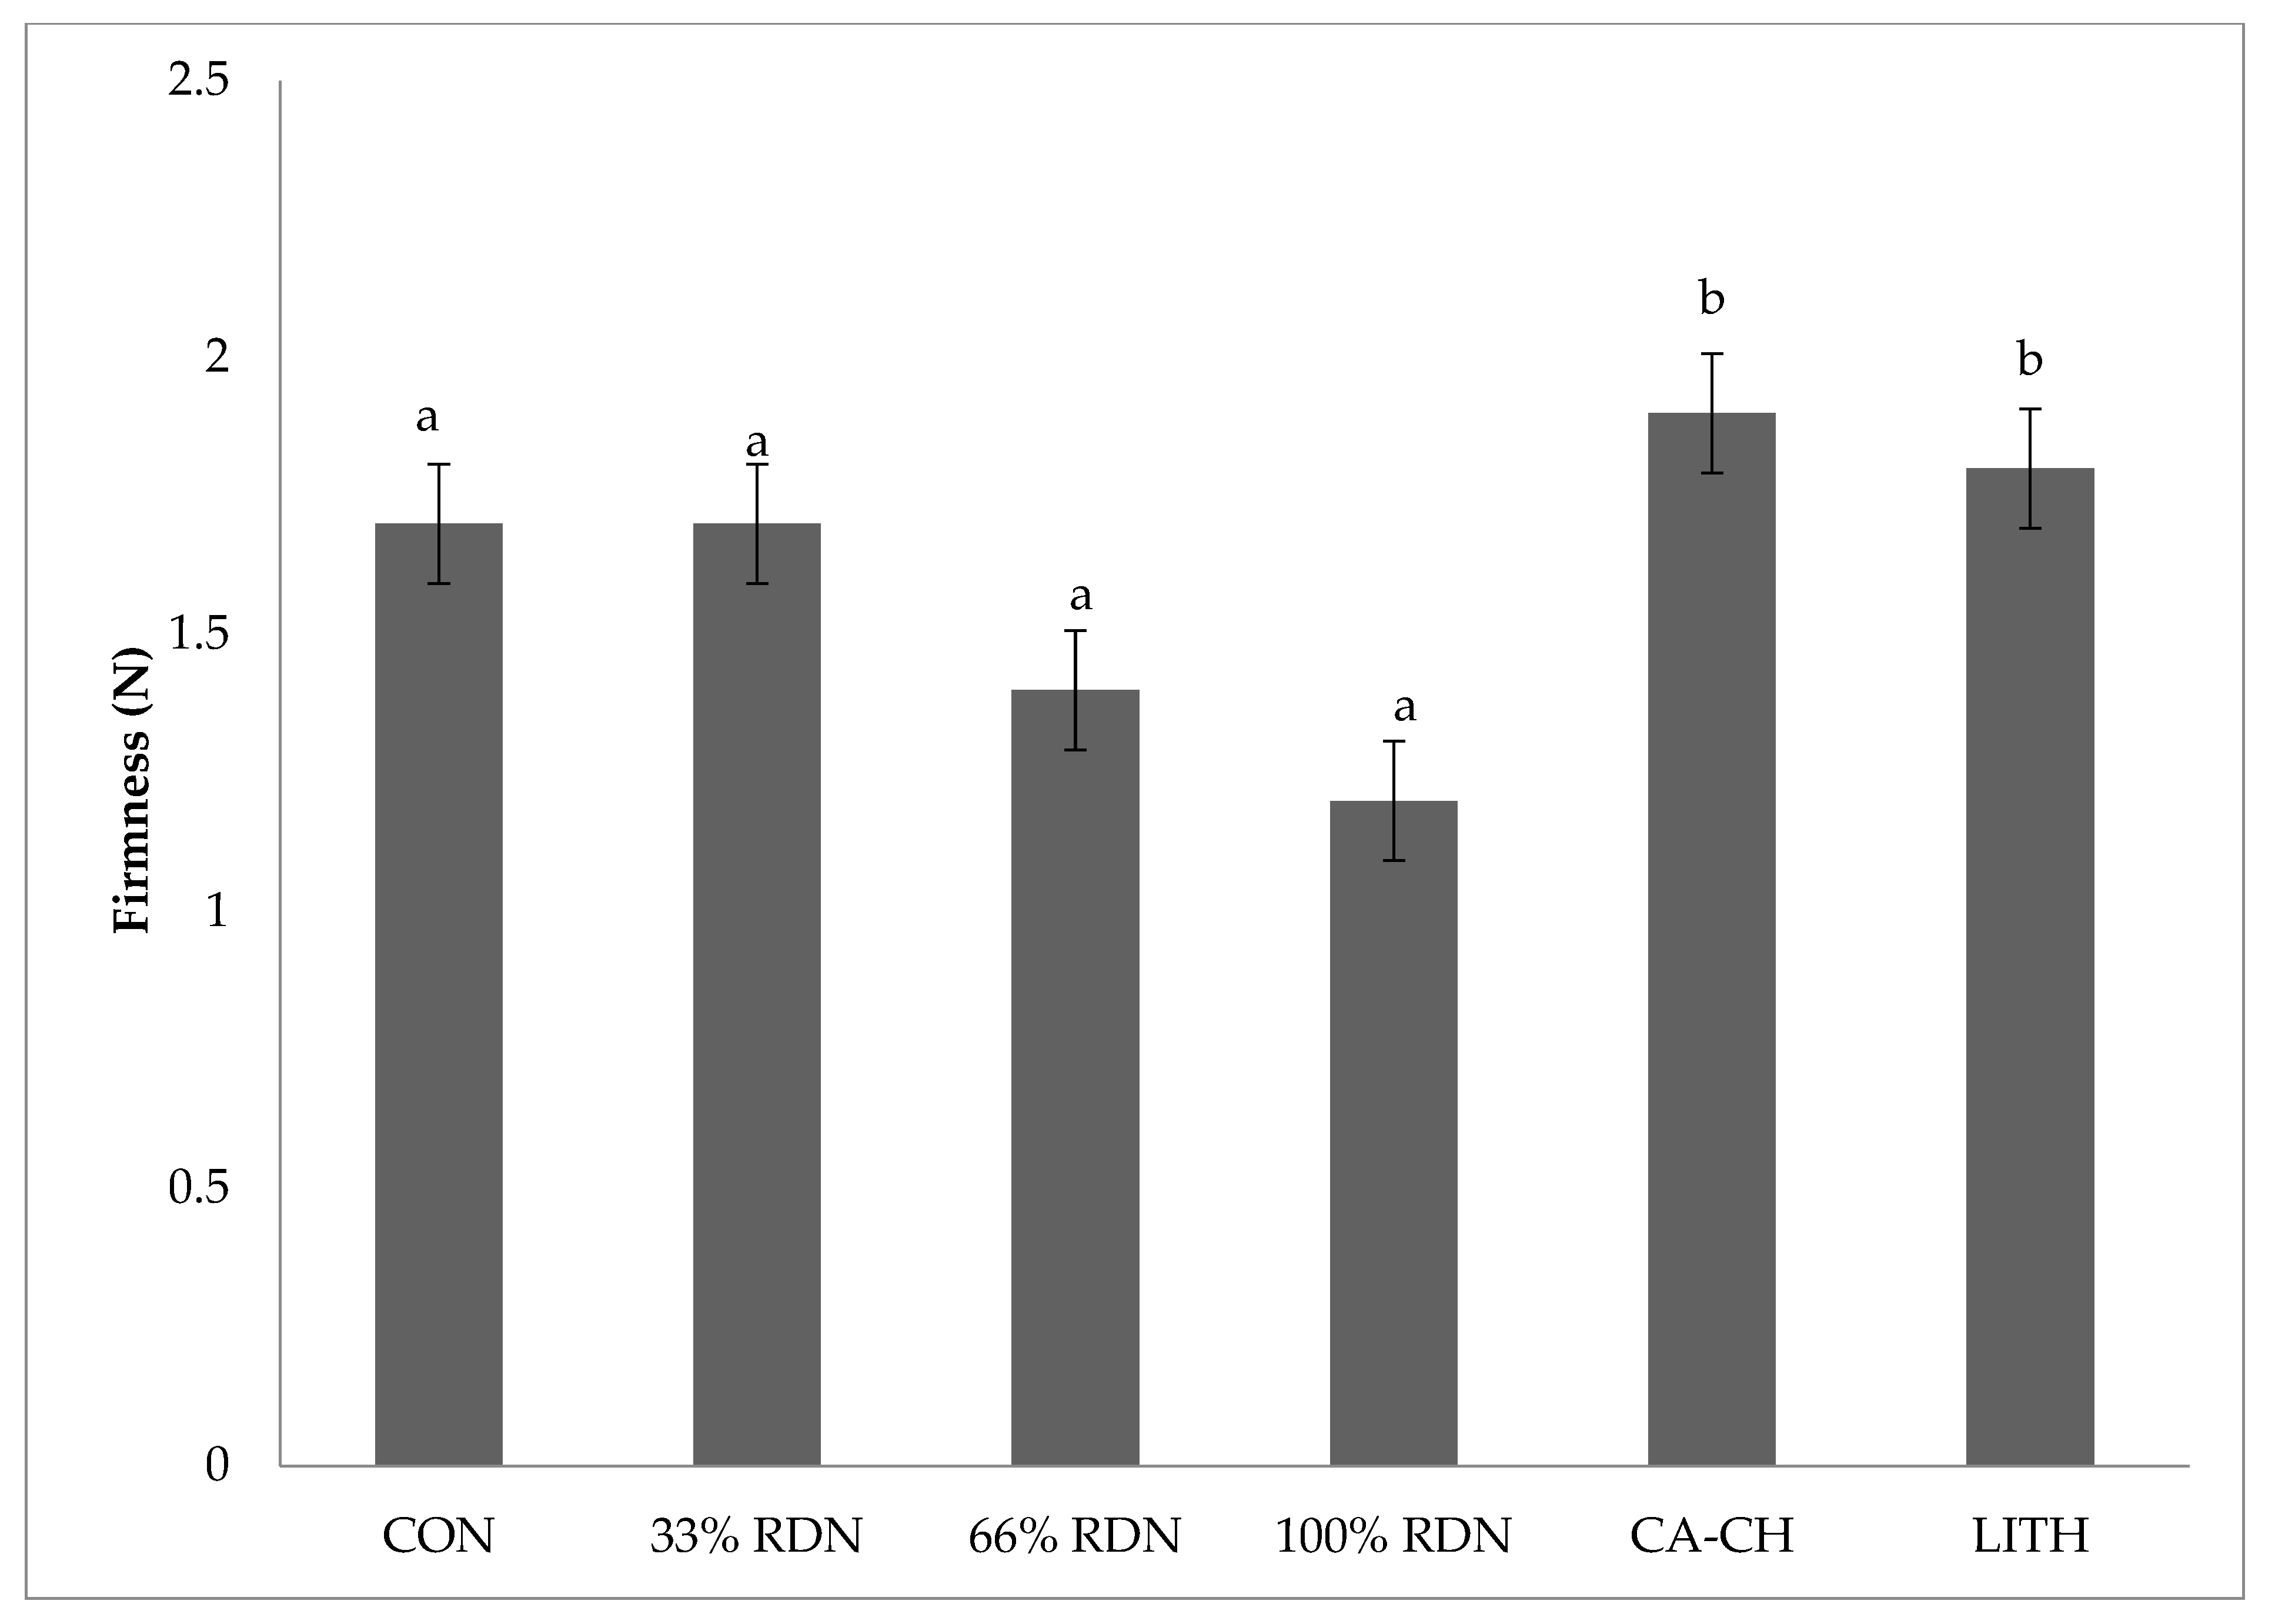
3.1. Yield and Fruit Quality

The number of fruits per plant, fruit mass and yield were recorded for ten harvesting dates. The data collected showed that plant yield was significantly influenced by different fertilisation treatments (Figure 1). Plants treated with the required dose of N had a significantly higher yield (up to 1.3-fold) and a higher number of fruits per plant (up to 1.3-fold) compared to other treatments and the control. We recorded a higher yield and number of fruits for Lithovit treated plants (440 g and 28.3 fruits/plant) in comparison to control plants (400 g and 26.2 fruits/plant), but there were no statistically significant differences. Average fruit weight was 15.9g and did not differ among treatments. Fruits were all harvested based on that they were full red, without white tip at the end of the fruits. Based on our measured parameters among different fertilizations, no significant differences in color were monitored. Color parameters was L* average was 45, a* 14 and b* 8.2 (data not shown). Fruit fertilised with calcium and Lithovit were significantly firmer in comparison to nitrogen treated and control fruits. Moreover, 66% and 100% RDN fertilised fruits were for approximately 30% softer in comparison to CA-CH fertilised fruits (Figure 2).

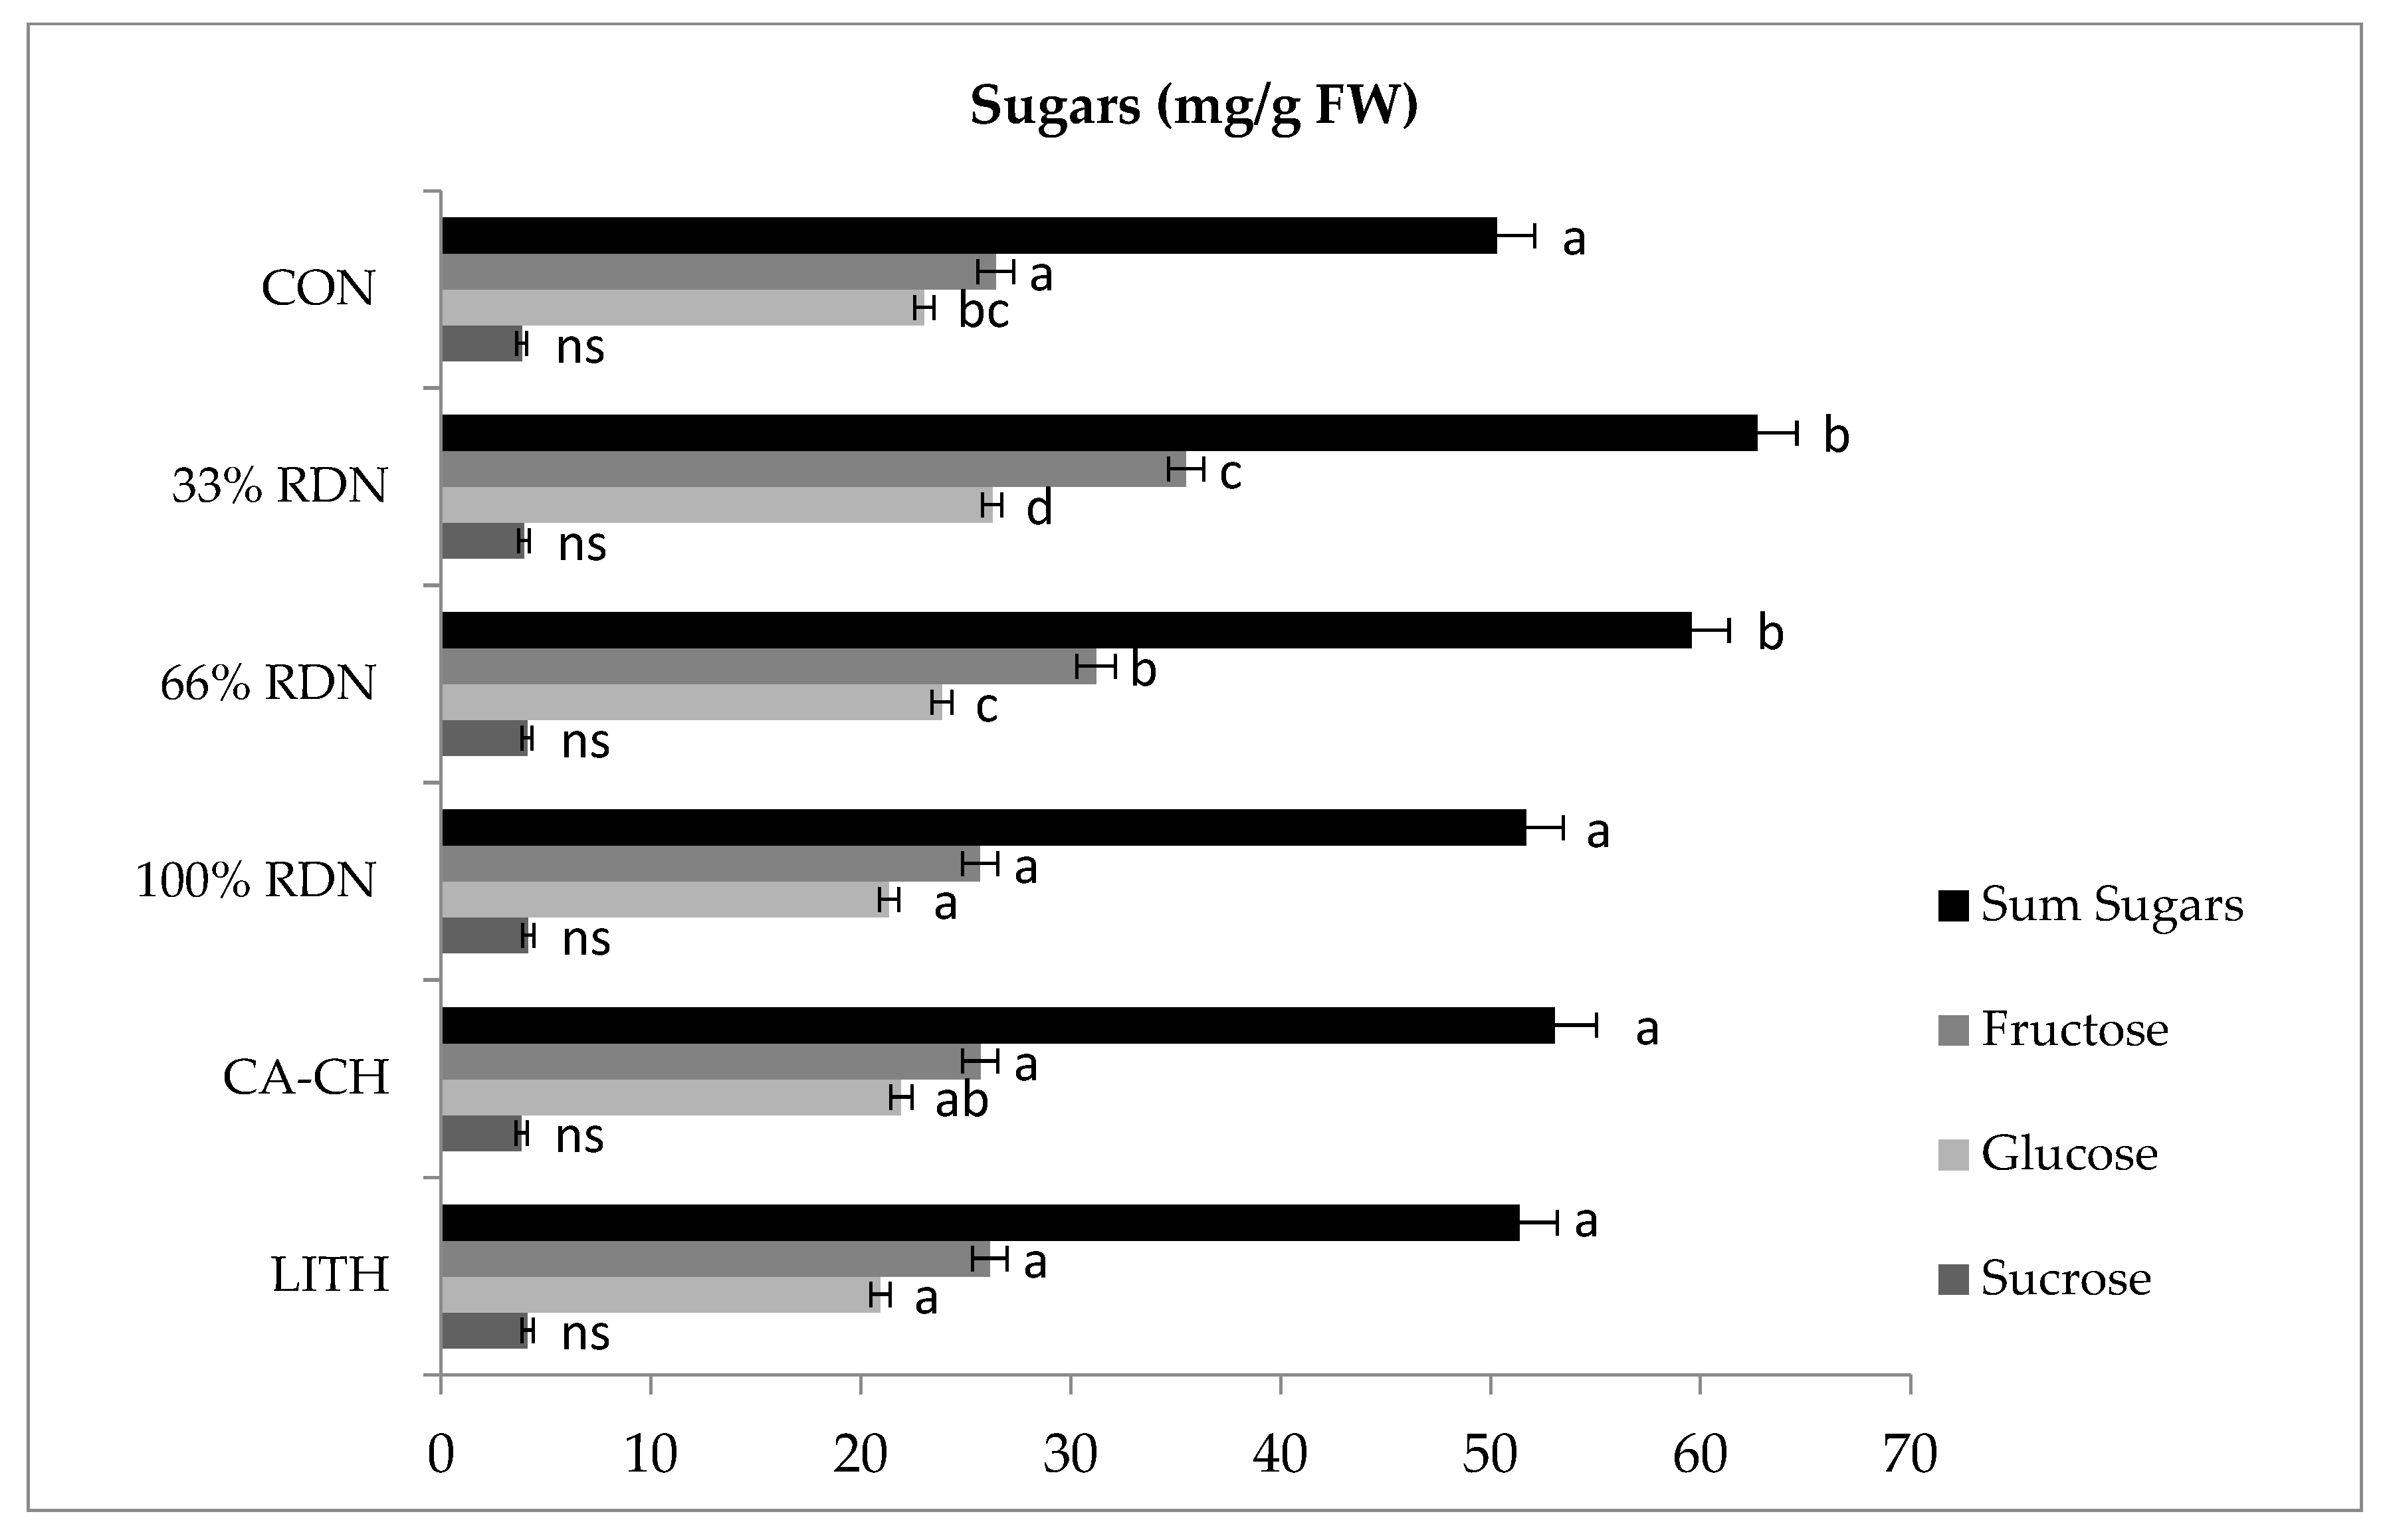
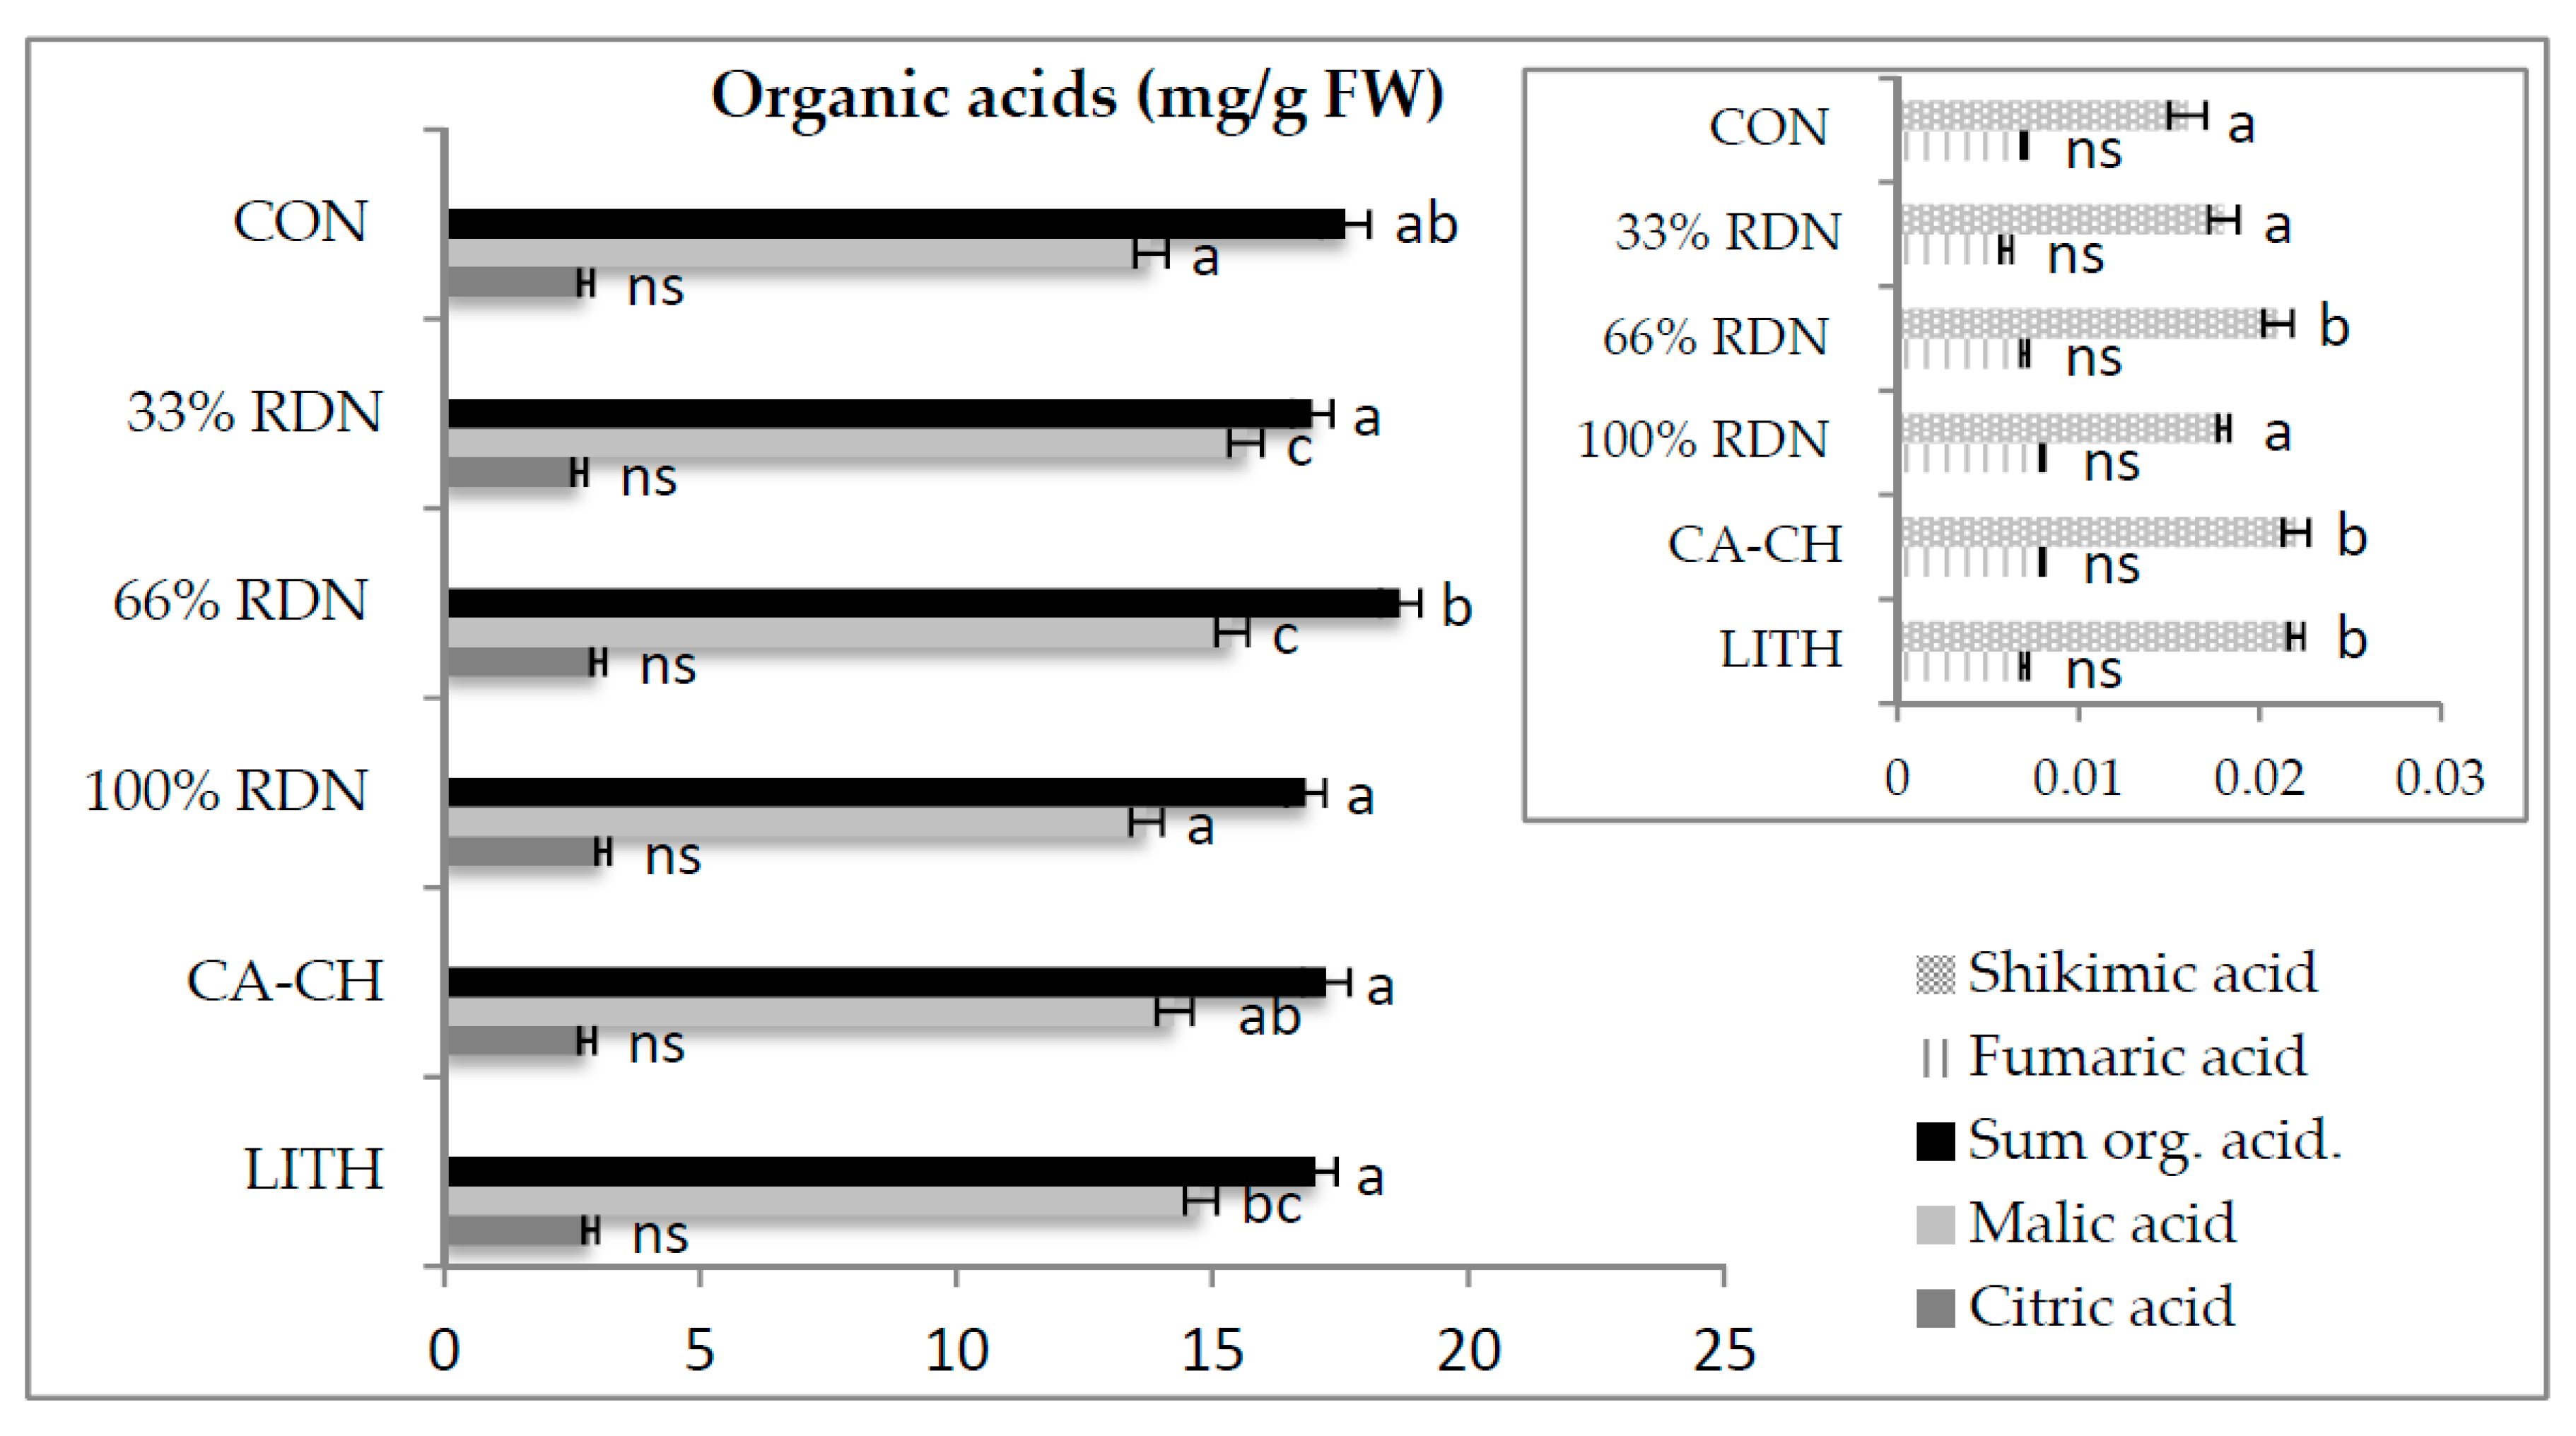
3.2. TSS, Sugar and Organic Acid Content

Fruits from all treatments contained similar amount of total soluble solid (TSS) between 8.0–8.9 °Brix (data not shown). Three individual sugars were identified and observed in strawberries: fructose, glucose and sucrose. Only fertilisation with nitrogen (66% and 33% RDN) increased the content of total sugar content (for 20%) in strawberries, the reason is that these fruits contained higher amounts of fructose and glucose, which are the main individual sugars present in strawberries (Figure 3). Four organic acids are present in traceable amounts in strawberries, malic and citric acids as main organic acids, and shikimic and fumaric smaller concentrations. We can see that only 66% RDN fertilised fruits had significantly more total organic acids, due to a higher content of malic acid in comparison to all other fertilised and control fruits (Figure 4).

3.3. Content of Selected Phenolic Compounds

We have identified 28 different phenolic compounds, which we divided into 5 phenolic groups: hydroxybenzoic acids (10), hydroxycinnamic acids (6), flavanols (3), flavonols (5), and anthocyanins (4). The group of hydroxycinnamic acids represented the largest proportion of all identified compounds (c. 39% of all identified compounds), followed by hydroxybenzoic acids (c. 23% of all identified compounds), anthocyanins (c. 19% of all identified compounds), flavanols (17% of all identified compounds) and flavonols (c. 1% of all identified compounds). The most abundant individual phenolic content was cinnamic acid 3-O-hexoside, representing more than 28% share off all phenolic compounds. In this study we recorded a significant influence of fertilisation on phenolics belonging to the groups of hydroxybenzoic and hydroxycinnamic acids (Table 2). We can see that fruits from plants fertilised with nano fertilizer Lithovit contained up to 20% more total phenolic compound than other fertilised and control fruits. This is mainly due to the fact that Lithovit caused an incrise of up to 23% of total hydroxycinnamic acids and up to 25% of total hydroxybenzoic acids content. There was no significant influence of fertilisation on the content of total anthocyanins, except for individual cyaniding-3-O-glucoside, which was significantly higher (for 60%) in control fruits, and total flavonols.

3.4. Content of Selected Aroma Volatile Compounds

All the analysed strawberry fruits contained 15 different aroma compounds, which were divided into 5 volatile groups: esters (6), terpenoids (3), alcohols (3), aldehydes (2) and ketones (1). Aldehydes represented the largest proportion of all identified volatile compounds in strawberry control fruits (c. 60% of all identified volatile compounds), followed by terpenoids (c. 19% of all identified volatile compounds), esters (c. 12% of all identified volatile compounds), alcohols (c. 6% of all identified volatile compounds) and ketones (c. 4% of all identified volatile compounds) (Table 3). Except for (Z)-2-hexen-1-ol, all individual and consequently groups of volatile compound showed significant differences between treatments. The aldehyde (E)-2-hexen-1-al was the most abundant individual volatile compound in strawberries, accounting for approximately 47% to 67% of all identified volatile compounds depending on the treatment. In this study, we recorded a significant influence of fertilisation on the content of hexanal and (E)-2-hexen-1-al. Table 3 shows significant up to 3.5-fold higher concentrations of both analysed aldehydes in N Ca fertilised strawberries compared to control or minimally fertilised fruits. Plants fertilised with nitrogen accumulated up to 1.7-fold and calcium 2.2-fold more esters than control and minimal N fertilised fruits. The methyl hexanoate content was 2.4-fold higher in calcium-treated plants and 1.7-fold in nitrogen-treated plants. We confirmed that fertilisation with nitrogen and calcium had a negative impact on ketone 2-heptanone content, since strawberries from fertilised plants accumulated up to 2.1-fold less 2-heptanone than the control plants. The pleasing fruity and flowery flavour of the control fruits can also be ascribed to higher 2-heptanone content. Of the terpenoids, significantly higher levels of nerolidol and α-terpineol were measured in control strawberries compared to those from fertilised treatments (1.4–1.8 fold). In addition, CA-CH treatment had a positive impact on the accumulation of geraniol, since treated fruits contained significantly higher amounts of this important terpene (1.7-fold) in comparison to nitrogen-fertilised and control plants.

4. Discussion

Nitrogen is an essential mineral for the plants to grow and produce high yield but is subjected to loss through nitrate leaching or denitrification. In Slovenian production technology, it is recommended to add nitrogen in small, required doses (100% RDN) at the beginning of strawberry vegetation and until the end of harvesting [9,10]. In present research the content of other important minerals (P and K), organic matter and pH in the soil was at an optimal level and this is why the data presented in this paper confirm that probably N fertilisation had caused presented changes.
We can see that fertilization with RDN had positive influence on total yield as it increased fruit number per plant without affecting the average fruit size. This is in accordance with the research of Iatrou and Papadopoulos [30]. A yield increase has been reported in several nitrogen-treated horticultural crops [31,32]. Kachwaya and Chanel [32] reported in their study that fertilisation provided a regular and adequate supply of irrigation water and nutrients that could contribute to more incremental growth of strawberry plants. Similar results were also observed by Martinsson et al. [33] and Singh et al. [17] when they investigated the effects of different fertilisers on the yield and quality of strawberry fruit. While nitrogen fertilisation has been shown to have a positive effect on strawberry yield, the same cannot be said for calcium fertilisation. Our results are in accordance with Wojcik et al. [34] who also could not prove any significant influence of calcium fertilisation on strawberry marketable fruit yield and berry weight.
Only fertilisation with nitrogen (66% and 33% RDN) had a statistically significant impact on the content of sugars and organic acids in strawberries. Our results are in accordance with findings of Kachwaya and Chandel [32] research on strawberries who assumed, that this might be due to the increased synthesis of primary metabolites as there was more nutrients uptake and to their translocation to the fruits. While Habibdzeh et al. [35] demonstrated, that chemical fertilizers produce the highest amount of nitrate in plant tissue, because of the direct release of nitrogen, plants requirements could be exceed when applied in higher doses (100% RDN).
Calcium treated strawberries were firmer than those picked from the fertilised plants. Since calcium serves as an intermolecular binging agent that stabilizes pectin–protein complexes of the middle lamella, there was no surprise that we confirmed the findings of other researchers [34,36]. Strawberries included in present study were the same variety; all fruits were harvested at the same maturity stage when fruits were fully red. As we monitored the colour parameters L*, a* and b*, we did not find any differences between fertilised and control fruits, which is similar to Agulheiro-Santos [37] findings. We confirmed these results with additional analyses of the anthocyanin content, showing the similarity in the content of major pigments in fruits.
Strawberries fertilised with Lithovit had the highest sum of all identified phenolic compounds, due to maximum values of two major groups of phenolic compounds hydroxybenzoic and hydroxycinnamic acids. Many researchers confirmed significantly positive influence on the growth and chemical compositions such as carbohydrates and phenolic content in different various crops such as lettuce [38], tomato [39] and soybean [40]. Lithovit increased content of hydroxycinnamic acids and flavanols in comparison to control treatment, while strawberries from Ca-chelate treatment had lower phenolic content than from Lithovit treatment. In addition, nitrogen fertilization did not significantly change the phenolic profile with the exception of total flavanols.
The typical aroma of strawberries comes not from just one or a few impactful aroma compounds, but from numerous volatiles present at certain concentrations and from the particular balance between them. Thus, strawberry aroma is the result of the combined perception of many aromatic constituents [21]. The volatile profile of strawberries was in line with recent research [41,42,43]. As reported by other authors, there are considerable differences in the volatility of different varieties of strawberry [43]. The ‘Clery’ variety selected for this study is highly valued for its flavour, which is similar to the ‘Gariguette’ variety, included in the study by Labmert et al. [41]. It is important to emphasize that aroma does not necessarily depend on the quantitative concentration of a volatile compound. Compounds that have highly significant concentrations may have no significance for aroma, and conversely, compounds that are only present in trace amounts may be the key components in the overall aroma profile [41]. On the other hand, it is necessary to understand that the concentration of certain flavours is an important factor in achieving flavour consistency and that a small change in concentration could alter certain flavour types [44]. The aldehyde (E)-2-hexen-1-al was the most abundant individual volatile compound in the strawberries. Hexanal and (E)-2-hexen-1-al are described as less pleasant green, leafy and grassy sensory notes typical of unripe fruits. They are present in higher concentrations in green fruits and decrease during ripening [45]. In this study, we recorded a significant influence of fertilisation on the content of hexanal and (E)-2-hexen-1-al. Many studies have demonstrated that aldehyde concentrations increased with increased N and Ca fertilisation [46]. Our results were also in agreement with Ojeda-Real et al. [3], who demonstrated higher hexanal and (E)-2-hexen-1-al content in strawberries fertilised with N in their research. The authors explained that the increase in the unpleasant aroma compound is due to a delay in maturation. However, in our case, we sampled only fully mature red fruits, and the aldehyde content did not decrease with maturation. Fertilisation could have affected enzyme lipoxygenase (LOX) activity or caused a change in the content of linoleic acid—hexanal precursor via the LOX pathway [47]. Fertilisation had a positive impact on aroma due to increased content of esters, which contribute to a pleasant aroma profile. Although over 360 compounds have been identified in the aroma of strawberries, primarily methyl and ethyl esters appear to contribute most to a pleasant strawberry aroma [48]. The increase in both aldehyde and ester content could be explained by the fact that aldehydes are derived directly from the lipoxygenase pathway (LOX)-derived fatty acids as mentioned above, and further serve as precursors in the formation of esters [44]. Ketone 2-heptanone, with its intense fruity and flowery flavour, has an important impact on strawberry aroma [41]. It is widely used as a fragrance in cosmetics and as a flavouring agent in foodstuffs. Ketone content is very important and contributes to the acceptance and likeability of certain strawberry cultivars. The chemical class of terpenes and alcohols in strawberries has been of particular interest, since these compounds, like ketones, provide the fruity and flowery fragrance [41] and are also known to exert biological activity against fungal and bacterial microorganisms [44]. Terpenoids, especially geraniol, α-terpineol and nerolidol, are responsible for the floral aroma and flavour of strawberries [49]. Nitrogen-fertilised fruits contained lower amounts of pleasant aromas (geraniol and α-terpineol) and consequently had a less pleasant flavour. It is possible that this might be one of the reasons why plants fertilised with N are more susceptible to infections [50]. In addition, calcium-treated fruits contained significantly higher amounts of these important terpenoids in comparison to nitrogen-fertilised plants. Moreover, a recent study has shown that terpenoids such as nerolidol have health benefits in terms of anti-inflammatory, antioxidant, antinociceptive, anticancer and anti-obesity properties [51,52]. Therefore, improving the natural aroma of food is also very important in relation to health benefits for consumers.

5. Conclusions

Strawberry producers, like other farmers, strive for a high yield and aim to offer high quality fruit to the market. Our findings show that fertilisation with N can significantly increase strawberry yield when applied in the required doses within a month before harvesting. Plants produce more fruit but the quality of fertilised fruit is affected. Fertilisation with nitrogen and bolt calcium significantly increased the content of both analysed aldehydes and changed the strawberry aroma by adding leafy notes. Fertilisation also had a negative impact on the desired fruity volatiles nerolidol and α-terpineol. On the other hand, nano-Ca fertilisation especially improved the content of fruity esters and increase the content of important phenolic compounds. In general, these results show that fertilisation with nitrogen increases yield, but can result in fruits with a leafy green flavour, less flowery and fruity notes, and consequently lower fruit aroma quality compared to the non-fertilised control or nano-fertilised strawberries.

Author Contributions

Conceptualization, N.C.W. and D.K.; methodology, N.C.W.; software, N.C.W.; validation, H.B.Č. and N.C.W.; formal analysis, N.C.W., J.J. and H.B.Č.; investigation, N.C.W. and J.J.; resources, M.H.; data curation, N.C.W. and J.J.; writing—original draft preparation, N.C.W.; writing—review and editing, D.K., R.V. and J.J.; visualization, N.C.W. All authors have read and agreed to the published version of the manuscript.

Funding

This research was financially supported by Slovenian Research Agency (grants P4-0133 Sustainable agriculture and P4-0013 Horticulture), by the Republic of Slovenia (Ministry of education, science, and sport) and the European Union from Structure and Investment funds (project “Raziskovalci-2.0-KIS-529016”, N.C.W. (C3330-17-529016).

Acknowledgments

The authors acknowledge the support of co-workers at the Agricultural Institute of Slovenia for their help, sharing of opinion and knowledge, and their important contribution to the first results. We would like to thank also our families and friends for the moral support.

Conflicts of Interest

All the authors declare that there is no conflict of interest. The funders had no role in the study’s design; in the collection, analyses, or interpretation of data; in the writing of the manuscript, or in the decision to publish the results.

References

  1. Civille, G.V.; Oftendal, K.N. Sensory evaluation techniques—Make “good for you” taste “good”. Physiol. Behav. 2021, 107, 598–605. [Google Scholar] [CrossRef]
  2. Weber, N.; Zupanc, V.; Jakopic, J.; Veberic, R.; Mikulic-Petkovsek, M.; Stampar, F. Influence of deficit irrigation on strawberry (Fragaria × ananassa Duch.) fruit quality. J. Sci. Food. Agric. 2016, 97, 1–9. [Google Scholar]
  3. Ojeda-Real, L.A.; Lobit, P.; Cárdenas-Navarro, R.; Grageda-Cabrera, O.; Farías-Rodríguez, R.; Valencia-Cantero, E.; Macías-Rodríguez, L. Effect of nitrogen fertilization on quality markers of strawberry (Fragaria × ananassa Duch. cv. Aromas). J. Sci. Food. Agric. 2009, 98, 935–939. [Google Scholar] [CrossRef]
  4. Reganold, J.P.; Andrews, P.K.; Reeve, J.R.; Carpenter-Boggs, L.; Schadt, C.W.; Alldredge, J.R.; Ross, C.F.; Davies, N.M.; Zhou, J. Fruit and Soil Quality of Organic and Conventional Strawberry Agroecosystems. PLoS ONE 2010, 5, e12346. [Google Scholar] [CrossRef]
  5. Ponti, T.; Rijk, B.; van Ittersum, K.M. The crop yield gap between organic and conventional agriculture. Agric. Syst. 2012, 108, 1–9. [Google Scholar] [CrossRef]
  6. Bhat, R.; Geppert, J.; Funken, E.; Stamminger, R. Consumers Perceptions and Preference for Strawberries—A Case Study from Germany. Int. J. Fruit. Sci. 2015, 15, 405–424. [Google Scholar] [CrossRef]
  7. Maffei, M.E. Sites of synthesis, biochemistry and functional role of plant volatiles. S. Afr. J. Bot. 2010, 76, 612–631. [Google Scholar] [CrossRef] [Green Version]
  8. Li, H.; Li, T.; Gordon, R.J.; Asiedu, S.; Hu, K. Strawberry plant fruiting ability and its correlation with solar irradiance, temperature and reflectance water index variation. Environ. Exp. Bot. 2010, 68, 165–174. [Google Scholar] [CrossRef]
  9. Ministry of Agriculture and the Environment. Tehnoloska Navodila za Integrirano Pridelavo Sadja: Leto 2017; Ministry of Agriculture and the Environment: Ljubljana, Slovenia, 2017; p. 42. [Google Scholar]
  10. Mihelič, R.; Čop, J.; Jakše, M.; Štampar, F.; Majer, D.; Tojnko, S.; Vršič, S. Smernice za strokovno utemeljeno gnojenje; Republika Slovenija: Ljubljana, Slovenia, 2010; pp. 39–40. [Google Scholar]
  11. Taghavi, T.; Folta, K. A comparison of wild and cultivated strawberries for nitrogen uptake and reduction. Hortic. Environ. Biotechnol. 2014, 55, 196–206. [Google Scholar] [CrossRef]
  12. Guinto, D.F. Nitrogen fertilisation effects on the quality of selected crops: A review. Agron. N. Z. 2016, 46, 121–132. [Google Scholar]
  13. Leghari, S.J.; Wahocho, N.A.; Laghari, G.M.; Laghari, A.H.; Bhabhan, G.M.; Talpur, K.H. Role of nitrogen for plant growth and development: A review. Adv. Environ. Biol. 2016, 10, 9. [Google Scholar]
  14. Mareike Jezek, M.; Zörb, O.C.; Merkt, N.; Geilfus, C.M. Anthocyanin Management in Fruits by fertilization. J. Agric. Food Chem. 2018, 66, 753–764. [Google Scholar] [CrossRef]
  15. Reddy, V.S.; Reddy, A.S.N. Proteomics of calcium-signaling components in plants. Phytochemistry 2004, 65, 1745–1776. [Google Scholar] [CrossRef] [PubMed]
  16. Bakshi, P.; Masoodi, F.A.; Chauhan, G.S.; Shah, T.A. Role of calcium in post-harvest life of temperate fruits: A review. J. Food Sci. Technol. 2005, 42, 1–8. [Google Scholar]
  17. Singh, S.; Singh, N.P.; Sharda, R.; Sangwan, A.K. Response of irrigation, fertigation and mulching on plant growth and fruit yield of strawberry. Indian J. Hortic. 2019, 76, 233–240. [Google Scholar] [CrossRef]
  18. Naderi, M.R.; Shahkari, A.D. Nanofertilizers and their roles in sustainable agriculture. Int. J. Agric. Crops Sci. 2013, 19, 2229–2232. [Google Scholar]
  19. Emara, M.A.A.; Hamoda, S.A.F.; Hamad, M.M.A. Effect of Nano-Fertilizer and N-Fertilization Levels on Productivity of Egyptian Cotton under Different Sowing Dates. Egypt. J. Agron. 2018, 40, 125–137. [Google Scholar]
  20. Farock, R.L.; Hu, J.; Meyers, R.M.; Ho, Y.J.; Kii, E.; Alt, F.W. Genome-wide detection of DNA double-stranded breaks induced by engineered nucleases. Nat. Biotechnol. 2015, 33, 179–186. [Google Scholar] [CrossRef]
  21. Jetti, R.R.; Kurnianta, A.; Yang, E.; Finn, C. Quantification of Selected Aroma-Active Compounds in Strawberries by Headspace Solid-Phase Microextraction Gas Chromatography and Correlation with Sensory Descriptive Analysis. J. Food Sci. 2007, 72, 487–496. [Google Scholar] [CrossRef]
  22. Goff, S.S.; Klee, H.J. Plant Volatile Compounds: Sensory Cues for Health and Nutritional Value? Science 2006, 311, 815–819. [Google Scholar] [CrossRef]
  23. Ménager, I.; Jost, M.; Aubert, C. Changes in Physicochemical Characteristics and Volatile Constituents of Strawberry (Cv. Cigaline) during Maturation. J. Agric. Food Chem. 2004, 52, 1248–1254. [Google Scholar] [CrossRef]
  24. Giampieri, F.; Tulipani, S.; Alvarez-Suarez, J.M.; Quiles, J.L.; Mezzetti, B.; Battino, M. The strawberry: Composition, nutritional quality, and impact on human health. Nutrition 2012, 28, 9–19. [Google Scholar] [CrossRef] [PubMed]
  25. Anttonen, M.J.; Hoppula, K.I.; Nestby, R.; Verheul, J.M.; Karjalainen, R.O. Influence of Fertilization, Mulch Color, Early Forcing, Fruit Order, Planting Date, Shading, Growing Environment, and Genotype on the Contents of Selected Phenolics in (Strawberry (Fragaria × ananassa Duch.) Fruits. J. Agric. Food Chem. 2006, 54, 2614–2620. [Google Scholar] [CrossRef] [PubMed]
  26. Meier, U.; Graf, M.; Hess, M.; Kennel, B.; Klose, R.; Mappes, D.; Seipp, D.; Strauss, R.; Streif, J.; van den Boom, T. Phanologische Entwicklungsstadien de Kernobstes Malus domestic Borkh. UND Pyrus communis L., des Steinobstes Prunus-Arten, der Johannisbeere currant-Arten UND der delivery Fragaria × ananassa duch with. Nachrichtenbl. Deut. Pflanzenschutzd. 1994, 46, 141–153. [Google Scholar]
  27. Tomić, J.; Štampar, F.; Glišić, I.; Jakopič, J. Phytochemical assessment of plum (Prunus domestica L.) cultivars selected in Serbia. Food Chem. 2019, 299, 125113. [Google Scholar] [CrossRef] [PubMed]
  28. Alder, L.; Hill, A.; Holland, P.T.; Lantos, J.; Lee, S.M.; MacNeil, J.D.; O’Rangers, J.; van Zoonen, P.; Ambrus, A. Guidelines for single-laboratory validation of analytical methods for trace-level concentrations of organic chemicals. In Principles and Practices of Method Validation; Fajgelj, A., Ambrus, A., Eds.; RSC Publishing: Cambridge, UK, 2000; pp. 179–252. [Google Scholar]
  29. ISO 5725: Accuracy (Trueness and Precision) of Measurement Methods and Results—Part 2. Basic Method for the Determination of Repeatability and Reproducibility of a Standard Measurement Method; ISO: Geneva, Switzerland, 1994; pp. 1–42.
  30. Iatrou, M.; Papadopoulos, A. Influence of nitrogen nutrition on yield and growth of an everbearing strawberry cultivar (cv. Evie II). J. Plant Nutr. 2016, 39, 1499–1505. [Google Scholar] [CrossRef]
  31. Medeiros, R.F.; Pereira, W.E.; Rodrigues, R.M.; Nascimento, R.; Suassuna, J.F.; Dantas, T.A.G. Growth and yield of strawberry plants fertilized with nitrogen and phosphorus. Rev. Bras. Eng. Agríc. Ambient. 2015, 9, 865–870. [Google Scholar] [CrossRef] [Green Version]
  32. Kachwaya, D.S.; Chandel, J.S.; Ghumare, V.; Khachi, B. Effect of drip and furrow irrigation on yield and physiological performance of strawberry (Fragaria × ananassa Duch.) cv. Chandler. Indian J. Plant Physiol. 2016, 21, 341–344. [Google Scholar] [CrossRef]
  33. Martinsson, M.; Kwast, A.; Cieslinski, G.; Treder, W. Impact of production systems and fertilizer application on yield and quality of strawberries. Acta Hortic. 2006, 708, 59–64. [Google Scholar] [CrossRef]
  34. Wojcik, P.; Lewandowski, A. Effect of Calcium and Boron Sprays on Yield and Quality of “Elsanta” Strawberry. J. Plant. Nutr. 2003, 26, 671–682. [Google Scholar] [CrossRef]
  35. Habibdzeh, F.; Hazrati, D.; Gholamhoseini, M.; Khodaei, D.; Habashi, D. Evaluation of quantitative and qualitative characteristics of strawberry in response to bio- and chemical fertilizers. Gesunde Pflanz. 2019, 71, 103–111. [Google Scholar]
  36. Kuchay, M.A.; Mallikarjuna, K.; Ali, M.T. Effect of foliar sprays of nitrogen and calcium on fruit quality attributes, yield and leaf nutrient content of apple. Int. J. Pure Appl. Biosci. 2018, 6, 970–977. [Google Scholar] [CrossRef]
  37. Agulheiro-Santos, A.C. Quality of strawberry ‘camarosa’ with different levels of nitrogen fertilization. Acta Hortic. 2009, 842, 207–210. [Google Scholar] [CrossRef]
  38. Abdel, N.H.M.A.; Dawa, K.K.; El-Gamily, E.I.; Imryed, Y.F.E. Effect of magnetic water, foliar application with nano material and nitrogen levels on productivity and quality of head lettuce. Int. J. Adv. Res. Biol. Sci. 2017, 4, 171–181. [Google Scholar]
  39. Moisă, R.; Berar, V. Study of the effect of several natural fertilizers on the seedlings leaf area for some tomato cultivars. J. Hortic. For. Biotechnol. 2015, 19, 77–81. [Google Scholar]
  40. Abd-El-Aal, M.M. Improvement of Tomato Productivity by Using Certain Natural Materials. Ph.D. Thesis, Faculty of Agriculture, Benha University, Governorate, Egypt, 2009. [Google Scholar]
  41. Lambert, Y.; Demazeau, G.; Largeteau, A.; Bouvier, J.M. Changes in aromatic volatile composition of strawberry after high pressure treatment. Food Chem. 1999, 67, 7–16. [Google Scholar] [CrossRef]
  42. Cheng, X.H.; Feng, X.X.; Zhang, Z.P.; Shen, M.; Wang, L. Effects of “Al strong” amino-acid fertilizer on photosynthetic efficiency and yield of strawberry in plastic tunnels. Int. J. Fruit Sci. 2012, 29, 883–889. [Google Scholar]
  43. Dong, J.; Zhang, Y.; Tang, X.; Jin, W. Differences in volatile ester composition between Fragaria × ananassa and F. vesca and implications for strawberry aroma patterns. Sci. Hortic. 2013, 150, 47–53. [Google Scholar] [CrossRef]
  44. Rohloff, J. Impact of Agricultural and Environmental Factors on Strawberry (Fragaria × ananassa Duch.) Aroma—A Review. Eur. J. Plant Sci. Biotechnol. 2011, 5, 17–34. [Google Scholar]
  45. Forney, C.F.; Jordan, M.A.; Kalt, W. The Composition of Strawberry Aroma Is Influenced by Cultivar, Maturity, and Storage. Hortscience 2000, 35, 1022–1026. [Google Scholar] [CrossRef] [Green Version]
  46. Cesare, D.L.F.; Migliori, C.; Viscardi, D.; Parisi, M. Quality of tomato fertilized with nitrogen and phosphorous. Ital. J. Food Sci. 2010, 22, 186–191. [Google Scholar]
  47. Márczy, J.S.; Németh, A.S.; Samu, Z.; Hager-Veress, A.; Szajani, B. Production of hexanal from hydrolyzed sunflower oil by lipoxygenase and hydroperoxid lyase enzymes. Biotechnol. Lett. 2002, 24, 1673–1675. [Google Scholar] [CrossRef]
  48. Zabetakis, I.; Holden, M.A. Strawberry Flavour: Analysis and Biosynthesis. J. Sci. Food Agric. 1997, 74, 421–434. [Google Scholar] [CrossRef]
  49. Zhou, Y.; Liu, X.; Yang, Z. Characterization of Terpene Synthase from Tea Green Leafhopper Being Involved in Formation of Geraniol in Tea (Camellia sinensis) Leaves and Potential Effect of Geraniol on Insect-Derived Endobacteria. Biomolecules 2019, 9, 808. [Google Scholar] [CrossRef] [PubMed] [Green Version]
  50. Liu, X.; Lyu, S.; Sun, D.; Corey, J.; Bradshaw, A.; Zhou, S. Species decline under nitrogen fertilization increases community-level competence of fungal diseases. Proc. Biol. Sci. 2017, 248, 1847. [Google Scholar] [CrossRef] [PubMed] [Green Version]
  51. Saito, A.Y.; Rodriguez, A.A.M.; Vega, D.S.M.; Sussmann, R.A.C.; Kimura, E.A.; Katzin, A.M. Antimalarial activity of the terpene nerolidol. Int. J. Antimicrob. Agents 2016, 48, 641–646. [Google Scholar] [CrossRef]
  52. Montesano, D.; Rocchetti, G.; Putnik, P.; Lucini, L. Bioactive profile of pumpkin: An overview on terpenoids and their health-promoting properties. Curr. Opin. Food Sci. 2018, 22, 81–87. [Google Scholar] [CrossRef]
Figure 1. Strawberry yield and average number of fruits per plant following six treatments (33%, 66% and 100% of RDN, CA-CH, LITH and CON). Average means (n = 10) ± standard errors are shown. Different letters between treatments denote significant differences (Tukey test, p < 0.05). RDN—recommended dose of nitrogen; CA-CH—calcium chelate; LITH—Lithovit; CON—control.
Agronomy 11 00997 g001
Figure 2. Firmness of strawberry fruits following six treatments (33%, 66% and 100% RDN, CA-CH, LITH and CON). Average means (n = 10) ± standard errors are shown. Different letters between treatments denote significant differences (Tukey test, p < 0.05). RDN—recommended dose of nitrogen; CA-CH—calcium chelate; LITH—Lithovit; CON—control.
Agronomy 11 00997 g002
Figure 3. Strawberry sugar content following six treatments (33%, 66% and 100% RDN, CA-CH, LITH and CON). Average means (n = 10) ± standard errors are shown. Different letters between treatments denote significant differences (Tukey test, p < 0.05). RDN—recommended dose of nitrogen; CA-CH—calcium chelate; LITH—Lithovit; CON—control.
Agronomy 11 00997 g003
Figure 4. Strawberry organic acids content following six treatments (33%, 66% and 100% RDN, CA-CH, LITH and CON). Average means (n = 10) ± standard errors are shown. Different letters between treatments denote significant differences (Tukey test, p < 0.05). RDN—recommended dose of nitrogen; CA-CH—calcium chelate; LITH—Lithovit; CON—control.
Agronomy 11 00997 g004
Table 1. Validation parameters for GC-MS determination.
Active CompoundIons Scanned (m/z)Linearity Range R2LODLOQ Standard Addition (µg/kg)Recovery RSD Ur Ur UR UR
T, Q1, Q2, Q3(µg/kg)(µg/kg)(µg/kg)(%)(%)(µg/kg)(%)(µg/kg)(%)
1-Penten-3-ol57, 58, 55, 851.5–74.00.9970.4451.579786.13.89511.918222.8
2-Heptanone58, 59, 1140.414–219.60.9750.1240.4148989.93.589.01213.5
α-terpineol59, 121, 1360.377–187.00.9990.1130.377403104.82.3246.0297.2
cis-2-Hexen-1-ol57, 82, 674.2–1041.90.9681.254.242392.25.24610.96515.4
Ethyl-2-methylbutyrate102, 74, 870.039–15.60.9950.0120.0394284.35.224.849.5
Ethyl-isovalerate88, 85, 600.039–16.70.9930.0120.0394582.85.236.7511.1
Geraniol69, 68, 93, 1230.759–194.00.9790.2280.7597981.020.8911.41113.9
Hexanal56, 72, 8239.7–1988.20.95911.939.780781.85.39211.411714.5
Methyl hexanoate74, 87, 1011.4–567.50.9900.4251.4152887.15.9775.01258.2
Methyl octanoate74, 87, 1270.416–208.50.9940.1250.41644988.39.9429.44510.0
Methyl-2-methylbutyrate88, 57, 1010.078–15.50.9910.0230.0788480.04.689.51113.1
Nerolidol69, 93, 1071.5–764.00.9340.461.5164687.632.964239.068441.6
Octyl acetate70, 84, 1122.0–995.60.9930.62.040489.38.54711.64912.1
trans-2-Hexen-1-al55, 69, 8328.8–14407.20.9998.728.841887.16.98720.89522.7
trans-2-Hexen-1-ol57, 82, 6719.7–986.20.9605.919.740080.33.6348.56315.8
LOD = Limit of detection, LOQ = Limit of quantification, Ur = Uncertainty of repeatability, UR = Uncertainty of reproducibility.
Table 2. Content of individual phenolic compounds in strawberries subjected to six treatments (CON, 33%, 66% and 100% RDN, CA-CH and LITH).
Phenolic CompoundCON33% RDN66% RDN100% RDNCA-CHLITHp
bis-HHDP-glucose92.43±8.17ab88.38±5.31ab84.45±8.71ab101.16±11.01bc80.75±3.66a112.71±12.48c*
ellagic acid deoxyhexoside11.66±0.56b10.46±0.81ab9.14±1.01a11.71±1.03b11.75±1.21b11.86±1.14b*
ellagic acid hexoside 17.61±0.73 8.11±0.88 7.59±1.07 8.14±0.88 7.34±1.13 8.28±1.11 ns
ellagic acid hexoside 227.39±2.46b22.99±2.31a19.77±2.36a26.49±1.69b29.52±2.14b29.01±1.78b***
ellagic acid pentoside1.41±0.19ab1.09±0.21a1.37±0.20a1.87±0.49bc1.53±0.17abc2.00±0.45c**
galloyl bisHHDP glucose0.62±0.01bc0.45±0.03a0.53±0.04ab0.67±0.01bc0.57±0.06ab0.75±0.01c**
galloyl-diHHDP-glucose2.79±0.26b1.80±0.08a2.59±0.23ab3.12±0.27b2.78±0.26b3.46±0.54b*
HHDP galloyl hexoside62.92±2.43ab65.78±5.27bc58.21±8.54a68.94±6.45bc67.93±2.52bc73.32±5.21c**
HHDP galloyl glucose 12.01±0.13ab1.81±0.13a1.89±0.15a2.33±0.29bc2.01±0.21ab2.48±0.22c*
HHDP galloyl glucose 21.15±0.14abc1.04±0.12a1.12±0.11ab1.36±0.10bc1.21±0.06abc1.39±0.14c*
Sum hydroxybenzoic acids207.01±11.91ab190.08±12.70a187.28±17.15a227.20±18.76bc197.91±31.07ab247.27±21.41c**
caffeic acid hexoside5.49±0.58ab5.13±0.53a5.74±0.47ab6.31±0.39ab5.78±0.32ab6.45±0.52b*
cinnamic acid 3-O-hexoside226.84±50.98 241.07±47.81 226.09±56.51 265.67±32.71 216.22±35.12 294.86±40.69 ns
ferulic acid derivative0.20±0.05bc0.18±0.05a0.20±0.04ab0.18±0.02c0.18±0.06bc0.23±0.06c**
ferulic acid hexoside derivative4.06±0.46 2.72±0.27 3.39±0.54 4.76±0.37 3.92±0.07 4.82±0.27 ns
p-coumaroyl hexose25.80±1.00a26.13±2.81a23.87±2.50a27.87±2.13ab26.22±2.41a30.88±3.41b*
p-coumaroyl hexoside1.27±0.28b0.82±0.04a1.18±0.14ab1.42±0.18b1.26±0.32b1.57±0.14b*
Sum hydroxycinnamic acids324.03±30.58a356.44±31.45ab339.41±41.57a371.86±32.31ab335.63±25.65a405.79±41.23b*
catechin50.27±1.94ab49.36±4.81ab46.51±3.82a55.09±5.15ab51.08±5.65ab60.18±6.05b*
procyanidin dimer64.91±6.21ab56.27±5.54a62.17±2.04a72.68±7.33b61.07±4.42a71.63±3.42b*
propelagonidin dimer40.38±4.00ab32.73±4.04a38.23±3.24a50.15±5.56b41.06±4.25ab49.32±4.00b**
Sum flavanols155.57±11.51a138.36±17.79a146.92±13.42a177.92±20.48b153.22±18.18a181.14±9.89b**
quercetine-3-O-hexoside2.24±0.25 2.31±0.53 2.16±0.37 2.49±0.35 2.42±0.13 2.43±0.25 ns
quercetine-3-O-glucuronide4.82±1.35 6.13±2.25 4.93±2.72 5.76±1.06 5.37±1.95 5.07±1.53 ns
kaempferol-3-glucuronide1.72±0.26 2.03±0.27 1.73±0.34 1.94±0.22 1.77±0.29 1.83±0.21 ns
kaempferol-3-O-acetylglucoside2.65±0.28 2.43±0.50 2.30±0.44 2.73±0.16 2.34±0.44 2.74±0.30 ns
kaempferol-3-O-hexoside1.22±0.12 1.22±0.26 1.18±0.21 1.30±0.04 1.19±0.19 1.39±0.17 ns
Sum flavonols12.45±2.07 14.13±3.19 12.31±3.74 14.23±0.94 13.08±2.76 13.47±1.48 ns
pelargonidin-malonyl-glucoside48.41±14.33 46.32±8.01 42.98±10.48 49.57±7.82 48.68±9.15 46.93±5.79 ns
pelargodnidin-3-O-rutinoside11.11±3.78 10.47±2.05 9.81±1.74 10.37±1.58 10.60±2.28 8.10±0.71 ns
pelargonidin-3-O-glucoside127.80±29.07 127.58±28.76 120.13±27.06 128.01±11.32 130.39±29.07 135.39±10.89 ns
cyanidin-3-O-glucoside9.48±0.23c3.91±0.37a5.82±0.56ab7.17±0.48bc8.28±0.88c4.94±0.46ab***
Sum anthocyanins198.57±46.20 189.49±35.91 178.67±36.27 194.53±16.82 198.57±40.44 195.77±16.19 ns
*, **, ***: Average means (n = 10) ± standard errors (µg/g FW) and p-values indicating statistically significant differences between treatments (ns—not significant) are shown. Different letters between treatments denote significant differences (Tukey test, p < 0.05). RDN—recommended dose of nitrogen; CA-CH—calcium chelate; LITH—Lithovit; CON—control.
Table 3. Content of individual volatile compounds in strawberries subjected to six treatments (CON, 33%, 66% and 100% RDN, CA-CH and LITH).
Volatile CompoundCON 33% RDN 66% RDN 100% RDN CA-CH LITH p
ALDEHYDES1187.35±89.36a1801.76±107.7a4252.77±277.31c2825.73±109.76b3064.31±214.78b2871.51±41.78b***
hexanal220.62 a±28.06a344.84±64.46a827.07±112.43c551.52 ±60.62b588.58±96.85b557.20 ±60.66b***
(E)-2-hexen-1-al 966.03±87.73a1457.89±319.88a3425.61 ±316.53c2274.55 ±225.63b2476.02±278.36b2314.69 ±212.95b***
KETONE76.07±3.31d45.43±1.32b36.26±3.72a53.91±6.24b50.53±1.38b64.15±8.61c***
2-heptanone76.07±3.31d45.43 ±1.32b36.26 ±3.72a53.91 ±6.24b50.53 ±1.38b64.15 ±8.61c***
ALCOHOLS137.42±12.47bc139.74±12.61bc143.32±14.43bc110.74±10.21b112.36±9.74b99.74±8.74a*
(E)-2-hexen-1-ol102.35±5.49bc94.92 b±8.34b111.79 ±6.14c79.26 ±1.87a94.59 ±2.43b73.26 ±4.92a***
(Z)-2-hexen-1-ol20.20±3.91 26.82±2.01 19.47 ±2.86 19.54 ±7.75 16.13 ±4.78 18.81 ±4.28 ns
1-penten-3-ol15.23±0.86bc17.53±0.63c11.12 ±0.32b12.10 ±1.40b11.37 ±4.66b7.49 ±0.38a**
ESTERS255.41±27.46a259.18±17.46a442.41±14.43b423.42±23.64b577.31±41.67c561.29±47.41c**
octyl acetate43.23±3.83b32.61 ±1.84a68.32 ±8.15d55.70 ±2.27c55.39 ±6.23c54.25 ±6.44c***
methyl-2-methyl butyrate4.41 ±0.98a3.92 ±0.31a20.20 ±2.03c8.48 ±3.03b11.02 ±2.18b11.80 ±0.41b***
methyl hexanoate196.01 ±33.20a209.25 ±3.71a333.99 ±18.49b340.72 ±73.22b469.19 ±6.48c466.62 ±58.20c***
ethyl-2-methyl butyrate0.53 ±0.13a0.27 ±0.01a1.22 ±0.34b0.55 ±0.17a0.48 ±0.05a0.97 ±0.09b***
ethyl isovalerate1.05 ±0.24ab0.55 ±0.03a1.86 ±0.73c1.19 ±0.42abc1.24 ±0.20abc1.56 ±0.26bc*
methyl octanoate10.62 ±1.10a11.48 ±0.89a17.67 ±1.79b18.21±1.17b30.26 ±3.85c27.34 ±0.28c***
TERPENOIDS393.31±17.98c266.74±21.87b228.42±24.47a262.41±13.47b216.74±12.97a270.74±24.96b**
nerolidol239.84 ±15.05d133.00 ±18.46ab141.17 ±14.69ab176.41 ±29.04c105.65 ±4.29a151.91 ±8.55bc***
geraniol21.72 ±1.55ab23.84 ±2.72b17.87 ±1.72a20.85 ±1.94ab28.91±1.96c26.74 ±3.86bc**
α-Terpineol132.29 ±8.02d110.15 ±23.30c68.47 ±4.41a65.42±1.45a83.03 ±17.51ab93.43 ±2.48b***
*, **, ***: Average means (n = 10) ± standard errors (µg/g FW) and p-values indicating statistically significant differences between treatments (ns—not significant) are shown. Different letters between treatments denote significant differences (Tukey test, p < 0.05). RDN—recommended dose of nitrogen; CA-CH—calcium chelate; LITH—Lithovit; CON—control.
Publisher’s Note: MDPI stays neutral with regard to jurisdictional claims in published maps and institutional affiliations.

