Article

A Novel Pinkish-White Flower Color Variant Is Caused by a New Allele of Flower Color Gene W1 in Wild Soybean (Glycine soja)

1
Department of Applied Biosciences, Kyungpook National University, Daegu 41566, Korea
2
Department of Plant Breeding, Swedish University of Agricultural Sciences, 23053 Alnarp, Sweden
3
Department of Agriculture, Forestry and Bioresources, Seoul National University, Seoul 08826, Korea
*
Author to whom correspondence should be addressed.
These authors contributed equally to this work.
Submission received: 4 April 2021 / Revised: 12 May 2021 / Accepted: 14 May 2021 / Published: 18 May 2021
(This article belongs to the Section Crop Breeding and Genetics)

Abstract

:
The enzyme flavonoid 3′,5′-hydroxylase (F3′5′H) plays an important role in producing anthocyanin pigments in soybean. Loss of function of the W1 locus encoding F3′5′H always produces white flowers. However, few color variations have been reported in wild soybean. In the present study, we isolated a new color variant of wild soybean accession (IT261811) with pinkish-white flowers. We found that the flower’s pinkish-white color is caused by w1-s3, a single recessive allele of W1. The SNP detected in the mutant caused amino acid substitution (A304S) in a highly conserved SRS4 domain of F3′5′H proteins. On the basis of the results of the protein variation effect analyzer (PROVEAN) tool, we suggest that this mutation may lead to hypofunctional F3′5′H activity rather than non-functional activity, which thereby results in its pinkish-white color.

1. Introduction

In plants, flavonoid 3′, 5′-hydroxylase (F3′5′H) is one of the key enzymes responsible for the blue and/or purple coloration in flower petals [1]. F3′5′H, together with dihydroflavonol 4-reductase (DFR), generally synthesize delphinidin-based anthocyanin pigments through the flavonoid biosynthesis pathway [2]. However, F3′5′H enzymes are absent in several ornamental plants, such as rose (Rosa hybrid) and carnation (Dianthus caryophyllus). These ornamental plants only contain cyanidin and/or pelargonidin pigments, and therefore only have pink, yellow, and red as their natural colors but not purple or blue [3]. F3′5′H is a cytochrome P450, which hydroxylates the naringenin or dihydrokaempferol biomolecules at the 3′ and 5′ positions of the β ring to synthesize the delphinidin-based anthocyanin pigments [4,5]. The loss of function mutations in the F3′5′H gene subsequently affects the production of delphinidin-based anthocyanin and results in flower color variations from blue to pink in several ornamental plants, for instance, petunia (Petunia hybrida) and gentian (Gentiana scabra) [6,7,8]. In leguminous crops, such as pea (Pisum sativum), lack of functional F3′5′H enzyme results in rose-pink flower petals [3]. In contrast, soybean (G. max) showed that the variations in the F3′5′H gene produced white flowers rather than color variations, such as pink flowers, which were observed in other plant species [3]. In addition, under W1 allelic background, the DFR-encoding genes, namely, W3 (DFR1) and W4 (DFR2), are epistatic to each other. Double mutations in these DFRs, i.e., w3 w4, cause near-white flowers in soybean [9].
In soybean, the W1 locus encoding F3′5′H displays purple and white flower colors for its dominant and recessive alleles, respectively [10]. The white flower color observed in the common soybean cultivar, “Williams 82”, is caused by the 65-bp insertion and 12-bp deletion in the F3′5′H coding region, consequently resulting in premature translation [11,12]. We previously reported that F3′5′H sequences from 99 landraces with white flowers were identical to that of “Williams 82” cultivar [13]. However, most of the wild soybean accessions (G. soja) have purple flowers and lack color variations among them, except for a few varieties that have been reported in the past two decades [14]. A white flower wild soybean accession, PI 424008C, was isolated from the progenies of the purple-flowered PI 424008A. Genetic analysis showed that the white color flower was caused by a mutation in the W1 locus [15].
In another study, we isolated two G. soja accessions (CW13381 and CW12700) with white flowers [16]. Genomic analysis of the W1 gene of CW13381 revealed the presence of an indel (≈90-bp AT-repeat) in the second intron, whereas the CW12700 mutant had a unique single-nucleotide substitution that subsequently resulted in amino acid change (N300K) in the substrate recognition site (SRS) 4 of F3′5′H [16]. Another wild soybean accession (B00146) was found as a single plant with purple and white variegated flowers (B00146-m) [17]. From the progeny of B00146-m, the lines with white (B00146-w) and purple (B00146-r) flowers were developed. The w1-m allele of B00146-m showed the insertion of the Tgs1 transposon (CACTA family) in the first exon. Taken together, the loss of function of F3′5′H in soybean always halts anthocyanin production, consequently resulting in white color flowers [16]. Apart from the aforementioned white color variants, a light-purple-colored G. soja variant (B09121) has been reported with a new w1-lp allele [18]. A unique single-base substitution in the nucleotide position 653 of w1-lp mutant led to a noteworthy amino acid change (V210M). Flavonoid analysis showed that the w1-lp mutant had a scarce number of major anthocyanins commonly detected in purple flowers. However, there was no difference in the transcription level between the alleles of w1-lp and W1. On the basis of their results, the authors suggested that an SNP mutation in the F3′5′H gene may lead to reduced F3′5′H enzymatic activity [18].
In this study, we isolated a new color variation of a wild soybean accession (IT261811) with pinkish-white flowers. The objective of the present study was to determine the genetic basis of the new wild soybean variant with pinkish-white flower color and its allelic component that influences anthocyanin biosynthesis.

2. Materials and Methods

2.1. Plant Material

A wild soybean accession (IT261811) with pinkish-white flowers was obtained from the National Agrobiodiversity Center, Korea. Another wild soybean accession (IT182932) with purple flowers was used as the wild-type accession in the present study (Figure 1). F2 individuals derived from the cross between IT261811 and IT182932 were used for the segregation analysis. F2 progenies with two parental lines were grown in the experimental fields of Kyungpook National University (Gunwi, 36°07′ N, 128°38′ E, Korea).

2.2. RT-PCR and Sequence Analysis

RT-PCR analysis was performed using the first-strand cDNA method to determine the transcript levels of F3′5′H (W1) and DFR2 (W4). The soybean Actin 1 gene (GmActin; Glyma.19G000900.1) was used as a loading control [19]. The PCR reactions were performed using primer pairs for respective genes described in Sundaramoorthy et al. [16]. Exons and introns of W1 (Glyma.13G072100) and W4 (Glyma.17G252200) were amplified using the primer pairs previously described in Park et al. [20]. PCR products were sequenced (SolGent, Daejeon, Korea) using the same primer pairs used in the aforementioned amplification procedure.

2.3. Multiple Alignment Analysis of W1 Proteins

The F3′5′H protein sequences from 14 different plant species were obtained from the National Center for Biotechnology Information Conserved Domains Database (NCBI-CDD, https://0-www-ncbi-nlm-nih-gov.brum.beds.ac.uk/Structure/cdd/cdd.shtml; accessed on 10 January 2021) and used to perform multiple sequence alignment using the ClustalW analysis tool (http://www.genome.jp/tools-bin/clustalw; accessed on 10 January 2021).

2.4. Prediction by Protein Variation Effect Analyzer (PROVEAN)

To estimate the impact of non-synonymous SNPs causing amino acid sequence changes in the W1 proteins, we used the online server PROVEAN (http://provean.jcvi.org/; accessed on 12 January 2021). Each amino acid substitution was given as input and the PROVEAN score was calculated [21,22].

2.5. SNP-Based Genetic Analysis

To study the phenomenon of segregation, cleaved amplified polymorphic sequence (CAPS) was developed to detect a single-base substitution in IT261811. PCR amplification was performed according to the procedure previously described by Park et al. [20]. Digestion of the PCR-amplified products were performed using DdeI (Enzynomics, Daejeon, Korea).

3. Results and Discussion

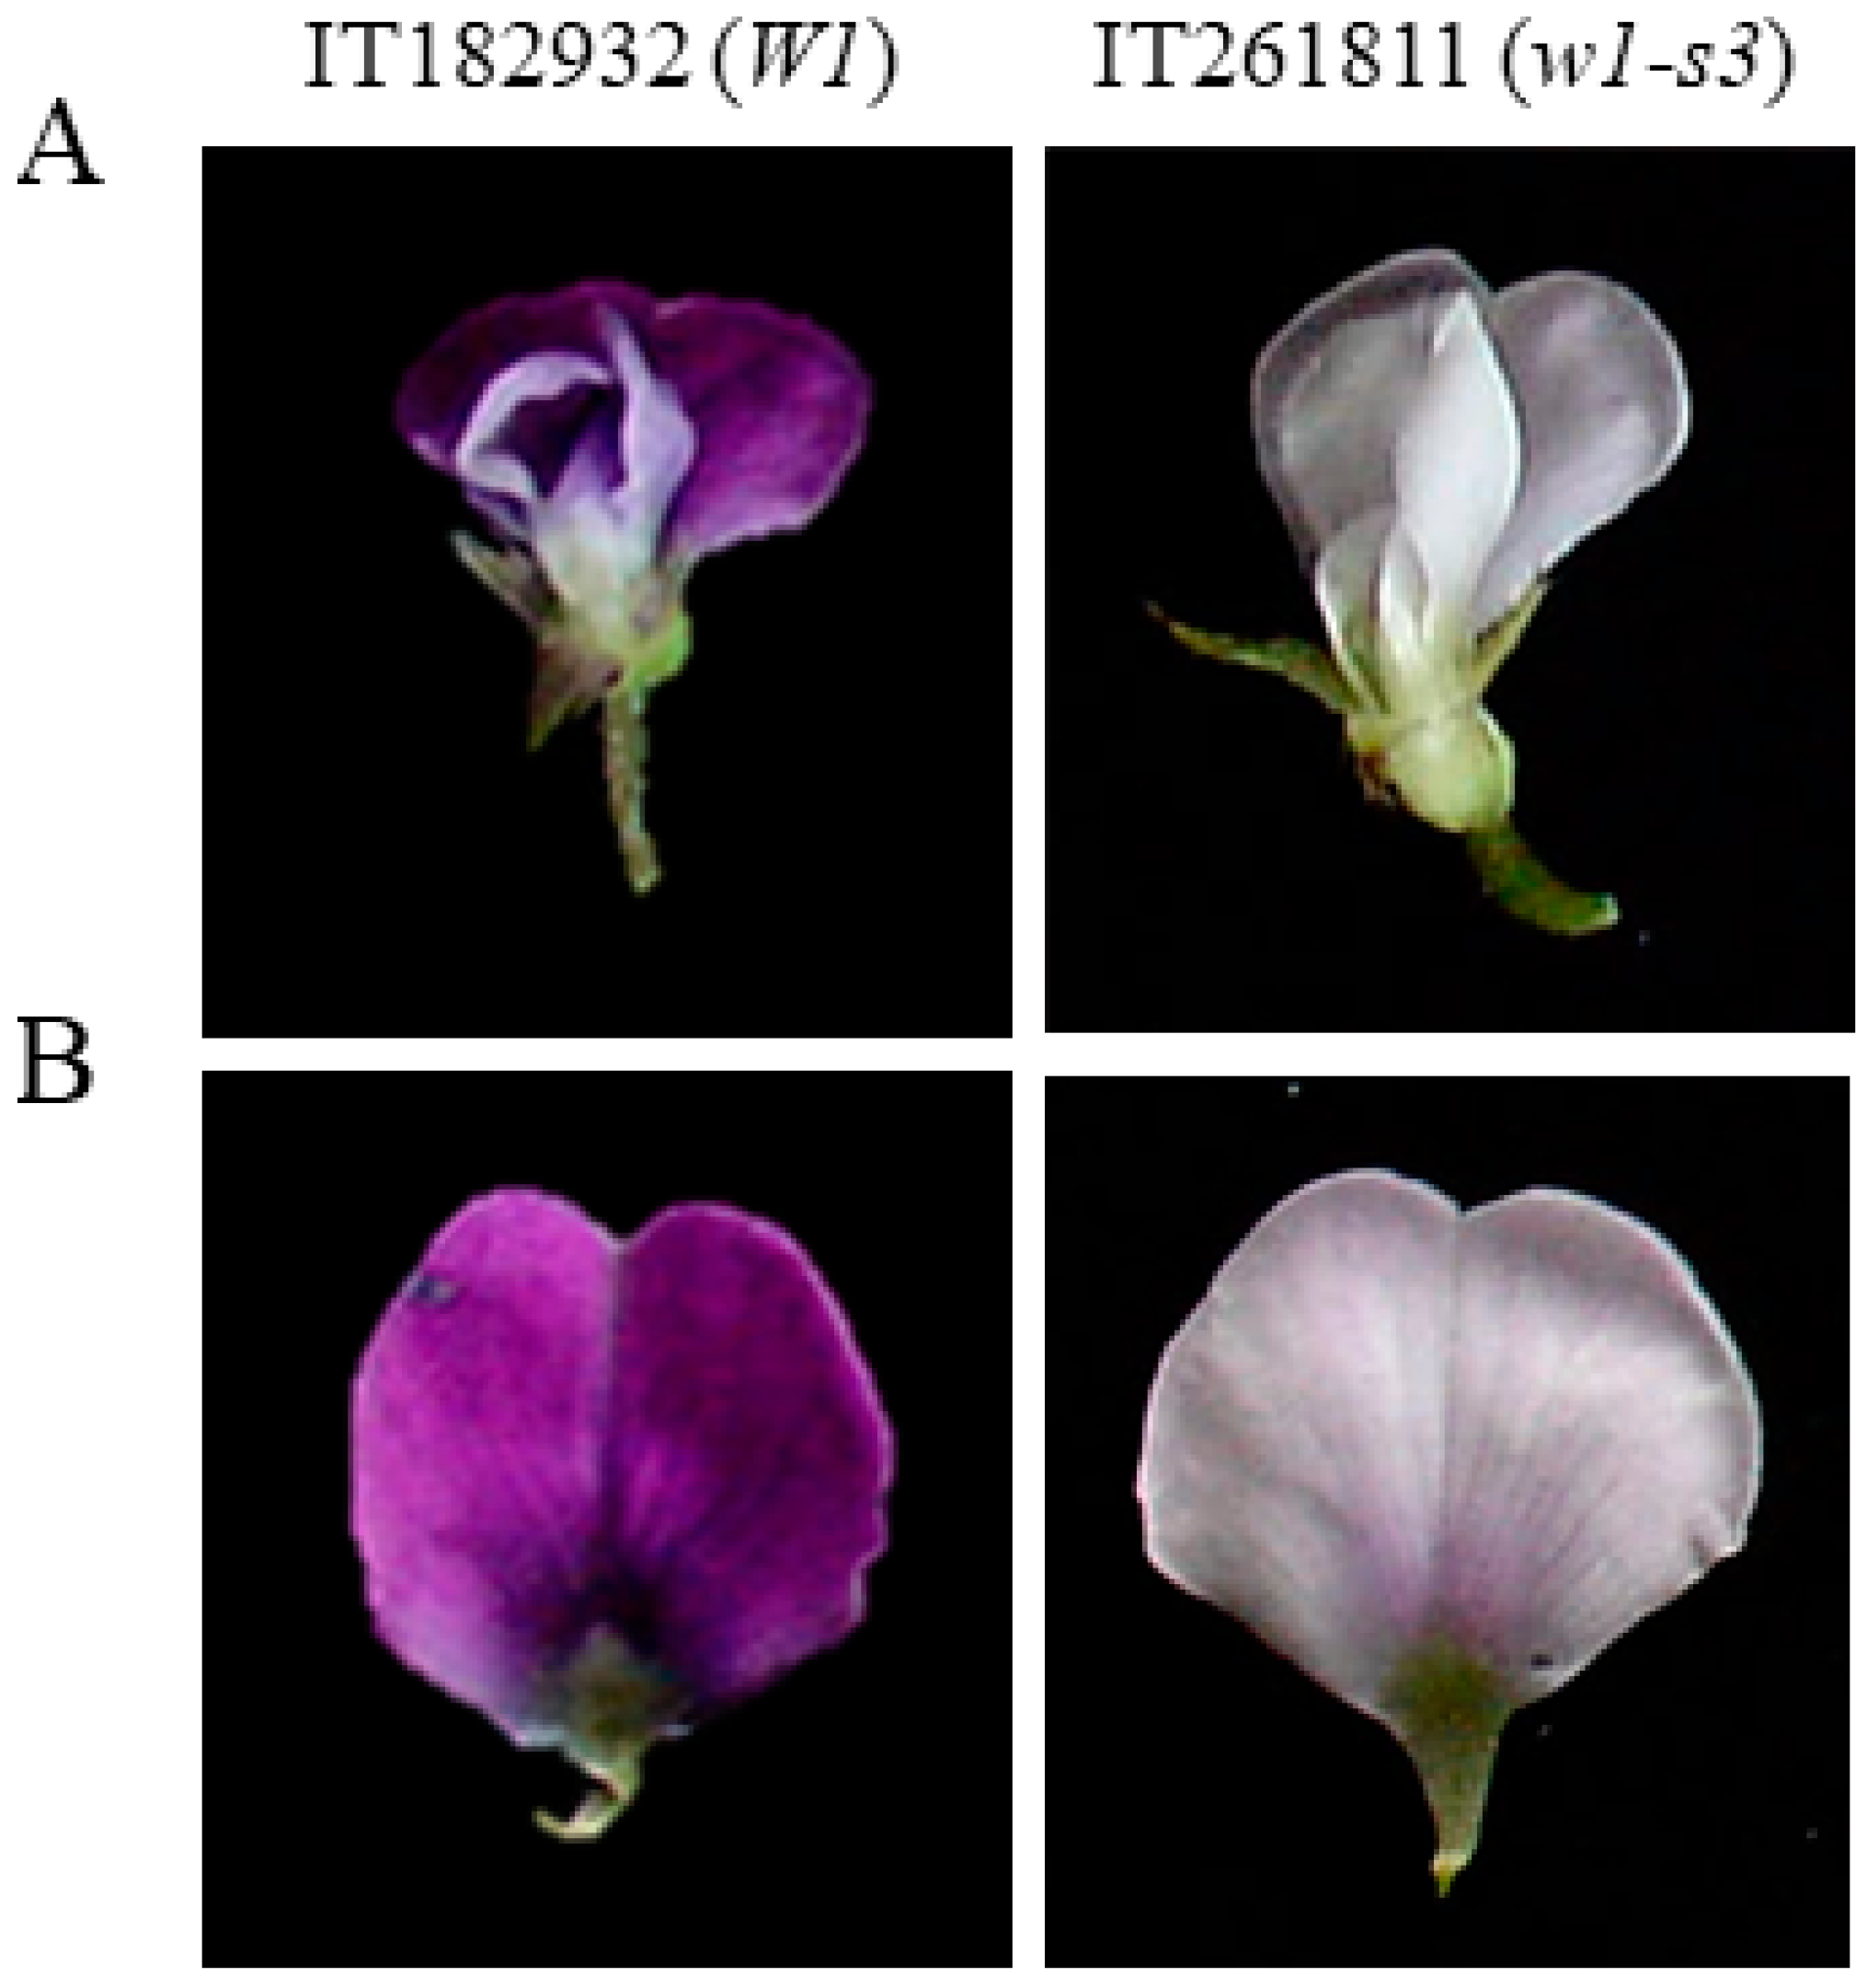
3.1. Genetic Analysis of New Pinkish-White Flower Variant of Wild Soybean

In the present study, we identified a pinkish-white flower variant (IT261811) among the wild soybean (G. soja) accessions (Figure 1). A total of 124 F2 individuals derived from the cross between IT261811 and IT182932 segregated into 95 plants with purple flowers and 29 plants with pinkish-white flowers (Table 1). The segregation fitted a 3:1 ratio, suggesting that a single recessive gene controls the pinkish-white mutant phenotype in IT261811.

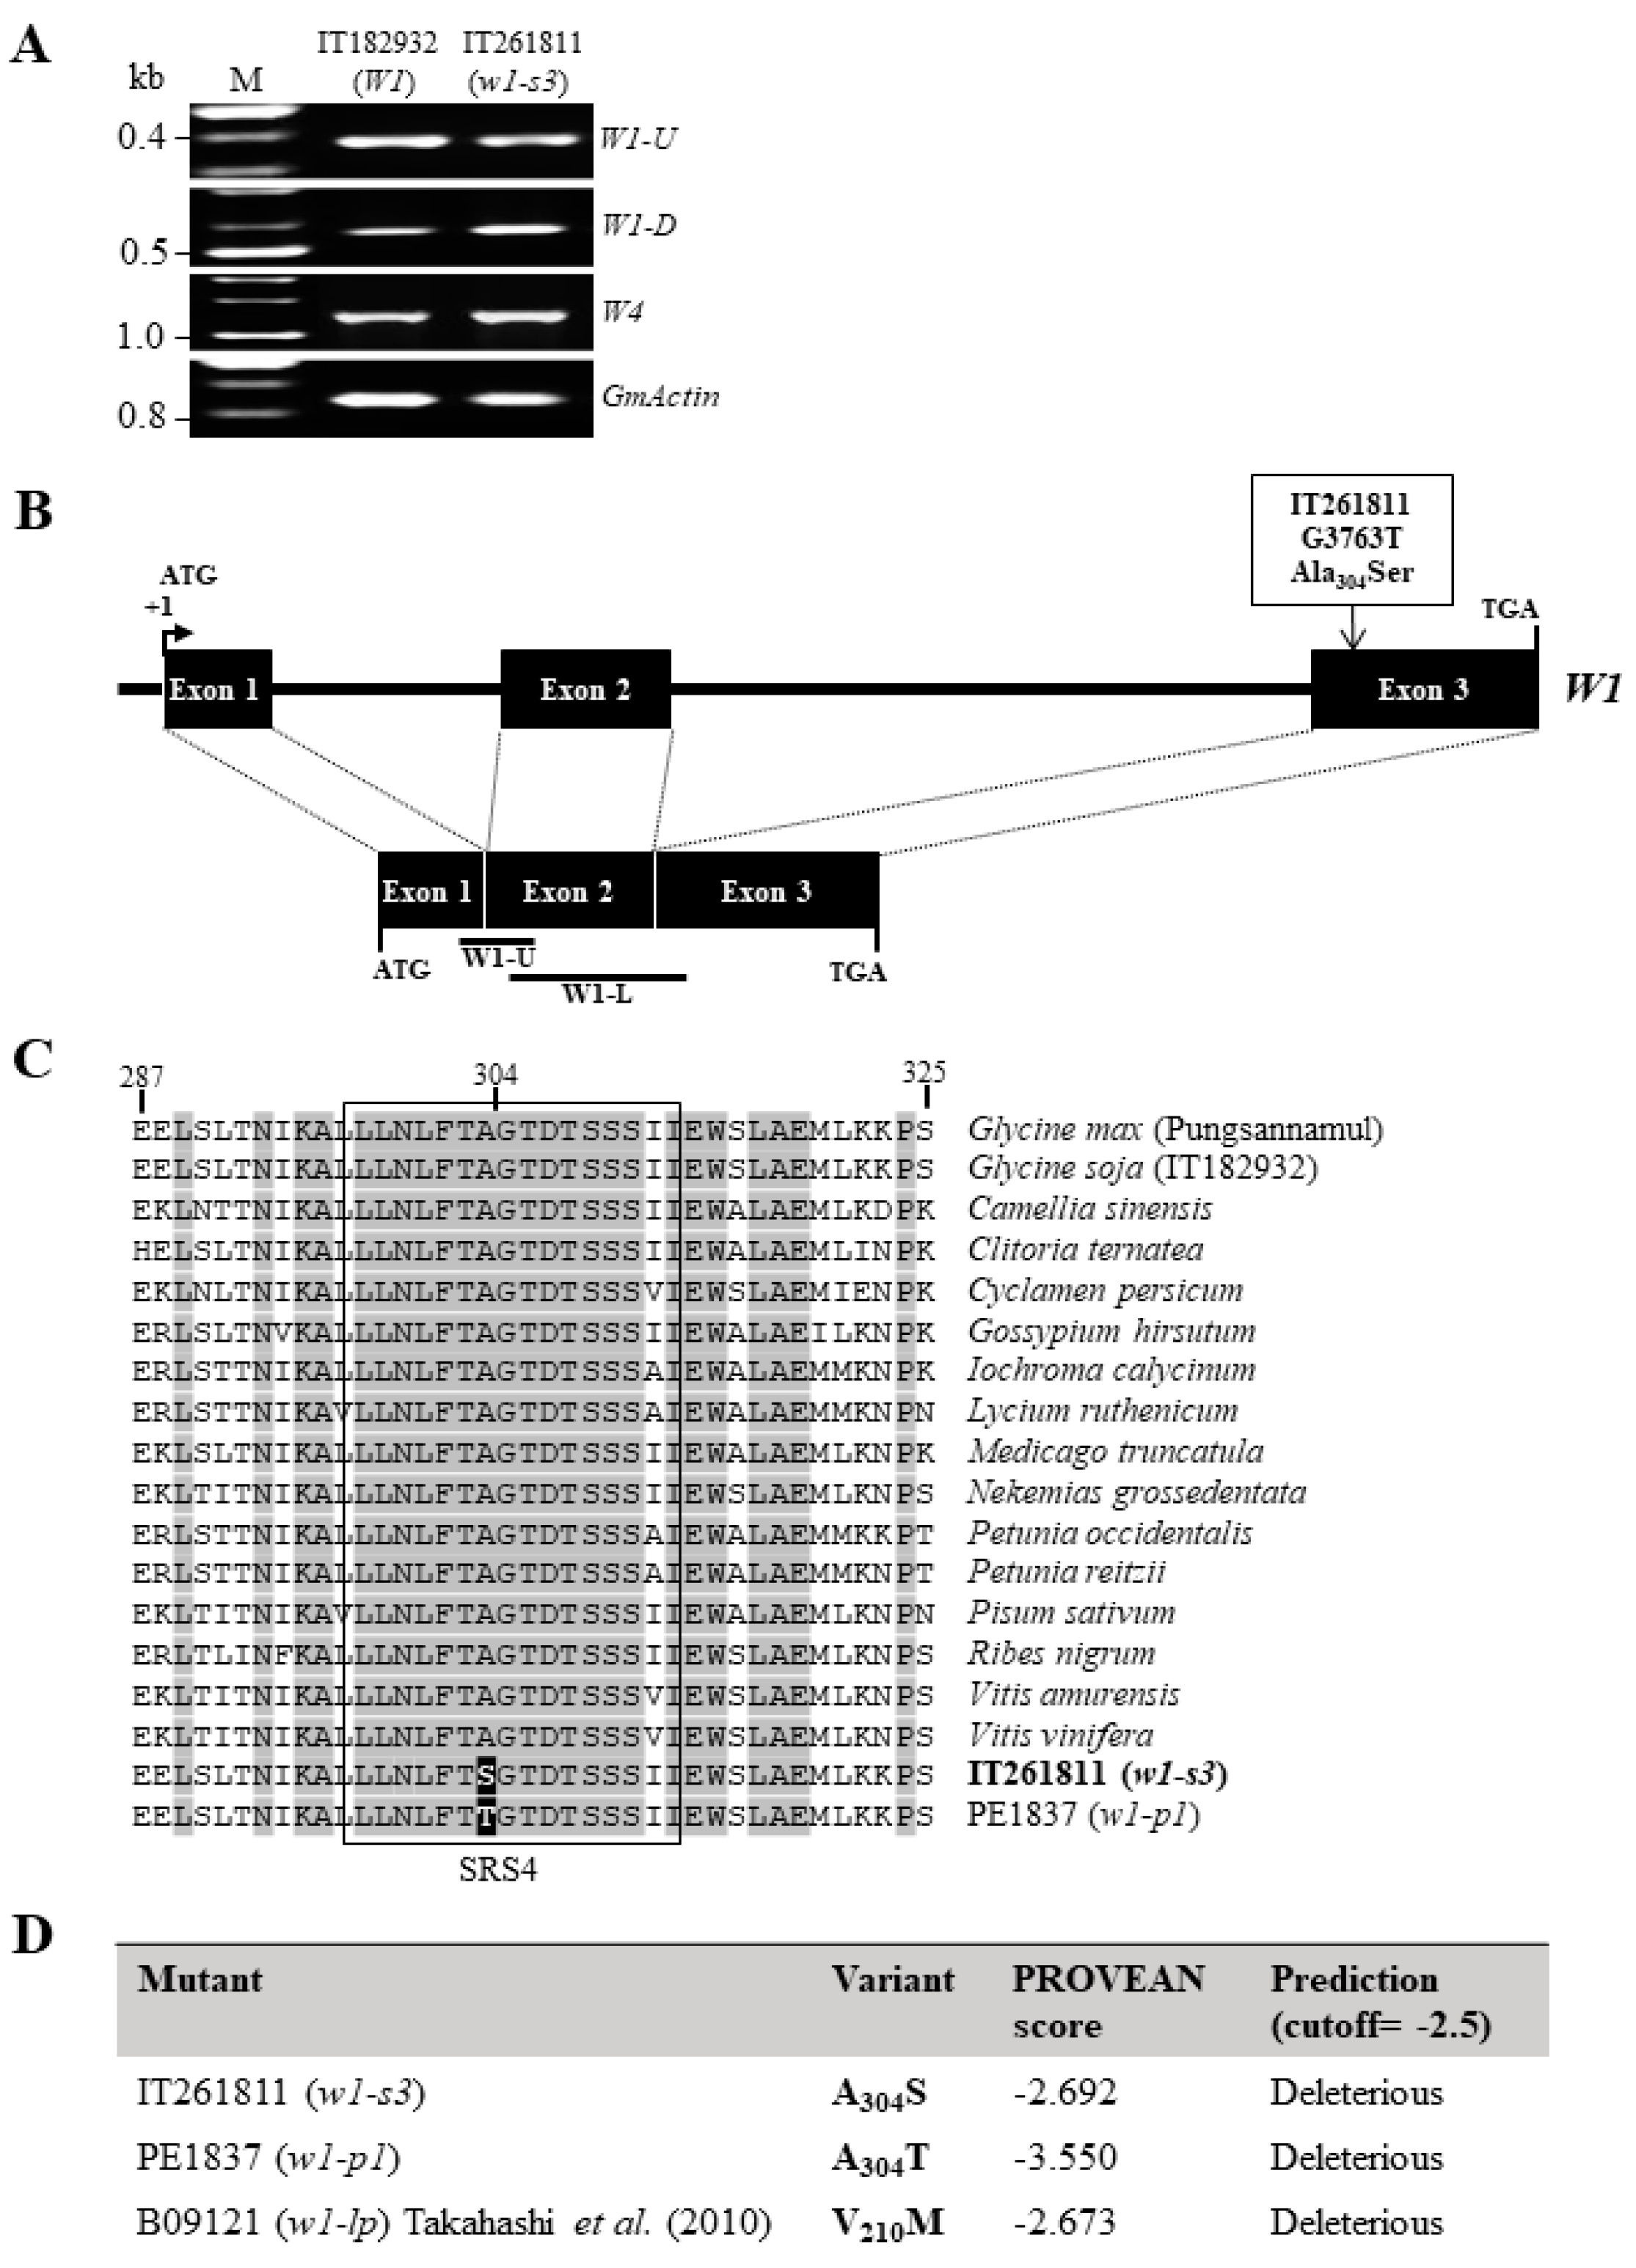
3.2. Molecular Analysis of the w1-s3 Variant

In soybean (G. max), the W3 and W4 loci encoding DFR enzymes epistatically interact with each other in a W1 genotypic background [23]. However, in G. soja, the W3 locus is not involved in the determination of flower colors [24]. Taking this into consideration, we conducted RT-PCR for both F3′5′H (W1) and (W4) genes to analyze alterations in gene expression. PCR products for W4 were amplified with the size of 1175-bp. For W1 expression, 5′ (W1-U) and 3′ (W1-L) half regions of the F3′5′H gene were amplified with the size of 331-bp and 558-bp, respectively (Figure 2A). Both W1 and W4 genes from IT261811 showed no significant difference in expression levels compared to that of wild-type IT182932, indicating that the mutant IT261811 had normal W1 and W4 expressions (Figure 2A). We analyzed the genomic sequences of F3′5′H (W1) and DFR2 (W4) to determine the involvement of W1 and W4 in the allelic variation of the mutant, IT261811. First, we analyzed the genomic sequences of DFR2 (nucleotide positions −4 to +3416) from IT182932 and IT261811, and results showed no polymorphism between them. Next, the nucleotide sequences of F3′5′H (nucleotide position −64 to +4534) from the mutant IT261811 showed a single-nucleotide substitution (G–T) in the third exon at nucleotide position +3763 (NCBI GenBank accession number: MW298105; Figure 2B), resulting in amino acid substitution (A304S) relative to the corresponding sequences of the wild-type IT182932 (NCBI GenBank accession number: KX077984). The new mutant allele was designated as w1-s3.
Resequencing data of soybean accession in China, Korea, and the USA are publicly available through the NCBI [25,26,27]. With SNP and INDEL data on W1 locus from of 775 re-sequenced accessions on SoyKB (http://soykb.org; accessed on 15 January 2021), we found no occurrence of SNP and/or INDEL on chromosome 13 at position 17,316,282 (Wm82.a2.v1), where w1-s3 shows a single-nucleotide substitution. This prompted us to perform amino acid sequence alignment of F3′5′H proteins from 14 different plant species from the NCBI-CDD database (Figure 2C) to determine the effects of single amino acid substitution in the w1-s3 allele on the functionality of the F3′5′H protein. The results showed that the amino acid change (Ser for Ala at position 304) in w1-s3 allele was located at the highly conserved position of SRS4 domain. SRS4 is the one of the six functional SRS domains in F3′5′H enzymes, which plays an important role in substrate-binding specificity [28,29].
In our previous study, a white-flowered EMS-induced mutant, PE1837 (w1-p1), showed a single amino acid substitution (A304T) at a position similar to that of the mutant IT261811 (w1-s3) [16]. In the same study, we speculated that the hydroxyl group of T304 in w1-p1 may have inhibited the proper binding of the flavone substrate on the basis of the results of the 3-D prediction tool, thereby leading to the loss of function of F3′5′H protein [16]. Thus, the amino acid substitution (A304S) identified in w1-s3 may also result in functional variation of F3′5′H proteins.
Recently, prediction software tools have been widely used to identify the deleterious or neutral effect of SNPs in candidate genes on the basis of the biochemical severity of the amino acid substitution [30]. We used the Protein Variation Effect Analyzer (PROVEAN, http://provean.jcvi.org/seq_submit.php; accessed on 12 January 2021) software tool that predicts whether an amino acid substitution has any impact on the functional activity of F3′5′H (Figure 2D) [21]. The PROVEAN tool sets the threshold at −2.5 as default. If the score of the protein variant is ≤−2.5 as predicted, the variation has a “deleterious” effect. Scores above the threshold indicate that the variant has a “neutral” effect [21]. We used the mutants IT261811 (w1-s3) and PE1837 (w1-p1) for predicting the amino acid substitution’s effect on F3′5′H protein function, along with the previously reported light-purple flower-bearing wild soybean mutant B09121 (w1-lp), whose F3′5′H protein was described as hypofunctional due to an alteration in one of its amino acid residue [18]. The results showed that the F3′5′H proteins of all the three w1-s3, w1-p1, and w1-lp mutants had deleterious effects, with −2.692, −3.550, and −2673 PROVEAN scores, respectively. However, the scores of w1-s3 and w1-lp were similar and at par with the cutoff score, suggesting that the w1-s3 mutant protein is similar to that of w1-lp, which is more likely a hypofunctional F3′5′H rather than a completely deleterious one.

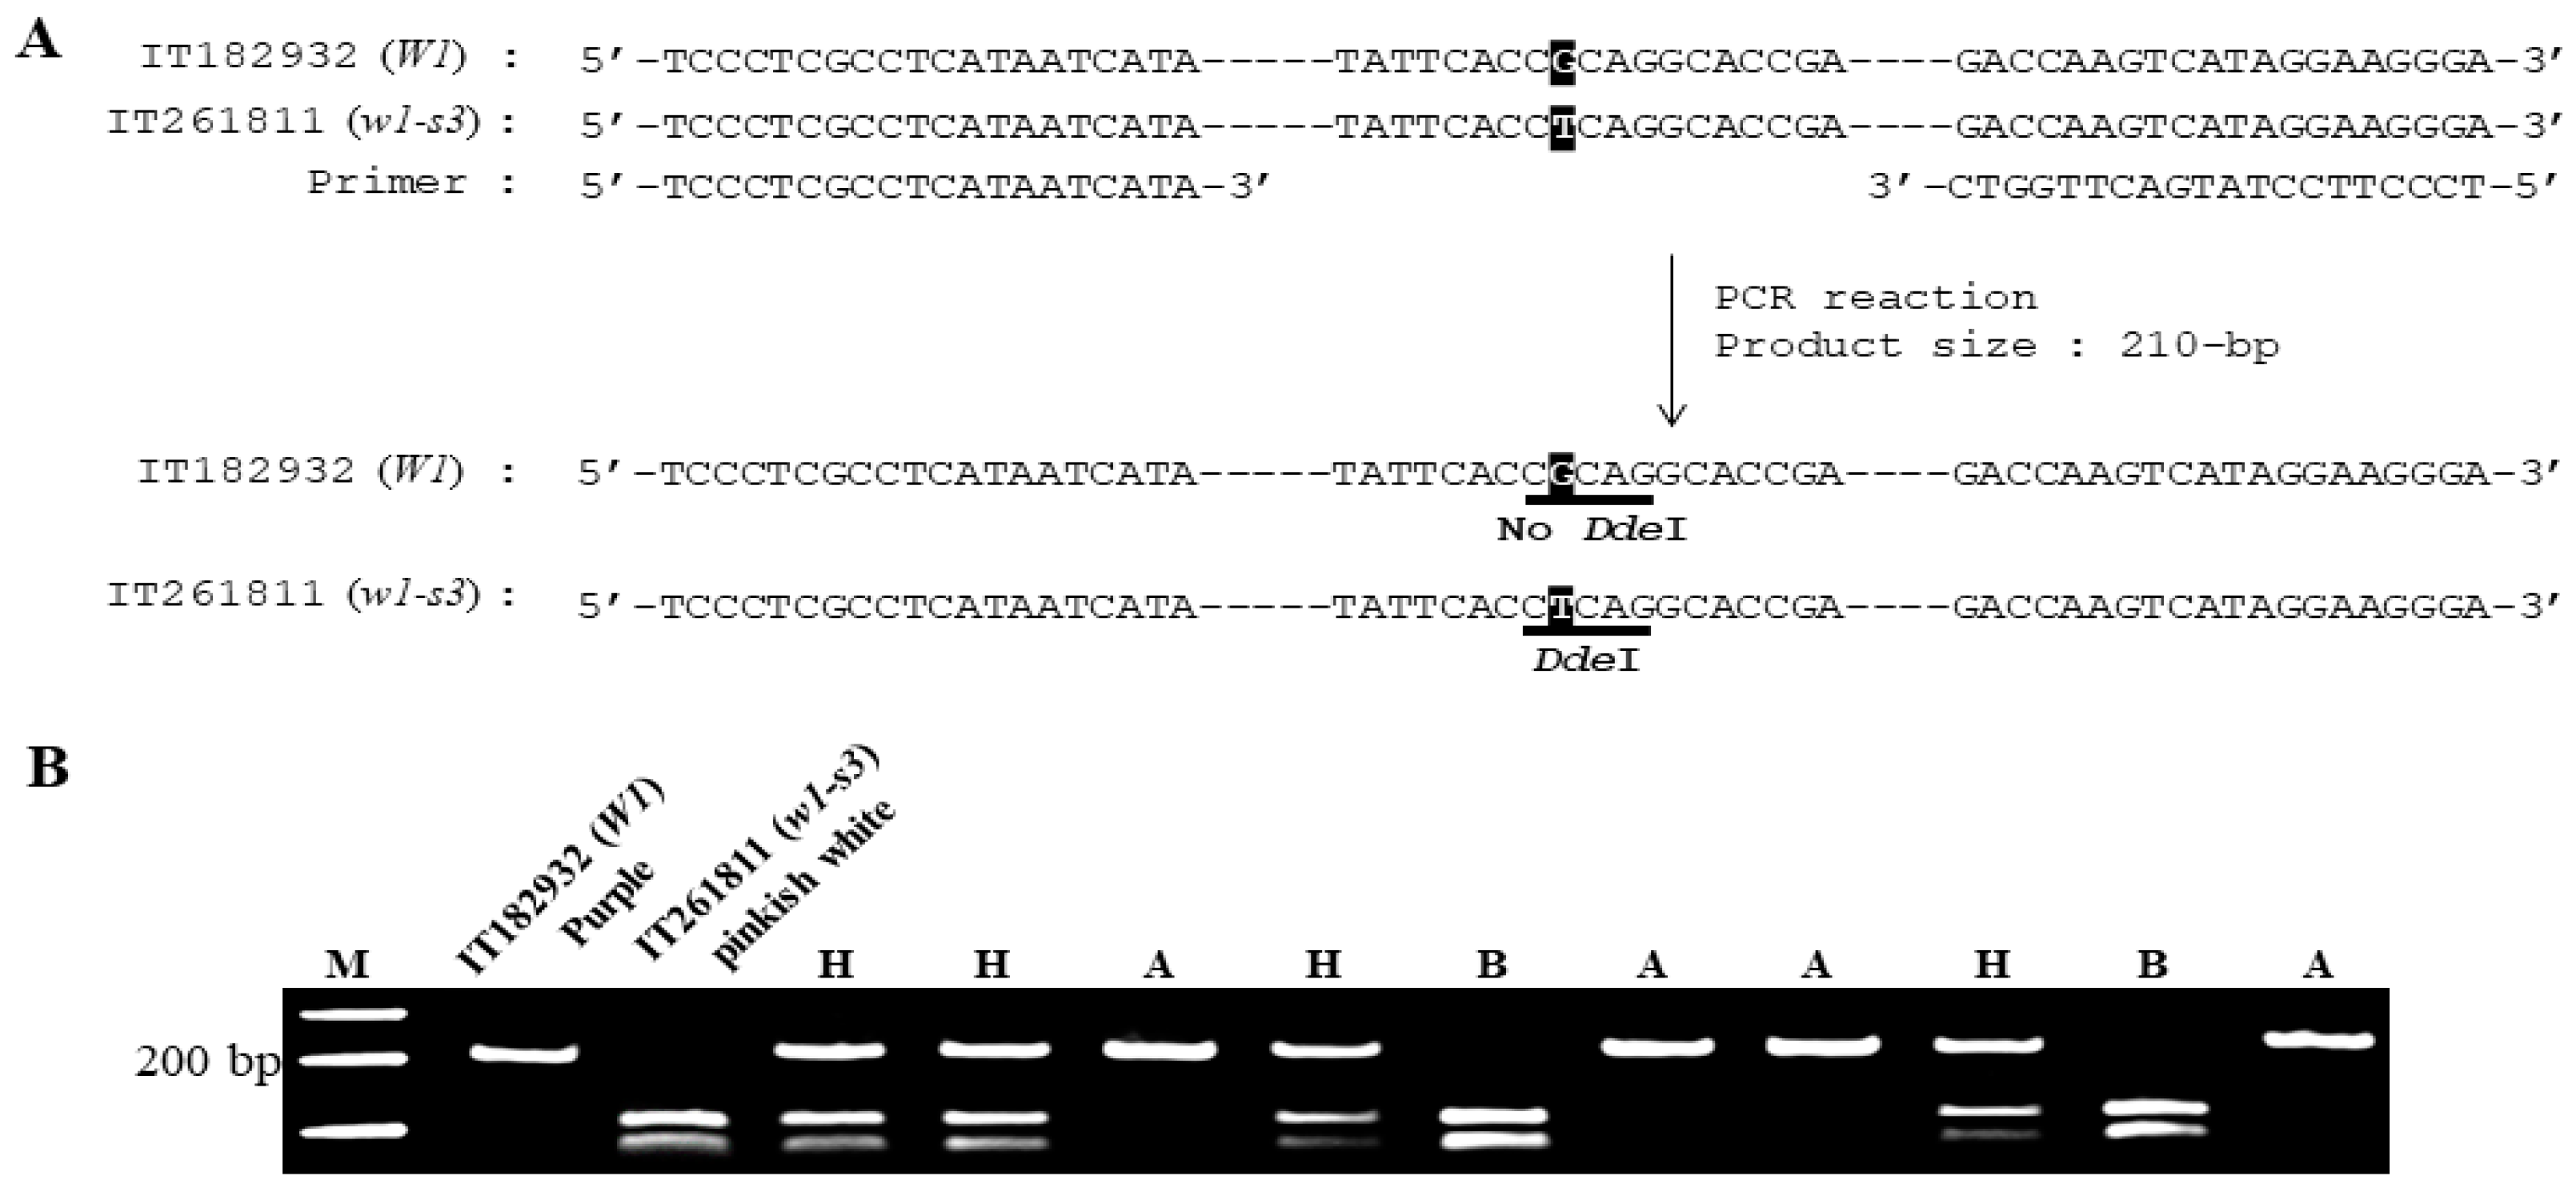
3.3. Co-Segregation of the W1 Polymorphism with Flower Color Phenotype

We conducted the single-marker analysis, which is the simplest mapping analysis to detect the associations between a marker and phenotype (pinkish-white flower color). The CAPS marker designed from the SNP (G–T) generates a DdeI site (CTNAG) in the PCR-amplified product from the mutant parent, IT261811 (Figure 3A). The CAPS marker co-segregated with flower colors of the F2 individuals was derived from the cross between IT261811 and IT182932 (Figure 3B). The result of single-marker analysis showed that the W1 gene was highly associated with pinkish-white flower in this study (n = 124, p < 0.0001, R2 = 1). Results also showed that genotype segregation fitted a 1:2:1 ratio (Table 1), indicating that the w1-s3 allele is recessive to W1. We concluded that the new w1-s3 allele under the w1 recessive allelic background produces pinkish-white flowers of the mutant IT261811 on the basis of the tight co-segregation between w1-s3 and pinkish-white flowers.

Author Contributions

Conceptualization, J.S. and J.-T.S.; data curation, J.S., G.-T.P., and H.J.; formal analysis, J.S. and G.-T.P.; investigation, J.S. and G.-T.P.; methodology, J.S., G.-T.P., and J.-T.S.; project administration, J.-T.S.; resources, J.-D.L. and J.-T.S.; supervision, J.-T.S.; writing—original draft, J.S., G.-T.P., H.J., and J.-T.S.; writing—review and editing, J.S., J.-D.L., H.-S.S., and J.-T.S. All authors have read and agreed to the published version of the manuscript.

Funding

This study was supported by the Kyungpook National University Research Fund, 2020.

Institutional Review Board Statement

Not applicable.

Informed Consent Statement

Not applicable.

Conflicts of Interest

The authors declare no conflict of interest.

References

  1. Grotewold, E. The genetics and biochemistry of floral pigments. Annu. Rev. Plant Biol. 2006, 57, 761–780. [Google Scholar] [CrossRef] [PubMed]
  2. Tanaka, Y.; Sasaki, N.; Ohmiya, A. Biosynthesis of plant pigments: Anthocyanins, betalains and carotenoids. Plant J. 2008, 54, 733–749. [Google Scholar] [CrossRef] [PubMed]
  3. Moreau, C.; Ambrose, M.J.; Turner, L.; Hill, L.; Ellis, T.H.; Hofer, J.M. The B gene of pea encodes a defective flavonoid 3’,5’-hydroxylase, and confers pink flower color. Plant Physiol. 2012, 159, 759–768. [Google Scholar] [CrossRef] [PubMed] [Green Version]
  4. Buzzell, R.; Buttery, B.; MacTavish, D. Biochemical genetics of black pigmentation of soybean seed. J. Hered. 1987, 78, 53–54. [Google Scholar] [CrossRef]
  5. Tanner, G. Condensed tannins. In Plant Pigments and Their Manipulation; Davies, K.M., Ed.; Oxford: Blackwell, UK, 2004; Volume 14, pp. 154–184. [Google Scholar]
  6. Matsubara, K.; Kodama, H.; Kokubun, H.; Watanabe, H.; Ando, T. Two novel transposable elements in a cytochrome P450 gene govern anthocyanin biosynthesis of commercial petunias. Gene 2005, 358, 121–126. [Google Scholar] [CrossRef] [PubMed]
  7. Nakatsuka, T.; Nishihara, M.; Mishiba, K.; Hirano, H.; Yamamura, S. Two different transposable elements inserted in flavonoid 3’,5’-hydroxylase gene contribute to pink flower coloration in Gentiana scabra. Mol. Genet. Genom. 2006, 275, 231–241. [Google Scholar] [CrossRef] [PubMed]
  8. Snowden, K.C.; Napoli, C.A. Psl: A novel Spm-like transposable element from Petunia hybrida. Plant J. 1998, 14, 43–54. [Google Scholar] [CrossRef]
  9. Park, G.T.; Sundaramoorthy, J.; Lee, J.-D.; Kim, J.H.; Seo, H.S.; Song, J.T. Elucidation of molecular identity of the W3 locus and its implication in determination of flower colors in soybean. PLoS ONE 2015, 10, e0142643. [Google Scholar] [CrossRef] [Green Version]
  10. Palmer, R.G.; Pfeiffer, T.W.; Buss, G.R.; Kilen, T.C. Qualitative Genetics. In Soybeans: Improvement, Production, and Uses, 3rd ed.; Shibles, M., Harper, J.E., Wilson, R.F., Shoemaker, R.C., Eds.; Madison Inc.: Madison, WI, USA, 2004. [Google Scholar]
  11. Takahashi, R.; Githiri, S.M.; Hatayama, K.; Dubouzet, E.G.; Shimada, N.; Aoki, T.; Ayabe, S.; Iwashina, T.; Toda, K.; Matsumura, H. A single-base deletion in soybean flavonol synthase gene is associated with magenta flower color. Plant Mol. Biol. 2007, 63, 125–135. [Google Scholar] [CrossRef] [PubMed]
  12. Zabala, G.; Vodkin, L.O. A rearrangement resulting in small tandem repeats in the F3′ 5′ H gene of white flower genotypes is associated with the soybean W1 locus. Crop Sci. 2007, 47, S–113–S–124. [Google Scholar] [CrossRef]
  13. Park, G.T.; Sundaramoorthy, J.; Park, J.B.; Lee, J.D.; Choi, K.S.; Kim, J.H.; Seo, H.S.; Park, S.-K.; Song, J.T. Diversity of the W1 gene encoding flavonoid 3 ‘, 5 ‘-hydroxylase in white- and purple-flowered soybeans. Plant Genet. Resour. 2015, 13, 213–218. [Google Scholar] [CrossRef]
  14. Sundaramoorthy, J.; Park, G.T.; Lee, J.D.; Kim, J.H.; Seo, H.S.; Song, J.T. Genetic and molecular regulation of flower pigmentation in soybean. J. Korean Soc. Appl. Biol. Chem. 2015, 58, 555–562. [Google Scholar] [CrossRef]
  15. Chen, Y.; Nelson, R.L. Identification and characterization of a white-flowered wild soybean plant. Crop Sci. 2004, 44, 339–342. [Google Scholar] [CrossRef]
  16. Sundaramoorthy, J.; Park, G.T.; Chang, J.H.; Lee, J.D.; Kim, J.H.; Seo, H.S.; Chung, G.; Song, J.T. Identification and molecular analysis of four new alleles at the W1 locus associated with flower color in soybean. PLoS ONE 2016, 11, e0159865. [Google Scholar] [CrossRef] [PubMed] [Green Version]
  17. Takahashi, R.; Morita, Y.; Nakayama, M.; Kanazawa, A.; Abe, J. An active CACTA-family transposable element is responsible for flower variegation in wild soybean Glycine soja. Plant Genome 2012, 5, 62–70. [Google Scholar] [CrossRef] [Green Version]
  18. Takahashi, R.; Dubouzet, J.G.; Matsumura, H.; Yasuda, K.; Iwashina, T. A new allele of flower color gene W1 encoding flavonoid 3 ‘5 ‘-hydroxylase is responsible for light purple flowers in wild soybean Glycine soja. BMC Plant Biol. 2010, 10, 155. [Google Scholar] [CrossRef] [PubMed] [Green Version]
  19. Sandhu, D.; Atkinson, T.; Noll, A.; Johnson, C.; Espinosa, K.; Boelter, J.; Abel, S.; Dhatt, B.K.; Barta, T.; Singsaas, E.; et al. Soybean proteins GmTic110 and GmPsbP are crucial for chloroplast development and function. Plant Sci. 2016, 252, 76–87. [Google Scholar] [CrossRef] [Green Version]
  20. Park, G.T.; Sundaramoorthy, J.; Lee, J.D.; Kim, J.H.; Park, S.K.; Seo, H.S.; Song, J.T. Association of new mutant allele, w4-nw, at W4 locus with near-white flower color in soybean. Crop Sci. 2016, 56, 1857–1864. [Google Scholar] [CrossRef]
  21. Choi, Y.; Sims, G.E.; Murphy, S.; Miller, J.R.; Chan, A.P. Predicting the functional effect of amino acid substitutions and indels. PLoS ONE 2012, 7, e46688. [Google Scholar] [CrossRef] [Green Version]
  22. Choi, Y.; Chan, A.P. PROVEAN web server: A tool to predict the functional effect of amino acid substitutions and indels. Bioinformatics 2015, 31, 2745–2747. [Google Scholar] [CrossRef] [PubMed] [Green Version]
  23. Hartwig, E.E.; Hinson, K. Inheritance of flower color of soybeans. Crop Sci. 1962, 2, 152–153. [Google Scholar] [CrossRef] [Green Version]
  24. Park, G.T.; Sundaramoorthy, J.; Lee, S.; Lee, J.D.; Kim, J.H.; Park, S.K.; Seo, H.S.; Chung, G.; Song, J.T. Color variation in a novel Glycine soja mutant w4-s1 with pinkish-white flowers is controlled by a single recessive allele at the W4 locus. Crop Sci. 2017, 57, 3112–3121. [Google Scholar] [CrossRef]
  25. Fang, C.; Ma, Y.; Wu, S.; Liu, Z.; Wang, Z.; Yang, R.; Hu, G.; Zhou, Z.; Yu, H.; Zhang, M.; et al. Genome-wide association studies dissect the genetic networks underlying agronomical traits in soybean. Genome Biol. 2017, 18, 1–14. [Google Scholar] [CrossRef] [PubMed]
  26. Joshi, T.; Wang, J.; Zhang, H.; Chen, S.; Zeng, S.; Xu, B.; Xu, D. The evolution of soybean knowledge base (SoyKB). In Plant Genomics Databases; Dijk, A.V., Ed.; Humana Press: New York, NY, USA, 2017; pp. 149–159. [Google Scholar]
  27. Valliyodan, B.; Qiu, D.; Patil, G.; Zeng, P.; Huang, J.; Dai, L.; Chen, C.; Li, Y.; Joshi, T.; Song, L.; et al. Landscape of genomic diversity and trait discovery in soybean. Sci. Rep. 2016, 6, 1–10. [Google Scholar] [CrossRef] [PubMed] [Green Version]
  28. Ellis, S.W.; Hayhurst, G.P.; Smith, G.; Lightfoot, T.; Wong, M.M.; Simula, A.P.; Acland, M.J.; Sternberg, M.J.E.; Lennard, M.S.; Tucker, G.T.; et al. Evidence that aspartic acid 301 is a critical substrate-contact residue in the active site of cytochrome P450 2D6. J. Biol. Chem. 1995, 270, 29055–29058. [Google Scholar] [CrossRef] [Green Version]
  29. Li, Q.; Fang, Y.; Li, X.; Zhang, H.; Liu, M.; Yang, H.; Kang, Z.; Li, Y.; Wang, Y. Mechanism of the plant cytochrome P450 for herbicide resistance: A modelling study. J. Enzym. Inhib. Med. Chem. 2013, 28, 1182–1191. [Google Scholar] [CrossRef] [PubMed]
  30. Doss, C.G.P.; Nagasundaram, N.; Chakraborty, C.; Chen, L.; Zhu, H. Extrapolating the effect of deleterious nsSNPs in the binding adaptability of flavopiridol with CDK7 protein: A molecular dynamics approach. Hum. Genom. 2013, 7, 10. [Google Scholar] [CrossRef] [PubMed] [Green Version]
Figure 1. Photographic images showing the flower colors of the plant materials. Plant materials of wild soybean accessions IT182932 (purple flower) and IT261811 (pinkish-white). (A) A whole flower. (B) A banner petal.
Agronomy 11 01001 g001
Figure 2. Expression profiles of W1 and W4 genes and schematic representation of the F3′5′H allele along with F3′5′H protein variation analysis. (A) Gene expression analysis of W1 and W4 through RT-PCR was performed in the purple-flowered line (IT182932) and the pinkish-white-flowered mutant line (IT261811). The 5′ and 3′ half regions of F3′5′H are designated as W1-U and W1-L, respectively. GmActin, a housekeeping gene, was used as the loading control. M, a 1-kb molecular marker. (B) Gene structure of W1 and polymorphism between W1 and w1-s3 alleles. White boxes indicate mutational change in the recessive w1-s3 allele at the W1 locus. Black boxes indicate exons. W1-U and W1-L denote the 5′ and 3′ parts of W1, respectively. (C) Amino acid alignments of F3′5′H proteins. The amino acid sequences of 14 F3′5′H proteins from different plant species were compared with wild-type F3′5′H and mutant proteins. Gray text indicates identical amino acids. White letters with a black highlight indicate relevant amino acid substitutions. Thick black box indicates the SRS4 domain. GenBank accession numbers of F3′5′H proteins are as follows: Camellia sinensis, AAY23287; Clitoria ternatea, BAF49293; Cyclamen persicum, ACX37698; Gossypium hirsutum, ACH56524; Iochroma calycinum, AIY22750; Lycium ruthenicum, AGT57963; Medicago truncatula, XP_013459330; Nekemias grossedentata, AGO02173; Petunia occidentalis, BAF34571; Petunia reitzii, BAF34572; Pisum sativum, ADW66160; Ribes nigrum, AGI16385; Vitis amurensis, ACN38269; and Vitis vinifera, BAE47007. (D) PROVEAN scores of amino acid variations identified in w1-s3, w1-p1, and w1-lp mutants. The PROVEAN tool sets the threshold at −2.5 as default.
Agronomy 11 01001 g002
Figure 3. Schematic diagram of CAPS analysis and co-segregation of W1 polymorphism with the pinkish-white flower color phenotype. (A) CAPS analysis was aimed to detect an SNP in the w1-s3 allele (T, indicated in white font highlighted in black). The underlined DdeI site (CTNAG) was used for CAPS analysis. PCR products from IT261811 (w1-s3) were 210 bp in length and were digested with DdeI into 112- and 98-bp DNA fragments, whereas those from IT182932 (W1) remained uncut after digestion. (B) CAPS analysis shows the co-segregation of W1 polymorphism and the flower color observed in the F2 population derived from the cross between IT261811 and IT182932. M, a 1-kb molecular marker; H, heterozygous F2 plants with purple flowers; A, wild-type F2 plants with purple flowers; and B, homozygous F2 plants with pinkish-white flowers.
Agronomy 11 01001 g003
Table 1. Segregation and co-segregation analyses.
Flower ColorW1
Segregation Ratios
P/PW *A/H/B **
Observed95:2931:64:29
Expected93:3131:62:31
Ratio3:11:2:1
χ20.00560.0063
Probability 0.940.99
* P, purple; PW, pinkish-white. ** A, wild homozygote; H, heterozygote; B, mutant homozygote; not significant (p < 0.05).
Publisher’s Note: MDPI stays neutral with regard to jurisdictional claims in published maps and institutional affiliations.

