
An Efficient Structure of an Agrophotovoltaic System in a Temperate Climate Region


1
Department of Industrial and Systems Engineering, Dongguk University Seoul, Seoul 04620, Korea
2
Department of Environmental Horticulture & Landscape Architecture, College of Life Science & Biotechnology, Dankook University, Cheonan-si 31116, Chungnam, Korea
3
Crop Research Division, Jeollanamdo Agricultural Research and Extension Services, Naju-si 58123, Jeollanam-do, Korea
*
Authors to whom correspondence should be addressed.
Agronomy 2021, 11(8), 1584; https://0-doi-org.brum.beds.ac.uk/10.3390/agronomy11081584
Submission received: 9 July 2021
/
Revised: 1 August 2021
/
Accepted: 5 August 2021
/
Published: 9 August 2021
Abstract
:The aim of this study was to identify an efficient agrophotovoltaic (APV) system structure for generating electricity from solar radiation without causing an adverse impact on crop growth. In a temperate climate region, it is critical to design an APV system with appropriate structure with the maximum amount of electricity generation because, unlike in desert areas, strong solar radiation is only available for a few hours a day. In this study, APV systems with three different shading ratios (i.e., 32%, 25.6%, and 21.3%) were considered, and the optimum structure in terms of electricity efficiency and profitability was investigated via nonlinear programming. Moreover, an estimation model of electricity generation was developed via a polynomial regression model based on remote sensing data given by the APV system located at Jeollanamdo Agricultural Research and Extension Services in South Korea. To evaluate the impact of the APV on crop production, five different grain crops—sesame (Sesamum indicum), mung bean (Vigna radiata), red bean (Vigna angularis), corn (Zea mays), and soybean (Glycine max)—were cultivated in the system. As a result, the proposed optimization model successfully identified the best APV system structure without reducing existing crop production.
1. Introduction
Solar energy has received worldwide attention due to its potential benefits for the environment and the sustainability of humankind. As a major renewable energy source, solar energy can be generated without causing a harmful impact on the environment [1]. Although it has a high production cost of $126/MWh compared to existing energy sources such as coal ($88/MWh), natural gas ($71/MWh), and nuclear ($69/MWh) [2], solar energy can be competitive if the government imposes an additional tax on greenhouse gas (GHG) emissions (e.g., carbon dioxide equivalent (CO2e)). According to Pehl et al. [3], coal, natural gas, and solar energy generate 109 kg CO2e/MWh, 78 kg CO2e/MWh, and 6 kg CO2e/MWh, respectively. To make solar energy competitive among energy sources, many countries are imposing an additional tax on GHG emissions [4]. For example, the U.S. is planning to charge $0.025 per kg CO2e as GHG emissions [5], and South Korea supports $0.052 per kg CO2e ($0.31/MWh) [6].
To resolve the investment issue of solar energy, the construction of photovoltaic (PV) power stations has become popular not only in the U.S., but also in countries of Northeast Asia such as Korea, China, and Japan. China is aiming to reach 700 GW of solar power capacity by 2030 under the plan of China’s new Intended Nationally Determined Contributions (INDC) [7]. Japan will have solar PV capacity of 53 GW by 2030 [8]. Similarly, the Korea government has enacted the 3020 renewable energy policy to increase PV power capacity to 36.5 GW by 2030 [9]. Thus, solar energy capacity in South Korea has gradually increased every year. It was 2367 MW in 2018 and 3789 MW in 2019. In particular, electricity generation by solar modules accounted for approximately 51% of the total renewable energy capacity (7429 MW) of South Korea in 2019.
In a temperate climate region (e.g., Northeast Asia), it is critical to design an agrophotovoltaic (APV) system with an appropriate structure (i.e., distance and tilt angle between the solar panels) for the maximum amount of electricity generation because, unlike in desert areas, strong solar radiation is only available for a few hours a day. Countries in Northeast Asia (e.g., South Korea and Japan) have daily average global solar radiation of 11–13 MJ/m2, whereas countries in the Middle East (e.g., Qatar) have daily average global solar radiation of 18–20 MJ/m2 [10]. The average duration of bright sunshine in South Korea is 6.83 hours per day. This means that electricity generation is only available during that time [11]. To meet the goal of the 3020 renewable energy policy to have a PV power capacity of 36.5 GW by 2030, an additional land area of 623 km2 will be needed to construct PV power plants.
Nevertheless, it is challenging to secure enough space for the construction of PV power plants to provide a capacity of 36.5 GW. This is because the land available for construction is currently used for crop production (i.e., farmland). Compared with the mountainous area in the eastern region of South Korea, the western region with a wide plain area and high daily solar irradiation is preferred for constructing solar plants [12,13,14]. However, due to the limited land area and high costs of land in the northwestern region, only the southwestern region is available for construction. The major issue is that most land in the southwestern region (i.e., Jeollabuk-do and Jeollanam-do provinces) is farmland. According to statistics from 2019, 30.58% (483,457 ha) of the total farmland in South Korea (i.e., 1,580,957 ha) is in the southwestern region. Given that 47.97% (974,525 ha) of the southwestern region (i.e., 2,031,400 ha) is mountainous, only the remaining area (52.03%) is available as a habitable area [15]. Because habitable areas include lands used for other purposes (e.g., houses and commercial buildings), farmland (45.74% of habitable areas) is the only option for the construction. Thus, it is necessary to prevent any harmful impact of the construction of solar plants on farmlands so that the food supply of South Korea remains secure. In fact, it is contradictory to generate renewable energy for human survival at the expense of farmland.
To overcome the potential problems associated with impaired food production, an APV system must be considered. It should be devised to generate electricity from solar radiation without causing any adverse impact on crop growth [16]. In this study, the most appropriate APV system structure among two types of solar modules (i.e., monofacial and bifacial solar modules) was determined based on their impacts on crop growth. Five crops were used in this study: sesame (Sesamum indicum), mung bean (Vigna radiata), red bean (Vigna angularis), corn (Zea mays), and soybean (Glycine max). For the experiment, an APV system at the Jeollanamdo Agricultural Research and Extension Services in South Korea was constructed (see Section 2 for more detail). Based on the two different solar modules, three different structures causing shading ratios of 32%, 25.6%, and 21.3% were considered in this study. We not only investigated the impacts of different structures on crop growth and yield but also analyzed the monetary benefits for farmers.
The rest of the paper is organized as follows. Section 2 describes the structure of the APV system constructed at the Jeollanamdo Agricultural Research and Extension Services in South Korea. Section 3 introduces the management of the five subject crops (i.e., sesame (Sesamum indicum), mung bean (Vigna radiata), red bean (Vigna angularis), corn (Zea mays), and soybean (Glycine max)) under the APV system and the estimation models of electricity and profit from the APV system. The measured data are analyzed and the most efficient structure of an APV system in a temperate climate region is identified in Section 4. Finally, Section 5 concludes this study and suggests additional studies needed in the future.
2. Agrophotovoltaic Systems
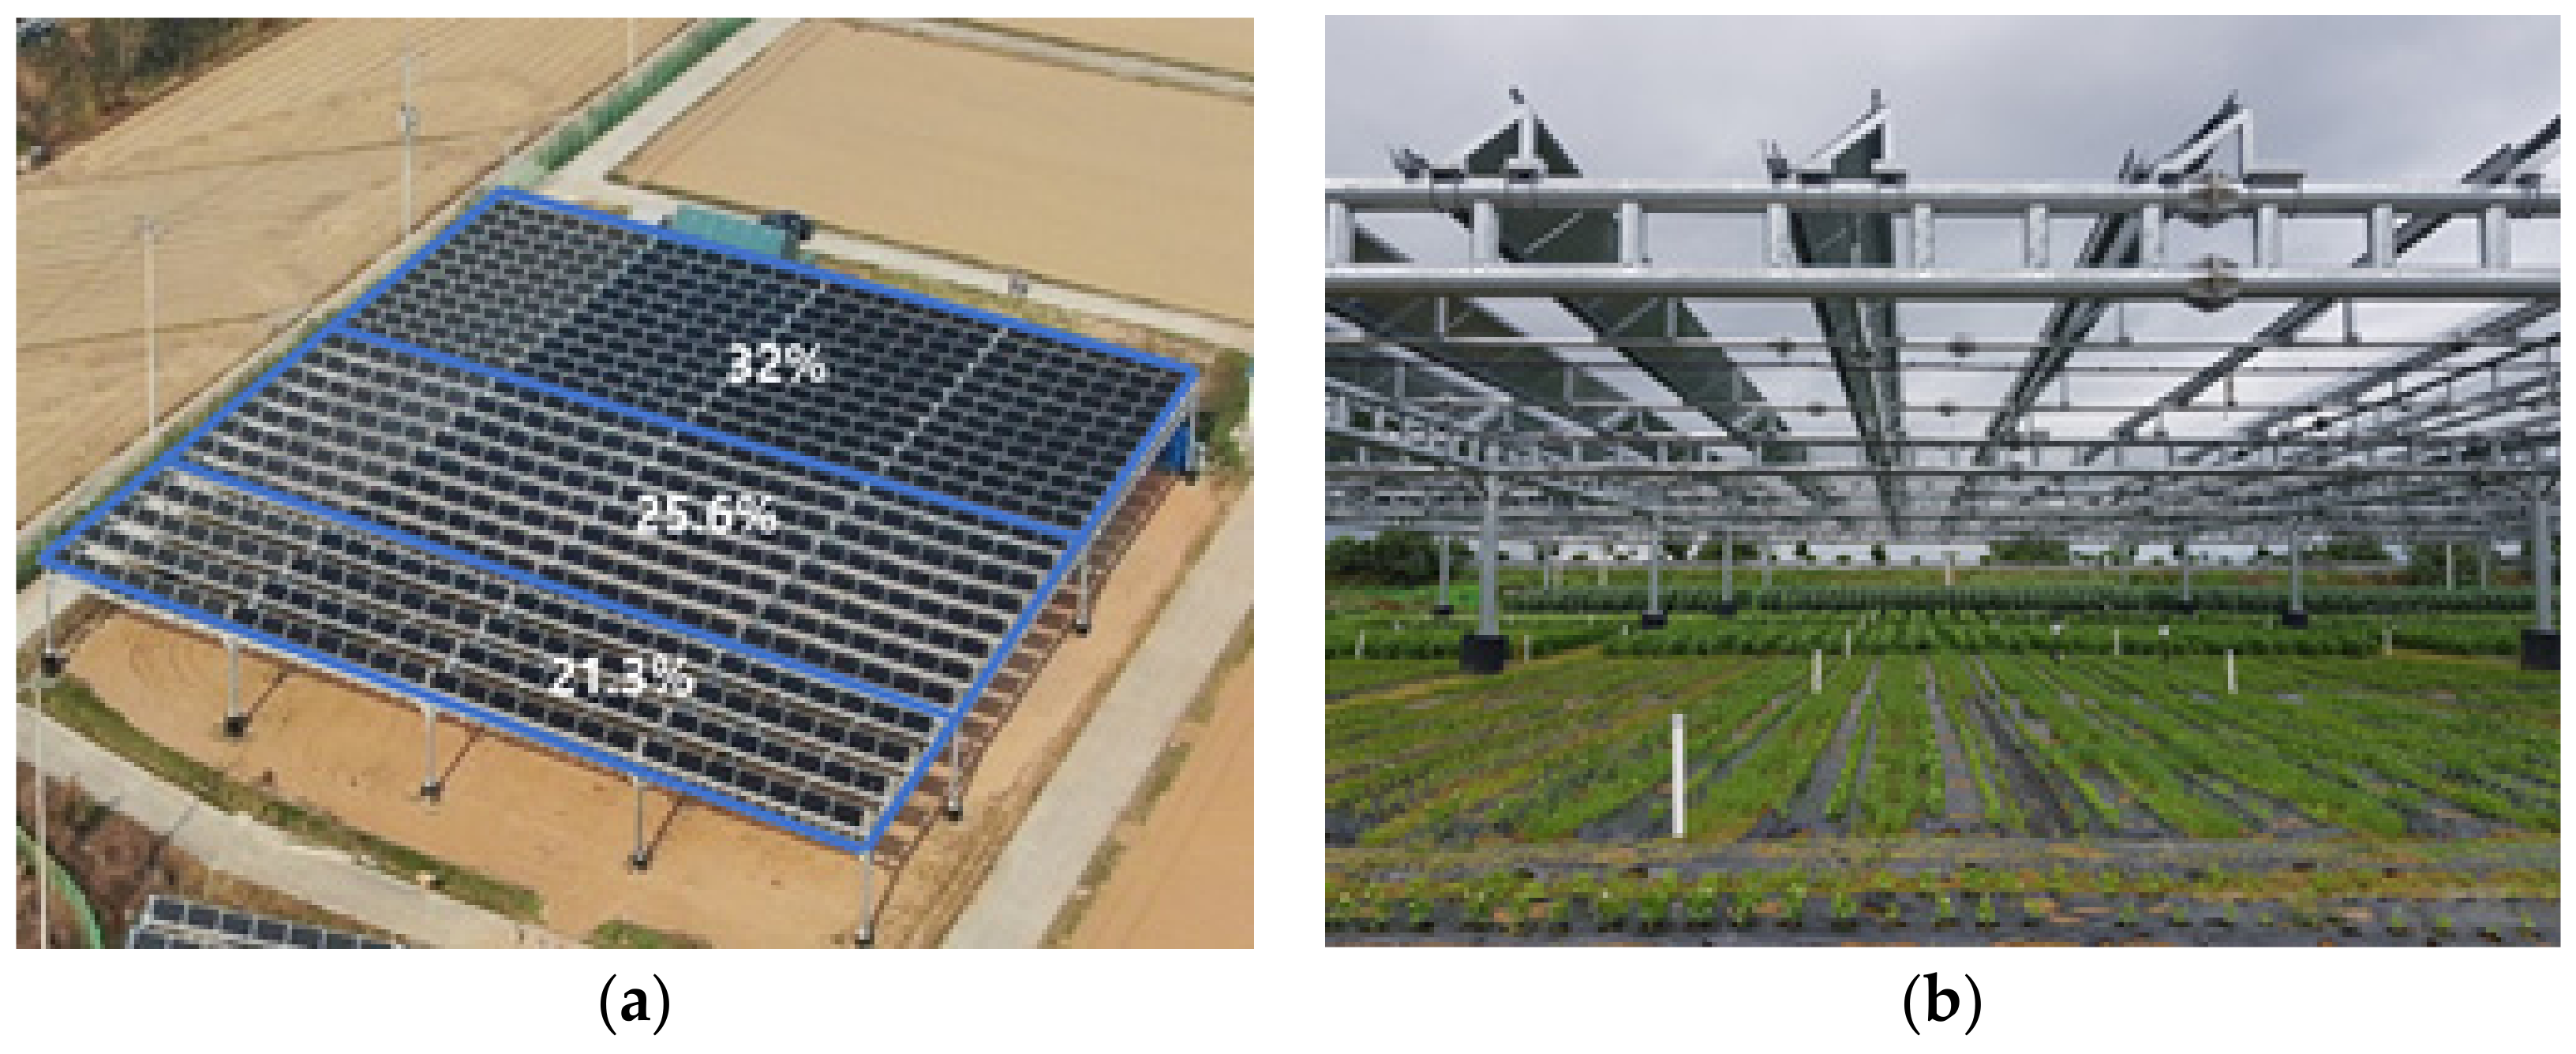
The subject agrophotovoltaic system (APV) is located at the Jeollanamdo Agricultural Research and Extension Services in Naju-si (35.0161° N, 126.7108° E), Jeollanam-do, South Korea. Figure 1 shows an overview of the subject APV system with an area of 4410 m2 (63 m × 70 m). In Figure 1a, three different shading ratios are shown: 32%, 25.6%, and 21.3%. According to a previous study [17], the shading ratio for an APV should be at most 33% to generate solar power in South Korea. Thus, in this study we considered these three ratios, widely adopted in the nation. The solar modules with shading ratios of 32%, 25.6%, and 21.3% had areas of 1575 m2 (63 m × 25 m), 1701 m2 (63 m × 27 m), and 1134 m2 (63 m × 18 m), respectively. The shading ratio (Rshade) was computed according to Equation (1):
where is the area (m2) shaded by the solar modules and is the area (m2) used to install the APV system. Thus, the shading areas of the solar modules with shading ratios of 32%, 25.6%, and 21.3% were 504 m2, 435 m2, and 242 m2, respectively.
As shown in Figure 1b, each solar module was installed on a frame with a height of 5.42 m. The height of the pillar cover (or a support) was 0.81 m. By having sufficient height between solar modules and the ground, enough solar radiation could reach the crops under the solar modules. The installation costs were $0.35 per watt (W) for monofacial solar modules and $0.40 per watt (W) for bifacial solar modules. The subject facility had 161 units of 405 W monofacial solar modules and 161 units of 390 W bifacial solar modules. The prices of the monofacial (i.e., LG405N2W-V5) and bifacial (i.e., LG390N2T-A5) modules were $0.35/W and $0.40/W, respectively. The advantages of bifacial solar modules in terms of electricity generation were determined in [18] through numerical experiments, so we considered both monofacial and bifacial solar modules in this study. The unit prices of the monofacial and bifacial modules were $141.75 and $156.00, respectively. Table 1 shows the construction costs of the subject APV system. The total construction cost of the subject facility was $167,843.39. This included the solar module cost (28.56%), structure cost (47.27%), electric distribution system cost (22.52%), and other costs (1.65%). Due to additional costs (i.e., structure, electric distribution system, and other costs), the total cost was 3.5 times higher than the cost of the solar modules. The bifacial solar modules were more expensive (10.05%) than the monofacial solar modules in terms of unit construction cost. The lifespan of the subject APV system is expected to be 25 years, which is widely adopted or assumed in the solar power industry and in studies [19,20,21,22].
3. Selection Model of the APV System
In this section, we propose a selection model for the best APV system in terms of profit for the farmer. Section 3.1 provides management information on the five crops under the APV system. Section 3.2 introduces a polynomial regression model used to develop an estimation model of electricity generation by the APV system under multiple environmental variables. Section 3.3 provides the selection model based on the results of Section 3.1 and Section 3.2.
3.1. Crop Management under the APV System
In spring 2020, five different grain crops (sesame (Sesamum indicum), mung bean (Vigna radiata), red bean (Vigna angularis), corn (Zea mays), and soybean (Glycine max)) were planted under the APV facility in open-field conditions. According to the National Institute of Agricultural Science, RDA (available online: http://soil.rda.go.kr/soil/soilmap/characteristic.jsp, accessed on 1 April 2021), the soil type in the study location was Tongcheon (Tc, loam). During the crop growing season (June to October) in 2020, the average temperature and total rainfall were 23.55 °C and 1477.9 mm, respectively. Plots were arranged in a randomized completed block design with three replicates. The three different shading levels (i.e., shading ratios) of 21.3%, 25.6%, and 32% were compared with full sunlight (0% shade). These shading conditions were created using solar panels that reduced the incoming solar radiation by 21.3%, 25.6%, and 32%. The size of each subplot was 8 × 10 m (80 m2). Seeds of each crop were row planted with 20 cm row spacing. The plant density was 9 plants per square meter. The planting dates, harvest dates, and fertilizer rates differed by crop type and are summarized in Table 2. At harvest, the grain yields were collected and used for comparisons.
Table 3 shows the production costs of each crop type in the subject field (15 subplots of 80 m2). Note that the other costs (e.g., labor cost, overhead cost, and material costs excluding seed cost) were calculated by dividing the total cost by the number of crop types. This was because other resources (e.g., fertilizer) were shared across all 15 subplots. The total production costs for sesame, mung bean, red bean, corn, and soybean were $1252.82, $815.77, $799.59, $1285.20, and $670.09, respectively. Due to the different seed prices for each crop, the total production costs were also different. In South Korea, corn and sesame seed prices are relatively higher than those for the other crops [23]. The data in Table 3 are used to estimate the profit per crop type in Section 4.2.
3.2. Estimation Model of Electricity Generation by the APV System
A polynomial regression was used to develop an estimation model of electricity generation (Y) by the APV system. Polynomial regression is one of most popular supervised machine learning (ML) approaches due to its analytic capability [24,25]. Unlike other black-box ML approaches (e.g., deep learning and neural networks), it can identify the significance of independent variables [26]. Since independent variables have different influence on a response variable (i.e., Y), it is appropriate to utilize a polynomial regression as the modeling approach to understand the various relationships between independent variables and a response variable. In this study, the model considered eight independent variables: solar radiation (X1), daily maximum temperature (X2), daily minimum temperature (X3), daily precipitation (X4), humidity (X5), wind speed (X6), shading ratio (X7), and solar panel type (X8). In particular, the solar panel type (X8) is a binary variable with two options: (1) monofacial solar module or (2) bifacial solar module. Equation (2) presents the general polynomial regression model:
where is a polynomial function on , , , and . is a coefficient of and is a constant. represents the influence weight of on response variable Y. The developed model based on Equations (2) and (3) is shown in Equation (4). In the model, the unit of Y is kWh/day/ha.
The R2 value of the developed model was 93.89%. Thus, the model could accurately estimate the daily electricity generation by the APV system. Table 4 summarizes the environmental variables used in Equation (4).
3.3. Optimization Model for the Maximum Total Revenue
The developed polynomial regression model can be used to estimate the total profit of the APV system. Unlike in the optimization study with numerical experiments [18], we utilized the field study data of five crops for the optimization. Equation (5) represents the optimization formula which maximizes the total profit of a farmer. The function consists of two parts: (1) the profit from electricity generated by the solar module and (2) the profit from the sales of crops. The shading ratio (X7) and solar panel type (X8) are the decision variables. is a function returning the selection result (i.e., type k) of solar module ((1): a monofacial module with a shading ratio of 21.3%; (2): a monofacial module with a shading ratio of 25.6%; (3): a monofacial module with a shading ratio of 21%; (4): a bifacial module with a shading ratio of 21.3%; (5): a bifacial module with a shading ratio of 25.6%; and (6): a bifacial module with a shading ratio of 21%). is the profit from the electricity generated by the selected APV type. denotes the profit from crop type l under the selected APV type. is a binary variable to select the appropriate crop type l ((1): sesame; (2): mung bean; (3): red bean; (4): corn; or (5): soybean).
In Equation (6), the total profit of the APV system is equal to its total revenue minus its total cost. The total cost of an APV system includes the solar module cost, the structure cost to support the solar modules, an electric distribution system to transmit electricity, and other components such as a building permit and a license to link with an existing electric distribution system (see Table 1). Note that the total installation cost should be less than or equal to the available budget (see Equation (7)). Equation (8) is a constraint to make the optimization algorithm select only one crop type l. Equation (9) is a binary constraint for the five crop types (see Table 2). Equation (10) provides the definition of which determines the type of APV system based on and .
4. Results
4.1. Comparison between Solar Module Types
Table 5 presents a summary of electricity generation data collected from 12 June 2020 to 20 October 2020. These data include the performance of both the monofacial and bifacial solar modules under the same conditions in terms of generation duration and environmental conditions. For the average daily generation duration of 3.88 h, the total electricity generation quantity increased as the shading ratio increased. The 32% monofacial solar module generated a total electricity quantity of 110.13 kWh, while the 21.3% monofacial solar module generated a total electricity quantity of 55.07 kWh. This is because solar modules with a higher shading ratio (i.e., high density) can fit a greater number of solar modules within a unit area. The solar modules in the 21.3% case, 25.6% case, and 32% case contained 35 units, 56 units, and 70 units, respectively. Similar patterns were also observed in the experiment with bifacial solar modules. The total electricity generated by the bifacial solar modules in the 21.3% case, 25.6% case, and 32% case was 60.98 kWh, 97.57Wh, and 121.96 kWh, respectively. If we consider electricity generation per unit under these three cases, the quantity of electricity generated by the monofacial solar modules was 9.77% lower than that by the bifacial solar modules.
Although the monofacial and bifacial solar modules showed similar patterns in terms of electricity generation under the given conditions, the bifacial solar modules tended to generate more electricity than the monofacial modules (see Table 5). Approximately 10.74% more electricity was generated by the bifacial solar modules. Given that the System Marginal Price (SMP) of electricity in 2020 in South Korea was $0.07/kWh [27,28], the daily prices of electricity generated by a monofacial module and a bifacial module were estimated to be $0.11/unit/day and $0.12/unit/day, respectively.
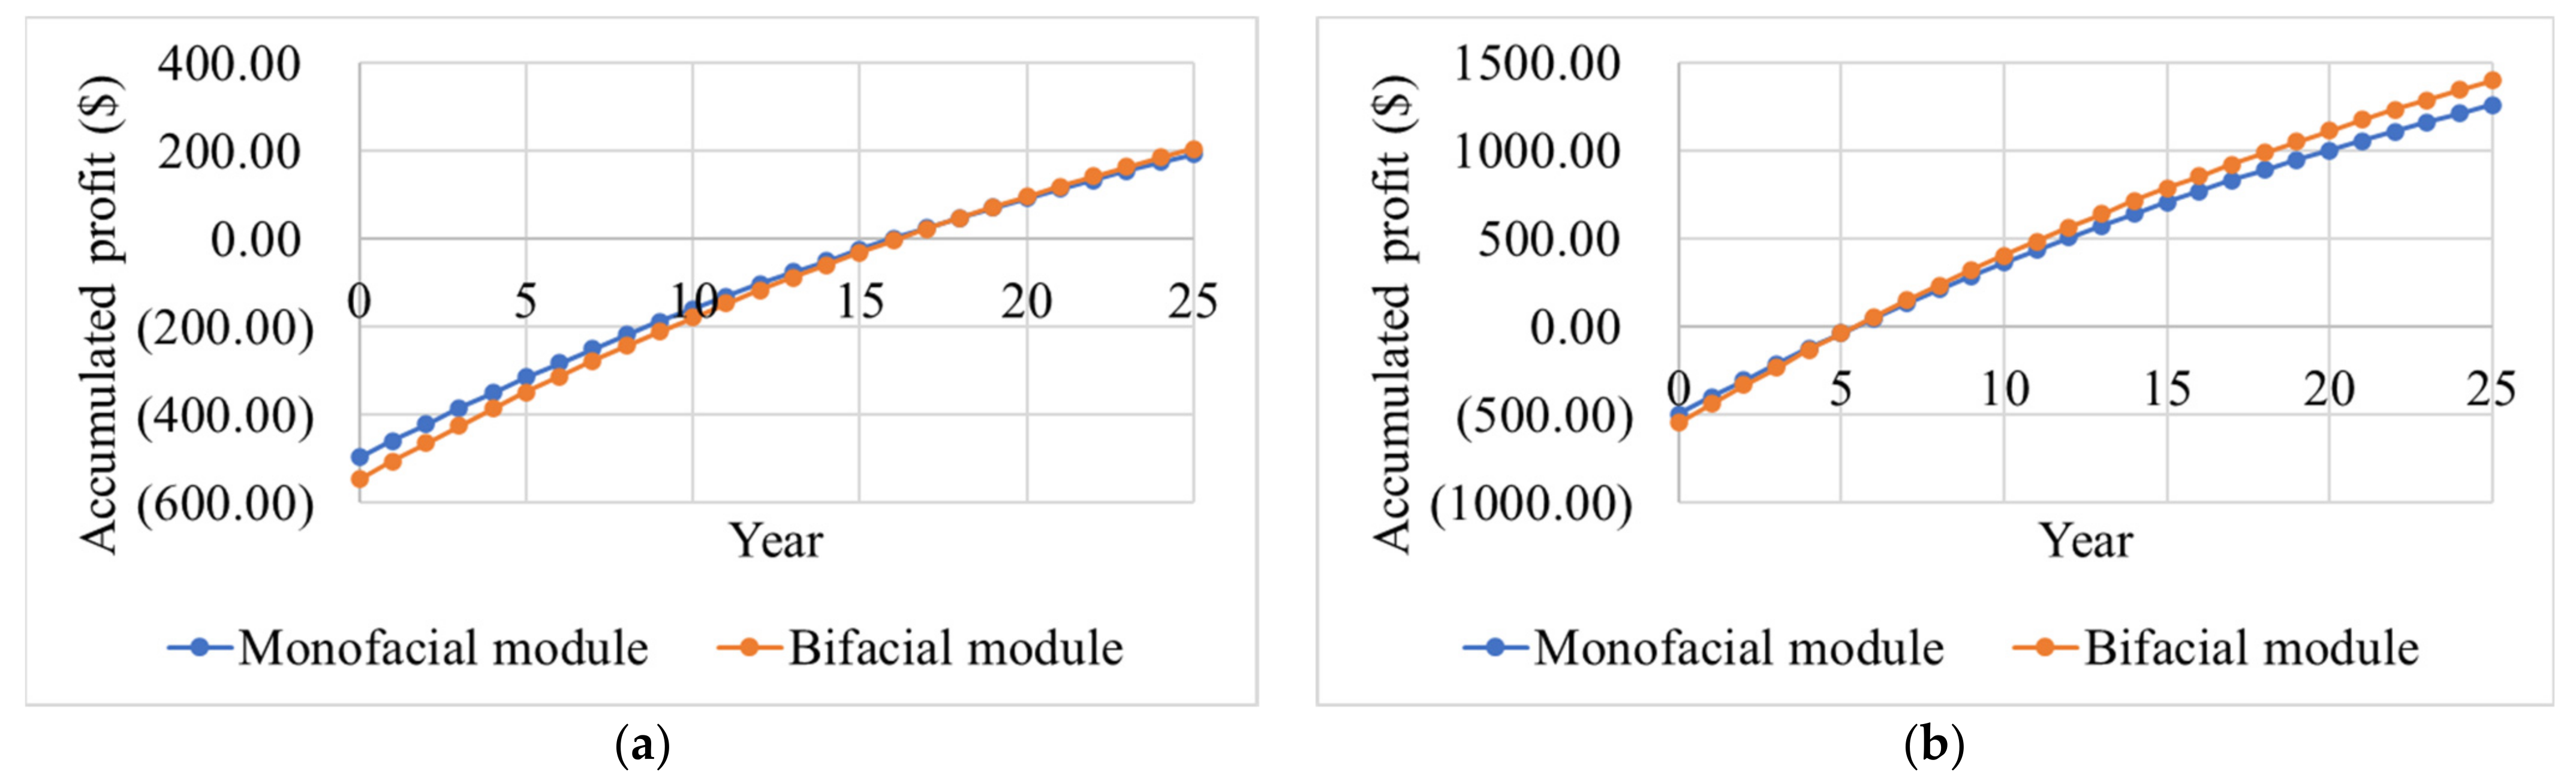
Figure 2 reveals the accumulated profit with a 25-year lifespan under an interest rate of 3%. In Figure 2a, the investment payback period for a monofacial module is 15 years. However, for a bifacial module, the investment payback period takes one more year due to its higher investment cost. The modules have investment payback periods of 13 and 14 years with interested rates of 1% and 2%, respectively. Thus, the investment payback period increases as the interest rate increases. Also, the monofacial module tends to have a shorter investment payback period, although its total profit over 25 years is lower than that of the bifacial module. However, both types still have investment payback periods of more than 10 years due to their high investment costs.
To overcome this low profitability issue, the Korean government provides two policies to farmers: (1) a loan at a rate of 1.75% to support 90% of the total construction cost and (2) a Renewable Energy Certificate (REC) or Renewable Energy Credit as an additional price to the SMP. The loan in the first policy can be paid back in installments over a 10-year period. The first repayment starts after five years. According to the REC policy with a rate of $0.11/kWh [29], the daily prices for electricity generated by a monofacial module and a bifacial module would be $0.28/unit/day and $0.31/unit/day, respectively. As intended by the Korean government, the investment payback periods for both solar module types are reduced to five years (see Figure 2b). In other words, the repayment begins when a farmer has an actual profit from his/her APV system.
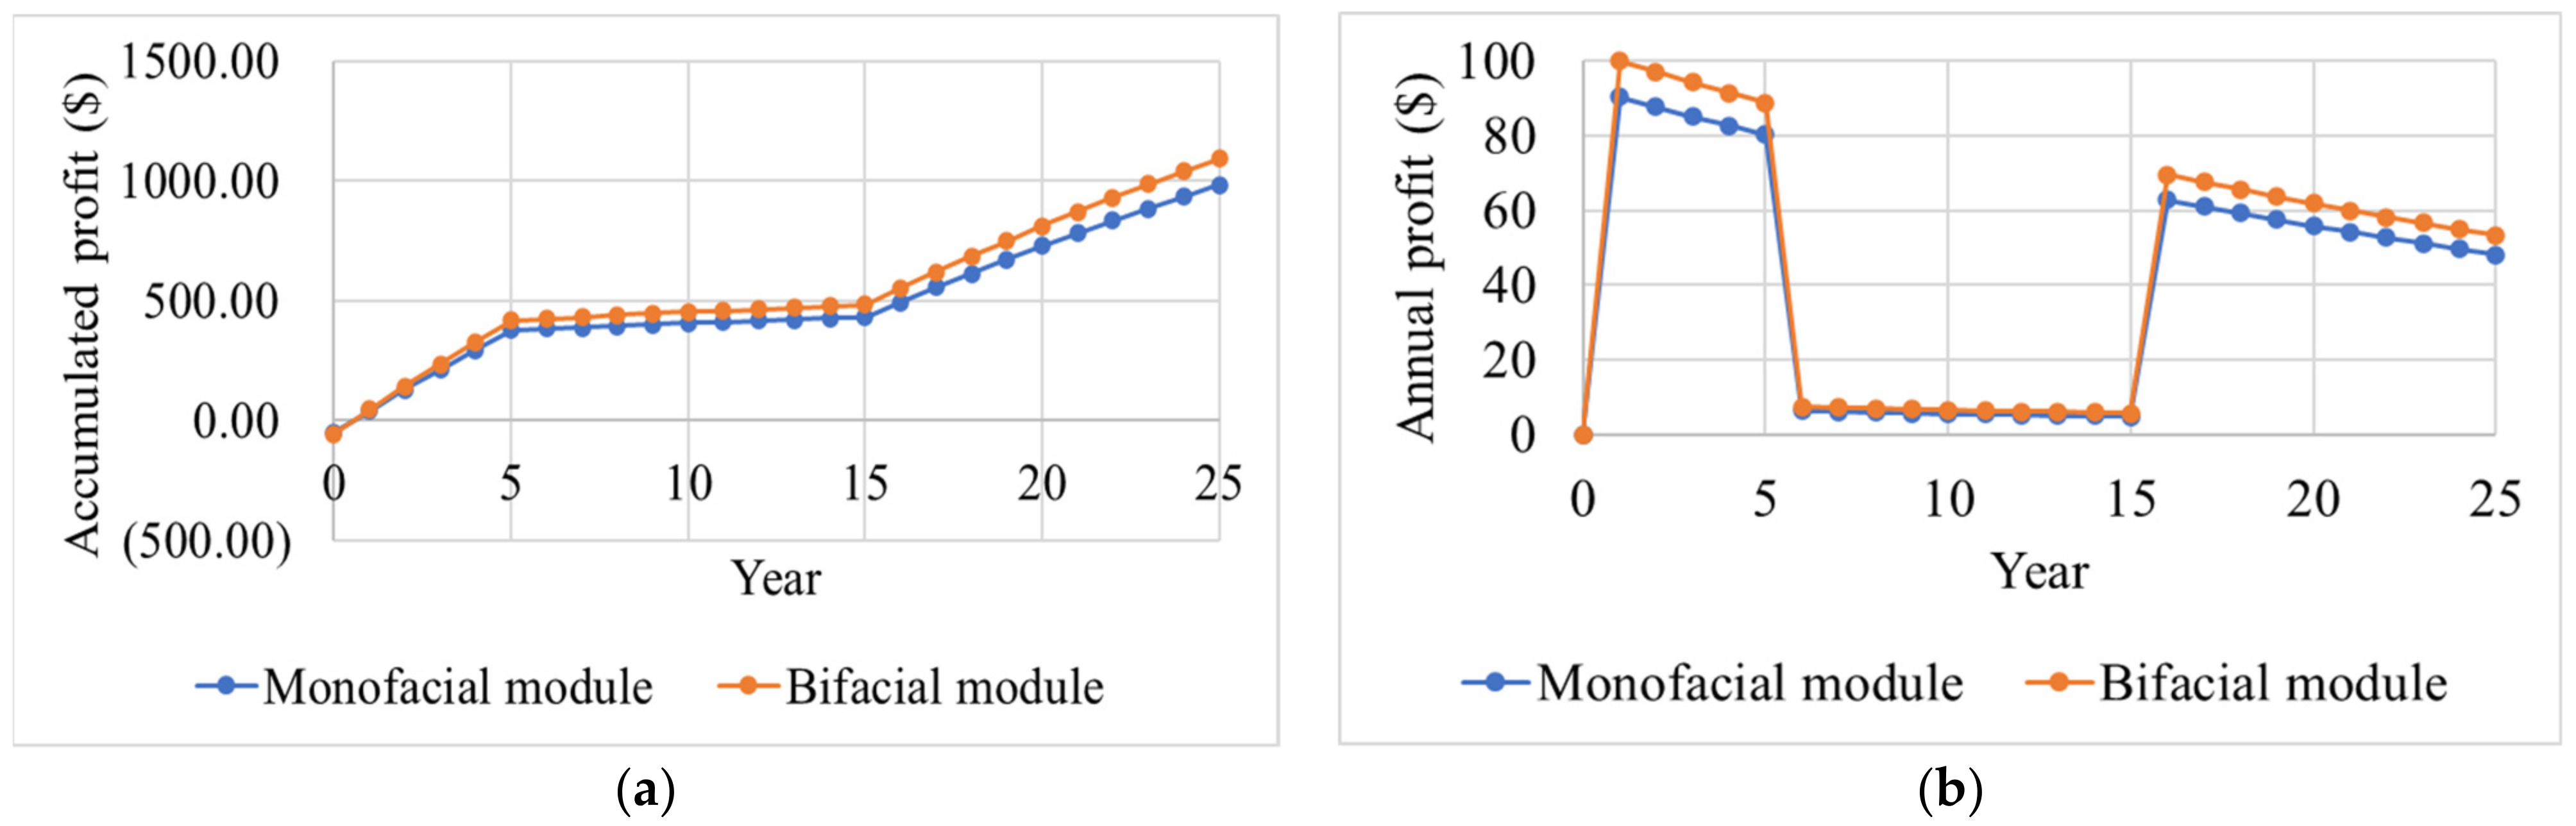
Figure 3 shows the accumulated profit of both solar modules when 90% of the total construction cost is paid by the loan provided by the Korean government. In Figure 3a, the accumulated profit rapidly increases during the first five years because there are no repayments on the loan. In other words, a farmer can make a profit within a year from his/her investment in the APV system. Repayments begin after five years. Thus, the accumulated profit slowly increases during the remaining lifespan of the APV system. After 15 years, the difference between the two modules in terms of the accumulated profit, shown in Figure 3a, increases over time. Figure 3b provides more detailed information about the annual profit from the APV system. In this case, both modules are profitable during their lifespans, except for the repayment period. Regarding the trends shown in Figure 2a,b and Figure 3a, the APV system can be profitable when the total construction cost is low (i.e., low investment) and when the SMP and REC are high (i.e., high annual revenue).
4.2. Crop Growth between Solar Module Types
The grain yields of sesame, mung bean, red bean, corn, and soybean under open sun conditions (0% shade) were 0.96, 1.95, 2.35, 8.09, and 3.64 Mg ha−1, respectively (Table 6). For most crops, shade had negative effects on their grain yields. Among the examined treatments, the open sun conditions had the highest grain yields, followed by a shade level of 21.3%, a shade level of 25.6%, and a shade level of 32%. However, the corn yield under a 21.3% shade level was increased by 6% in comparison with that under open sun conditions. Under a shade level of 21.3%, sesame and soybean showed only 7% and 13% yield losses, respectively, while mung bean and red bean under a shade level of 21.3% showed 21% and 26% yield losses, respectively. Under a shade level of 25.6%, among the five crops tested, sesame showed the lowest yield loss (14%), while mung bean and red bean showed the largest yield loss (35–44%). Under the highest shade level of 32%, sesame showed a significant yield loss (53%), while the other crops showed yield losses of 30–44%.
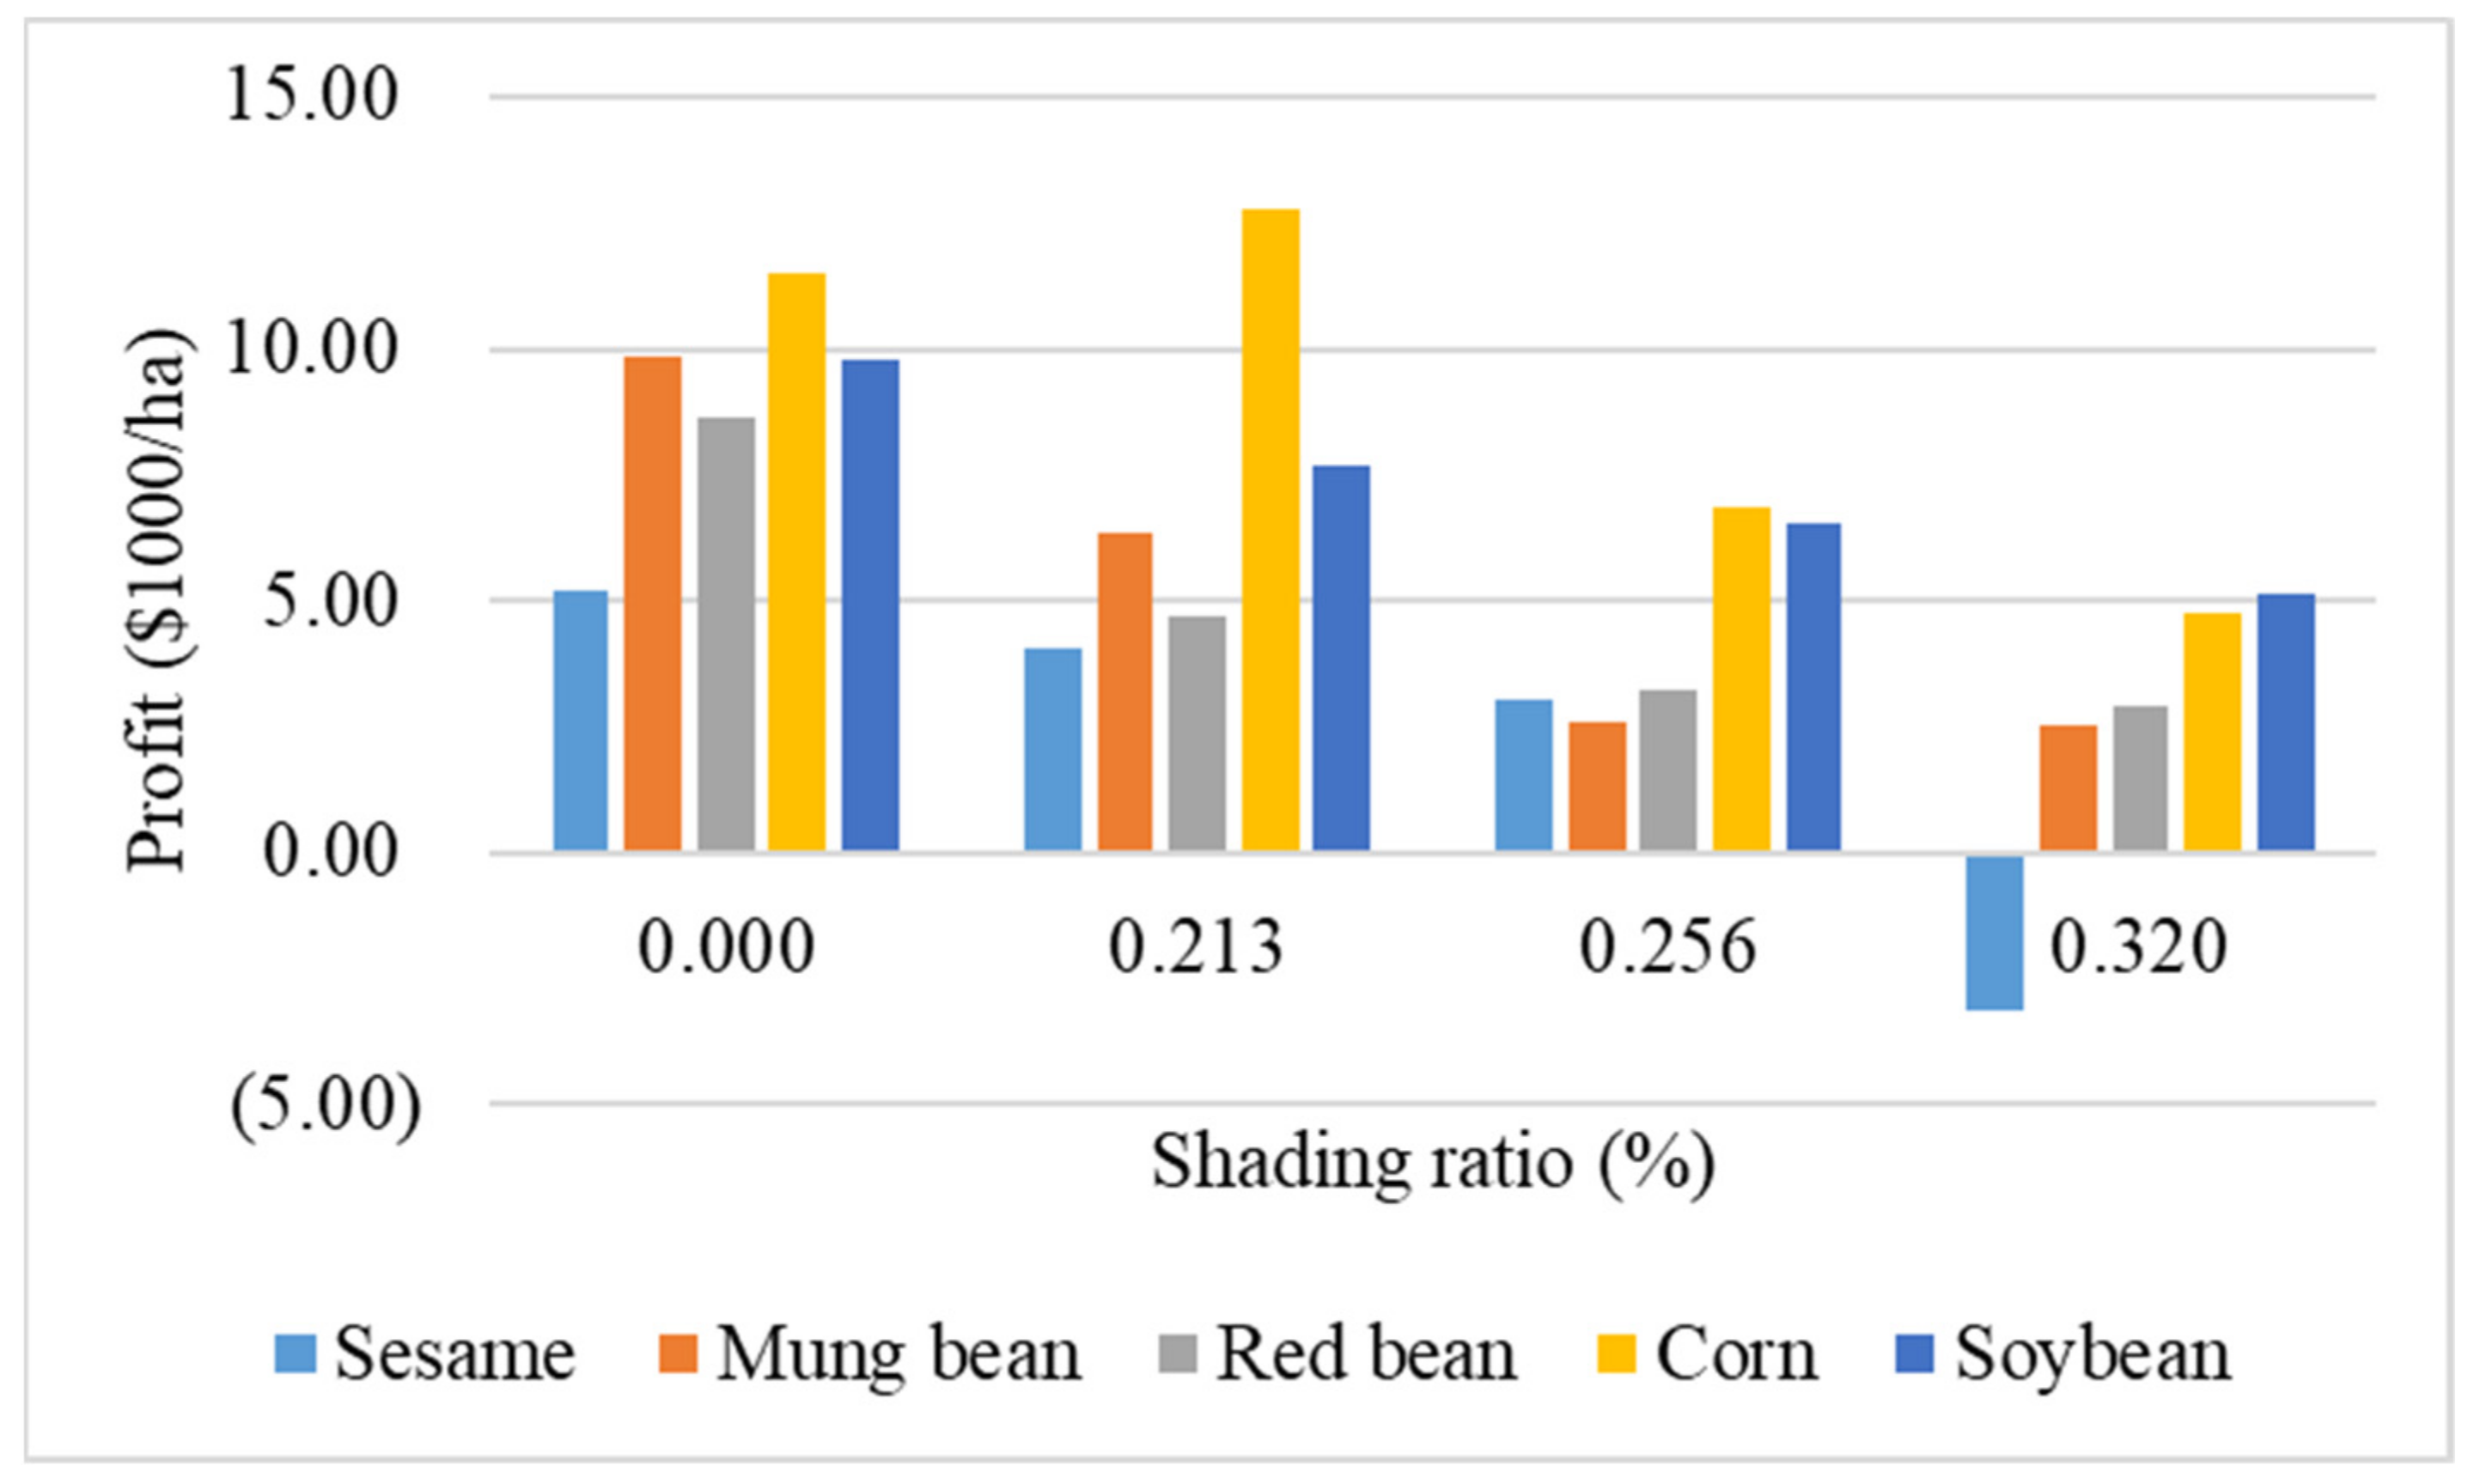
Figure 4 presents the profits from the five crops per hectare. These values were estimated from Table 3 and Table 5. The sale prices of sesame, mung bean, red bean, corn, and soybean are $16.27/kg, $8.54/kg, $6.50/kg, $2.74/kg, and $4.21/kg, respectively [30]. The profits from all the crops except corn decreased as the shading level increased. Only sesame had a negative profit at the 32% shading level. On the other hand, the profits from mung bean, red bean, corn, and soybean were positive under all four shading levels. In particular, corn had the highest profit at the 21.3 shading level due to the increased production yield (see Table 6). In addition, since the yields of mung bean and read bean were not significantly reduced at the 25.6% shading level, their profits did not show significant differences.
4.3. Identification of the Maximum Total Revenue for a Farmer
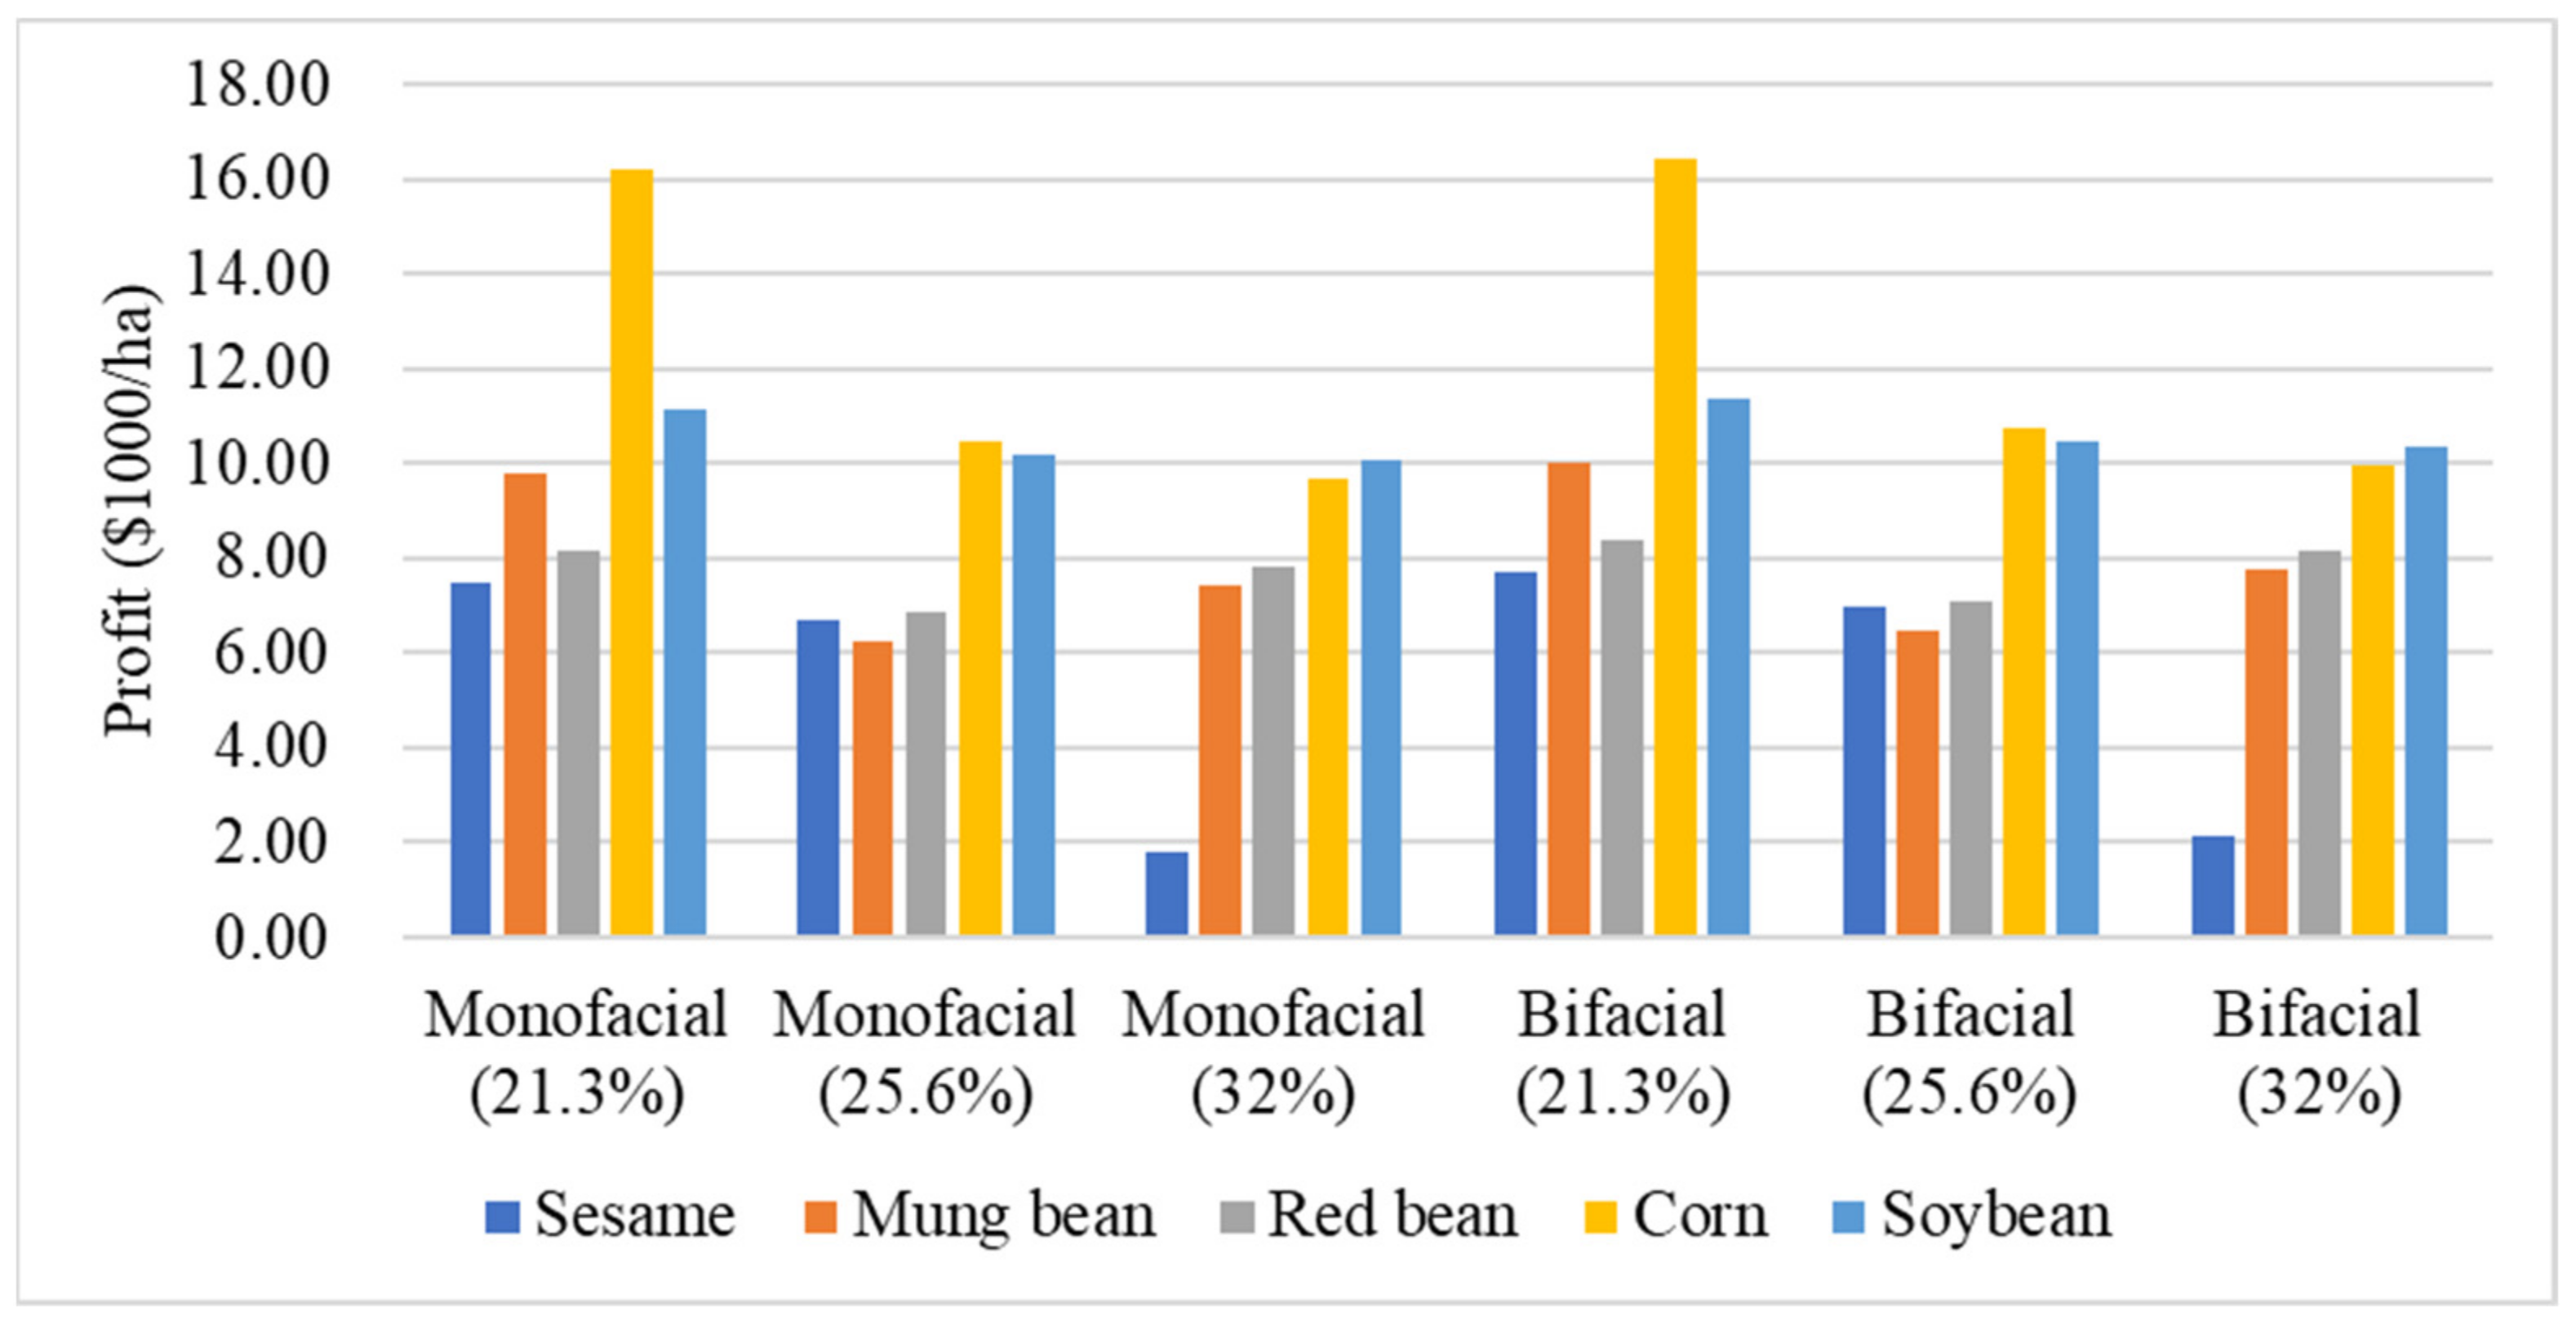
The best APV type was identified in terms of the total profit according to Equation (5). The non-linear Generalized Reduced Gradient (GRG) method was utilized with a Windows 10 based computer (i.e., Intel Core i5-8250U CPU @ 1.60GHz) for optimization [31]. Corn farming under the bifacial module with a shading ratio of 21.3% was selected as the best APV type. Its annual total profit was $16,420.57 per hectare. Although a higher shading ratio increased the profit given by electricity generation, it also significantly decreased the profit from crop production. On average, the profit from crop production ($5082.11) was 23% higher than the profit from electricity generation ($4136.41). This implies that the total profit is largely dependent on crop production. As shown in Figure 4, each crop provided different profits under the four shading levels, with corn having the highest profit among the five crop types. Due to this reason, in Figure 5, corn provided the highest profit in the monofacial solar module, as well as in the bifacial solar module. On the other hand, the APV system is not beneficial to a farmer who cultivates red bean because its total profit was even lower than its original profit without an APV system (i.e., $8616.74 per hectare).
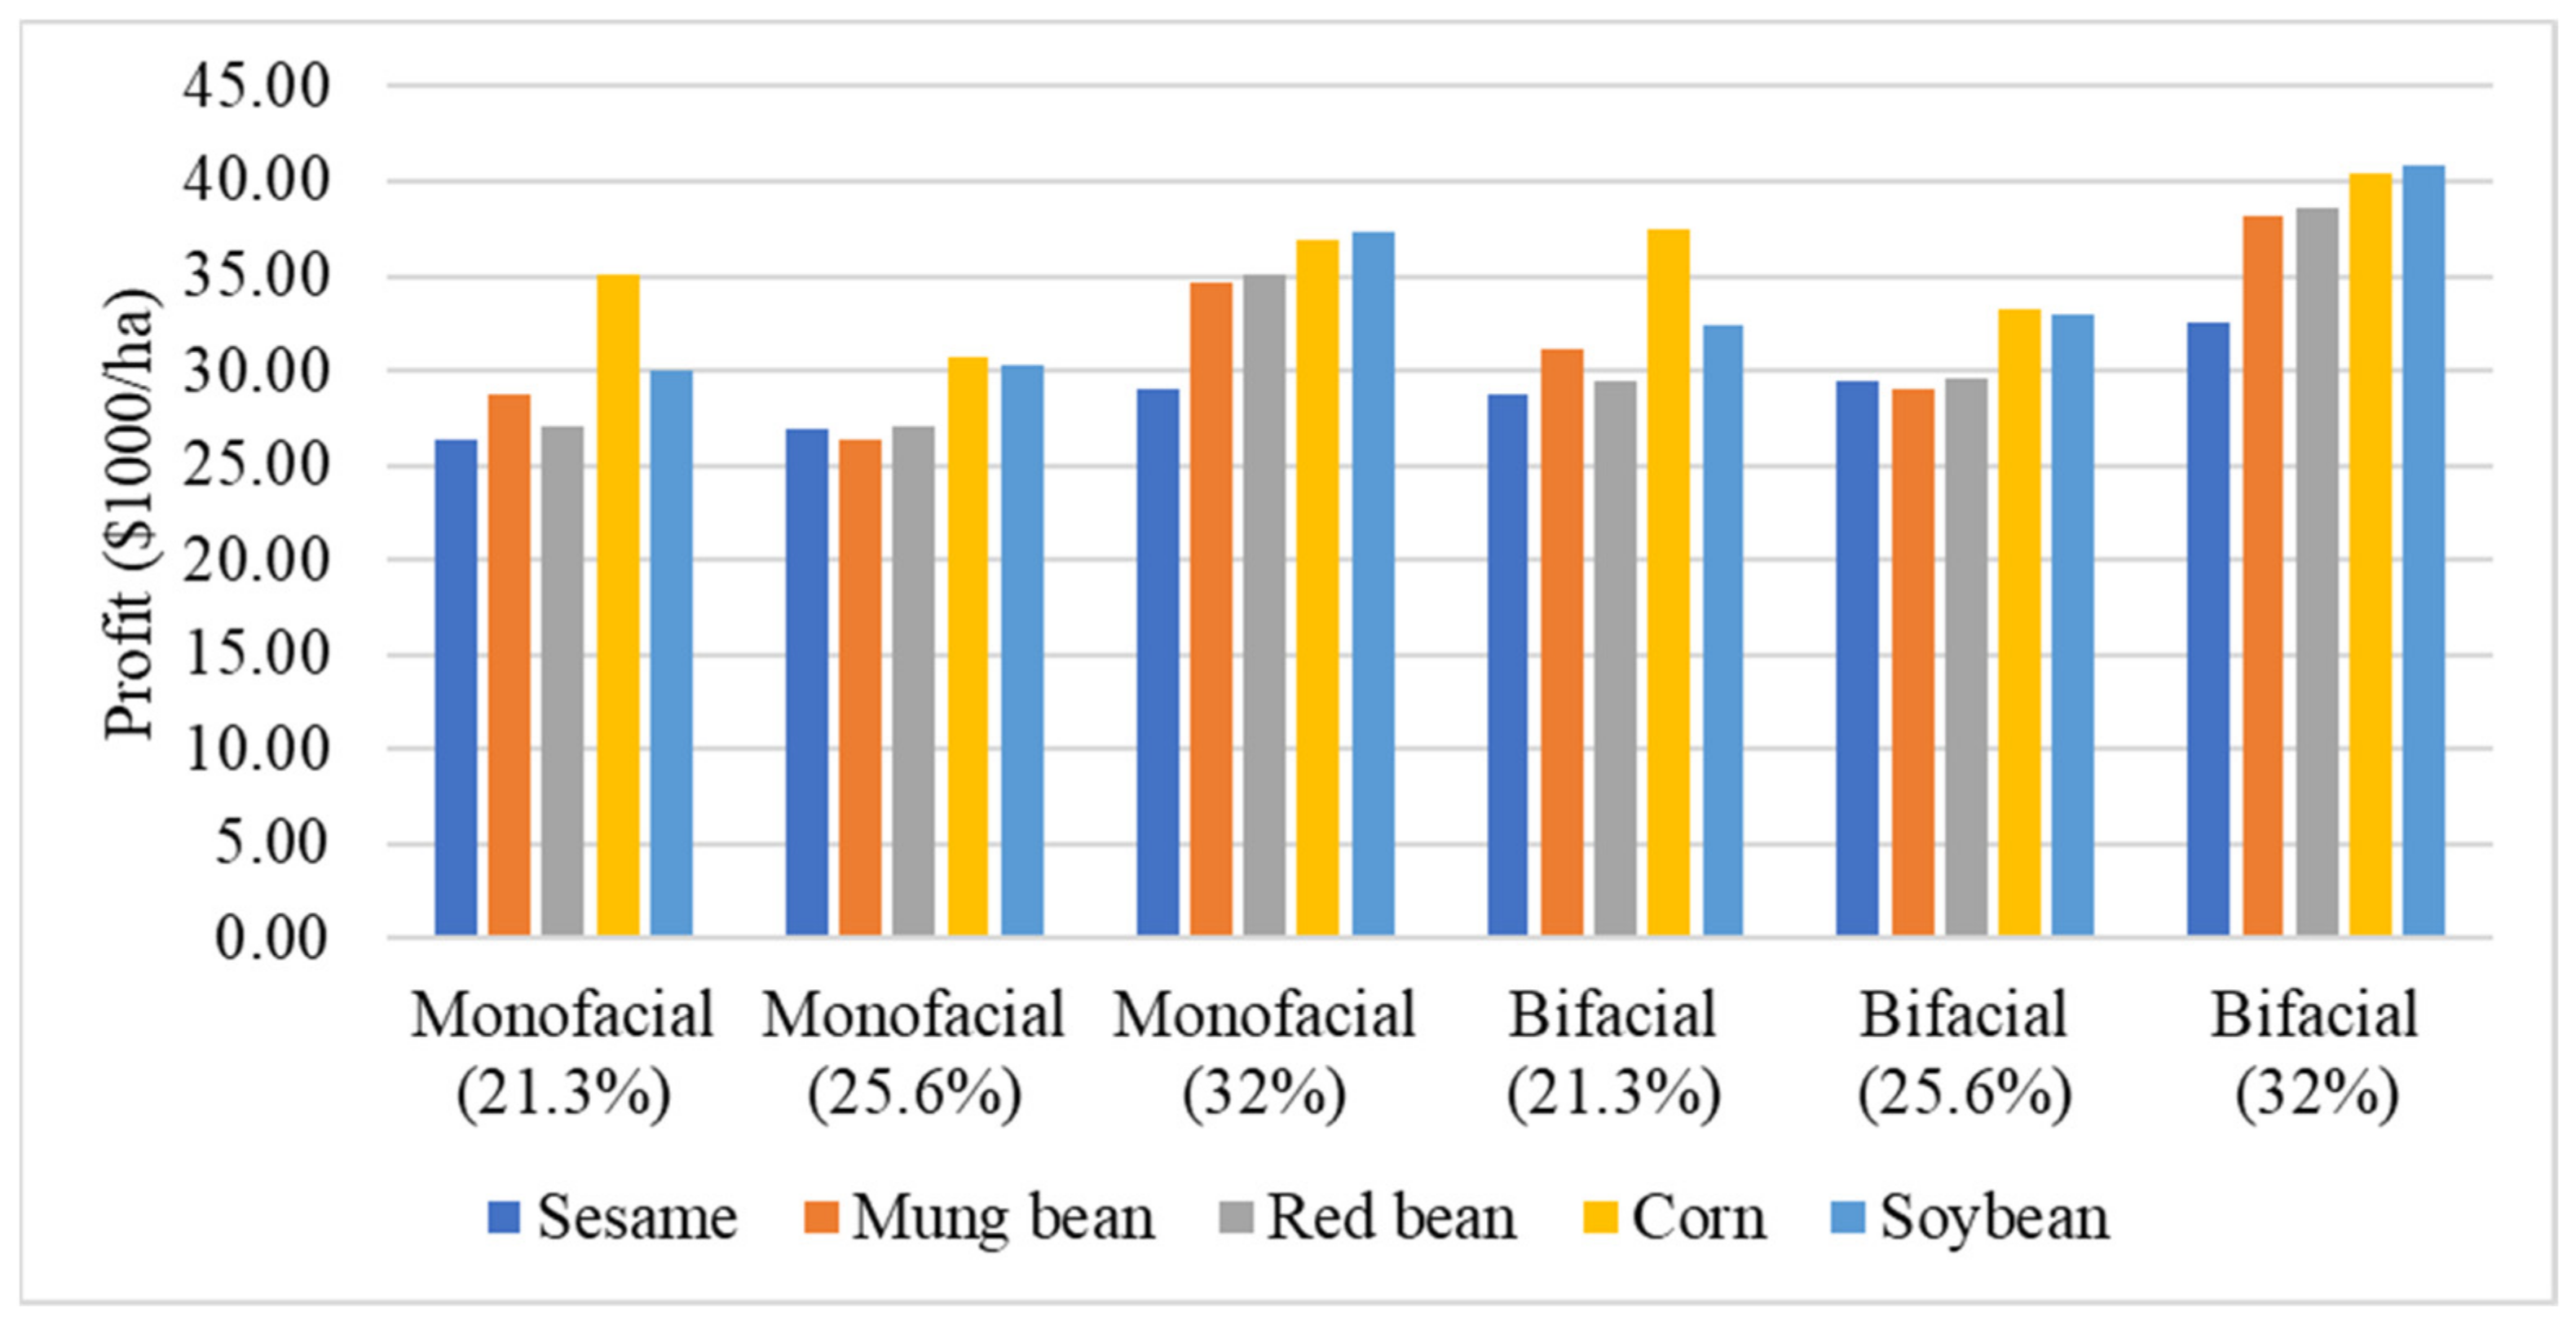
However, when considering an REC in addition to the SMP, soybean farming under the bifacial module with a shading ratio of 32% was selected as the best APV type (see Figure 6). Its annual total profit was $40,781.04 per hectare. On average, the profit from crop production ($5082.11) was much smaller than the profit from electricity generation ($27,514.19). Since the REC offers an additional $23,377.78 per hectare on average, crop production could not significantly affect the total profit. In this case, all crops could be cultivated under the APV system, because the APV system can significantly increase the profit above that from farming without the APV system. On average, the profit per hectare is 3 times greater (i.e., $27,514.19) than the farmer’s original profit (i.e., $8977.94 per hectare). Nevertheless, as the REC decreases, the farmer must focus more on crop cultivation to maintain his/her profit.
5. Conclusions
In this study, we proposed an efficient structure for an APV system in a temperate climate region. Two types of solar modules (a monofacial solar module and a bifacial solar module) with different shading ratios (i.e., 21.3%, 25.6%, 32%) were considered as alternatives. The proposed structure was established at the Jeollanamdo Agricultural Research and Extension Services in Naju-si (35.0161° N, 126.7108° E), Jeollanam-do, South Korea. The southeastern region selected is the most preferable location due to its potential capacity for electricity generation. The daily electricity generation quantities of the monofacial solar module and bifacial solar module were 1.57 kWh/unit and 1.74 kWh/unit, respectively. Because of the different efficiency in terms of electricity generation, a bifacial solar module is more beneficial than a monofacial solar module to farmers in terms of profit. Under the SMP policy, the annual profit of the APV system based on corn farming is $16,420.57 per hectare. The bifacial module with a shading ratio of 21.3% was selected as the most profitable APV type. On the other hand, if both REC and SMP policies are applied to an APV system, soybean farming with a 32% bifacial module can make $40,781.04 per hectare annually. Nevertheless, considering that the price of the REC radically changes over time, a farmer needs to consider the APV system as a way to make an extra income in addition to crop production. The government also needs to pursue a policy for stable REC prices so that farmers can have stable and sustainable incomes from APV systems. As a result, the proposed APV system can produce not only monetary benefit from electricity generation but also profits from crop sales. This can be a new revenue model for farmers. Since most farmers cannot run their business during the winter season in a temperate climate region, this result is critical to their survival. In addition, by generating cleaner energy, the subject system can contribute to the survival of humankind in the future.
Author Contributions
Conceptualization, S.K. (Sumin Kim) and S.K. (Sojung Kim); Methodology, S.K. (Sumin Kim) and S.K. (Sojung Kim); Software, S.K. (Sumin Kim) and S.K. (Sojung Kim); Validation, S.K. (Sumin Kim) and S.K. (Sojung Kim); Formal analysis, S.K. (Sumin Kim) and S.K. (Sojung Kim); Investigation, S.K. (Sumin Kim), C.-Y.Y. and S.K. (Sojung Kim); Resources, C.-Y.Y.; writing—original draft preparation, S.K. (Sumin Kim) and S.K. (Sojung Kim); Writing—review and editing, C.-Y.Y., S.K. (Sumin Kim) and S.K. (Sojung Kim); Visualization, S.K. (Sumin Kim) and S.K. (Sojung Kim); Supervision, S.K. (Sumin Kim) and S.K. (Sojung Kim); Project administration, C.-Y.Y.; Funding acquisition, C.-Y.Y. and S.K. (Sojung Kim). All authors have read and agreed to the published version of the manuscript.
Funding
This work was supported by the KEPCO Research Institute. Also, this work was supported by the National Research Foundation of Korea (NRF) grant funded by the Korea government (MSIT) (No. 2021R1F1A1045855).
Institutional Review Board Statement
Not applicable.
Informed Consent Statement
Not applicable.
Data Availability Statement
Not applicable.
Conflicts of Interest
The authors declare no conflict of interest.
References
- Kannan, N.; Vakeesan, D. Solar energy for future world: A review. Renew. Sustain. Energy Rev. 2016, 62, 1092–1105. [Google Scholar] [CrossRef]
- IEA. Projected Costs of Generating Electricity 2020. Available online: https://www.iea.org/reports/projected-costs-of-generating-electricity-2020 (accessed on 16 March 2021).
- Pehl, M.; Arvesen, A.; Humpenöder, F.; Popp, A.; Hertwich, E.G.; Luderer, G. Understanding future emissions from low-carbon power systems by integration of life-cycle assessment and integrated energy modelling. Nat. Energy 2017, 2, 939–945. [Google Scholar] [CrossRef]
- Chen, W.M.; Kim, H.; Yamaguchi, H. Renewable energy in eastern Asia: Renewable energy policy review and comparative SWOT analysis for promoting renewable energy in Japan, South Korea, and Taiwan. Energy Policy 2014, 74, 319–329. [Google Scholar] [CrossRef]
- Congressional Budget Office. Impose a Tax on Emissions of Greenhous Gases. Available online: https://www.cbo.gov/budget-options/54821 (accessed on 21 December 2020).
- Korea Energy Agency. Feed in Tariff (FIT). Available online: https://www.knrec.or.kr/business/rps_support.aspx (accessed on 18 March 2021).
- HIS Markit, China’s New 2020 Climate Commitments: Beyond Peak Emissions. Available online: https://ihsmarkit.com/research-analysis/chinas-updated-2030-climate-targets-beyond-carbon-peak.html (accessed on 18 March 2021).
- IEA International Energy Agency. National Survey Report of PV Power Applications in JAPAN 2016. Available online: https://iea-pvps.org/wp-content/uploads/2020/01/National_Survey_Report_of_PV_Power_Applications_in_Japan_-_2016.pdf (accessed on 18 March 2021).
- Ministry of Trade, Industry and Energy. The 3020 Renewable Energy Policy. Available online: https://www.etrans.or.kr/policy/04.php (accessed on 18 March 2021).
- UN Data. Global Solar Radiation. Available online: http://data.un.org/Data.aspx?d=CLINO&f=ElementCode%3A33 (accessed on 12 February 2021).
- Statistics KOREA. A Trend of Duration of Bright Sunshine in 2019. Available online: http://index.go.kr/potal/main/EachDtlPageDetail.do?idx_cd=1402 (accessed on 18 March 2021).
- Nematollahi, O.; Kim, K.C. A feasibility study of solar energy in South Korea. Renew. Sustain. Energy Rev. 2017, 77, 566–579. [Google Scholar] [CrossRef]
- Alsharif, M.H.; Kim, J.; Kim, J.H. Opportunities and challenges of solar and wind energy in South Korea: A review. Sustainability 2018, 10, 1822. [Google Scholar] [CrossRef] [Green Version]
- Kim, S.; Lee, H.; Kim, H.; Jang, D.H.; Kim, H.J.; Hur, J.; Hur, K. Improvement in policy and proactive interconnection procedure for renewable energy expansion in South Korea. Renew. Sustain. Energy Rev. 2018, 98, 150–162. [Google Scholar] [CrossRef]
- Statistics Korea. Cultivated Acreage by City. Available online: https://kosis.kr/statHtml/statHtml.do?orgId=101&tblId=DT_1EB002 (accessed on 2 March 2021).
- Weselek, A.; Ehmann, A.; Zikeli, S.; Lewandowski, I.; Schindele, S.; Högy, P. Agrophotovoltaic systems: Applications, challenges, and opportunities. A review. Agron. Sustain. Dev. 2019, 39, 1–20. [Google Scholar] [CrossRef]
- Brohm, R.; Khanh, N. Dual-Use Approaches for Solar Energy and Food Production International Experience and Potentials for Viet Nam. Green Innovation and Development Centre (GreenID): Hanoi, Vietnam, 2018; pp. 51–52. [Google Scholar]
- Zohdi, T.I. A digital-twin and machine-learning framework for the design of multiobjective agrophotovoltaic solar farms. Comput. Mech. 2021, 68, 357–370. [Google Scholar] [CrossRef]
- Kim, K.A.; Shenoy, P.S.; Krein, P.T. Converter rating analysis for photovoltaic differential power processing systems. IEEE Trans. Power Electron. 2014, 30, 1987–1997. [Google Scholar] [CrossRef]
- LG. LG Solar Module Limited Warranty. Available online: https://www.lg.com/us/business/download/resources/BT00002151/BT00002151_2573.pdf (accessed on 1 April 2021).
- Kannan, R.; Leong, K.C.; Osman, R.; Ho, H.K.; Tso, C.P. Life cycle assessment study of solar PV systems: An example of a 2.7 kWp distributed solar PV system in Singapore. Sol. Energy 2006, 80, 555–563. [Google Scholar] [CrossRef]
- Kumar, A.; Chowdhury, A. Advanced radiative cooler for multi-crystalline silicon solar module. Sol. Energy 2020, 201, 751–759. [Google Scholar] [CrossRef]
- Korea Seed & Variety Service. A Supply Price of Seeds. Available online: https://www.seed.go.kr/seed/183/subview.do (accessed on 28 April 2021).
- Yoon, C.Y.; Kim, S.; An, K.N.; Kim, S. Simulated impacts of rainfall extremes on yield responses of various barley varieties in a temperate region. Int. Agrophys. 2021, 35, 119–129. [Google Scholar] [CrossRef]
- Kim, S.; Meng, C.; Son, Y.J. Simulation-based machine shop operations scheduling system for energy cost reduction. Simul. Model. Pract. Theory 2017, 77, 68–83. [Google Scholar] [CrossRef]
- Kim, S.; Kim, S.; Cho, J.; Park, S.; Jarrín Perez, F.X.; Kiniry, J.R. Simulated biomass, climate change impacts, and nitrogen management to achieve switchgrass biofuel production at diverse sites in US. Agronomy 2020, 10, 503. [Google Scholar] [CrossRef] [Green Version]
- Korea Electric Power Corporation. A Price of the System Marginal Price. Available online: https://home.kepco.co.kr/kepco/CO/D/E/CODEPP002/list.do (accessed on 20 April 2021).
- EPSIS. Unit Price of Electricity by Type. Available online: http://epsis.kpx.or.kr/epsisnew/selectEkmaUpsBftChart.do?menuId=040701 (accessed on 1 April 2021).
- Korea Power Exchange. A Price of the Renewable Energy Certificate. Available online: https://onerec.kmos.kr/portal/index.do (accessed on 20 April 2021).
- Korea Agro-Fisheries & Food Trade Co. Sales Price of Agricultural Products. Available online: https://www.kamis.or.kr/customer/main/main.do (accessed on 20 March 2021).
- Hasanien, H.M. Performance improvement of photovoltaic power systems using an optimal control strategy based on whale optimization algorithm. Electr. Power Syst. Res. 2018, 157, 168–176. [Google Scholar] [CrossRef]
Figure 1.
Overview of the subject APV system: (a) Solar modules with three different shading ratios; (b) Crop production under the subject APV system. APV: Agrophotovoltaic.
Figure 1.
Overview of the subject APV system: (a) Solar modules with three different shading ratios; (b) Crop production under the subject APV system. APV: Agrophotovoltaic.

Figure 2.
Accumulated profit of two types of solar modules: (a) SMP only; (b) SMP and REC. SMP: System Marginal Price; REC: Renewable Energy Certificate.
Figure 2.
Accumulated profit of two types of solar modules: (a) SMP only; (b) SMP and REC. SMP: System Marginal Price; REC: Renewable Energy Certificate.

Figure 3.
Profits from the two types of solar modules with a loan at a rate of 1.75%: (a) Accumulated profit; (b) Annual (non-accumulated) profit.
Figure 3.
Profits from the two types of solar modules with a loan at a rate of 1.75%: (a) Accumulated profit; (b) Annual (non-accumulated) profit.

Figure 4.
Estimated profits from five crops grown under four different shading levels (0, 21.3, 25.6, and 32).
Figure 4.
Estimated profits from five crops grown under four different shading levels (0, 21.3, 25.6, and 32).

Figure 5.
Estimated profits of the five crops grown under the six APV types (SMP-only case).

Figure 6.
Estimated profits of the five crops grown under the six APV types (SMP and REC case).


Table 1.
Construction costs of the APV system.
| Data Type | Monofacial Solar Modules | Bifacial Solar Modules | ||||
|---|---|---|---|---|---|---|
| 21.3% | 25.6% | 32% | 21.3% | 25.6% | 32% | |
| Number of solar modules (units) | 35 | 56 | 70 | 35 | 56 | 70 |
| Total construction cost ($) | 17,370.72 | 27,793.14 | 34,741.43 | 19,116.98 | 30,587.16 | 38,233.96 |
| Solar module cost ($) | 4961.25 | 7938.00 | 9922.50 | 5460.00 | 8736.00 | 10,920.00 |
| Structure cost ($) | 8211.81 | 13,138.90 | 16,423.63 | 9037.34 | 14,459.75 | 18,074.68 |
| Electric distribution system cost ($) | 3911.23 | 6257.97 | 7822.46 | 4304.43 | 6887.08 | 8608.85 |
| Other costs ($) 1 | 286.42 | 458.27 | 572.84 | 315.21 | 504.34 | 630.42 |
| Unit construction cost ($/module) | 496.31 | 496.31 | 496.31 | 156.00 | 156.00 | 156.00 |
| Unit construction cost ($/ha) | 153,180.91 | 163,392.97 | 220,580.51 | 168,580.05 | 179,818.72 | 242,755.27 |
1 The cost includes a building permit fee and a fee for linkage to an existing electric distribution system.
Table 2.
Planting dates, harvesting dates, and fertilizer rates of cropping management for all five grain crops used in this study.
Table 2.
Planting dates, harvesting dates, and fertilizer rates of cropping management for all five grain crops used in this study.
| Crop Type | Planting Date | Harvesting Date | Fertilizer Rate |
|---|---|---|---|
| (N-P-K, Kg ha−1) | |||
| Sesame | June 16th | Sep. 10th | 30-30-34 |
| Mung bean | July 3rd | Sep. 14th | 30-30-34 |
| Red bean | July 3rd | Oct. 12th | 30-30-34 |
| Corn | May 26th | Aug. 18th | 150-30-60 |
| Soybean | June 17th | Oct. 24th | 29-31-32 |
Table 3.
Production costs of all five grain crops used in this study.
| Crop Type | Material Cost ($) | Labor Cost 1 ($) | Overhead Cost 1 ($) | |||
|---|---|---|---|---|---|---|
| Seed | Fertilizer 1 | Pesticides 1 | Other 1 | |||
| Sesame | 776.98 | 43.38 | 28.06 | 22.80 | 34.43 | 347.17 |
| Mung bean | 339.93 | 43.38 | 28.06 | 22.80 | 34.43 | 347.17 |
| Red bean | 323.74 | 43.38 | 28.06 | 22.80 | 34.43 | 347.17 |
| Corn | 809.35 | 43.38 | 28.06 | 22.80 | 34.43 | 347.17 |
| Soybean | 194.24 | 43.38 | 28.06 | 22.80 | 34.43 | 347.17 |
1 The total cost in each category divided by the number of crop types.
Table 4.
Daily information on the environmental variables.
| Average | Min | Max | Std Dev | |
|---|---|---|---|---|
| Solar radiation (MJ/m2) | 3.24 | 0.36 | 6.18 | 1.40 |
| Max temperature (°C) | 29.00 | 18.90 | 38.10 | 4.39 |
| Min temperature (°C) | 18.67 | 3.60 | 27.00 | 5.61 |
| Precipitation (mm) | 11.24 | 0.00 | 262.60 | 28.55 |
| Humidity (%) | 74.20 | 35.53 | 94.26 | 12.12 |
| Wind speed (m/s) | 1.97 | 0.91 | 19.58 | 1.70 |
Table 5.
Electricity generation data from the APV system.
| Data Type | Monofacial Solar Modules | Bifacial Solar Modules | |||||
|---|---|---|---|---|---|---|---|
| 21.3% | 25.6% | 32% | 21.3% | 25.6% | 32% | ||
| Generation duration (h/day) | Average | 3.88 | 3.88 | 3.88 | 3.88 | 3.88 | 3.88 |
| Std Dev | 1.69 | 1.69 | 1.69 | 1.69 | 1.69 | 1.69 | |
| Generation quantity (kWh/day) | Average | 55.07 | 88.11 | 110.13 | 60.98 | 97.57 | 121.96 |
| Std Dev | 23.90 | 38.24 | 47.80 | 26.47 | 42.34 | 52.93 | |
| Generation quantity (kWh/year) 1 | Average | 17,597.44 | 28,155.27 | 35,191.69 | 19,485.97 | 31,178.18 | 38,971.93 |
| Std Dev | 1039.92 | 1663.84 | 2079.66 | 1151.53 | 1842.48 | 2303.05 | |
| Unit generation quantity (kWh/day/ha) | Average | 485.59 | 517.96 | 699.25 | 537.75 | 573.60 | 774.35 |
| Std Dev | 210.75 | 224.80 | 303.47 | 233.38 | 248.94 | 336.07 | |
| Generation quantity (MWh/year/ha) 1 | Average | 155.18 | 165.52 | 223.44 | 171.83 | 183.29 | 247.44 |
| Std Dev | 9.17 | 9.78 | 13.20 | 10.15 | 10.83 | 14.62 | |
Table 6.
Harvested grain yields of all five crops grown under four different shading levels (0, 21.3, 25.6, and 32%). The numbers in parentheses indicate loss (−) or gain (+) in yield compared to the yield without shading.
Table 6.
Harvested grain yields of all five crops grown under four different shading levels (0, 21.3, 25.6, and 32%). The numbers in parentheses indicate loss (−) or gain (+) in yield compared to the yield without shading.
| Crop Type | Shading Levels (%) | |||
|---|---|---|---|---|
| 0 | 21.3 | 25.6 | 32 | |
| Total grain yield (Mg ha−1) | ||||
| Sesame | 0.96 | 0.89 (−7%) | 0.83 (−14%) | 0.45 (−53%) |
| Mung bean | 1.95 | 1.54 (−21%) | 1.1 (−44%) | 1.09 (−44%) |
| Red bean | 2.35 | 1.75 (−26%) | 1.52 (−35%) | 1.47 (−37%) |
| Corn | 8.09 | 8.56 (+6%) | 6.4 (−21%) | 5.63 (−30%) |
| Soybean | 3.64 | 3.15 (−13%) | 2.88 (−21%) | 2.54 (−30%) |
Publisher’s Note: MDPI stays neutral with regard to jurisdictional claims in published maps and institutional affiliations. |
© 2021 by the authors. Licensee MDPI, Basel, Switzerland. This article is an open access article distributed under the terms and conditions of the Creative Commons Attribution (CC BY) license (https://creativecommons.org/licenses/by/4.0/).
Share and Cite
MDPI and ACS Style
Kim, S.; Kim, S.; Yoon, C.-Y. An Efficient Structure of an Agrophotovoltaic System in a Temperate Climate Region. Agronomy 2021, 11, 1584. https://0-doi-org.brum.beds.ac.uk/10.3390/agronomy11081584
AMA Style
Kim S, Kim S, Yoon C-Y. An Efficient Structure of an Agrophotovoltaic System in a Temperate Climate Region. Agronomy. 2021; 11(8):1584. https://0-doi-org.brum.beds.ac.uk/10.3390/agronomy11081584
Chicago/Turabian StyleKim, Sojung, Sumin Kim, and Chang-Yong Yoon. 2021. "An Efficient Structure of an Agrophotovoltaic System in a Temperate Climate Region" Agronomy 11, no. 8: 1584. https://0-doi-org.brum.beds.ac.uk/10.3390/agronomy11081584
Note that from the first issue of 2016, this journal uses article numbers instead of page numbers. See further details here.