Article

Niche Shifts, Hybridization, Polyploidy and Geographic Parthenogenesis in Western North American Hawthorns (Crataegus subg. Sanguineae, Rosaceae)

1
Green Plant Herbarium (TRT), Department of Natural History, Royal Ontario Museum, 100 Queen’s Park, Toronto, ON M5S 2C6, Canada
2
Department of Ecology & Evolutionary Biology, University of Toronto, 25 Willcocks Street, Toronto, ON M5S 3B2, Canada
3
The Centre for Applied Genomics and Program in Genetics and Genome Biology, The Hospital for Sick Children, 686 Bay Street, Toronto, ON M5G 0A4, Canada
*
Author to whom correspondence should be addressed.
Submission received: 9 August 2021 / Revised: 8 October 2021 / Accepted: 11 October 2021 / Published: 25 October 2021
(This article belongs to the Collection Genetic Diversity Evaluation of the Fruit Trees)

Abstract

:
We compare biogeographic and morphological parameters of two agamic complexes of western North American hawthorns so as to evaluate possible explanations of the differences in range between sexually reproducing taxa and their apomictic sister taxa. We have documented range, breeding system, morphology, leaf vascular architecture, and niche breadth in these hawthorns, for which phylogenetic relationships and ploidy levels are known. Species distribution data from herbarium specimens and online databases were analyzed in order to compare ranges and climate niches described by bioclimatic variables. Flow cytometry documented ploidy level and breeding system. Voucher specimens provided morphometric data that were analyzed using uni- and multivariate methods. Members of two black-fruited taxonomic sections of Crataegus subg. Sanguineae (sections Douglasianae, Salignae) have previously been identified as hybrids. They are presumptively self-fertile polyploids with pseudogamous gametophytic apomixis. Their morphologies, geographic ranges, and niche characteristics resemble those of their diploid, sexual parent or are intermediate between them and those of their other parent, one or both of two partially sympatric tetraploid apomicts in red-fruited C. subg. Americanae with much wider distributions. Comparing sections Douglasianae and Salignae suggests that geographic parthenogenesis (larger range sizes in apomicts, compared to sexually reproducing taxa) may have less to do with adaptation than it does with reproductive assurance in the pseudogamously apomictic and self-compatible hybrids. Greater climate niche breadth in allopolyploids compared to diploids similarly may be more due to parental traits than to effects of genome duplication per se.

1. Introduction

Hawthorns (Crataegus L.) belong to the Amygdaloideae Arn., the same subfamily of the Rosaceae as apricots, cherries, peaches, plums, and other commercially important Prunus species. Hawthorns have fleshy fruits that develop from hypanthial (inferior) ovaries and so belong to subtribe Malinae Reveal, as do apples, pears, and quinces. Like these commercially more important genera [1], hawthorns are cultivated (and gathered in the wild) for their fruit, notably in China (C. pinnatifida Bunge, C. scabrifolia (Franchet) Rehder), western Eurasia (C. azarolus L., C. germanica (L.) Kuntze), Mesoamerica (C. Mexicana Moc. & Sessé ex DC), the Pacific Northwest of North America (C. ser. Douglasianae Rehder), and the Southeastern United States (C. ser. Aestivales (Sarg.) Rehder), as noted by many authors (see reviews in) [2,3,4]. Other aspects of the cultural importance of hawthorns include the use of their thorniness and the density of their branching in building barriers (hedges) for defense and property demarcation [3,5,6]. Hawthorn species may be locally important in pomology, as rootstocks for apples and pears [3,7]. On the negative side [8], however, hawthorns may act as reservoirs for fungal and insect pests of tribe Maleae generally (Gymnosporangium R.Hedw. ex DC) or of specific crops, like apples (Rhagoletis Loew). Similarly, because hawthorns readily colonize abandoned agricultural land [3,8] the presence of hawthorns may be taken as a sign of poor management. Nevertheless, hawthorn thickets can represent an important stage of secondary succession, as they may shelter juvenile stages of more shade-tolerant, later successional tree species. Taking as an example a species like C. crus-galli L. that may often grow to tree size, and thus flower and fruit abundantly, hawthorns can be important in wildlife management, providing as they do shelter and food for mammals, birds, and invertebrates, notably insect pollinators and other flower visitors, and frugivorous birds and small mammals [8,9]. Finally, hawthorns have been used in traditional medicine virtually wherever they occur, and are studied for their potential role in allopathic medicine, notably in relation to cardiovascular disease [3,4,10,11,12,13,14,15,16]. For these reasons there is merit in seeking a better understanding of the evolutionary and ecological phenomena related to hawthorns, as the plants may be valuable in themselves as sources of foods and medicines, and for their ecological roles in both the man-made and natural habitats where they occur.
One such phenomenon encompassing the evolution, reproductive biology, and ecology of hawthorns is geographic parthenogenesis. Geographic parthenogenesis refers to situations in which asexually reproducing taxa have larger geographic ranges than do their sexually reproducing sister taxa [17,18,19,20]. In flowering plants, the phenomenon has been documented numerous times (e.g., [21,22]), and has been explained in a number of ways (reviewed by) [23]. Variation in range size without reference to breeding system has also been studied [24] and has been suggested to result, on continental scales, from variation in habitat area and climate variability [25].
Geographic parthenogenesis has been studied extensively in Asteraceae and in Ranunculus [22]. These authors note that because apomixis in the Asteraceae is mostly autonomous (endosperm development and successful, asexual seed set is not pollination dependent), discussions of geographic parthenogenesis may be biased in seeing the phenomenon exclusively as a result of automatic reproductive assurance for single individuals establishing in new (i.e., previously uncolonized) habitat.
As in Ranunculus, however, apomixis in the Rosaceae is pseudogamous, meaning that pollination and endosperm fertilization are required for endosperm development and successful seed set [26,27]. Rosaceae apomicts are, however, characteristically allopolyploid, so that the gametophytic self-incompatibility found in diploids tends to break down [28,29,30,31,32,33,34]. In Rosaceae tribe Maleae, strong evidence for geographic parthenogenesis was not found in Amelanchier when the probability of apomixis was regressed on elevation and latitude (logistic regression) [28]. In Crataegus, however, dramatic differences in range sizes between sexual diploids and apomictic polyploids are conspicuous.
Crataegus subgenus Sanguineae, one of the five subgenera in the genus (Table 1) [35], comprises three taxonomic sections: Salignae (Rocky Mountains of North America), sister to the other two, Douglasianae (mainly the Pacific Northwest of North America) and Sanguineae (mainly eastern Eurasia). Both of the black-fruited sections, Douglasianae and Salignae, can be seen as agamic complexes, each comprising a diploid cytotype and one or more of its allopolyploid, apomictic derivatives (Table 1) [4,36,37]. Comparisons of the diploids and allopolyploids in section Douglasianae strongly suggested the occurrence of geographic parthenogenesis, given differences in geographic ranges, climate niches, and breeding system parameters [38,39,40]. Here, we compare the Douglasianae with new data from the Salignae using, in addition, new data for both sections on leaf venation parameters relevant to the occupation of environments varying in temperature and moisture availability regimes. We also compare these black-fruited taxa with more or less sympatric red-fruited members of C. subg. Americanae that are likely to have been the other parent of the allopolyploids. This comparison is noteworthy as it has never previously been made. It places the black-fruited allopolyploids in the context of both of their parents, making possible for the first time realistic inferences about the origins of traits seen in the polyploids but not their diploid progenitors.
The species distribution data have been obtained from herbarium specimens and online databases. Herbarium specimens in our sample also served as vouchers for flow cytometry, morphological comparisons of the species studied, and quantitative comparisons of leaf venation. With these data we seek to answer the following questions: (1) Are the taxa studied distinct species, or has hybridization blurred the boundaries between them? (2) do contrasts between our diploid sexual and polyploid apomictic taxa demonstrate geographic parthenogenesis in both sections Douglasianae and Salignae? (3) is geographic parthenogenesis a function of differences in vascular architecture and the climatic niches of the taxa, or (4) is geographic parthenogenesis more likely to be a function of differences in breeding system? Finally (5), what role has hybridization between the Americanae and Sanguineae taxa, if distinct from the roles of morphology, niche specialization, or breeding system, played in geographic parthenogenesis?

2. Materials and Methods

2.1. Plant Materials, Sampling, and Geographic Ranges

In addition to species in black-fruited Crataegus sections Douglasianae and Salignae, our sample includes one tetraploid species in each of the red-fruited C. sections Coccineae and Macracanthae (C. subg. Americanae; Table 1) [41] that occur in partial sympatry with the Douglasianae and the Salignae (Figure 1A,B) [42]. One or both of these two species are implicated as the pollen parents of the Douglasianae and the Salignae allotetraploids (Table 1) [37,43]. Apart from naturalized C. monogyna Jacq. (Western Eurasia; C. subg. Crataegus) these two species are the only hawthorns also found in the seven states occupied by C. sect. Salignae (Figure 1A) [44]. The distribution of Crataegus sect. Douglasianae (Figure 1B) overlaps not only with the ranges of the two Americanae species studied here (and that of C. monogyna) but also with those of several Douglasianae species that are only very local and (or) sporadic in their distribution [44], and that are also apomictic allopolyploids [4,27,37,39,41,45,46,47]. The distribution of C. douglasii extends to the upper Great Lakes basin (Figure 1B), where putative hybrids with C. chrysocarpa have been reported (Map 16 and p. 1686 in) [42].
Most occurrence records were extracted from the specimen database of the Green Plant Herbarium (TRT) at the Royal Ontario Museum (ROM). TRT now incorporates the J.B. Phipps Crataegus Research Collection, formerly held at UWO. These specimens were supplemented with records from the following herbaria [48]: University of Alberta (ALTA), University of Arizona (ARIZ), the S. L. Welsh Herbarium (BRY), Canadian Museum of Nature (CAN), California Academy of Sciences (CAS), University of Colorado Museum (COLO), University of Idaho (ID), Denver Botanic Garden (KHD), Montana State University (MONT), the Rocky Mountain Herbarium (RM), University of California (UC), University of New Mexico (UNM), the United States National Herbarium (US), Gila National Forest Herbarium (USFS-GILA), University of Utah (UT), University of Victoria (UVIC), Royal British Columbia Museum (V), and Washington State University (WS). Access to these specimen data was facilitated by the Consortium of Pacific Northwest Herbaria [49] and Intermountain Regional Herbarium Network [50] portals. Additional C. subg. Americanae records were also found in Phipps [51]. When coordinate data were missing, latitude and longitude were determined using locality descriptions obtained from the specimen labels or herbarium databases and Google Earth Pro (Map data: Google Data, Landsat/Copernicus, LDEO-Columbia, NSF, NOAA, U.S. Navy, NGA, Landsat/Copernicus, U.S. Geological Survey). Earth Point functions (Township and Range functions) [52] were used to interpret localities in the United States given using the Public Land Survey System. Herbarium and coordinate data for the specimens used in mapping are found in Supplementary Data Table S1. Note that images of almost all TRT specimens used as vouchers for the work reported here are accessible online using a URL incorporating their TRT barcode number (see Supplementary Data Tables S1–S4); TRT Crataegus specimen records are also available online using the Canadensys Explorer [42], and GBIF [53] gateways. Finally, the World Map of the Köppen-Geiger Climate Classification Updated [54] was imported into Google Earth Pro together with the specimen occurrence data in Supplementary Data Table S1 in order to visualize taxon distributions in relation to climate. The Earth Point Excel To KML function [52] was used to reformat the coordinate data, together with labels, into a .kml file for display with Google Earth Pro.

Data Analyses

Virtually all data analyses, i.e., except as noted, were carried out using functions in the R environment for statistical computing and graphics [55], or those provided by packages contributed to the R environment. Coordinate data for each species obtained as described above were mapped using a number of R function and packages (maps, mapdata, maptools, and mapproj) and using the online mapping application, SimpleMappr [56]. These maps permitted visual inspection, enabling locations clearly in error to be corrected or removed. For each species duplicated locations were removed, and as much as possible the localities retained were at least five km apart. The final geo-referenced data consisted of 748 localities (Table 1; Supplementary Data Table S1). Taxon range mapping and quantification made use of the functions makePoly and areaPolygon from the geosphere package [57].
Multivariate data (morphology, climate descriptors) were summarized by means of principal components analysis (PCA) [58] and principal coordinates analysis (PCoA) [58]. PCA was carried out using the R prcomp function. Data for PCoA were first summarized as the distance matrix between objects using the function daisy in the R package cluster [59] to calculate Gower’s coefficient for mixed data [60]; PCoA was calculated from these resemblances using the pcoa function of the R package ape [61]. This function has the advantage that its output includes an evaluation of the dimensionality of the data being analyzed. The eigenvalues associated with the successive ordination dimensions are compared with expected proportions under Frontier’s broken-stick model [58,62]. As with PCoA, the dimensionality of the data analyzed by means of PCA was also evaluated using the broken-stick criterion, in these cases with the help of a purpose-written R function based on the formula given by [58]. The ordihull function in the vegan package [63] was used to outline the taxa in the ordinations. The contribution of the individual descriptors to the ordination was depicted as a biplot, using the correlations between the original descriptors and the scores on the ordination axes of interest.
Table 1. Elements of the Crataegus flora of Western North America studied here, with sample sizes analyzed. Ploidy levels determined by flow cytometry [27,39,41,45,46,47]. Infrageneric classification follows Ufimov and Dickinson [35]. See Figure 1 for geographic distribution.
Crataegus SampleSample Sizes
Voucher Data (with Links to Online Databases)
Taxa and Ploidy Level (Entries Refer to Sporophytic Ploidy Levels (2n), in Terms of the Base Chromosome Number in Crataegus, x = 17)Climate Supplementary Data Table S1Morphology Supplementary Data Table S2Anatomy Supplementary Data Table S3 1Additional X-ray Images 2
(Specimens/Leaves)
Flow Cytometry Supplementary Data Table S4
Crataegus subg. Americanae El-Gazzar
C. sect. Coccineae Loudon
https://morphobank.org/index.php/Projects/FoliosList/folio_id/936/project_id/3190
C. chrysocarpa Ashe (4x) 31252034/725 4
C. sect. Macracanthae Loudon
C. macracantha Lodd. ex Loudon (4x) 54673-21
Crataegus subg. Sanguineae Ufimov
C. sect. Salignae T.A. Dickinson and Ufimov
https://morphobank.org/index.php/Projects/FoliosList/folio_id/882/project_id/3190
C. erythropoda Ashe (4x)431034/818
C. rivularis Nuttall ex Torr. & Gray (4x)861145/1925
C. saligna Greene (2x)35455/179
C. sect. Douglasianae Rehder ex C.K. Schneid.
https://morphobank.org/index.php/Projects/FoliosList/folio_id/883/project_id/3190
C. douglasii Lindley (4x)51 + 154 62458/16133
C. gaylussacia A. Heller (3x) 712 + 3 6---12
C. suksdorfii (Sarg.) Kruschke (2x)17 + 59 62044/7
1/1 8
24 + 25 8
C. suksdorfii (Sarg.) Kruschke (3, 4x)25 + 8 + 83 610 944/942
1 See images online (http://0-dx-doi-org.brum.beds.ac.uk/10.7934/P2523; http://0-dx-doi-org.brum.beds.ac.uk/10.7934/P2423) [64,65]. 2 See additional X-ray images online (http://0-dx-doi-org.brum.beds.ac.uk/10.7934/P3190) [35]. 3 Including co-occurrence of C. chrysocarpa var. piperi (Britton) Eggl. in ID and MT. 4 Including segregate species (see Supplementary Data Table S4). 5 Including C. macracantha var. occidentalis (Britton) Eggl. in and west of the Rocky Mountains. 6 Vouchers for individuals probably belonging to the ploidy level shown based on their locality; see text and Supplementary Table S1 for details. 7 Restricted here to plants from Marin and Sonoma counties in CA, and not as used by Phipps [44] for the polyploid agamic complex including C. gaylussacia s.str, (CA only) and C. suksdorfii diploids and polyploids (distributions as shown in Figure 1B). 8 High elevation Western Oregon autopolyploids. 9 Includes one 5x individual.
We also used univariate methods to analyze the leaf vascular architecture data, calculating one-way ANOVAs of the means of the three replicate leaves using the R functions anova and lm. The mean data were tested for normality and homoscedasticity using the R functions shapiro.test and, in package car [66], leveneTest, respectively. Nested ANOVAs were carried out following [67] and [68], using the function lme for mixed effects models in the R package nlme [69]. In these analyses taxon was treated as a fixed effect, and the replicate leaves as a random effect. We also carried out post hoc multiple comparisons using function glht in the R package multcomp [70].
We used the R package raster [71] to access WorldClim data (see below). Following a suggestion in [72], we used classification trees (R packages party, rpart, and tree) [73,74,75,76] to examine details of how individual predictor variables contributed to the contrasts between species as seen in the niche comparisons. In preliminary work we also employed the R package dismo (v. 1.1-1) [77] to develop species distribution models (SDMs) using the maxent function [78]. The ENMTools stand-alone program was used to calculate Levin’s niche breadth statistic [79]. However, because of sampling issues, the SDM approach was not pursued further.

2.2. Morphological Variation

2.2.1. Taxon Differentiation

Morphological data for the Douglasianae and Salignae taxa collected for this project and from our earlier study [36] together with additional new data from the Coccineae and Macracanthae are used to demonstrate the phenetic similarities and differences between these taxa (Table 2; Supplementary Table S2). Vouchers for these data are listed in Supplementary Data Table S2. Variation these descriptors was summarized as boxplots and by means of PCoA, having used Gower’s coefficient to calculate resemblances from descriptors made commensurate by transformation to a common [0, 1] interval, i.e., ranging:
yhi = (xhi − min(x•i))/(max(x•i) − min(x•i)), for the hth individual and the ith descriptor.
Note that although some data came from multistate descriptors, these were scored on multiple thorns (THNS) and flowers (KLOP, KLOS, KLOT) per specimen, and were averaged to provide a value for the specimen as a whole.

2.2.2. Leaf Architectural Data

We have also developed data on leaf morphology and venation for a subset of our sample in order to help interpret our other results in relation to what is known about the potential adaptive significance of leaf size, shape, and venation [80,81,82]. We first cleared and stained three leaves from each of the 31 herbarium vouchers successively using 20% NaOH, 25% commercial bleach, ethanol, and 1% Safranin O in ethanol (a method similar to that of) [83]. Once leaves were cleared and stained, we obtained digital images of whole leaf venation using a lightbox, copystand, and a Nikon D300 digital camera. Digital images were then processed so as to obtain leaf area, perimeter, and counts of leaf marginal serrations [84]. Vein lengths per unit area were estimated from close-up digital images obtained using an Olympus SZ61 dissecting microscope and an Infinity 1 digital camera (Lumenera Corporation, Ottawa ON). Vein orders were distinguished as described by Ellis et al. (Figure 2) [85]. ImageJ [86,87] was used to measure tertiary vein length, secondary vein area, hole area, image area, and total vein skeleton length from the close-up images. These data were used to calculate the following parameters, using variations of the formulas from Scoffoni and Sack [88]: (1) net image area = image area—secondary vein area—hole area; (2) minor vein length = total vein skeleton length—tertiary vein length; and (3) leaf section minor vein density = minor vein length/net image area. In addition, the magnification of the dissecting microscope, for which the leaf section images were captured was also recorded (1.5–2.5×) [84].
The leaf descriptors in Table 3, derived from the images and data described above, were analyzed individually using analysis of variance methods, and summarized following ranging by means of principal component analysis (PCA) [58]. The relationship between the original descriptors and the PCA scores was depicted in a biplot using the descriptor-PCA score correlations. Vouchers for these data are listed in Supplementary Data Table S3. The digital images, together with documentation of the methods employed, are available online in two MorphoBank databases [64,65,84].

2.3. Flow Cytometry

Flow cytometry was used to infer ploidy level and breeding system, based on our experience with leaf [41] and seed [27,39,41,45] tissues. The flow cytometer, located at the University of Toronto Faculty of Medicine, is a Becton-Dickinson machine from BD Biosciences, model FacsCalibur, with a red diode laser for detecting propidium iodide DNA stain, applied as described earlier. Vouchers for leaf and seed tissue flow cytometry data reported here are held in TRT (Supplementary Data Table S4; this table provides data for new determinations, as well as TRT barcode numbers for vouchers whose data were reported previously).

2.4. Climate Niche Comparisons

We chose to use climate predictor variables in this research since climate appears to be the main determinant of plant species distribution across large geographical areas [90]. Bioclimatic predictor variables at 2.5 arc-minutes (~4.5 km) spatial resolution were downloaded from the WorldClim database v. 2.1 (https://worldclim.org/data/worldclim21.html, accessed on 30 July 2015) [91,92] following the example provided by Yoder [93]. These variables characterize global climates for the current conditions (~1950–2000) and are based on average monthly temperature and precipitation data collected from weather stations [94]. To investigate which of the predictor variables are linearly related and to reduce potential problems with multicollinearity we calculated the correlation matrix for the 19 variables extracted from the raster layers using the 748 localities for our samples of herbarium specimen records. We selected nine predictors that were least correlated with other predictor variables (|r| < 0.7; bio1, bio2, bio3, bio8, bio9, bio14, bio15, bio18, bio19). We constructed boxplots to characterize the variation in these climate data for the nine Crataegus taxa (Table 1) using the values extracted from the raster layers at the occurrence points for each species. Climate diagrams were obtained [95] or produced de novo [96] for selected locations so as to help interpret the bioclimatic data.
Climate data were ranged using the maxima and minima for our North American sample of sites [97], and summarized using PCA in order to characterize the taxon-climate niches and the extent to which they overlap in a low-dimensional representation of the climate space, much as done in earlier work with other species (PCA-occ sensu) [39,40,98,99].

3. Results

The taxa studied here are differentiated with respect to their biogeographic relationships (Figure 1), phenetically (Figure 3, Figure 4, Figure 5 and Figure 6), and with respect to ploidy level (Supplementary Data Table S3). Climatic correlates of the differences in ranges between these taxa, and the extent to which they represent different climatic niches are examined in order to determine the extent to which differences in niche breadth and range size are best explained by the morphological correlates of these differences, or by differences in breeding system and resource allocation discovered earlier.

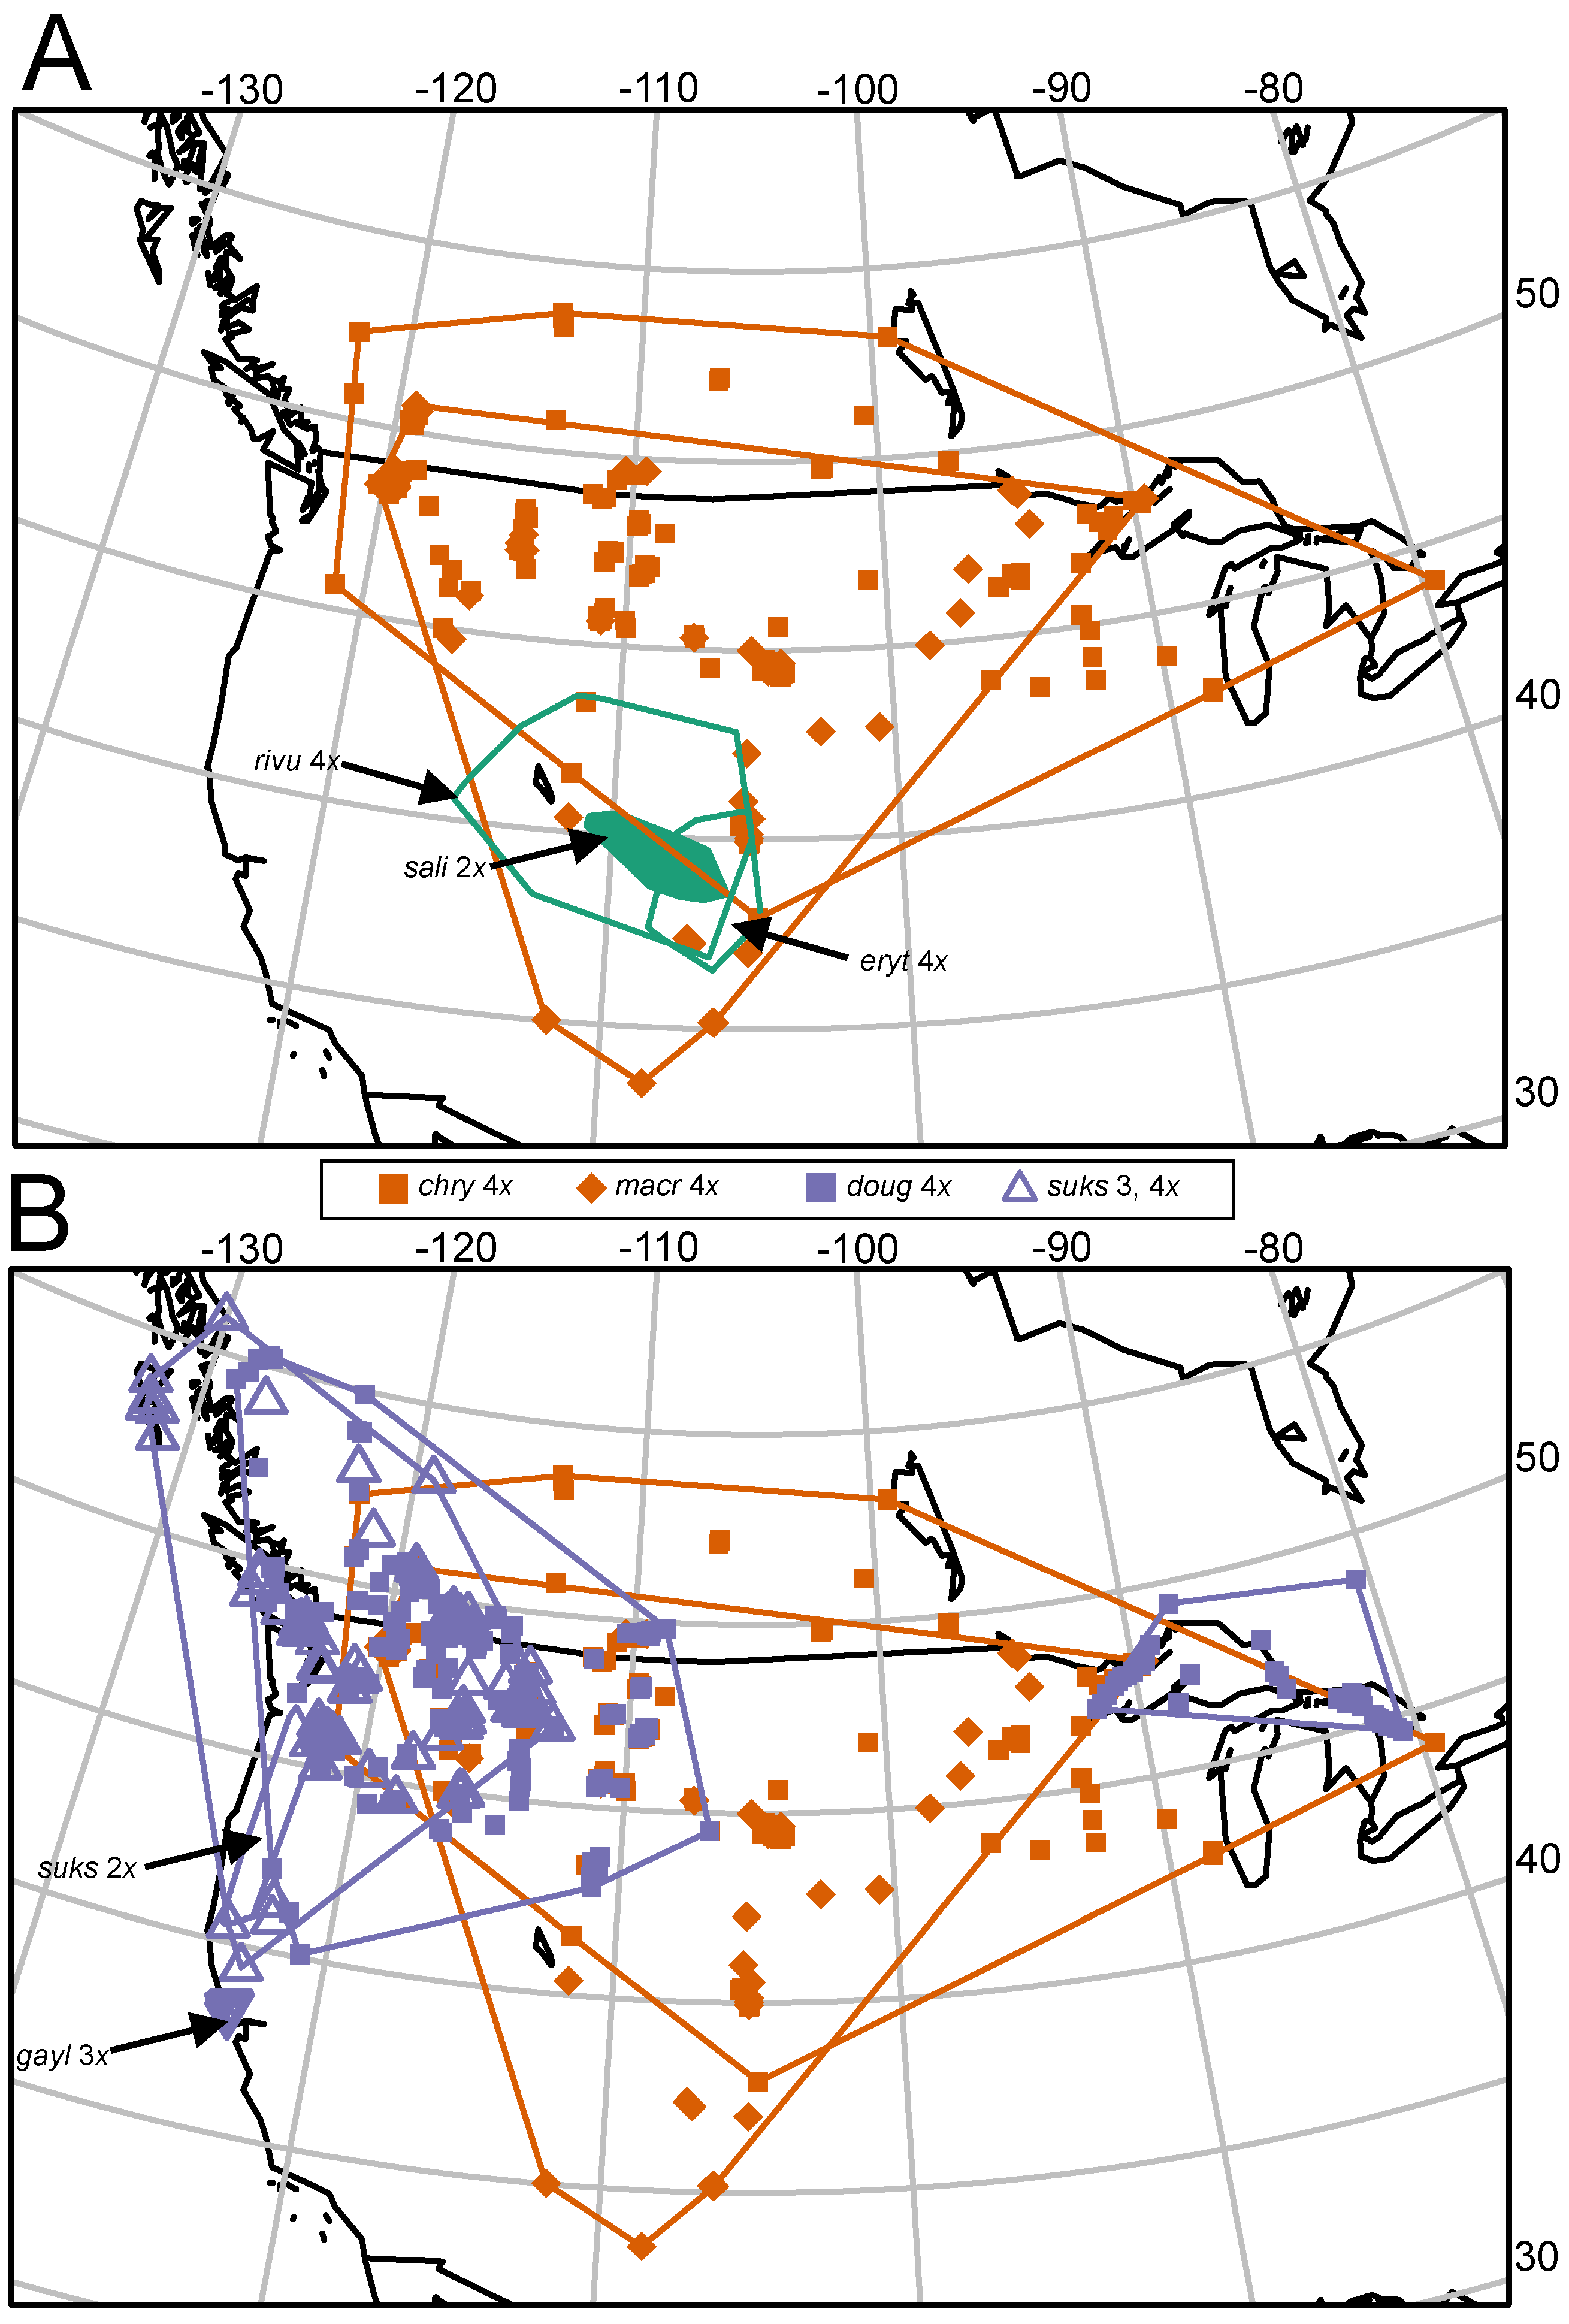
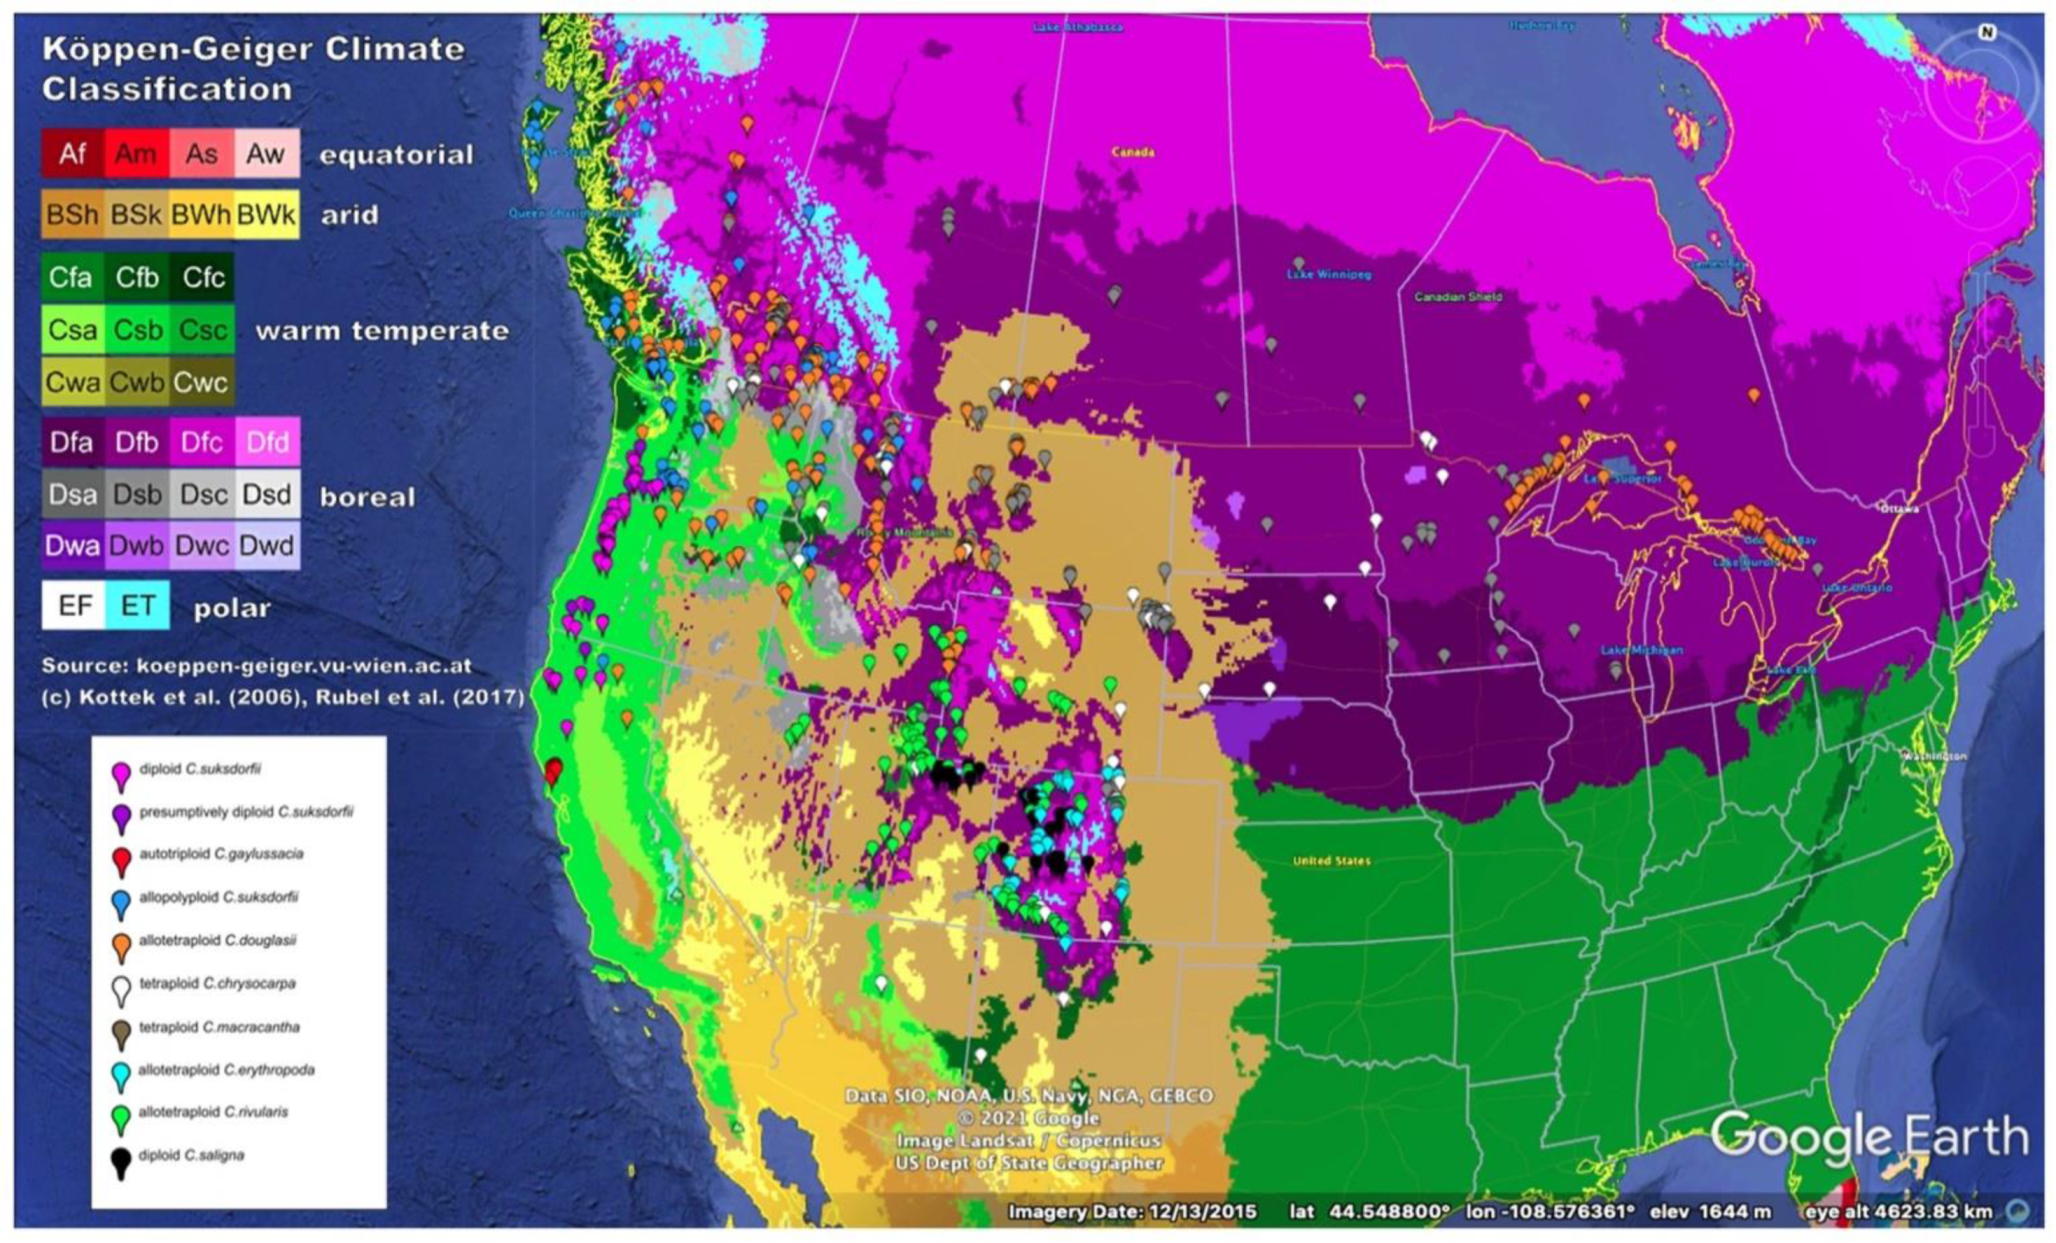
3.1. Differences in Geographic Ranges

Autotriploid Crataegus gaylussacia sensu stricto, as understood here and elsewhere [40], has the smallest range of all the species studied here (Figure 1B; Table 4). Apart from C. gaylussacia, the diploid species (C. saligna, diploid C. suksdorfii) have the smallest ranges (Figure 1; Table 4). The ranges of the allopolyploid black-fruited species are greater, but at most only a little over half that of C. chrysocarpa (Figure 1, Table 4). Note that the red-fruited C. subg. Americanae tetraploids, C. chrysocarpa and C. macracantha, are both distributed across North America (Table 4) [44] and their ranges as represented here are markedly underestimated (Figure 1; Table 4). In addition, our data do not include some of the northernmost occurrences of C. chrysocarpa, to 49.5° N in Ontario [100]. The samples of these two species studied here are drawn mainly from the trans-Mississippi west (Figure 1; Supplementary Data Table S1), and so provide underestimates of their true areal extents (3,497,000 and 2,446,000 sq km; Figure 1; Table 4). The ranges of both the Douglasianae and Salignae allotetraploids (and diploid C. saligna) overlap with those of these two C. subg. Americanae species (Figure 1). That is not the case with either diploid C. suksdorfii or C. gaylussacia (Figure 1B). Comparison of the extents of the ranges of the Douglasianae and Salignae allopolyploids (Table 4) with those of their probable female parents, sexual diploids in C. saligna and the diploid cytotype of C. suksdorfii [37], demonstrates that geographic parthenogenesis occurs not only in C. sect. Douglasianae (Table 4) but also in C. sect. Salignae (Table 4).
In the case of allotetraploid C. douglasii the evidence for geographic parthenogenesis is even more striking as it comprises not only areal extent (Table 4) but also distance (Figure 1B). The main area of distribution for this species is the Pacific Northwest, but in common with several other species from Western North America [102], it is also disjunct in the upper Great Lakes basin (Figure 1B).

3.2. Morphological Variation

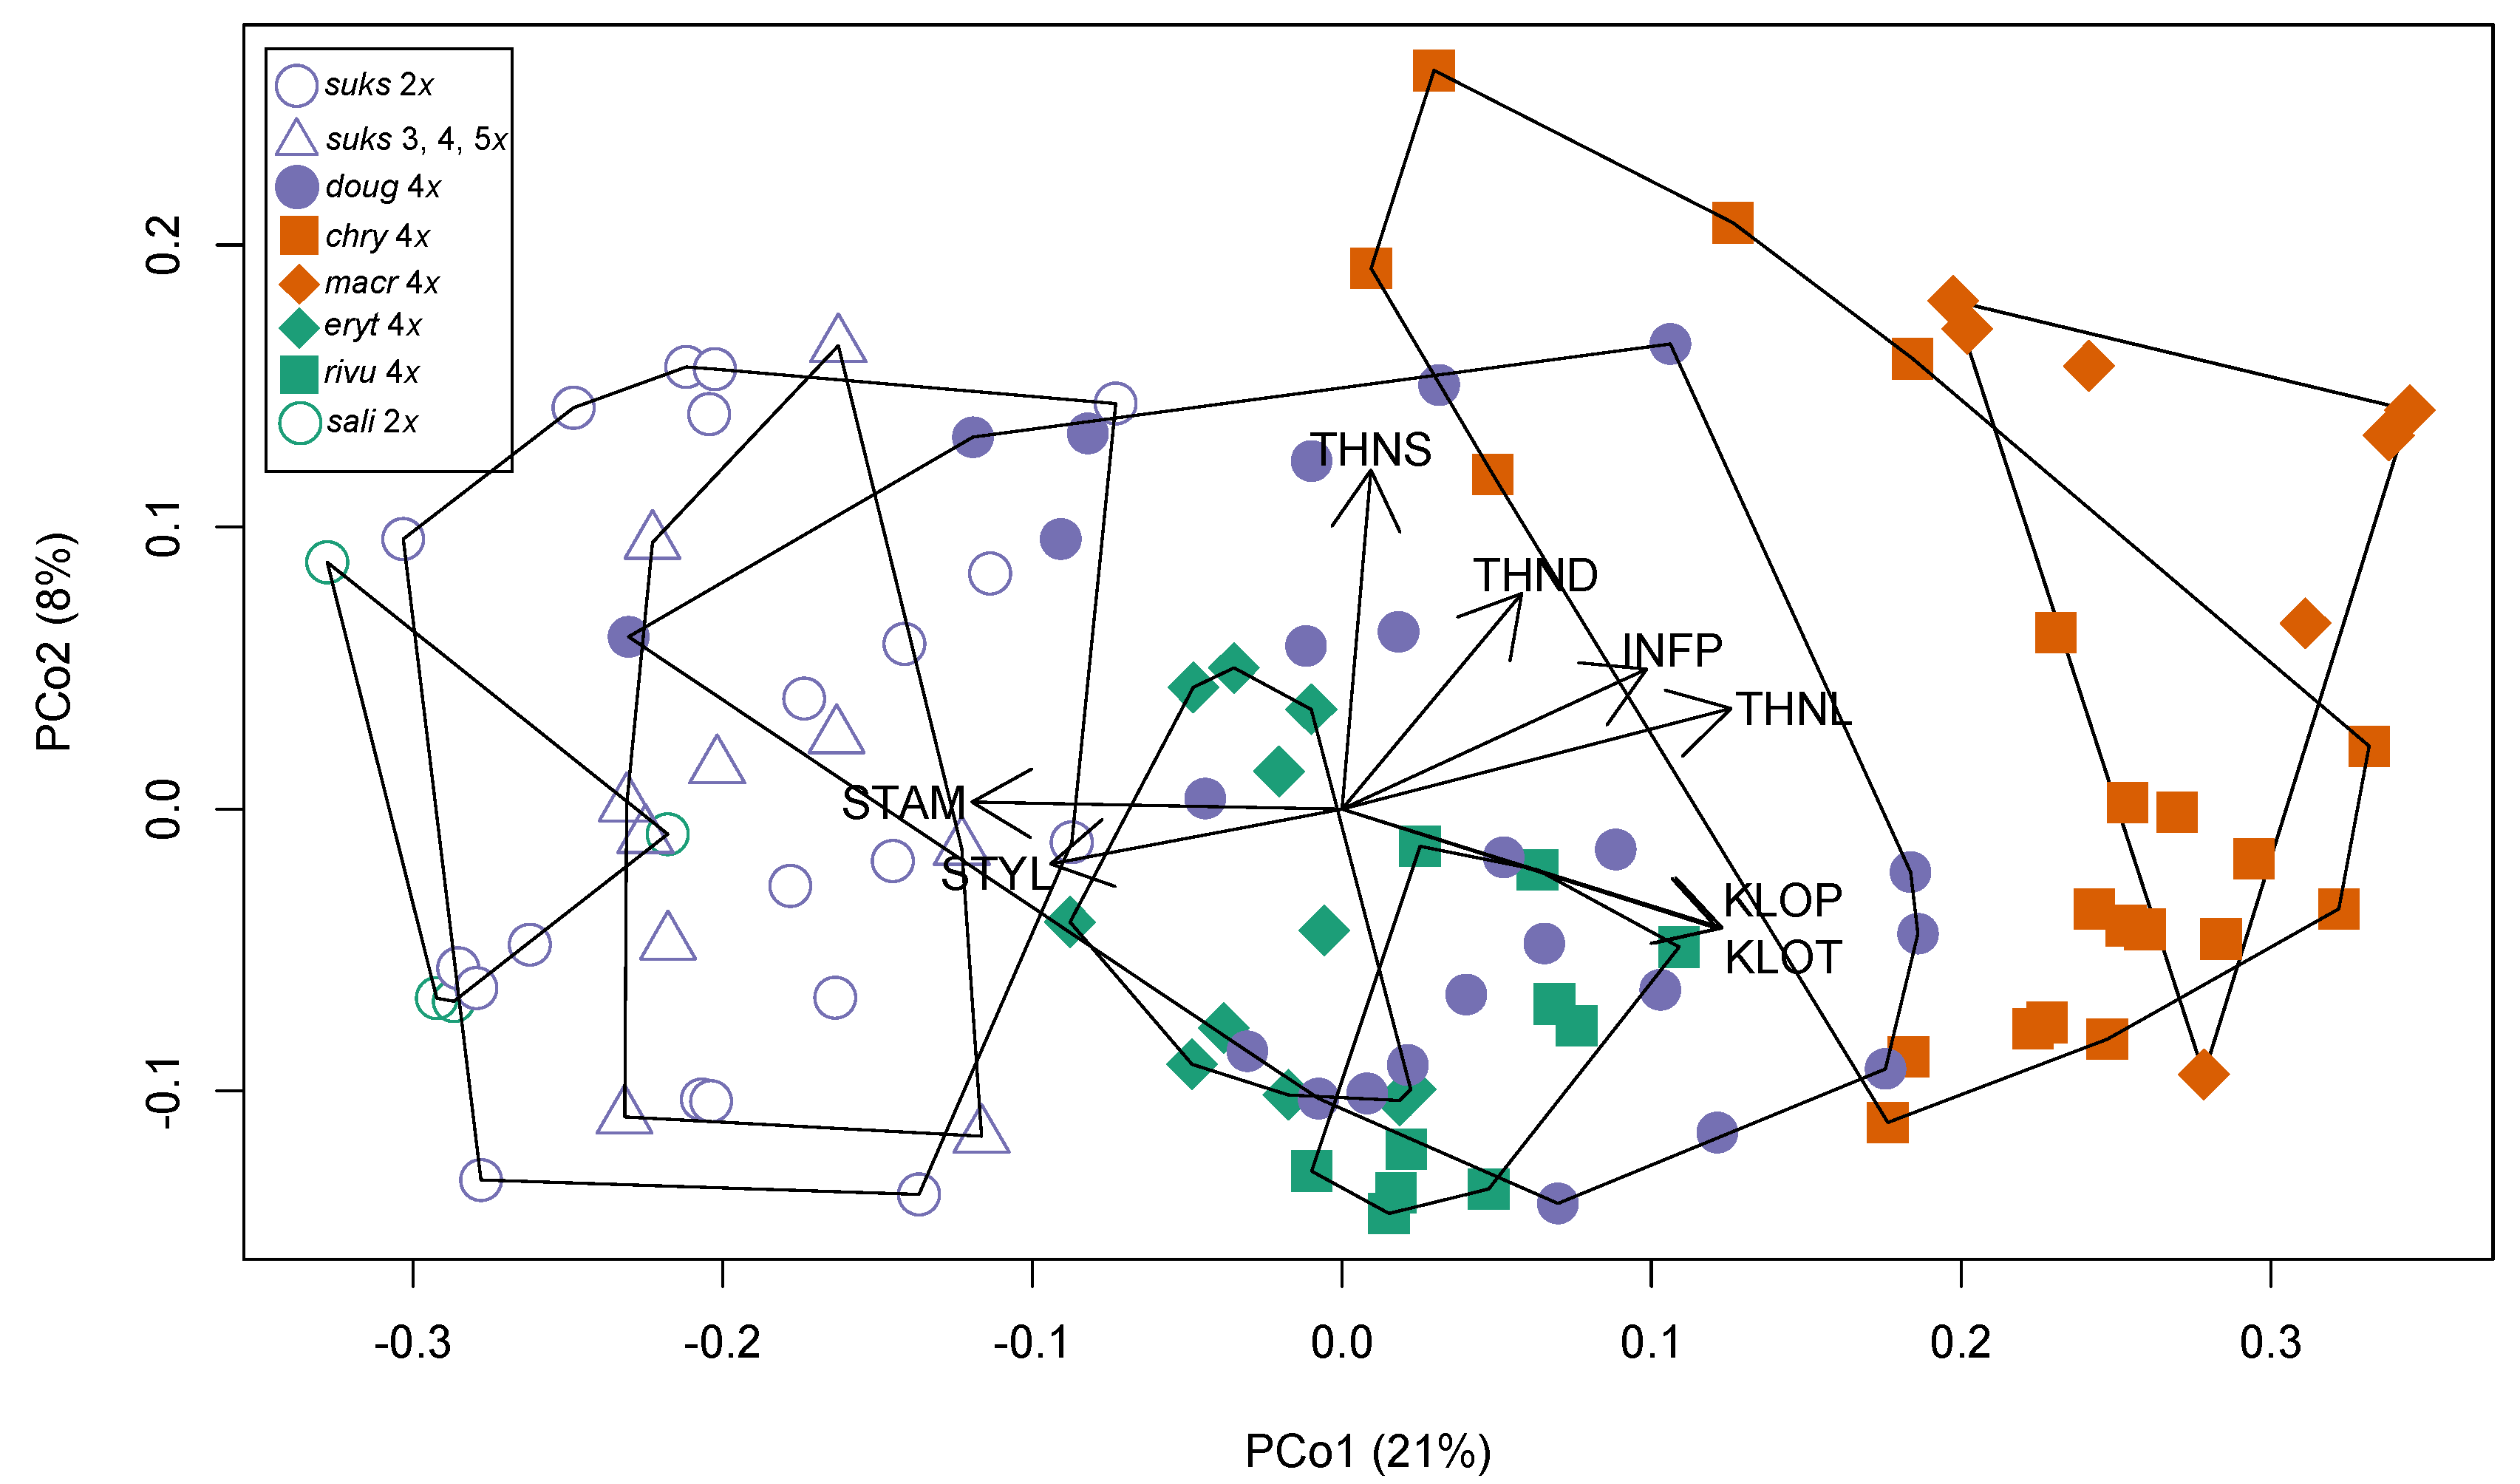
3.2.1. Taxon Differentiation

Comparisons between the taxa belonging to C. subg. Americanae and subg. Sanguineae illuminate the variation observed within the Sanguineae taxa in a manner impossible to observe earlier when the role of the Americanae had not been documented [36]. Crataegus series Cerrones was described by Phipps [51] in order to accommodate C. erythropoda. Molecular data [103] enlarged the series so as to include C. rivularis and C. saligna [44]. Ufimov and Dickinson [35] described C. sect. Salignae so as to provide a section-level taxon to accommodate the Cerrones, and reflect the way the Salignae are sister to the clade comprising sections Douglasianae and Sanguineae (Table 1). Crataegus erythropoda and C. rivularis are tetraploids [41] that are morphologically intermediate between diploid C. saligna and tetraploid C. chrysocarpa and C. macracantha (Figure 3 and Figure 4). This intermediacy corresponds to the molecular evidence for C. erythropoda and C. rivularis having arisen from hybridization between C. saligna as a maternal parent, and one or both of C. chrysocarpa and C. macracantha as pollen parents (Figures 4 and 5 in) [37]. Notably, the presumptively self-fertile allotetraploids have apparently inherited having 10 stamens per flower from their male parents, rather than maintaining the 20-stamen condition of their diploid, self-incompatible female parent (Figure 3 and Figure 4).
In C. sect. Douglasianae the situation is somewhat similar, in that allopolyploid C. douglasii is intermediate between the Americanae tetraploids and the Sanguineae diploids (Figure 3). However, in the morphological space of the PCoA the diploid and allopolyploid C. suksdorfii samples overlap, in large part because of the way they share in having calyx lobes glabrous and untoothed, approximately 20 stamens, and 4–5 styles per flower (Figure 3 and Figure 4).

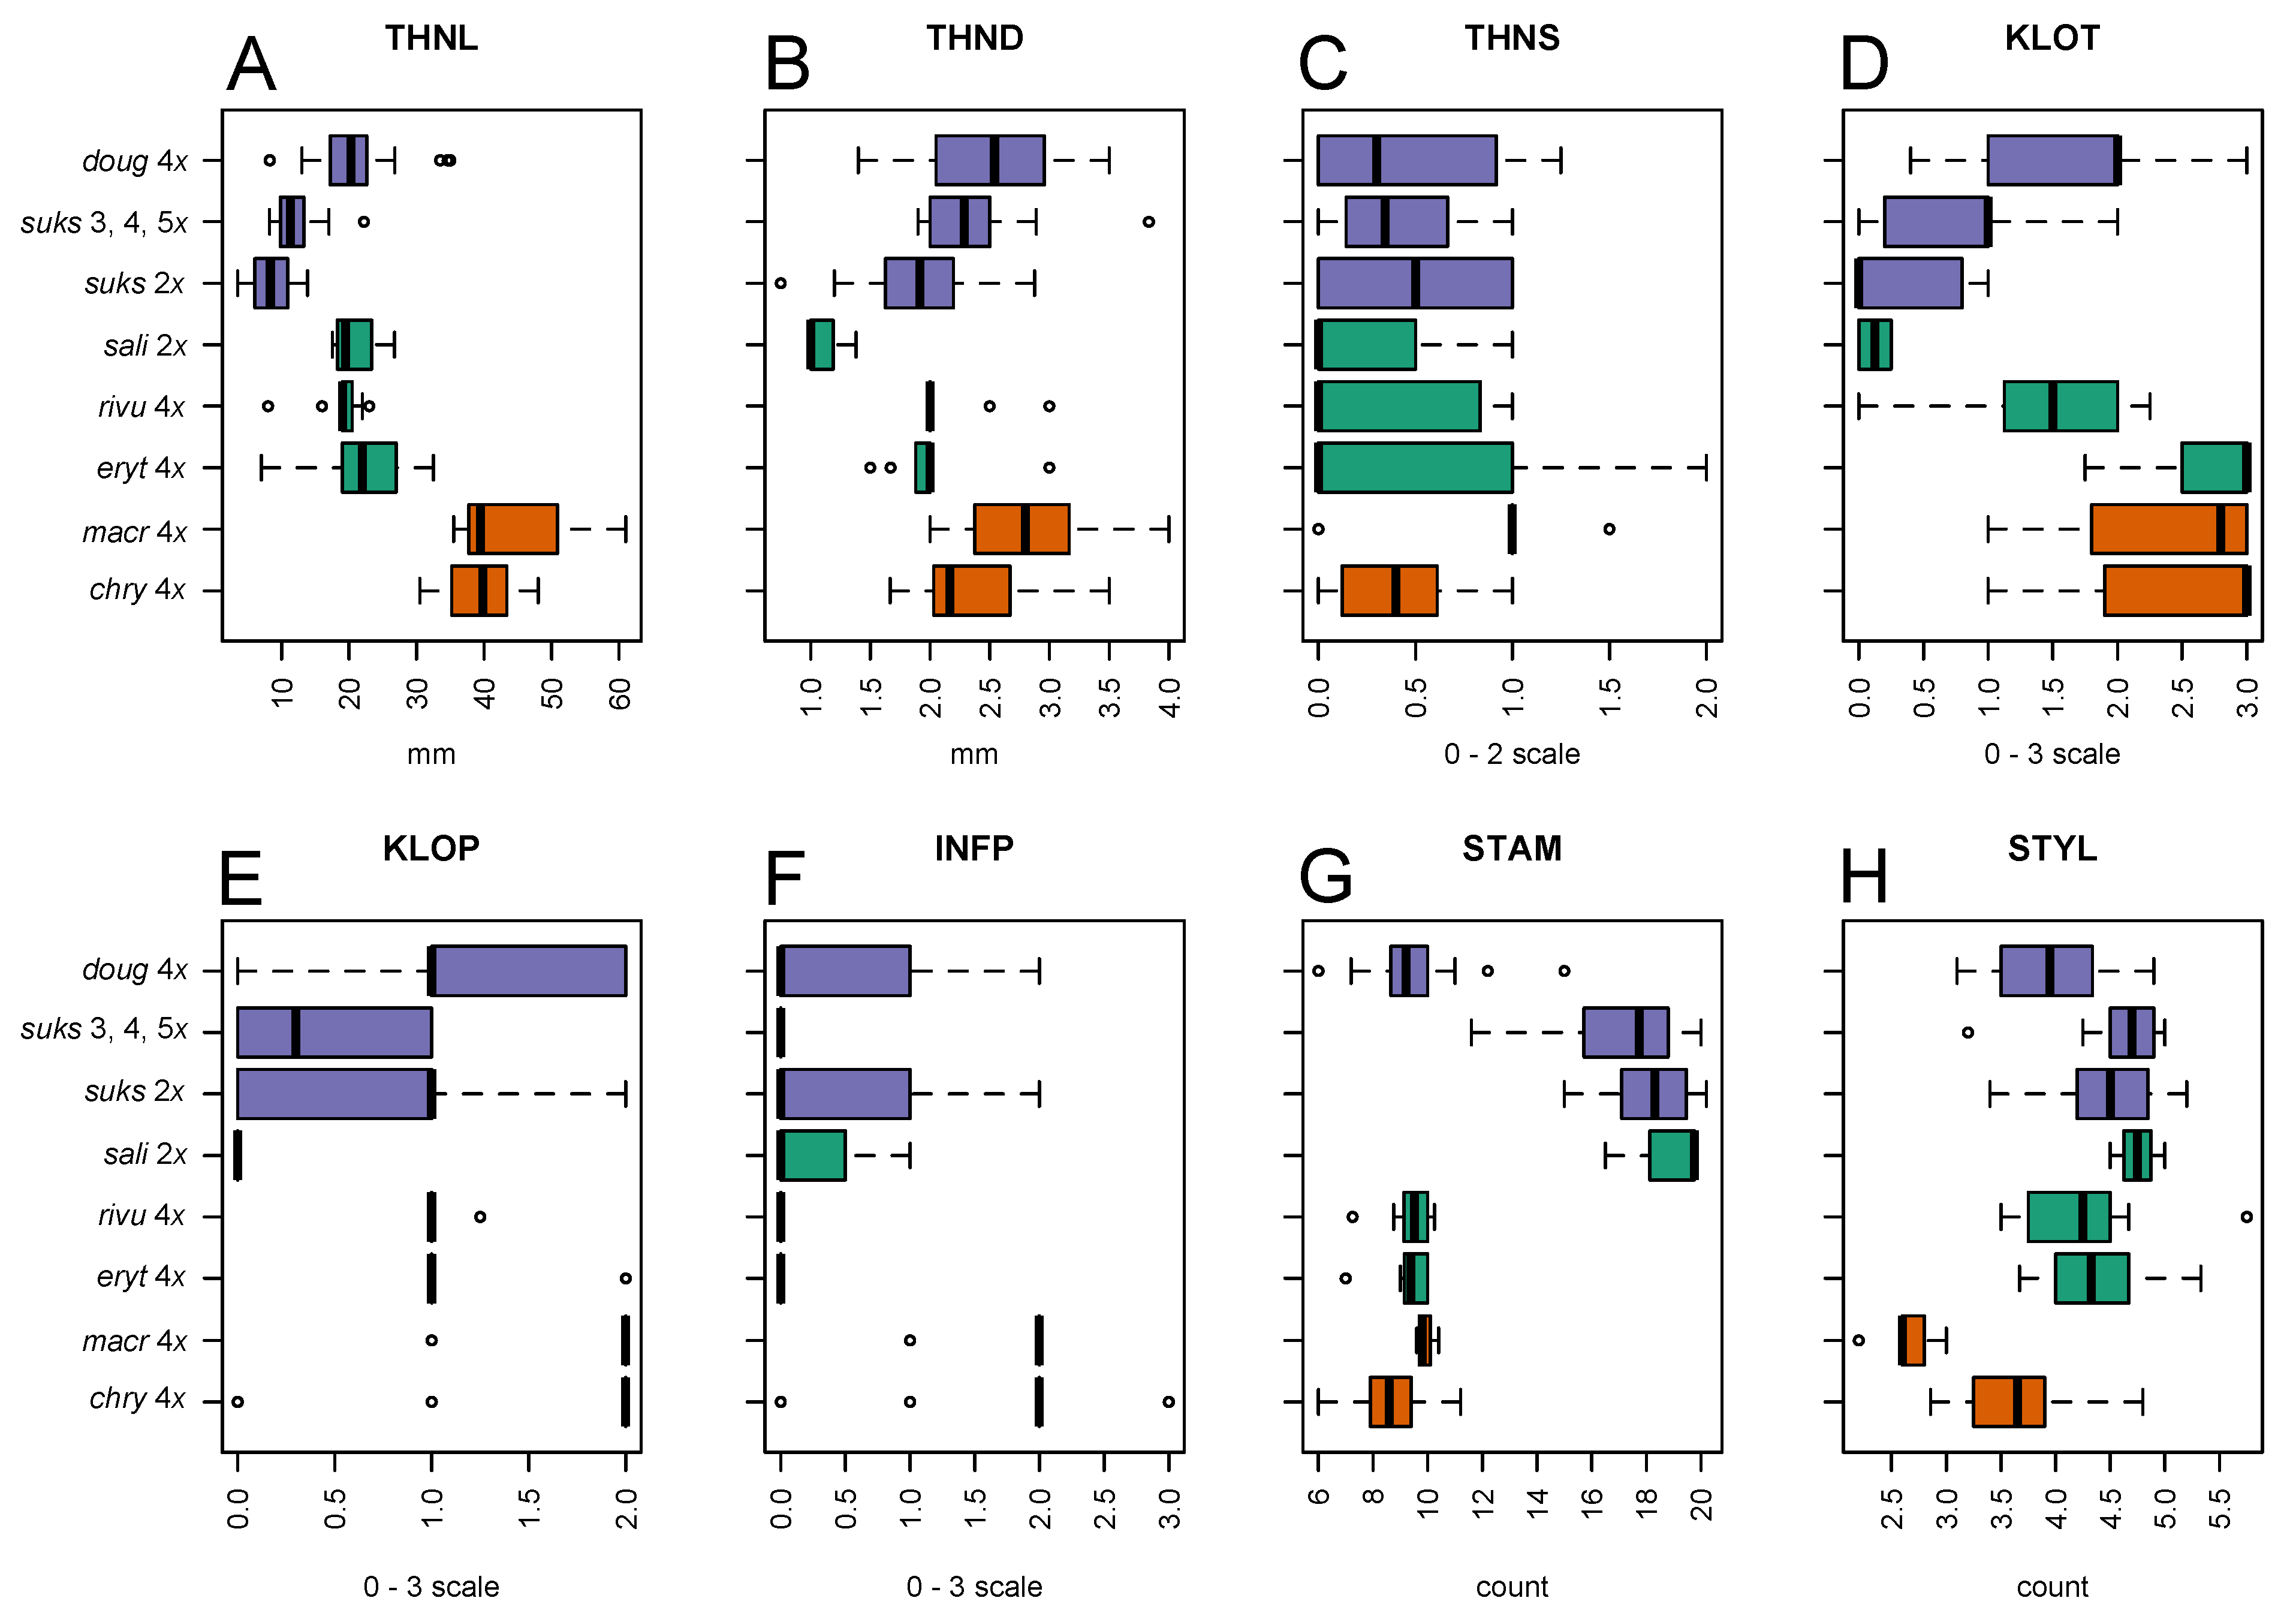
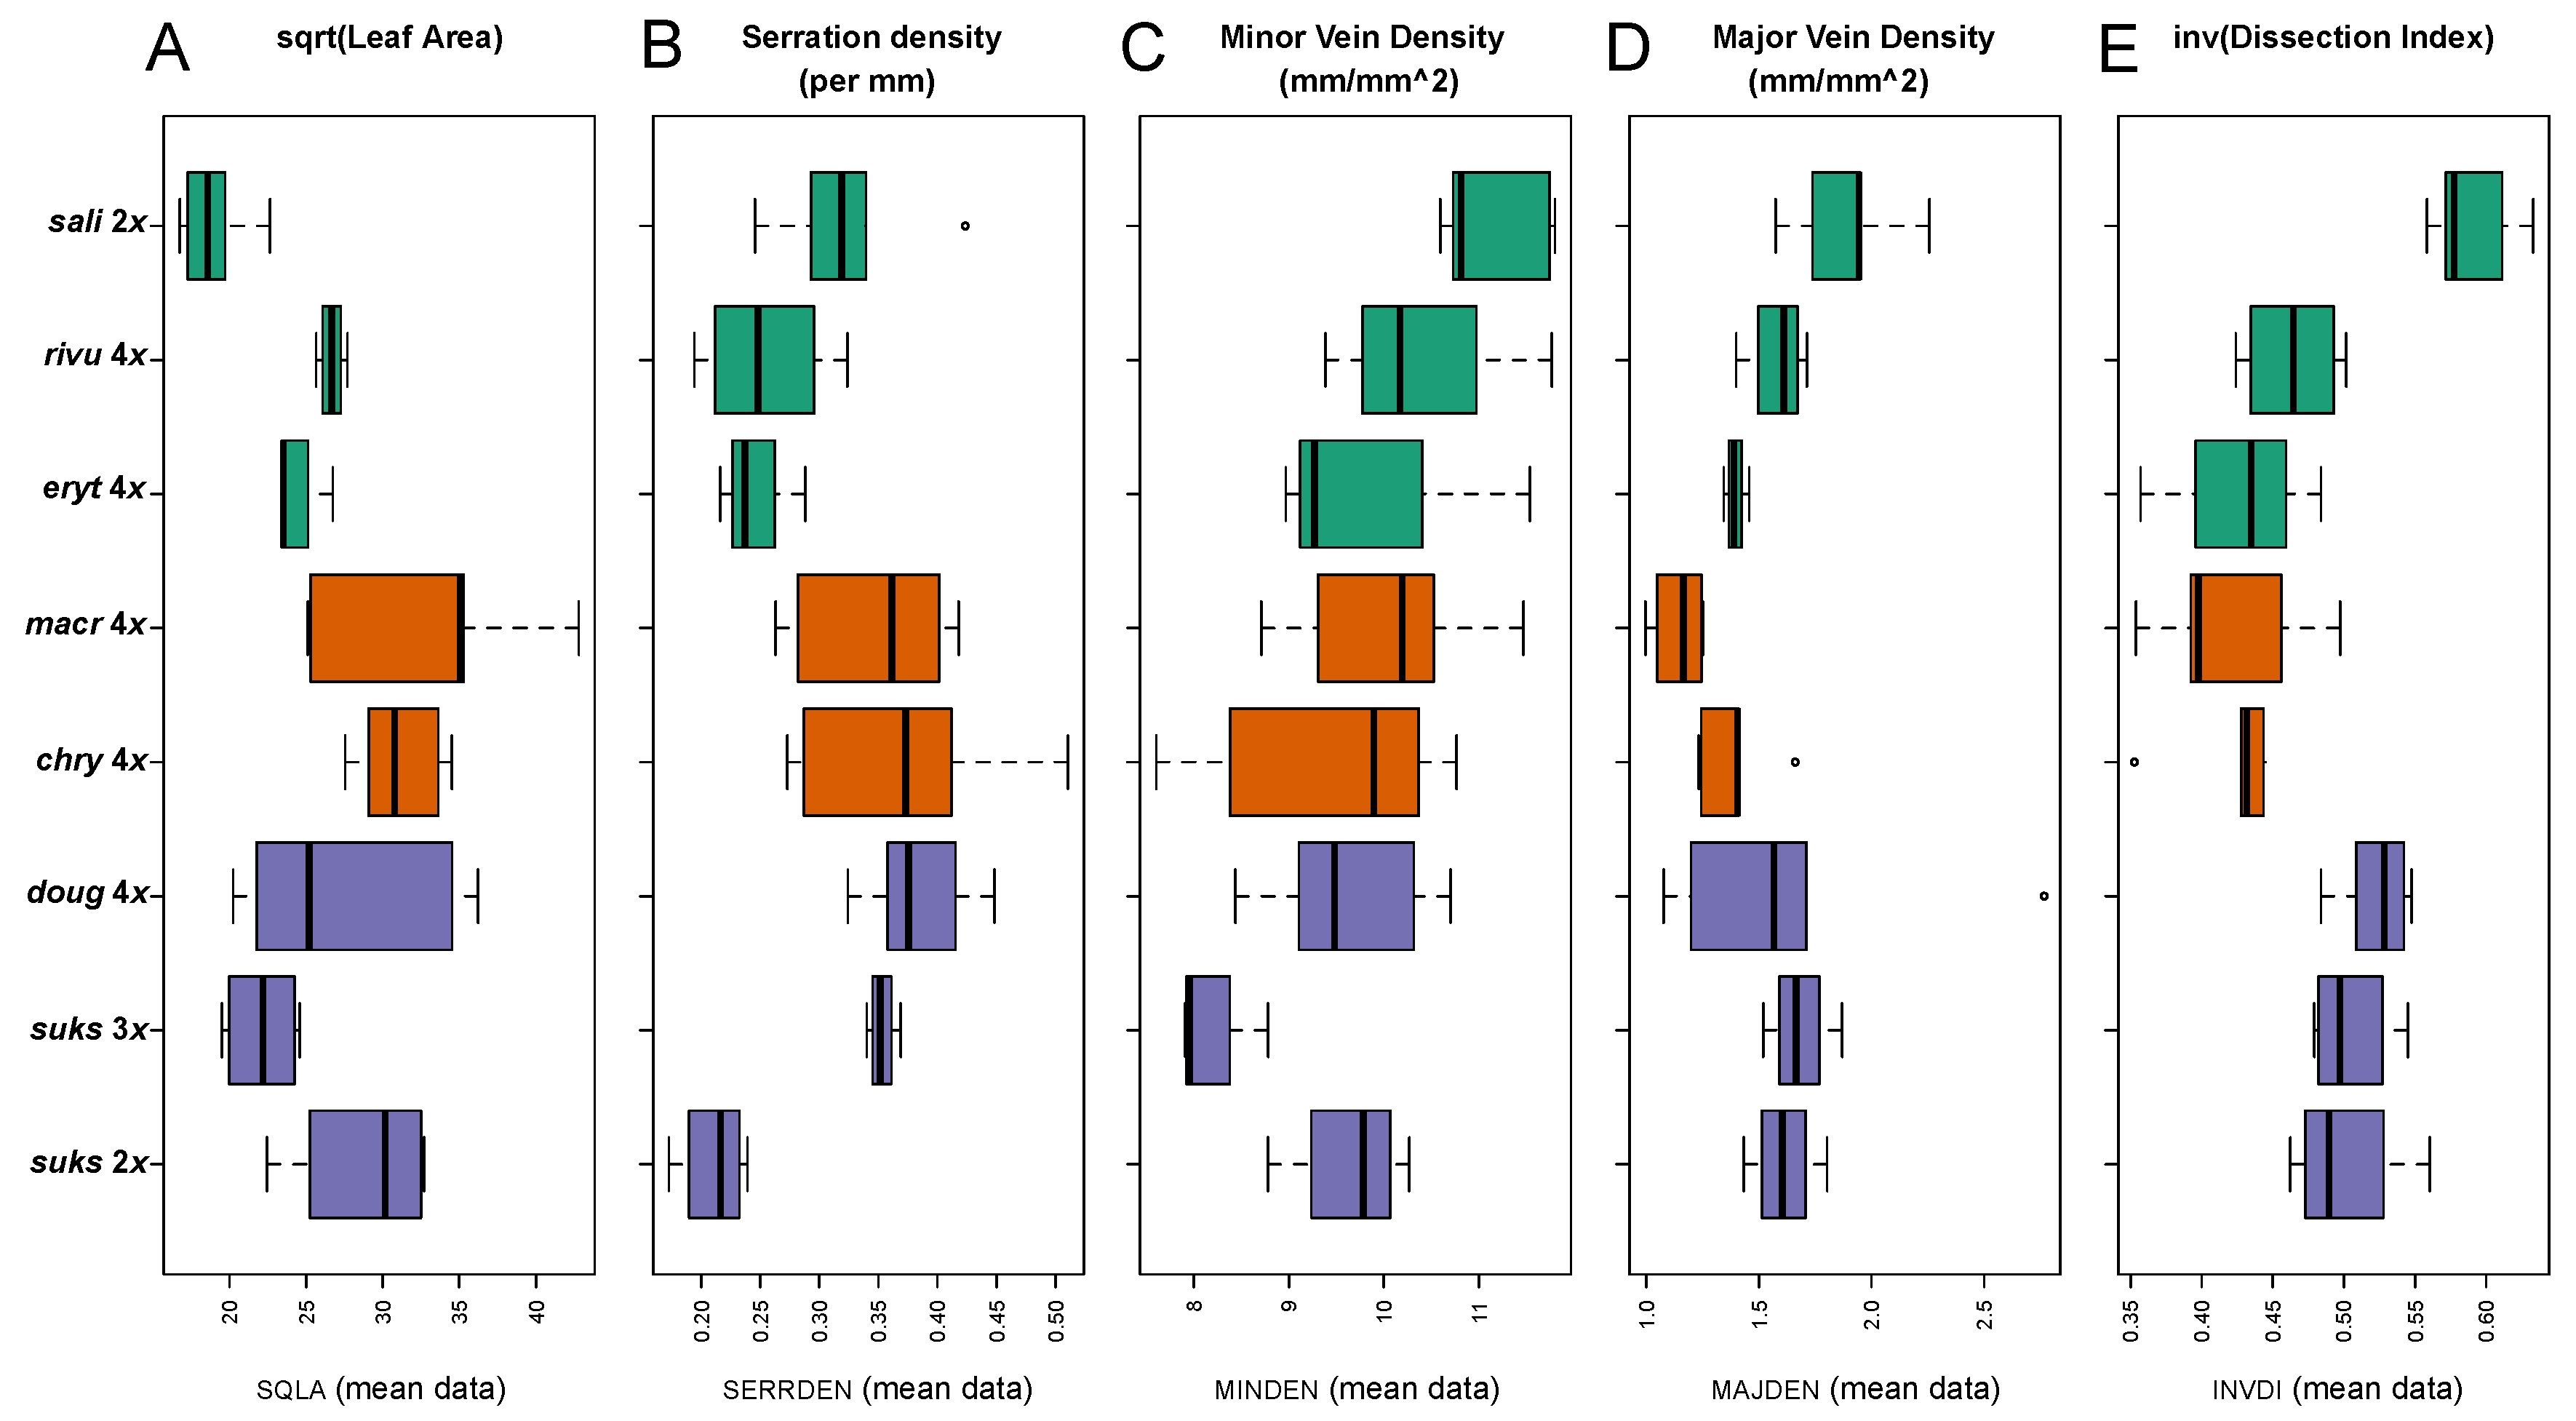
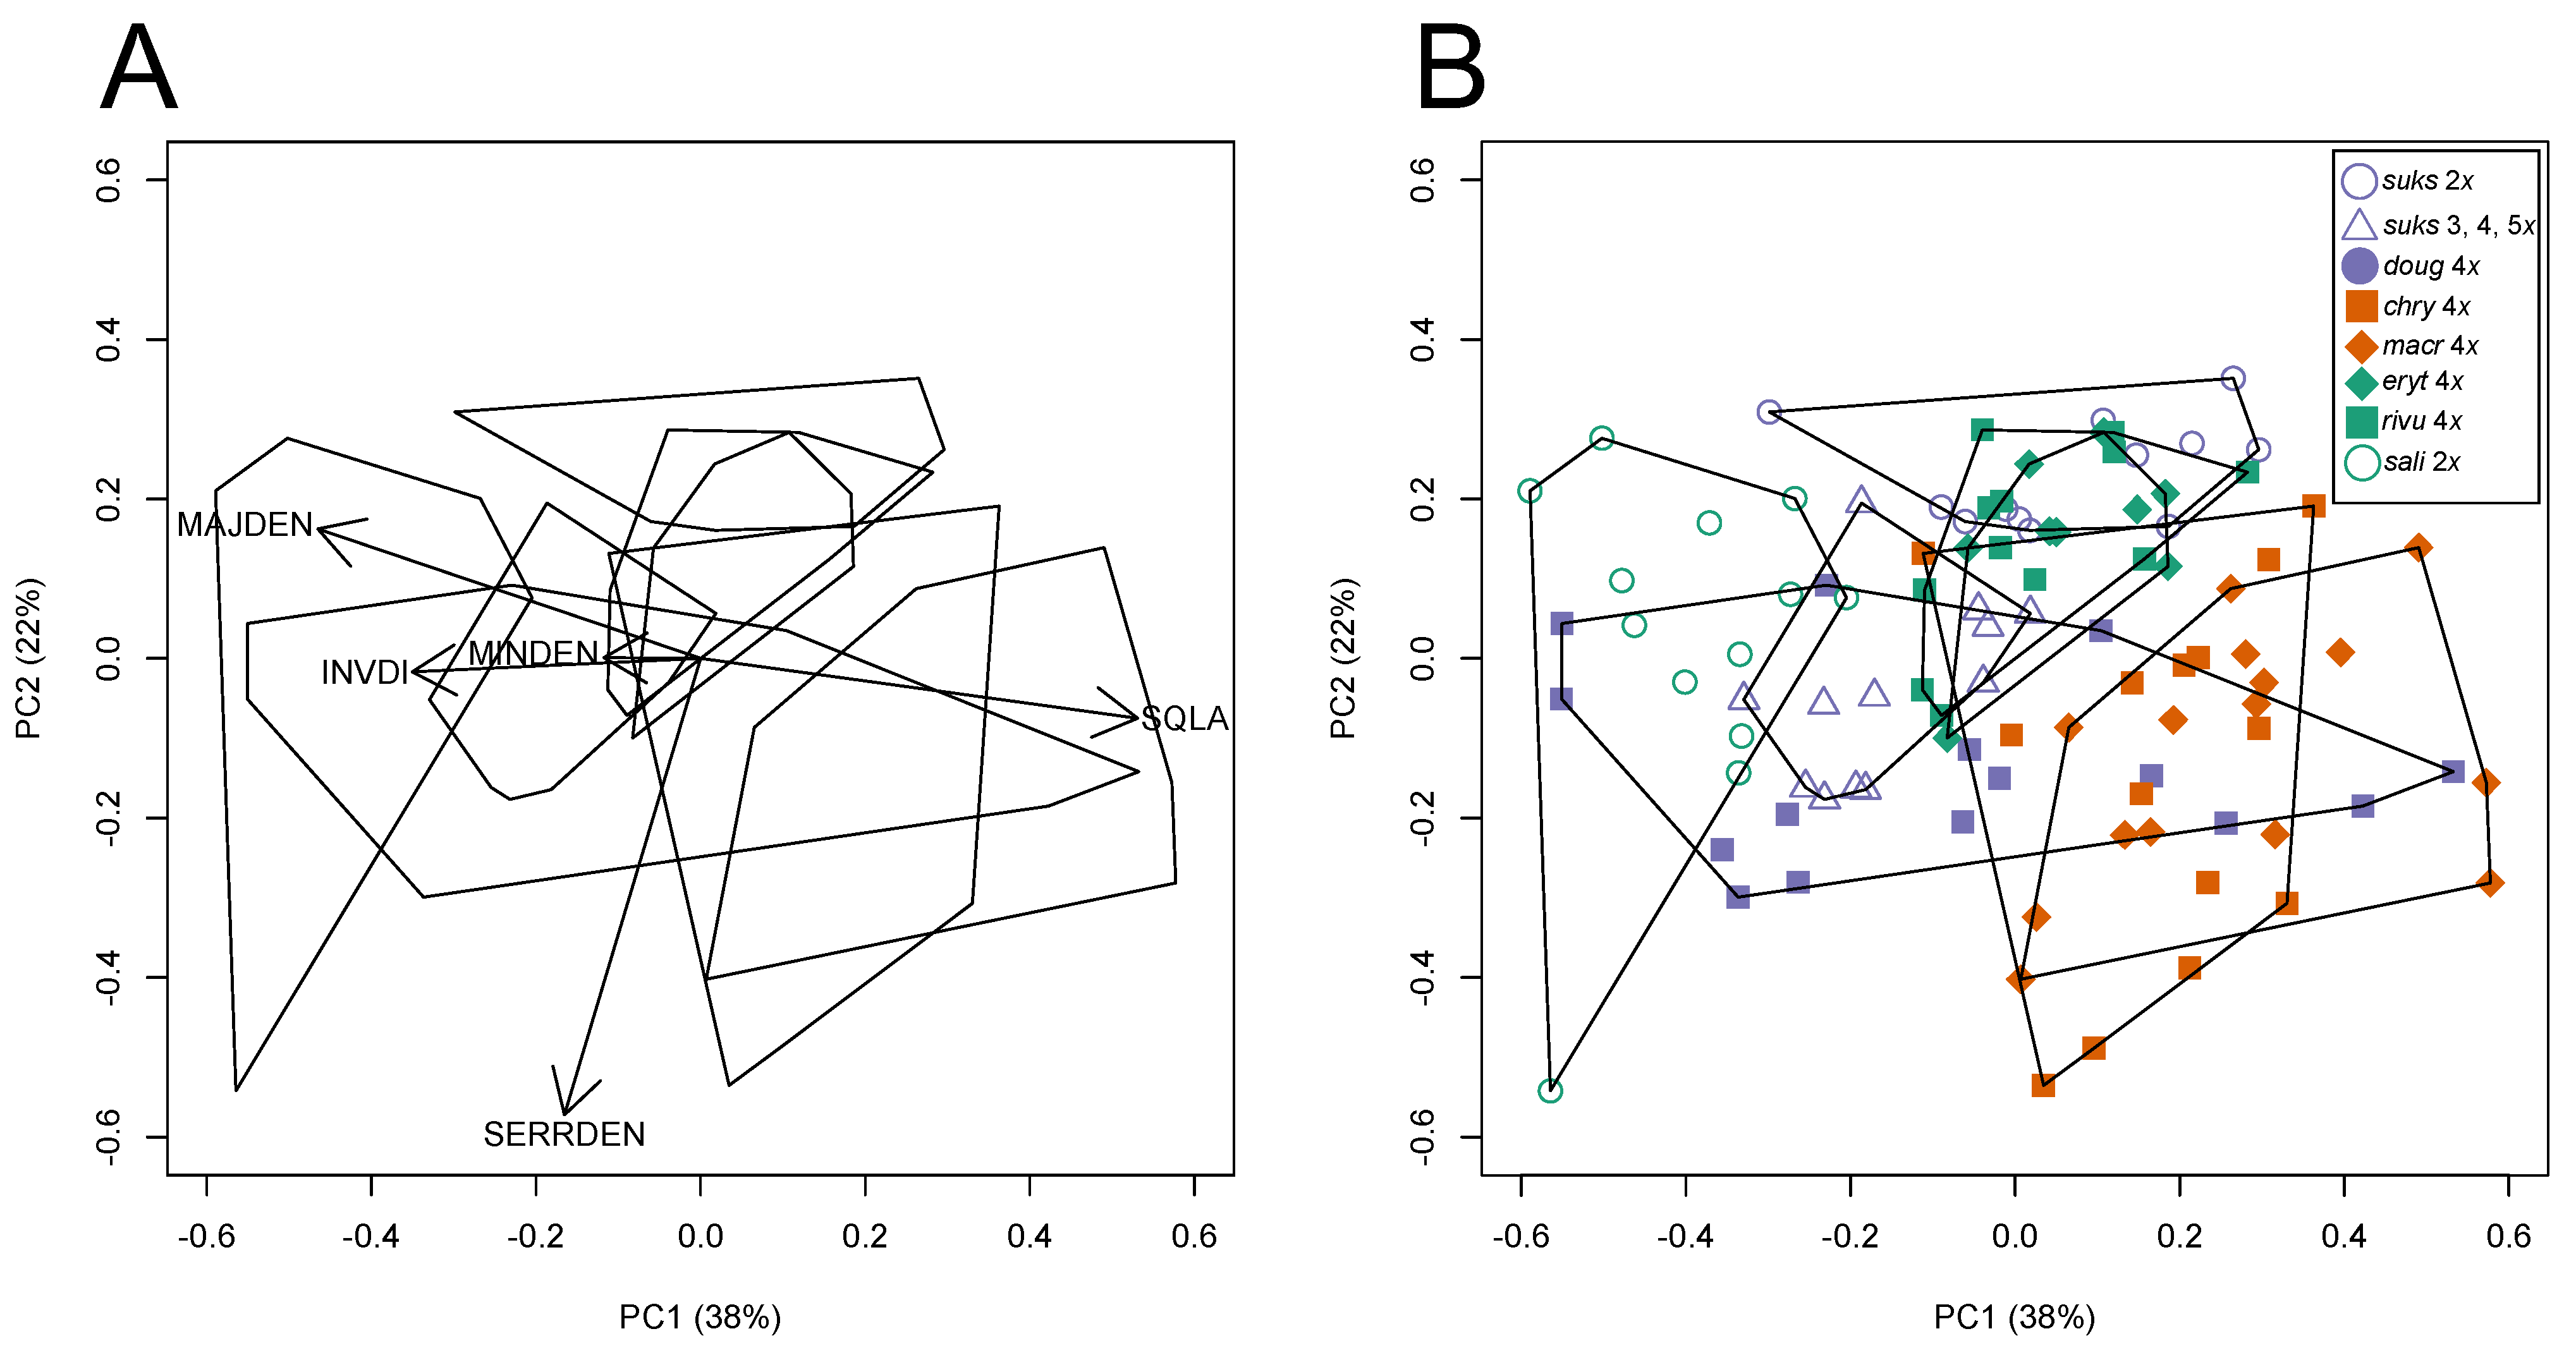
3.2.2. Leaf Vascular Architecture

Chemically cleared and stained leaves revealed the secondary and higher order venation in great detail (Figure 2). The principal advantage of this approach is that imaging is optical and lenses yield high magnifications without loss of resolution, unlike with X-rays, employed elsewhere [35]. Tests of normality and homoscedasticity of the mean values of the leaf architectural descriptors calculated for each voucher (Figure 5; see Table 1 for voucher sample sizes) detected the presence of a single outlier in MAJDEN (Figure 5D) but when the ANOVA was recalculated without this mean, the effect of taxon was significant (p < 0.0001). SQLA was found to be heteroscedastic at p = 0.09073 (Figure 2A). Overall, one-way ANOVAs of these mean values showed significant taxon effects (p < 0.0001 to p = 0.009). Linear mixed-effects model nested ANOVA for the descriptors of the cleared and stained leaves (Table 3) demonstrated significant fixed effects (taxon) and non-significant random effects (leaf within voucher; Table 5; compare Figure 5).
These univariate results are reflected in the PCA (Figure 6) in a manner that clarifies the contrast between the taxa in the study. Along the first PC axis the smaller, less lobed, more densely veined C. saligna is contrasted with the larger, more lobed, and less densely veined C. subg. Americanae taxa (Figure 6; compare Table 5, and Figure 2A,C,D). The second PC axis is associate primarily with only serration density, contrasting diploid C. suksdorfii with the other taxa (Figure 6; compare Table 5 and Figure 2B). In the plot of PC1 and PC2 (Figure 6) the Salignae allotetraploids and both C. suksdorfii cytotypes are all intermediate between C. saligna and the Americanae taxa. Predominantly allotetraploid Crataegus douglasii, on the other hand occupies almost the complete span of PC1 (Figure 6). This dataset is markedly multidimensional, witness the reductions in percent variance accounted for by PC1 and PC2, while the percentages accounted for by PC3, PC4, and PC5 are all significant according to the Frontier criterion. The third PC axis represents almost entirely the variation seen in minor vein density (MINDEN, Figure 5C).

3.3. Flow Cytometry

Supplementary Data Table S4 reports voucher information for published and new observations of seed flow cytometric breeding system inferences based on the ploidy levels of embryo and endosperm tissue [27,104,105] such that sexual reproduction predominates in diploids but occurs only occasionally in polyploids, whereas apomixis predominates in polyploids [27,39,41,45,46,47]. Notably, Crataegus saligna and a subpopulation of C. suksdorfii lying west of the Cascade Range in northern California, Oregon, and southwestern Washington are sexual diploids (Supplementary Data Table S4) [27,39,41,45,46,47]. Elsewhere, the C. suksdorfii diploids are described as a new species, in order to recognize their morphological and biological distinctness [106]. The flow cytometric data for polyploids corroborate earlier cytological and embryological data for tetraploid C. douglasii [31].

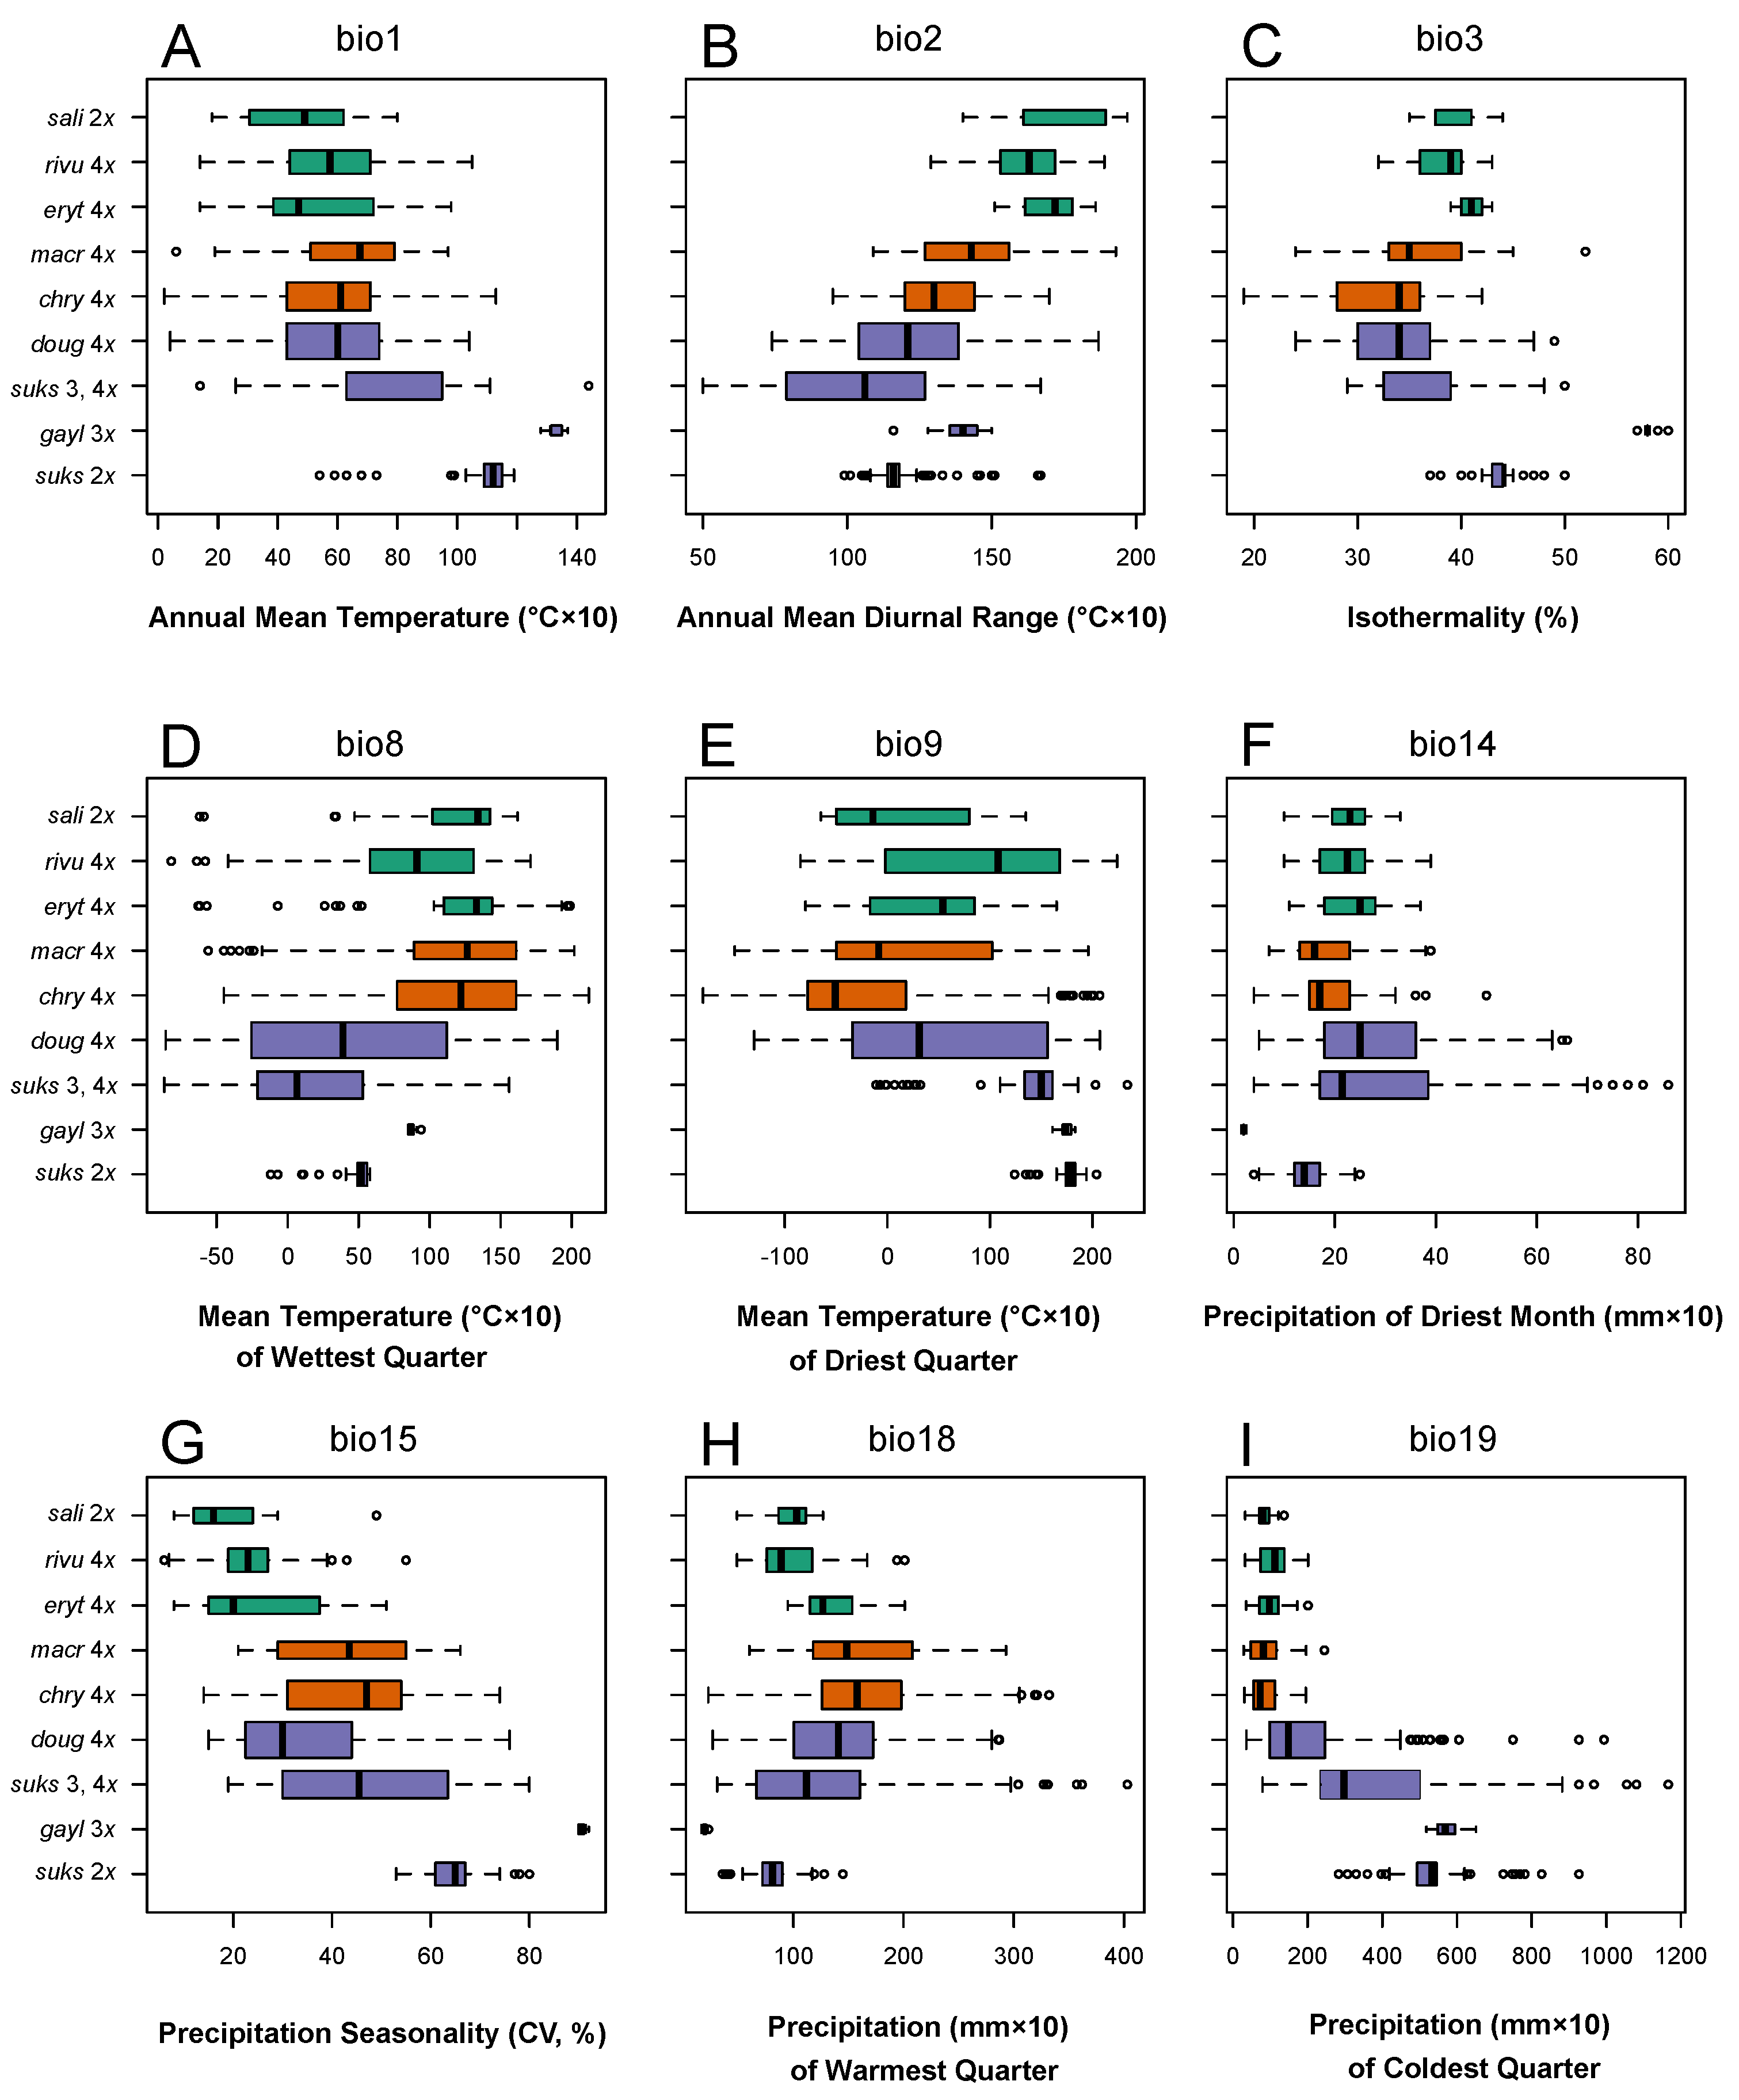
3.4. Climate Correlates of the Differences in Taxon Ranges

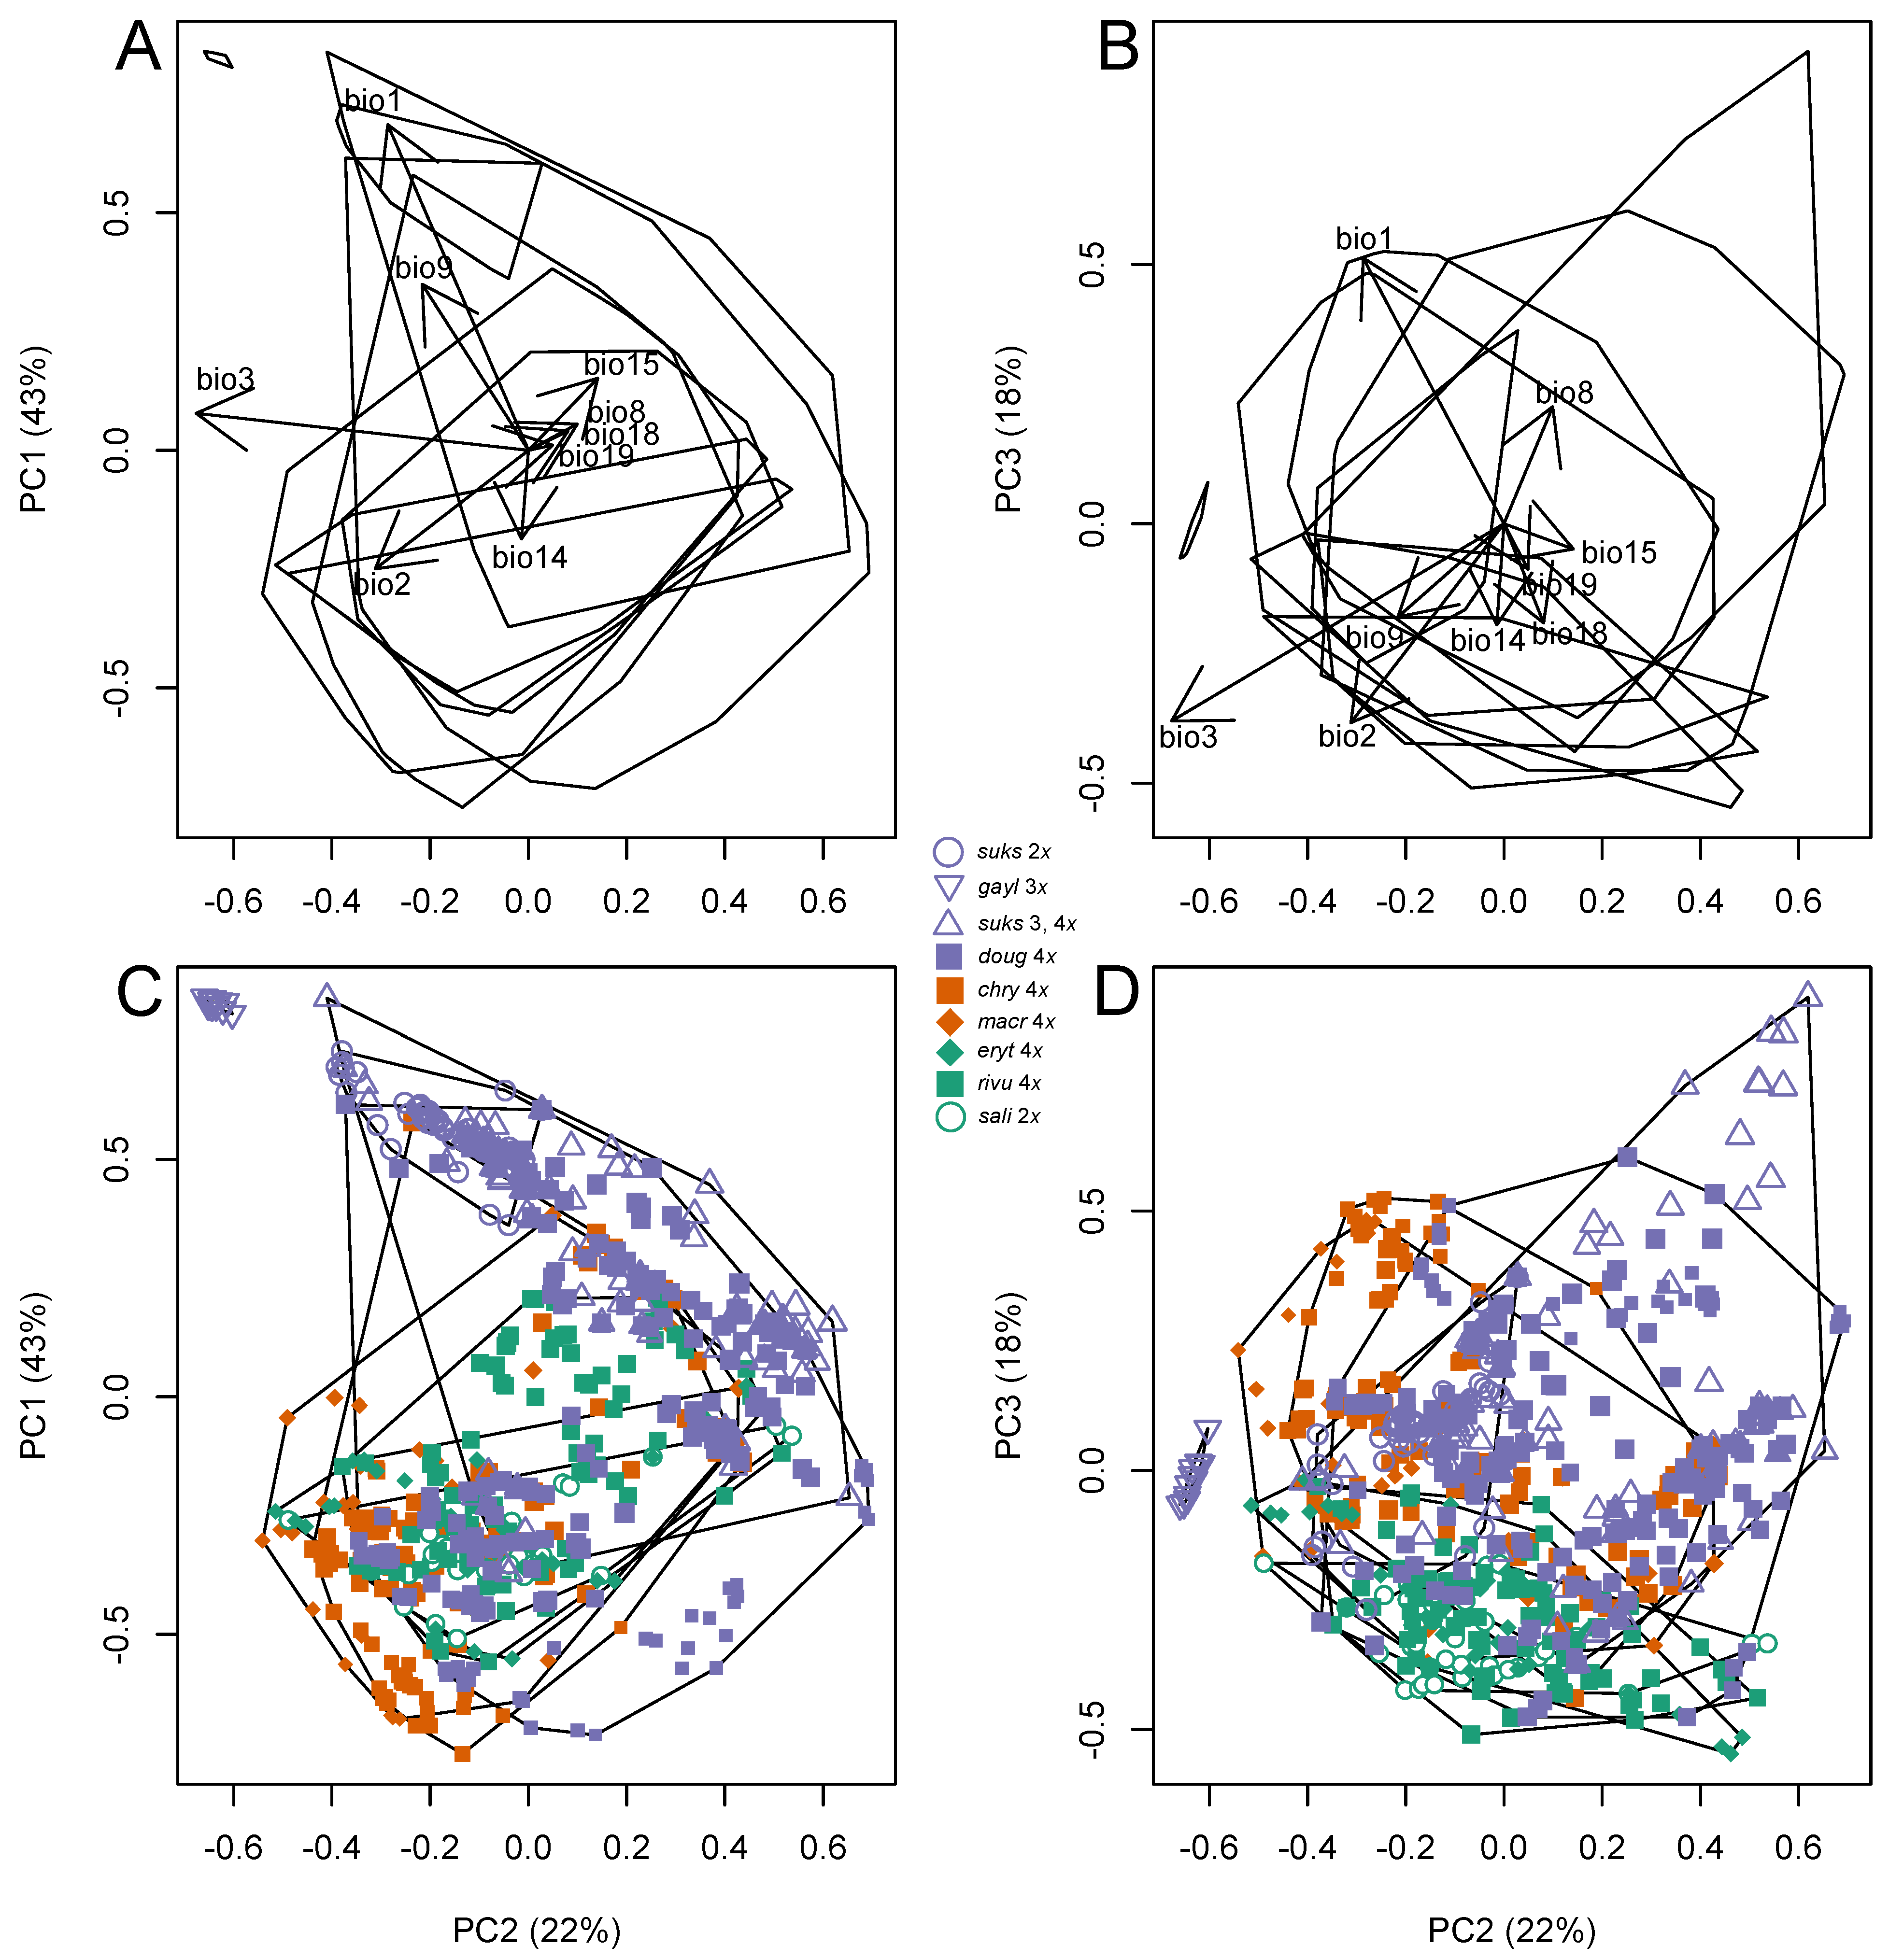
3.4.1. Climate Niche Comparisons

The bioclimatic descriptors mostly reveal climate contrasts between the Crataegus sect. Douglasianae sites and the sites where the C. sect. Salignae vouchers were collected (Figure 7). The C. subg. Americanae sites were generally either intermediate or resembled one or the other of the sections in C. subg. Sanguineae (Figure 7). The PCA of the bioclimatic descriptors summarizes these relationships, showing how diploid C. suksdorfii and its autotriploid derivative, C. gaylussacia, occupy exclusively the warmer, summer-dry, winter-wet quadrant of the ordination (Figure 8; compare Figure 7 for individual descriptors) [98]. Allotetraploid C. douglasii and allopolyploid C. suksdorfii (predominantly 3x), on the other hand, both occupy conditions extending over a wider range of climates, from winter-wet (in the western portions of their ranges; Idaho) to fully humid ones in the extreme north (Southern Alaska, West Central British Columbia) and east (upper Great Lakes basin, Lake Abitibi; compare Figure 1, Figure 7, Figure 8 and Figure 9).

3.4.2. Climate Niche Breadth and Overlap

Crataegus gaylussacia has the narrowest climatic niche (Figure 8), which is not surprising given that this species, as treated here (Table 1), is reliably known from only two counties in California (Figure 1B; Table 4). Its presumed progenitor, diploid C. suksdorfii, has a range only slightly larger (Table 4) but one that extends over a substantially larger portion of the climate space depicted in the PCA (Figure 8). The areal extent of diploid C. saligna is not much greater than that of diploid C. suksdorfii (compare Figure 1A,B; Table 4), but comparison of their extents in climate space (Figure 8) shows that C. saligna tolerates a considerably wider range of conditions (Figure 8 and Figure 9; arid BSk in Northeastern Utah and more mesic Dfb elsewhere in Utah and Colorado). The presumptive allopolyploids in C. subg. Americanae, C. sect. Douglasianae, and C. sect. Salignae all have similarly wider amplitudes in climate space (Figure 8 and Figure 9).
The sites for the C. sect. Salignae and C. subg. Americanae vouchers largely overlap with each other in generally cooler, drier conditions and overlap only partially with the climatic ranges of the C. sect. Douglasianae polyploids (Figure 8). The two diploid taxa, diploid C. suksdorfii and C. saligna occupy quite distinct regions of the ordination (Figure 8 and Figure 9), C. saligna being overlapped entirely by its allotetraploid derivatives, C. rivularis and C. erythropoda, and by the C. subg. Americanae taxa (Figure 8 and Figure 9). The climate range of diploid C. suksdorfii overlaps only with portions of the ranges of allopolyploid C. suksdorfii and allotetraploid C. douglasii (Figure 8 and Figure 9). The climatic niches of the Americanae sites and those of the Sanguineae allopolyploids, like their geographic ranges (Figure 1), overlap considerably (Figure 7 and Figure 8). As a result, classification tree analyses of the bioclimatic data (not shown) were not especially useful; except for C. gaylussacia and, to a lesser extent, diploid C. suksdorfii, taxa were not resolved into homogenous groups (leaves). The Douglasianae sample exhibits greater taxon allopatry, so an analysis was restricted to just these records (Table 1). Here too the analysis failed to resolve homogeneous taxon groups. Intermingling of allotetraploid C. douglasii and allopolyploid C. suksdorfii was especially marked (compare Figure 7 and Figure 8). Only by using ploidy level rather than taxon as a response variable was it possible to obtain a tree that could be considered informative. Allopolyploids (C. douglasii, C. suksdorfii), autopolyploids (C. gaylussacia), and diploid C. suksdorfii were resolved into five groups (leaves) in a minimum deviance tree employing only bio1, bio3, and bio15 (Figure 7 and Figure 8). The intermingling of some records (approx. 5%) reflected areas of overlap between climate niches and a lack of confirmed ploidy level data in a few cases (Supplementary Data Table S1).

4. Discussion

Only since molecular data demonstrated the probable hybrid origin of western North American black-fruited (allo-) polyploids [4,37,43] has there been a rationale to include members of C. subg. Americanae in morphological comparisons aimed at investigating, in the case of the allopolyploids, their intermediacy with respect to putative parent taxa. Such a comparison was made earlier [107], but in the context of identification rather than an investigation of possible hybrid intermediacy. The biogeography of these taxa is critical, since it relates not only to discussions of geographic parthenogenesis on the one hand, but also both to questions concerning the taxonomic recognition of apomicts on the other (Table 5) [24,108,109], and to questions of hybidization (their sympatry, or lack thereof). Our results thus suggest possible evolutionary scenarios involving these taxa that are open to future investigations.
Figure 9. Geographic distribution of sites occupied by Crataegus sect. Douglasianae and C. sect. Salignae samples studied here, together with those occupied by the C. subg. Americanae taxa with which comparison is made. These sites are plotted on the map of the Köppen-Geiger climate classification [54,110] (see http://koeppen-geiger.vu-wien.ac.at/present.htm, accessed on 2 January 2021) and visualized using Google Earth Pro. Conversion of the specimen data to the Google Earth Keyhole Markup Language (.kml) was carried out using the Earth Point Excel To Kml function [52]. See larger version at https://0-doi-org.brum.beds.ac.uk/10.5281/zenodo.5567919.
Agronomy 11 02133 g009

4.1. Are the Taxa Studied Here Distinct?

Past nomenclatural confusion is now almost entirely resolved by Phipps [44] save for the recognition of C. sect. Salignae [35], a much narrower circumscription of C. gaylussacia, and recognition of the diploid C. suksdorfii cytotype as a species distinct from allopolyploid C. suksdorfii [37,106]. The distinctiveness of C. section Salignae (Figure 1) has been known since molecular data became available (microsatellites, Figure 9a in) [36]; DNA sequence data from combined chloroplast and nuclear loci (Figure 3 in) [104]. What follows confirms nomenclatural decisions that have already been made for the most part, but the recircumscription of species in section Douglasianae is deferred [106].

4.1.1. Morphological Differentiation

When the ranges of the taxa studied here (Figure 1) are taken into consideration (Table 6) it is apparent that the apomictic allopolyploids are for the most part morphologically distinct where they occur in sympatry. The chief exception (Table 6) is C. erythropoda, which is distinguished from C. douglasii and C. rivularis [3,36] by features (notably leaf shape) not captured by the suite of descriptors used here (Figure 3 and Figure 4, but see Figure 5E). Morphological data, especially when analyzed using phenetic methods (Figure 9b in) [36]; (Figure 1 in) [111], have emphasized other contrasts and patterns of resemblance. That said, clustering and ordination of the phenetic data presented by Phipps et al. (Appendix 3 in) [3] demonstrated the propinquity of C. rivularis and C. saligna, and their separation from C. brachyacantha (unpublished results, referred to in) [112]. Cladistic analyses of morphological data have included only C. rivularis with other, non-Salignae, black-fruited species (seven characters, 10 OTUs, in) [113] or, if they have included all three Salignae species (38 characters, nine OTUs, in) [114], have demonstrated a Salignae clade. In Phipps’ publication [114] the tree was rooted with C. monogyna (sect. Crataegus), leaving C. brachyacantha nested within a Salignae-Douglasianae clade. Re-rooting this tree using Mesquite 3.10 [115], with C. brachyacantha sister to all the other species as demonstrated by molecular data [4,37,43,103,116], made the Salignae clade sister to the Douglasianae, C. monogyna, and C. mollis. Nevertheless, until recently [44] C. saligna was retained in section Brevispinae with C. brachyacantha [3].
The choice of morphometric descriptors used here is consistent with earlier work [31,36,117,118,119], in that fewer, mostly ratio scale descriptors have been preferred than has been the case in the work of some others, e.g., [51]. The rationale for this is partly to simplify and speed up data collection, and partly to facilitate interpretation and the use of hypothesis-testing approaches [120] when these are needed. The comparisons of leaf venation are novel in Crataegus, despite their potential value in ecological investigations and studies of fossils.
The results obtained here (Figure 3 and Figure 4; Supplementary Data Table S2) confirm that the main widely distributed red- and black-fruited hawthorns of western North America are morphologically distinct and readily identifiable in the field [44]. This was shown earlier for just the black-fruited species (not including C. erythropoda) with respect to leaf shape (Figure 3 in) [36] and with respect to a suite of vegetative and reproductive descriptors (Figures 4–8, and also the key, in) [36], corroborated here in the context of the comparison with the C. subg. Americanae taxa (Figure 3 and Figure 4). In the sample studied here the red-fruited Americanae are largely distinct from the black-fruited Sanguineae because of contrasts in calyx lobe toothing and pubescence, inflorescence pubescence, and thorn length (Figure 3 and Figure 4). Superimposed on these contrasts between the two subgenera is the contrast in ploidy level, and correlated differences in floral architecture: diploid Crataegus appear to uniformly have approximately 20 (or more) stamens per flower, and closer to five gynoecial subunits (visible as styles) [31,36].

4.1.2. Genetic Differentiation

Sequence data from plastomes and nuclear loci also support the distinctness of the taxa studied here and their cladistic relationships [4,37,43,121,122]. Although analyses of genetic data are not part of this study, in the context of establishing the extent to which the taxa studied here are genetically differentiated from each other it is worth noting results suggesting the extent to which morphological differentiation is associated with genetic differentiation. Microsatellite data demonstrated the differentiation of the Douglasianae and Salignae (Figure 9a in) [36] and, within the Douglasianae, of C. douglasii, diploid C. suksdorfii, and polyploid C. suksdorfii [39,106,123]. In a different context, microsatellite data likewise enabled Coughlan et al. [99,124] to infer that, across its wide and disjunct continental range, allotetraploid C. douglasii comprises general purpose, clonal genotypes.

4.2. Geographic Parthenogenesis?

4.2.1. Biogeographic Differentiation

The occurrence data we have obtained from herbarium specimens either examined directly or discovered by means of online portals to the databases of herbaria elsewhere (Supplemental Data Table S1) are broadly representative of the known distributions of the taxa studied here (Figure 1, Table 4) [44]. No attempt was made to sample the Americanae taxa further east than the eastern extent of the North American Sanguineae (Figure 1, Table 4) [44]. These distribution data make clear the much smaller areal extents of the ranges of the Douglasianae and Salignae sexually reproducing diploids, when compared with those of their alloplyploid, apomictic derivatives (Figure 1, Table 4). They also demonstrate different patterns of pairwise allopatry or sympatry (Table 6) that are important for making inferences about hybridization (Section 4.5 below). Finally, the great areal extents of the ranges of the apomicts demand explanation in light of the absence (or the lower frequency) of genetic recombination in these taxa (e.g., re C. douglasii) [99,122].
We have compared the hawthorn taxa studied here with respect to the areal extent and location (hence, overlap, if any) of their ranges by treating these as convex hulls calculated on the Earth’s surface for the occurrence data (Figure 1; Table 4; Supplementary Data Table S1). This is an oversimplification for a number of reasons [24,125], yet it is adequate for our purposes as it clearly depicts the relative magnitudes of the taxon ranges. The convex hulls in Figure 1 include areas not suitable for the growth of woody plants, so they overestimate the areas actually occupied or even suitable for occupation. In Figure 1B, however, we have depicted the disjunct distribution of C. douglasii (compare Figure 9). These hulls (and, in the case of C. douglasii, their positions) are indicative of the distances over which stepwise dispersal has occurred in the past, such as the postglacial migration of C. douglasii not only north into British Columbia following the retreat of the ice, but also from the Cordillera to the upper Great Lakes basin (Figure 1; Section 4.2.2 below).
The deficiencies of Figure 1 with respect to the distribution of suitable habitat are partially overcome by using modeled climate data for the actual points of occurrence to capture and compare the climatic features of the habitat where the taxa studied occur (Figure 7 and Figure 8). Another way of visualizing the climate data, in geographic rather than climate space, is by superimposing the taxon distributions (Figure 1) on a map of climate types, such as the “World Map of the Köppen-Geiger climate classification updated,” from which the climate class descriptions below are taken; see http://koeppen-geiger.vu-wien.ac.at/present.htm [54,110]. Climate diagrams explicating a similar classification into bioclimatic regions are available elsewhere (see Figure 2.3, 2.6, 2.8, 2.15 in [96,126,127]). In these ways we make it clear that the taxa studied here are largely restricted to areas with warm temperate to boreal climates which, in turn, are not randomly distributed but rather reflect continental patterns related to elevation and location. In addition, the climate classification system provides a useful interpretation of the geographic distribution in terms of the cyclic, temporal aspects of local climate conveyed by standard climate diagrams. Finally, we note that use of the Köppen-Geiger Climate Classification here may facilitate integration of Crataegus fossils into estimations of paleoclimates using “Köppen signatures” linking fossil plants and their modern analogues to major global vegetation zones and their corresponding climate zones [128,129].

4.2.2. Ecological Differentiation

It is noteworthy the way in which our data demonstrate only limited differentiation in climate niche between diploid C. saligna and allotetraploid C. rivularis and C. erythropoda (Figure 7 and Figure 8), despite the contrast seen between these taxa in their leaf vascular architecture (Figure 5 and Figure 6) as well as breeding system and ploidy level. Results from C. sect. Douglasianae have been quite different [38,39,40,45] and, as seen here as well, with marked contrasts in climate niche between diploid C. suksdorfii and the allopolyploids (triploid and tetraploid C. suksdorfii, tetraploid C. douglasii; Figure 7 and Figure 8).
The taxa studied here mostly occupy a vast swath of northern North America where water is not limiting (Figure 9; fully humid, annual minimum temperatures ≤−3 °C, with a cool summer and cold winter; climate class Dfc, or with a warm summer, climate class Dfb). This region extends westward from the Atlantic coast of New England and the Canadian Maritime provinces to the rain shadow of the western Cordillera (Figure 9). Further west, its occurrence is much patchier, typically on the windward slopes of the mountains. Still further west, the species studied here are found in warmer climates, from the Pacific coast inland to the slopes of the Cascades and Sierras in the United States (Figure 9; fully humid, −3 °C < annual minimum temperatures ≤ +18 °C, with a warm summer; climate class Cfb). Much of this region experiences summer drought and hot summers (Figure 9; climate class Cfa). In the rain shadow of the Cascades, Sierras, and the Cordillera there are large expanses of cold, arid steppe climate (Figure 9; mean annual precipitation > 5 × the dryness threshold, Pth, where Pth is defined in terms of both mean annual temperature and the seasonality of precipitation, and annual mean temperatures <+18 °C; climate class BSk) [54]. Only Crataegus saligna and C. rivularis are found widely under these conditions, in northeastern Utah (Figure 9; C. rivularis also in Nevada and Wyoming). Elsewhere (Colorado) C. saligna experiences climate class Dfb (Figure 9). Crataegus douglasii, C. chrysocarpa, and C. macracantha also have a small number of stations in the Okanagan Valley in a narrow north–south belt of BSk climate that extends from Kelowna south into the Columbia Plateau in Washington and Oregon. In these locations, and in the west generally, ground water availability likely compensates for limited growing season atmospheric input, as virtually all western occurrences of taxa studied here are either adjacent to water bodies, or are located where subsurface water moving downslope is likely to be intercepted [40,130,131]. Elsewhere in their range C. douglasii, C. chrysocarpa, and C. macracantha may occur in small islands of Dfb surrounded by steppe (e.g., Bearpaw Mountains in Montana, Black Hills, etc.).
In contrast, diploid C. suksdorfii and autotriploid C. gaylussacia are the only taxa restricted to Pacific Northwest Marine and Mediterranean ecoregions (Csb, Figure 9). The other taxa all have much wider distributions. Figure 7 demonstrates how diploid C. suksdorfii and autotriploid C. gaylussacia experience higher mean annual temperatures (bio1), diurnal temperature variations up to almost 60% of the annual variation (bio3), and hot and dry summers and wet winters (bio9, bio14, bio15, bio18, bio19). The Douglasianae as a whole, however, occupy sites at which the wettest quarter is colder than is the case for the Americanae and Salignae (bio8). For the most part, the climate niches of the (allo-) polyploids are similar to each other (Figure 8), as they are frequently sympatric (Figure 1 and Figure 9).

4.2.3. Geographic Parthenogenesis?

Sexual diploids in C. sections Douglasianae and Salignae have more limited areal (and in the Douglasianae, latitudinal) extents than do the apomictic, self-fertile allopolyploids derived from them (Figure 1; Table 4). Thus, both agamic complexes exhibit geographic parthenogenesis. The Douglasianae autopolyploids appear to resemble the diploids in their limited geographic ranges, suggesting that polyploidy by itself does not confer wider ranges. The wider geographic ranges of the Douglasianae allopolyploids also correspond to climate niches that are wider than those of the diploids. This does not appear to be the case with the Salignae (Figure 7, Figure 8 and Figure 9).

4.3. If Geographic Parthenogenesis: Adaptation?

Our results suggest that only in C. saligna are there features of the leaf vascular architecture (greater major and minor vein density (MINDEN, MAJDEN; Figure 5 and Figure 6) related to increased leaf hydraulic conductance [80], greater photosynthetic rates [132], and greater drought tolerance [82]. In other words, only in C. saligna is there evidence of adaptation to colder, drier habitats having occurred. Although there are substantial morphological differences between the species studied here (Figure 3, Figure 4, Figure 5 and Figure 6; Table 5), it is unclear whether any of them can be construed as adaptive, even for the purposes of future hypothesis testing. Arguably, only diploid Crataegus saligna warrants further examination on this score, given that it exhibits the combination of the smallest leaf sizes (Figure 5A; Table 5) and greatest leaf vein density (Figure 5C,D; Table 5) and, that a substantial portion of its limited range (Figure 1A; northeastern Utah) consists of semi-arid steppe vegetation (Figure 9) [133]. The range of allopolyploid C. rivularis includes that of C. saligna in its entirety, and extends into the more mesic climate class Dfb (Figure 9). Crataegus erythropoda is sympatric with C. saligna only in the eastern portion of the diploid’s range (Figure 1A; Colorado, adjacent New Mexico; climate class Dfb). Compared to the diploid sexual species, the two apomictic allopolyploid species derived from C. saligna occupy in part or in the entirety of their ranges what would appear to be less challenging climatic conditions.
The range of diploid C. suksdorfii is similarly restricted geographically (Figure 1B; Table 4), and restricted even more so climatically (Figure 8; climate class Cfb, Figure 9). In contrast, allopolyploid C. suksdorfii and C. douglasii occupy much more extensive ranges (Figure 1B; Table 4) that are climatically more diverse, comprising climate classes Cfb, Csb, Dfb, and Dfc (Figure 9). Nevertheless diploid, sexual C. suksdorfii only differs appreciably from its apomictic allopolyploid derivatives, C. suksdorfii and C. douglasii, in leaf serration density (Figure 5B; Table 5). The greater areal extents and climatic amplitudes of the ranges of these two allopolyploids appear to have been accomplished without any other modifications of leaf morphology.
Fleshy fruits like those of the Malinae are associated with dispersal by vertebrates (for Crataegus, see) [9], often over relatively long distances (up to tens of km) [134,135]. In Crataegus this is part of a larger syndrome of colonization of often ephemeral, open, high light intensity and early successional habitats. Where Malinae species have been introduced and are successful to the point of becoming invasive, superior dispersability is not limited to polyploid apomicts or selfers. Rather, there are instances where self-incompatible diploids are widely dispersed, having achieved continent-wide distributions in North America within 200 (Crataegus monogyna Jacq) [136,137] to 400 years (feral Malus domestica (Suckow) Borkh.) [138], admittedly with some degree of human assistance. Similarly, some diploid hawthorns have successfully colonized previously glaciated land surfaces in Europe (e.g., C. laevigata (Poir.) DC, C. monogyna) [139] and North America (C. calpodendron (Ehrh.) Medik.; C. mollis Scheele; C. punctata Jacq.) [44]. In most of these cases sexuality has been demonstrated both embryologically [140] and by means of flow cytometric seed scans (Supplementary Data Table S4) [27]. These examples from sexual diploids are meant to emphasize the degree to which hawthorns, as a genus, are specialized as colonizing species and are capable of achieving wide geographic distributions, even without the advantages of apomixis and (or) self-compatibility [141]. Once established and left undisturbed, individual hawthorns may persist for long periods, rooting deeply so as to enable them to access more than surficial sources of nutrients [142] and water [143,144,145,146]. As a result they are well-known in many places as aggressive, sometimes difficult to control weeds (see references in) [8,117].

4.4. If Geographic Parthenogenesis: Breeding System?

Instead, other features of polyploids, and hybrids, may be responsible for the greater ecological amplitude and the greater areal extent of the ranges of the allopolyploids in our sample, compared to their diploid parents. The striking thing about the datasets studied here is the contrast between breeding system (all taxa studied except C. saligna and diploid C. suksdorfii are apomictic, self-fertile pseudogamous tetraploids) on the one hand and, on the other, range (Figure 1; Table 4), morphology (Figure 3 and Figure 4), and climate niche (Figure 6, Figure 7 and Figure 8; Table 5), all of which demonstrate the intermediacy of the Douglasianae and Salignae allopolyploids relative to their putative parents. Pseudogamous gametophytic apomixis and tetraploid self-compatibility can explain the greater areal extent of the ranges of the polyploids in our comparison (thus, geographic parthenogenesis) much better than might leaf morphological adaptations to xeric conditions seen only in the diploid C. saligna.
Of the three subfamilies making up the Rosaceae the two largest, Amygdaloideae and Rosoideae, both contain many genera in which polyploidy is associated with gametophytic apomixis, such that distributional contrasts between diploid sexuals and polyploid apomicts are possible. Nevertheless, it appears that few of these cases have been investigated, e.g. [147]. Several such cases are found in Rosaceae tribe Maleae Small, a group of about 30 genera that appears to have arisen through a whole genome duplication within the Amygdaloideae [148,149,150]. The larger of two subtribes, the Malinae (fleshy fruits, including apples, hawthorns, pears, and quinces among others), includes six “large” genera (Amelanchier, Cotoneaster, Crataegus, Malus, and the Aria/Sorbus complex) in which both pseudogamous gametophytic apomixis by means of apospory, and polyploidy, are frequent [26]. Only in Amelanchier [28] and Crataegus, however, has geographic parthenogenesis been documented. Other genera in the subtribe also show evidence of producing unreduced female gametes [109], but without having induced the same kind of proliferation of species (and the accompanying taxonomic complexity) seen in the “large” genera.

4.5. Hybridization

Saltatory acquisition of uniparental reproduction as a consequence of diploid-tetraploid hybridization (and consequent triploidization), followed by fertilization of the unreduced female gametes of a triploid hybrid (i.e., backcross with the diploid parent), is a two-step process in which, arguably, the only selection involved is for successful reproduction, cf. [121,151]. In C. rivularis and C. erythropoda the less pronounced morphological adaptations to low temperatures and xeric conditions than those found in C. saligna (Figure 5 and Figure 6) would be offset by increased colonizing ability due to apomixis and self-compatibility. Studies of the Douglasianae have shown that, compared to diploid C. suksdorfii, polyploid C. suksdorfii and C. douglasii invest proportionally more resources in dispersal-related components of their disseminules (fruit pulp) than they do in components related to seedling establishment (seed mass) [38]. We hypothesize that meiotically reduced pollen from flowers of tetraploid, apomictic C. subg. Americanae (C. chrysocarpa or C. macracantha or their ancestors in sections Coccineae and Macracanthae; Table 1) reached flowers of ancestral diploid, self-incompatible C. saligna and C. suksdorfii (subg. Sanguineae) to produce cohorts of triploid, apomictic offspring. Such triploids are apparently no longer extant in C. sect. Salignae, but represent the majority of allopolyploid C. suksdorfii investigated to date (Supplementary Data Table S4). Some of these triploids succeeded in reproducing following fertilization of their unreduced female gametes by reduced pollen from diploid C. saligna and C. suksdorfii individuals [121]. The resulting tetraploid offspring presumptively combine the two parental genomes (subg. Americanae and subg. Sanguineae) in equal proportions [37] and produce predominantly unreduced female gametophytes much as do their Americanae parents [27,46,47]. Successful seed set in these tetraploids can result from self-pollination as well as from cross-pollination [47]. Talent has noted how in Crataegus any endosperm balance requirement is relaxed [152,153], and this has been borne out in studies of other Maleae genera as well, such as Amelanchier [28] and Sorbus [154]. Allotetraploids thus add the advantage of frequently uniparental reproduction [141] to the others related to specialization for colonization of dispersed, ephemeral, high light intensity habitats.
As noted already (Table 4), the Crataegus subg. Americanae tetraploids, C. chrysocarpa and C. macracantha, have almost transcontinental ranges that encompass the same climate classes as the Sanguineae allotetraploids (Figure 9) [44]. In fact, Phipps [44] points out that, “East of the Rocky Mountains, C. chrysocarpa is the most northerly and cold-adapted species of hawthorn in North America and nearly reaches Hudson Bay in Ontario.” Hybridization with C. chrysocarpa, documented for Northern Ontario anecdotally by Phipps and Muniyamma [100], could account for cold tolerance in the Douglasianae allopolyploids in which, as in C. chrysocarpa, there does not appear to be any contrast in leaf morphology comparable to that seen in C. saligna (Figure 5; Table 5).

5. Conclusions

Geographic parthenogenesis provides a useful lens through which to examine the interplay of morphology, ploidy level variation, breeding system variation, and ecological amplitude in some related, widespread North American hawthorn species. Our efforts to do so suggest what features of hawthorn biology may be important in the evolution and diversification of the genus. Our focal group, North American Crataegus subg. Sanguineae, has the advantage of being relatively small (we have focused on the five most widespread species, comprising the only two diploids, and their allopolyploid derivatives) with, as a group, a nearly continental distribution. We suggest that our results will provide useful insights for understanding other Crataegus species groups in North America and elsewhere.
The black-fruited Crataegus sect. Douglasianae and sect. Salignae taxa studied here are distinct from one another, as well as from the two red-fruited C. subg. Americanae taxa included in the sample (Table 6). In both black-fruited sections the differences between sexual diploids and apomictic polyploids in the areal and elevational extents of their ranges demonstrate geographic parthenogenesis (Table 4). In C. sect. Douglasianae there is also an obvious difference in the latitudinal extents of the species ranges (Figure 1B and Figure 9), most conspicuously between diploid C. suksdorfii, restricted to southern, largely unglaciated regions of the Pacific Northwest and allopolyploid C. douglasii and C. suksdorfii, the Canadian ranges of which (Figure 1B) were almost entirely covered by the ice of the last glaciation [126,155]. Differences in vascular architecture and climate niches appear to play only a limited role in how geographic parthenogenesis manifests itself in these taxa, contrary to some assertions about the phenomenon [156]. Only diploid C. saligna exhibits leaf vascular features that can be associated with greater tolerance of cold and arid conditions (Figure 5 and Figure 6; Table 5), and there is only limited niche differentiation between C. saligna and its allotetraploid derivatives C. rivularis and C. erythropoda (Figure 7 and Figure 8). In C. sect. Douglasianae, differences in leaf vascular architecture exist, but do not parallel differences in ploidy level (Figure 5 and Figure 6; Table 5). The climate niche of diploid C. suksdorfii is a subset of the much more extensive ones of the allopolyploids (Figure 8).
Differences in breeding system between the Douglasianae and Salignae diploids and their allopolyploid derivatives are much more striking and consistent in the way they parallel the differences in geographic ranges. The more constrained ranges of the diploids (Figure 1; Table 4) are associated with self-incompatibility and almost exclusively sexual seed production. Conversely, the greater areal extent (and environmental amplitude) of the ranges of the allopolyploids is associated with self-compatibility and pseudogamous agamospermy. Similarly, diploids and allopolyploids provide evidence for proportionally greater investment in seedling establishment in the former, as against seed dispersal in the latter [38]. These differences, and those in morphology, cannot readily be disentangled from the hybrid origin of the allopolyploids. Calyx lobe toothing and reduced stamen numbers, the occurrence of gametophytic apomixis, and cold tolerance would have been introduced into the allopolyploids via pollen from taxa in red-fruited C. subg. Americanae.

Supplementary Materials

The following are available online at https://0-www-mdpi-com.brum.beds.ac.uk/article/10.3390/agronomy11112133/s1, Supplementary Data Tables S1 (Vouchers for occurrence and bioclimate data represented in Figure 1, Figure 7, Figure 8 and Figure 9), S2 (Vouchers and morphological data in Figure 3 (boxplots) and Figure 4 (PCoA)—all based on spring collections and corresponding suite of descriptors), S3 (Herbarium specimens from which leaves were removed for clearing and staining, cross-referenced to MorphoBank projects P2423 and P2523), and S4 (Vouchers for flow cytometry data published in Agronomy and in earlier papers, with TRT barcode numbers linkable to online specimen images).

Author Contributions

Conceptualization, T.A.D.; data curation, T.A.D.; formal analysis, T.A.D.; funding acquisition, T.A.D.; investigation, T.A.D., B.X.Y., S.H. and M.Z.; methodology, T.A.D., B.X.Y. and S.H.; project administration, T.A.D.; supervision, T.A.D.; validation, T.A.D.; visualization, T.A.D., B.X.Y. and S.H.; writing—original draft, T.A.D. and B.X.Y.; writing—review and editing, T.A.D. All authors have read and agreed to the published version of the manuscript.

Funding

This research was funded by the Royal Ontario Museum (ROM) Future Fund, the Department of Museum Volunteers, and the Governors of the Royal Ontario Museum, and by the ROM/ROMCA (Royal Ontario Museum Curatorial Association) Special Research Fund, 2014–2019; Discovery Grant A3430 (re-applied for at 3–5 year intervals), from the Natural Sciences and Engineering Research Council of Canada (NSERCC), 1987–2015; and NSERCC Strategic Project Grant (381073), 2010–2012, joint with Prof. S. Stefanović (University of Toronto—Mississauga), Paul Shipley (University of British Columbia—Okanagan), S. Proctor (University of Alberta) and the Naturally Grown Herb and Spice Growers Co-operative (HerbPro; Edgewood BC, J. Lee, President); Paula Brown (British Columbia Institute of Technology) materially assisted us in obtaining this grant. Funding from the Canada Foundation for Innovation, NSERCC, and the Université de Montréal provided the Canadensys infrastructure and equipment that made possible imaging the TRT specimens and deploying the specimen data and images via the Canadensys portal. Jen Shiller and Jurgena Tusha’s 2010 fieldwork and data collection were supported by a grant from the University of Toronto Faculty of Arts and Science. S.H.’s participation was funded in part by her 2012 NSERCC Undergraduate Student Research Award. Several of the student assistants acknowledged below were co-funded by the University of Toronto Work Study program; all of the University of Toronto and NSERCC funding was facilitated by the Department of Ecology and Evolution (and its predecessor, the Department of Botany).

Institutional Review Board Statement

Not applicable.

Informed Consent Statement

Not applicable.

Data Availability Statement

Data for this study may be found in Supplementary Data Tables S1–S4. A larger version of Figure 9 is available at https://0-doi-org.brum.beds.ac.uk/10.5281/zenodo.5567919.

Acknowledgments

We are deeply indebted to the herbaria that lent specimens for this study and (or) made specimen data available online. Likewise, the research described here would not have been possible without the gift to the ROM of the J.B. Phipps Crataegus research collection by the University of Western Ontario (now Western University). Specimens collected by and given to the Phipps collection and to the ROM Green Plant Herbarium (TRT) by Rhoda M. Love and Peter Zika have been especially important for our research over the years. This research also incorporates data from specimens collected by Nadia Talent, Jenn Coughlan, Marta Heckel, Cassandra Shaw, Hazra Moothoo, Tamra Prior, and David Baxter. Research by Nadia Talent and Jenn Coughlan provided unpublished flow cytometry data used here. Jen Shiller and Jurgena Tusha took part in a University of Toronto 399 Research Excursion Program that collected specimens and yielded data on pollen production and stainability. Stefanie Sultmanis (University of Toronto) taught the leaf clearing technique to Brigitte X. Yan. Josh Hwang provided the framework for the statistical analyses of the leaf vascular architecture data by carrying out initial analyses of the C. sect. Sanguineae data. Paddy Haripersaud modelled the Douglasianae and Salignae species distributions early in the project. Deborah Metsger managed the move of the Phipps collection to the ROM and its accessioning into TRT. Brenna Wells maintained the herbarium database from which specimen data in Supplementary Tables S1–S4 were drawn. TRT staff and volunteers processed and helped curate specimens. Taylor Harding skillfully curated the cleared leaf images and Madeleine Milne updated data for these and the X-ray images prior to their publication on MorphoBank. Nicola Woods facilitated the ROM copyright clearance of these images. Tanya Berardini and Maureen O’Leary provided great assistance with our publication of the images of cleared leaves on MorphoBank. We are indebted to the Robarts Library of the University of Toronto, and Sian Meikle and Nancy Fong, for making possible the online availability of the TRT Crataegus specimen images. TAD thanks Santiago Pereira-Lorenzo for the invitation to submit this paper to the Special Issue, “Genetic Diversity Evaluation of the Fruit Trees”.

Conflicts of Interest

The authors declare no conflict of interest. The funders had no role in the design of the study; in the collection, analyses, or interpretation of data; in the writing of the manuscript, or in the decision to publish the results.

References

  1. Iezzoni, A.F.; McFerson, J.; Luby, J.; Gasic, K.; Whitaker, V.; Bassil, N.; Yue, C.; Gallardo, K.; McCracken, V.; Coe, M.; et al. RosBREED: Bridging the chasm between discovery and application to enable DNA-informed breeding in rosaceous crops. Hortic. Res. 2020, 7, 177. [Google Scholar] [CrossRef]
  2. Baird, J.R.; Thieret, J.W. The Medlar (Mespilus germanica, Rosaceae) from antiquity to obscurity. Econ. Bot. 1989, 43, 328–372. [Google Scholar] [CrossRef]
  3. Phipps, J.B.; O’Kennon, R.J.; Lance, R.W. Hawthorns and Medlars; Timber Press: Portland, OR, USA, 2003; p. 139. [Google Scholar]
  4. Zarrei, M.; Talent, N.; Kuzmina, M.; Lee, J.; Lund, J.; Shipley, P.R.; Stefanović, S.; Dickinson, T.A. Universal plant DNA barcode loci are poor indicators of species diversity in hawthorns (Crataegus; Rosaceae). AoB Plants 2015, 7, plv045. [Google Scholar] [CrossRef]
  5. Bourcier, P.G. In Excellent Order—the Gentleman Farmer Views His Fences, 1790–1860. Agric. Hist. 1984, 58, 546–564. [Google Scholar]
  6. Standing Conference for Local History (Ed.) Hedges and Local History; Bedford Square Press for the Standing Conference for Local History, Botanical Society of the British Isles: London, UK, 1979. [Google Scholar]
  7. Billington, C. Shrubs of Michigan, 2nd ed.; Cranbrook Institute of Science: Bloomfield Hills, MI, USA, 1968; Volume 20, p. 339. [Google Scholar]
  8. Dickinson, T.A. The biology of Canadian weeds. 68. Crataegus crus galli sensu lato. Can. J. Plant Sci. 1985, 65, 641–654. [Google Scholar] [CrossRef]
  9. Martin, A.C.; Zim, H.S.; Nelson, A.L. American Wildlife and Plants—A Guide to Wildlife Food Habits; McGraw-Hill Book Company: New York, NY, USA, 1951; p. 500. [Google Scholar]
  10. Alonso-Castro, A.J.; Domínguez, F.; Zapata-Morales, J.R.; Carranza-Álvarez, C. Plants used in the traditional medicine of Mesoamerica (Mexico and Central America) and the Caribbean for the treatment of obesity. J. Ethnopharmacol. 2015, 175, 335–345. [Google Scholar] [CrossRef]
  11. Diane, A.; Borthwick, F.; Wu, S.; Lee, J.; Brown, P.N.; Dickinson, T.A.; Croft, K.D.; Vine, D.F.; Proctor, S.D. Hypolipidemic and cardioprotective benefits of a novel fireberry hawthorn fruit extract in the JCR:LA-cp rodent model of dyslipidemia and cardiac dysfunction. Food Funct. 2016, 7, 3943–3952. [Google Scholar] [CrossRef]
  12. Edwards, J.E.; Brown, P.N.; Talent, N.; Dickinson, T.A.; Shipley, P.R. A review of the chemistry of the genus Crataegus. Phytochemistry 2012, 79, 5–26. [Google Scholar] [CrossRef]
  13. Lardos, A.; Heinrich, M. Continuity and change in medicinal plant use: The example of monasteries on Cyprus and historical iatrosophia texts. J. Ethnopharmacol. 2013, 150, 202–214. [Google Scholar] [CrossRef]
  14. Robles-Botero, M.V.; Ronquillo-de Jesús, E.; Quiroz-Reyes, C.N.; Aguilar-Méndez, M.A. Caracterización e identificación de compuestos bioactivos con actividad antioxidante de la cáscara, pulpa y semilla del fruto de tejocote (Crataegus mexicana). TIP Rev. Espec. En Cienc. Químico-Biológicas 2020, 23, 1–10. [Google Scholar] [CrossRef]
  15. Soares, S.S.; Bekbolatova, E.; Cotrim, M.D.; Sakipova, Z.; Ibragimova, L.; Kukula-Koch, W.; Giorno, T.B.S.; Fernandes, P.D.; Fonseca, D.A.; Boylan, F. Chemistry and Pharmacology of the Kazakh Crataegus almaatensis Pojark: An Asian Herbal Medicine. Antioxidants 2019, 8, 300. [Google Scholar] [CrossRef]
  16. Tassell, M.C.; Kingston, R.; Gilroy, D.; Lehane, M.; Furey, A. Hawthorn (Crataegus spp.) in the treatment of cardiovascular disease. Pharmacogn. Rev. 2010, 4, 32–41. [Google Scholar] [CrossRef]
  17. Hojsgaard, D.; Hörandl, E. Apomixis as a Facilitator of Range Expansion and Diversification in Plants. In Evolutionary Biology: Biodiversification from Genotype to Phenotype; Pontarotti, P., Ed.; Springer International Publishing: Cham, Switzerland; New York, NY, USA, 2015; pp. 305–327. [Google Scholar]
  18. Hörandl, E. The complex causality of geographical parthenogenesis. New Phytol. 2006, 171, 525–538. [Google Scholar] [CrossRef]
  19. Hörandl, E. Geographical Parthenogenesis: Opportunities for Asexuality. In Lost Sex: The Evolutionary Biology of Parthenogenesis; Schön, I., Martens, K., van Dijk, P., Eds.; Springer: Dordrecht, The Netherlands, 2009; pp. 161–186. [Google Scholar]
  20. Vandel, A. La parthénogenese geographique. Contribution a l’étude biologique et cytologique de la parthénogenese naturelle. Bull. Biol. De La Fr. Et De La Belg. 1928, 62, 164–182. [Google Scholar]
  21. Bierzychudek, P. Patterns in plant parthenogenesis. Experientia 1985, 41, 1255–1264. [Google Scholar] [CrossRef]
  22. Hörandl, E.; Cosendai, A.C.; Temsch, E.M. Understanding the geographic distributions of apomictic plants: A case for a pluralistic approach. Plant Ecol. Divers. 2008, 1, 309–320. [Google Scholar] [CrossRef]
  23. Tilquin, A.; Kokko, H. What does the geography of parthenogenesis teach us about sex? Philos. Trans. R. Soc. B Biol. Sci. 2016, 371, 20150538. [Google Scholar] [CrossRef]
  24. Brown, J.H.; Stevens, G.C.; Kaufman, D.M. The geographic range: Size, shape, boundaries, and internal structure. Annu. Rev. Ecol. Syst. 1996, 27, 597–623. [Google Scholar] [CrossRef]
  25. Morueta-Holme, N.; Enquist, B.J.; McGill, B.J.; Boyle, B.; Jørgensen, P.M.; Ott, J.E.; Peet, R.K.; Šímová, I.; Sloat, L.L.; Thiers, B.; et al. Habitat area and climate stability determine geographical variation in plant species range sizes. Ecol. Lett. 2013, 16, 1446–1454. [Google Scholar] [CrossRef]
  26. Dickinson, T.A.; Lo, E.; Talent, N. Polyploidy, reproductive biology, and Rosaceae: Understanding evolution and making classifications. Plant Syst. Evol. 2007, 266, 59–78. [Google Scholar] [CrossRef]
  27. Talent, N.; Dickinson, T.A. Endosperm formation in aposporous Crataegus (Rosaceae, Spiraeoideae, tribe Pyreae): Parallels to Ranunculaceae and Poaceae. New Phytol. 2007, 173, 231–249. [Google Scholar] [CrossRef]
  28. Burgess, M.B.; Cushman, K.R.; Doucette, E.T.; Talent, N.; Frye, C.T.; Campbell, C.S. Effects of apomixis and polyploidy on diversification and geographic distribution in Amelanchier (Rosaceae). Am. J. Bot. 2014, 101, 1375–1387. [Google Scholar] [CrossRef]
  29. Campbell, C.S.; Greene, C.W.; Dickinson, T.A. Reproductive biology in subfamily Maloideae (Rosaceae). Syst. Bot. 1991, 16, 333–349. [Google Scholar] [CrossRef]
  30. de Nettancourt, D. Incompatibility in Angiosperms; Springer: Berlin, Germany, 1977. [Google Scholar]
  31. Dickinson, T.A.; Belaoussoff, S.; Love, R.M.; Muniyamma, M. North American black-fruited hawthorns: I. Variation in floral construction, breeding system correlates, and their possible evolutionary significance in Crataegus sect. Douglasii Loudon. Folia Geobot. Phytotaxon. 1996, 31, 355–371. [Google Scholar] [CrossRef]
  32. Dickinson, T.A.; Phipps, J.B. Studies in Crataegus (Rosaceae: Maloideae) XIV. The breeding system of Crataegus crus galli sensu lato in Ontario (Canada). Am. J. Bot. 1986, 73, 116–130. [Google Scholar] [CrossRef]
  33. Lewis, D. Competition and dominance of incompatibility alleles in diploid pollen. Heredity 1947, 1, 85–108. [Google Scholar] [CrossRef]
  34. Ludwig, S.; Robertson, A.; Rich, T.C.G.; Djordjevic, M.; Cerovic, R.; Houston, L.; Harris, S.A.; Hiscock, S.J. Breeding systems, hybridization and continuing evolution in Avon Gorge Sorbus. Ann. Bot. 2013, 111, 563–575. [Google Scholar] [CrossRef]
  35. Ufimov, R.A.; Dickinson, T.A. Infrageneric nomenclature adjustments in Crataegus L. (Maleae, Rosaceae). Phytologia 2020, 102, 177–199. [Google Scholar]
  36. Dickinson, T.A.; Lo, E.Y.Y.; Talent, N.; Love, R.M. Black-fruited Hawthorns of Western North America—One or more Agamic Complexes? Botany 2008, 86, 846–865. [Google Scholar] [CrossRef]
  37. Zarrei, M.; Stefanović, S.; Dickinson, T.A. Reticulate evolution in North American black-fruited hawthorns (Crataegus section Douglasia; Rosaceae): Evidence from nuclear ITS2 and plastid sequences. Ann. Bot. 2014, 114, 253–269. [Google Scholar] [CrossRef]
  38. Coughlan, J.M.; Stefanović, S.; Dickinson, T.A. Relative resource allocation to dispersal and competition demonstrates the putative role of hybridity in geographical parthenogenesis. J. Biogeogr. 2014, 41, 1603–1613. [Google Scholar] [CrossRef]
  39. Lo, E.Y.Y.; Stefanović, S.; Dickinson, T.A. Geographical parthenogenesis in Pacific Northwest hawthorns (Crataegus; Rosaceae). Botany 2013, 91, 107–116. [Google Scholar] [CrossRef]
  40. McGoey, B.V.; Chau, K.; Dickinson, T.A. Stomata size in relation to ploidy level in North American hawthorns (Crataegus, Rosaceae). Madrono 2014, 61, 177–193. [Google Scholar] [CrossRef]
  41. Talent, N.; Dickinson, T.A. Polyploidy in Crataegus and Mespilus (Rosaceae, Maloideae): Evolutionary inferences from flow cytometry of nuclear DNA amounts. Can. J. Bot. 2005, 83, 1268–1304. [Google Scholar] [CrossRef]
  42. Canadensys. Crataegus species. Acadia University, Université de Montréal Biodiversity Centre, University of Toronto Mississauga, University of British Columbia. 2020. Available online: http://data.canadensys.net/explorer (accessed on 21 March 2012).
  43. Liston, A.; Weitemier, K.A.; Letelier, L.; Podani, J.; Zong, Y.; Lieu, L.; Dickinson, T.A. Phylogeny of Crataegus (Rosaceae) based on 257 nuclear loci and chloroplast genomes: Evaluating the impact of hybridization. PeerJ 2021, 9, e12418. [Google Scholar] [CrossRef]
  44. Phipps, J.B. Crataegus. In Flora of North America North of Mexico; 22+ vols. 1993+; Flora of North America Editorial Committee, Ed.; Oxford University Press: New York, NY, USA; Oxford, UK, 2015; Volume 9, pp. 491–643. [Google Scholar]
  45. Coughlan, J.M. Mechanisms for Range Size and Distribution Variation in the Polyploid Complex Black-Fruited Hawthorn (Crataegus Series Douglasianae): Biogeographic Implications for the Maintenance of Cytotype Diversity. Master’s Thesis, University of Toronto, Toronto, ON, Canada, 2012. [Google Scholar]
  46. Talent, N.; Dickinson, T.A. Apomixis and hybridization in Rosaceae subtribe Pyrineae Dumort.: A new tool promises new insights. In Apomixis: Evolution, Mechanisms and Perspectives; Grossniklaus, U., Hörandl, E., Sharbel, T., van Dijk, P., Eds.; Regnum Vegetabile vol. 147; Gantner Verlag: Ruggell, Liechtenstein, 2007; pp. 301–316. [Google Scholar]
  47. Talent, N.; Dickinson, T.A. The potential for ploidy level increases and decreases in Crataegus (Rosaceae, Spiraeoideae, tribe Pyreae). Can. J. Bot. 2007, 85, 570–584. [Google Scholar] [CrossRef]
  48. Thiers, B. Index Herbariorum: A global directory of public herbaria and associated staff. Available online: http://sweetgum.nybg.org/science/ih/ (accessed on 7 November 2015).
  49. Consortium_of_Pacific_Northwest_Herbaria. 2019. Specimen Database (CPNWH). University of Washington Herbarium. 2019. Available online: https://www.pnwherbaria.org (accessed on 9 February 2019).
  50. Intermountain_Regional_Herbarium_Network. 2019. Specimen Database. Utah State University. 2019. Available online: https://www.intermountainbiota.org/portal/index.php (accessed on 9 February 2019).
  51. Phipps, J.B. Introduction to the red-fruited hawthorns (Crataegus, Rosaceae) of western North America. Can. J. Bot. 1998, 76, 1863–1899. [Google Scholar]
  52. Clark, W. Earth Point—Tools for Google Earth. Available online: http://www.earthpoint.us/ (accessed on 19 February 2019).
  53. GBIF: The Global Biodiversity Information Facility. What is GBIF? Available online: https://www.gbif.org/what-is-gbif (accessed on 30 August 2020).
  54. Kottek, M.; Grieser, J.r.; Beck, C.; Rudolf, B.; Rubel, F. World Map of the Köppen-Geiger Climate Classification Updated. Meteorol. Z. 2006, 15, 259–263. [Google Scholar] [CrossRef]
  55. R Core Team. R: A Language and Environment for Statistical Computing; R Foundation for Statistical Computing: Vienna, Austria, 2021. [Google Scholar]
  56. Shorthouse, D.P. SimpleMappr, an Online Tool to Produce Publication-Quality Point Maps. Available online: http://www.simplemappr.net (accessed on 7 November 2015).
  57. Hijmans, R.J. Geosphere: Spherical Trigonometry (R Package Version 1.5-10). 2019. Available online: https://CRAN.R-project.org/package=geosphere (accessed on 1 June 2019).
  58. Legendre, L.; Legendre, P. Numerical Ecology. In Developments in Environmental Modelling, 2nd ed.; Jorgensen, S.E., Ed.; Elsevier Scientific Publishing Company: Amsterdam, The Netherlands, 1998; Volume 3, p. 419. [Google Scholar]
  59. Maechler, M.; Rousseeuw, P.; Struyf, A.; Hubert, M.; Hornik, K. cluster: Cluster Analysis Basics and Extensions. R Package Version 2.1.2. Available online: https://cran.r-project.org/web/packages/cluster/cluster.pdf (accessed on 1 May 2021).
  60. Gower, J.C. A general coefficient of similarity and some of its properties. Biometrics 1971, 27, 857–871. [Google Scholar] [CrossRef]
  61. Paradis, E.; Blomberg, S.; Bolker, B.; Claude, J.; Cuong, H.S.; Desper, R.; Didier, G.; Durand, B.; Dutheil, J.; Gascuel, O.; et al. Package ‘ape’ (Analyses of Phylogenetics and Evolution). 2015. Available online: https://cran.r-project.org/web/packages/ape/ape.pdf (accessed on 15 January 2016).
  62. Frontier, S. Étude de la décroissance des valeurs propres dans une analyses en composantes principales: Comparaison avec le modèle du bâton brisé. J. Exp. Mar. Biol. Ecol. 1976, 25, 67–75. [Google Scholar] [CrossRef]
  63. Oksanen, J. Multivariate Analysis of Ecological Communities in R: Vegan Tutorial. 2015. Available online: https://www.mooreecology.com/uploads/2/4/2/1/24213970/vegantutor.pdf (accessed on 16 October 2021).
  64. Dickinson, T.A.; Yan, X.Q. Variation in Leaf Venation in Rocky Mountain Hawthorns: Implications for Geographical Parthenogenesis. 2021. Available online: http://morphobank.org/permalink/?P2423.
  65. Dickinson, T.A.; Yan, X.Q. Variation in Leaf Venation in Pacific Northwest Hawthorns. 2021. Available online: http://morphobank.org/permalink/?P2523.
  66. Fox, J.; Weisberg, S. An R Companion to Applied Regression, 3rd ed.; Sage: Thousand Oaks, CA, USA, 2019. [Google Scholar]
  67. Mangiafico, S.S. Nested ANOVA. Available online: https://rcompanion.org/rcompanion/d_07.html (accessed on 21 December 2020).
  68. McDonald, J.H. Nested ANOVA. Available online: http://www.biostathandbook.com/nestedanova.html (accessed on 21 December 2020).
  69. Pinheiro, J.; Bates, D.; DebRoy, S.; Sarkar, D.; R Core Team. Nlme: Linear and Nonlinear Mixed Effects Models. R package version 3.1-151. Available online: https://CRAN.R-project.org/package=nlme (accessed on 15 December 2020).
  70. Hothorn, T.; Bretz, F.; Westfall, P. Simultaneous Inference in General Parametric Models. Biom. J. 2008, 50, 346–363. [Google Scholar] [CrossRef] [PubMed]
  71. Hijmans, R.J. Raster: Geographic Data Analysis and Modeling. R Package Version 3.4-10. Available online: https://CRAN.R-project.org/package=raster (accessed on 15 May 2021).
  72. Franklin, J. Mapping Species Distributions; Cambridge University Press: Cambridge, UK, 2009. [Google Scholar]
  73. Hothorn, T.; Hornik, K.; Zeileis, A. Unbiased Recursive Partitioning: A Conditional Inference Framework. J. Comput. Graph. Stat. 2006, 15, 651–674. [Google Scholar] [CrossRef]
  74. Therneau, T.; Atkinson, B.; Ripley, B. Rpart: Recursive Partitioning and Regression Trees. R Package Version 4.1-15. Available online: https://CRAN.R-project.org/package=rpart (accessed on 6 November 2016).
  75. Ripley, B. Tree: Classification and Regression Trees. R Package Version 1.0-40. 2019. Available online: https://cran.r-project.org/web/packages/tree/tree.pdf (accessed on 1 May 2021).
  76. Roberts, D. Lab 6—Classification Tree Models. Undated. Available online: http://ecology.msu.montana.edu/labdsv/R/labs/lab6/lab6.html (accessed on 1 May 2021).
  77. Hijmans, R.J.; Phillips, S.; Leathwick, J.; Elith, J. Dismo: Species Distribution Modeling (R Package Version 1.1-1). 2016. Available online: https://CRAN.R-project.org/package=dismo (accessed on 20 July 2015).
  78. Phillips, S.J.; Dudík, M. Modeling of species distributions with Maxent: New extensions and a comprehensive evaluation. Ecography 2008, 31, 161–175. [Google Scholar] [CrossRef]
  79. Warren, D.L.; Glor, R.E.; Turelli, M. ENMTools: A toolbox for comparative studies of environmental niche models. Ecography 2009, 33, 607–611. [Google Scholar] [CrossRef]
  80. McKown, A.D.; Cochard, H.; Sack, L. Decoding leaf hydraulics with a spatially explicit model: Principles of venation architecture and implications for its evolution. Am. Nat. 2010, 175, 447–460. [Google Scholar] [CrossRef]
  81. Nicotra, A.B.; Leigh, A.; Boyce, C.K.; Jones, C.S.; Niklas, K.J.; Royer, D.L.; Tsukaya, H. The evolution and functional significance of leaf shape in the angiosperms. Funct. Plant Biol. 2011, 38, 535–552. [Google Scholar] [CrossRef]
  82. Scoffoni, C.; Rawls, M.; McKown, A.; Cochard, H.; Sack, L. Decline of Leaf Hydraulic Conductance with Dehydration: Relationship to Leaf Size and Venation Architecture. Plant Physiol. 2011, 156, 832–843. [Google Scholar] [CrossRef]
  83. Buechler, W.K. Alternative Leaf Clearing and Mounting Procedures (Update of 2004 Original); By the author: Boise, ID, USA, 2010; p. 29. [Google Scholar]
  84. Yan, B.X. Leaf Venation in Rocky Mountain Hawthorns—Methods (Document). 2016. Available online: http://morphobank.org/permalink/?P2423.
  85. Ellis, B.; Daly, D.C.; Hickey, L.J.; Johnson, K.R.; Mitchell, J.D.; Wilf, P.; Wing, S.L. Manual of Leaf Architecture; Comstock Publishing Associates (Cornell University Press) in association with The New York Botanical Garden Press: Ithaca, NY, USA, 2009. [Google Scholar]
  86. Rasband, W.S. ImageJ. 1997–2018. Available online: https://imagej.nih.gov/ij/ (accessed on 30 June 2015).
  87. Schneider, C.A.; Rasband, W.S.; Eliceiri, K.W. NIH Image to ImageJ: 25 years of image analysis. Nat. Methods 2012, 9, 671–675. [Google Scholar] [CrossRef]
  88. Scoffoni, C.; Sack, L.; PrometheusWiki_Contributors. Quantifying Leaf Vein Traits. 2013. Available online: https://prometheuswiki.rsb.anu.edu.au/tiki-index.php?page=Quantifying+leaf+vein+traits (accessed on 1 April 2016).
  89. Kincaid, D.T.; Schneider, R.B. Quantification of leaf shape with a microcomputer and Fourier transform. Can. J. Bot. 1978, 61, 2333–2342. [Google Scholar] [CrossRef]
  90. Elith, J.; Leathwick, J.R. Species Distribution Models: Ecological Explanation and Prediction Across Space and Time. Annu. Rev. Ecol. Evol. Syst. 2009, 40, 677–697. [Google Scholar] [CrossRef]
  91. Fick, S.E.; Hijmans, R.J. WorldClim 2: New 1-km spatial resolution climate surfaces for global land areas. Int. J. Climatol. 2017, 37, 4302–4315. [Google Scholar] [CrossRef]
  92. Hijmans, R.J.; Cameron, S.E.; Parra, J.L.; Jones, P.G.; Jarvis, A. Very high resolution interpolated climate surfaces for global land areas. Int. J. Climatol. 2005, 25, 1965–1978. [Google Scholar] [CrossRef]
  93. Yoder, J.B. Species distribution models. In R. The Molecular Ecologist. 2013. Available online: https://www.molecularecologist.com/2013/04/23/species-distribution-models-in-r/ (accessed on 11 December 2016).
  94. O’Donnell, M.S.; Ignizio, D.A. Bioclimatic Predictors for Supporting Ecological Applications in the Conterminous United States: USGS Data Series 691; United States Geological Survey: Reston, VA, USA, 2012; p. 10. [Google Scholar]
  95. Rivas-Martinez, S.; Rivas-Saenz, S. Worldwide Bioclimatic Classification System, 1996–2021. Available online: http://www.globalbioclimatics.org (accessed on 5 July 2020).
  96. Zepner, L.; Karrasch, P.; Wiemann, F.; Bernard, L. ClimateCharts.net—An Interactive Climate Analysis Web Platform. Available online: https://climatecharts.net/ (accessed on 16 December 2020).
  97. Blonder, B. Frequently Asked Questions (FAQ) for Hypervolume R Package. 2014. Available online: http://www.benjaminblonder.org/hypervolume_faq.html (accessed on 30 April 2021).
  98. Broennimann, O.; Fitzpatrick, M.C.; Pearman, P.B.; Petitpierre, B.; Pellissier, L.; Yoccoz, N.G.; Thuiller, W.; Fortin, M.-J.; Randin, C.; Zimmermann, N.E.; et al. Measuring ecological niche overlap from occurrence and spatial environmental data. Glob. Ecol. Biogeogr. 2012, 21, 481–497. [Google Scholar] [CrossRef]
  99. Coughlan, J.M.; Han, S.; Stefanović, S.; Dickinson, T.A. Widespread generalist clones are associated with range and niche expansion in allopolyploids of Pacific Northwest Hawthorns (Crataegus L.). Mol. Ecol. 2017, 26, 5484–5499. [Google Scholar] [CrossRef]
  100. Phipps, J.B.; Muniyamma, M. [Studies in Crataegus (Rosaceae: Maloideae) III.] A taxonomic revision of Crataegus (Rosaceae) in Ontario. Can. J. Bot. 1980, 58, 1621–1699. [Google Scholar] [CrossRef]
  101. Patrias, K.; Citing Medicine: The NLM Style Guide for Authors, Editors, and Publishers [Internet]. 2nd edition, Appendix E: Two-Letter Abbreviations for Canadian Provinces and Territories and U.S. States and Territories. Available online: https://0-www-ncbi-nlm-nih-gov.brum.beds.ac.uk/books/NBK7254/ (accessed on 19 December 2020).
  102. Marquis, R.J.; Voss, E.G. Distributions of some western North American plants disjunct in the Great Lakes region. Mich. Bot. 1981, 20, 53–82. [Google Scholar]
  103. Lo, E.Y.Y.; Stefanović, S.; Christensen, K.I.; Dickinson, T.A. Evidence for genetic association between East Asian and Western North American Crataegus L. (Rosaceae) and rapid divergence of the Eastern North American lineages based on multiple DNA sequences. Mol. Phylogenetics Evol. 2009, 51, 157–168. [Google Scholar] [CrossRef] [PubMed]
  104. Matzk, F.; Meister, A.; Schubert, I. An efficient screen for reproductive pathways using mature seeds of monocots and dicots. Plant J. 2000, 21, 96–108. [Google Scholar] [CrossRef] [PubMed]
  105. Ranney, T.; Eaker, T. Variation in Ploidy Levels and Reproductive Pathways Among Flowering Crabapples. HortScience 2004, 39, 773B-773. [Google Scholar] [CrossRef]
  106. Dickinson, T.A.; Coughlan, J.M.; Han, S. [North American black-fruited hawthorns IV.] What IS Suksdorf’s hawthorn?—Reexamining the black-fruited hawthorns of the Pacific Northwest (Crataegus section Douglasianae, Rosaceae tribe Maleae). in press.
  107. Phipps, J.B.; O’Kennon, R.J. Hawthorns (Crataegus: Rosaceae) of the Cypress Hills, Alberta and Saskatchewan. J. Bot. Res. Inst. Tex. 2007, 1, 1031–1090. [Google Scholar]
  108. Coyne, J.A.; Orr, H.A. Speciation; Sinauer Associates, Inc.: Sunderland, MA, USA, 2004. [Google Scholar]
  109. Dickinson, T.A. Sex and Rosaceae apomicts. Taxon 2018, 67, 1093–1107. [Google Scholar] [CrossRef]
  110. Rubel, F.; Brugger, K.; Haslinger, K.; Auer, I. The Climate of the European Alps: Shift of Very High Resolution Köppen-Geiger Climate Zones 1800–2100. Meteorol. Z. 2017, 26, 115–125. [Google Scholar] [CrossRef]
  111. Phipps, J.B.; O’Kennon, R.J. Three new species of Crataegus (Rosaceae) from western North America: C. okennonii, C. okanaganensis, and C. phippsii. SIDA 1998, 18, 169–191. [Google Scholar]
  112. Dickinson, T.A. Book Review—Hawthorns and Medlars. Can. Bot. Assoc. Bull. 2004, 37, 30–31. [Google Scholar]
  113. Dickinson, T.A.; Love, R.M. [North American black-fruited hawthorns: III.] What is Douglas hawthorn? In Conservation and Management of Oregon’s Native Flora; Kaye, T., Liston, A., Love, R.M., Luoma, D.L., Meinke, R.J., Wilson, M.V., Eds.; Native Plant Society of Oregon: Corvallis, OR, USA, 1997; pp. 162–171. [Google Scholar]
  114. Phipps, J.B. The relationships of the American black-fruited hawthorns Crataegus erythropoda, C. rivularis, C. saligna, and C. brachyacantha to C. Ser. Douglasianae (Rosaceae). SIDA 1999, 18, 647–660. [Google Scholar]
  115. Maddison, W.P.; Maddison, D.R. Mesquite: A Modular System for Evolutionary Analysis, Version 3.10. 2016. Available online: http://www.mesquiteproject.org (accessed on 3 October 2016).
  116. Lo, E.Y.Y.; Stefanović, S.; Dickinson, T.A. Molecular reappraisal of relationships between Crataegus and Mespilus (Rosaceae, Pyreae)—Two genera or one? Syst. Bot. 2007, 32, 596–616. [Google Scholar]
  117. Dickinson, T.A.; Campbell, C.S. Population structure and reproductive ecology in the Maloideae (Rosaceae). Syst. Bot. 1991, 16, 350–362. [Google Scholar] [CrossRef]
  118. Dickinson, T.A.; Phipps, J.B. Studies in Crataegus L. (Rosaceae: Maloideae) IX. Short shoot leaf heteroblasty in Crataegus crus-galli L. sensu lato. Can. J. Bot. 1984, 62, 1775–1780. [Google Scholar] [CrossRef]
  119. Dickinson, T.A.; Phipps, J.B. Studies in Crataegus L. (Rosaceae: Maloideae) XIII. Degree and pattern of variation in Crataegus section Crus-galli in Ontario. Syst. Bot. 1985, 10, 322–337. [Google Scholar] [CrossRef]
  120. Vander Kloet, S.P.; Dickinson, T.A. The taxonomy of Vaccinium section Myrtillus (Ericaceae). Brittonia 1999, 51, 231–254. [Google Scholar] [CrossRef]
  121. Lo, E.Y.Y.; Stefanović, S.; Dickinson, T.A. Reconstructing reticulation history in a phylogenetic framework and the potential of allopatric speciation driven by polyploidy in an agamic complex in Crataegus (Rosaceae). Evolution 2010, 64, 3593–3608. [Google Scholar] [CrossRef] [PubMed]
  122. Ufimov, R.; Zeisek, V.; Píšová, S.; Baker, W.J.; Fér, T.; van Loo, M.; Dobeš, C.; Schmickl, R. Relative performance of customized and universal probe sets in target enrichment: A case study in subtribe Malinae. Appl. Plant Sci. 2021, 9, e11442. [Google Scholar] [CrossRef]
  123. Lo, E.Y.Y.; Stefanović, S.; Dickinson, T.A. Population genetic structure of diploid sexual and polyploid apomictic hawthorns (Crataegus; Rosaceae) in the Pacific Northwest. Mol. Ecol. 2009, 18, 1145–1160. [Google Scholar] [CrossRef] [PubMed]
  124. Coughlan, J.; Shery Han, S.H.; Stefanović, S.; Dickinson, T. Data from: Widespread generalist clones are associated with range and niche expansion in allopolyploids of Pacific Northwest Hawthorns (Crataegus L.), Dryad, Dataset. Available online:. (accessed on 5 July 2020). [CrossRef]
  125. Fortin, M.-J.; Keitt, T.H.; Maurer, A.B.; Taper, M.L.; Kaufman, D.M.; Blackburn, T.M. Species’ geographic ranges and distributional limits: Pattern analysis and statistical issues. OIKOS 2005, 108, 7–17. [Google Scholar] [CrossRef]
  126. Ritchie, J.C. Postglacial Vegetation of Canada; Cambridge University Press: Cambridge, UK, 1987. [Google Scholar]
  127. Bailey, R.G. Map. Ecoregions of North America; Revised; USDA Forest Service: Washington, DC, USA, 1997. [Google Scholar]
  128. Bouchal, J.M.; Güner, T.H.; Velitzelos, D.; Velitzelos, E.; Denk, T. Messinian vegetation and climate of the intermontane Florina–Ptolemais–Servia Basin, NW Greece inferred from palaeobotanical data: How well do plant fossils reflect past environments? R. Soc. Open Sci. 2020, 7, 192067. [Google Scholar] [CrossRef]
  129. Denk, T.; Grimm, G.W.; Grímsson, F.; Zetter, R. Evidence from “Köppen signatures” of fossil plant assemblages for effective heat transport of Gulf Stream to subarctic North Atlantic during Miocene cooling. Biogeosciences 2013, 10, 7927–7942. [Google Scholar] [CrossRef]
  130. Beatty, B.L.; Jennings, W.F.; Rawlinson, R.C. Crataegus Saligna Greene (Willow Hawthorn): A Technical Conservation Assessment; USDA Forest Service, Rocky Mountain Region: Lakewood, CO, USA, 2004. Available online: https://www.fs.usda.gov/Internet/FSE_DOCUMENTS/stelprdb5206835.pdf (accessed on 30 September 2007).
  131. Phipps, J.B. Monograph of northern Mexican Crataegus (Rosaceae, subfam. Maloideae). Sida Bot. Misc. 1997, 15, 1–94. [Google Scholar]
  132. Brodribb, T.J.; Feild, T.S.; Sack, L. Viewing leaf structure and evolution from a hydraulic perspective. Funct. Plant Biol. 2010, 37, 488–498. [Google Scholar] [CrossRef]
  133. Sack, L.; Scoffoni, C.; McKown, A.D.; Frole, K.; Rawls, M.; Havran, J.C.; Tran, H.; Tran, T. Developmentally based scaling of leaf venation architecture explains global ecological patterns. Nat. Commun. 2012, 3, 837. Available online: http://0-www-nature-com.brum.beds.ac.uk/ncomms/journal/v3/n5/suppinfo/ncomms1835_S1.html (accessed on 20 July 2015). [CrossRef]
  134. Jordano, P. What is long-distance dispersal? And a taxonomy of dispersal events. J. Ecol. 2017, 105, 75–84. [Google Scholar] [CrossRef]
  135. Nathan, R. Long-Distance Dispersal of Plants. Science 2006, 313, 786–788. [Google Scholar] [CrossRef] [PubMed]
  136. Christensen, K.I.; Zarrei, M.; Kuzmina, M.; Talent, N.; Lin, C.; Dickinson, T.A. Crataegus ×ninae-celottiae and C. ×cogswellii (Rosaceae, Maleae), two spontaneously formed intersectional nothospecies. Phytokeys 2014, 36, 1–26. [Google Scholar] [CrossRef] [PubMed]
  137. EDDMapS. Crataegus monogyna. Available online: http://www.eddmaps.org/distribution/uscounty.cfm?sub=5392 (accessed on 23 August 2016).
  138. Dickson, E.E. Malus. In Flora of North America North of Mexico; 22+ vols. 1993+; Flora of North America Editorial Committee, Ed.; Oxford University Press: New York, NY, USA; Oxford, UK, 2015; Volume 9, pp. 472–479. [Google Scholar]
  139. Kurtto, A.; Sennikov, A.; Lampinen, R. Atlas Flora Europaeae. Distribution of Vascular Plants in Europe. 16. Rosaceae (Cydonia to Prunus, excl. Sorbus); The Committee for Mapping the Flora of Europe & Societas Biologica Fennica Vanamo: Helsinki, Finland, 2013. [Google Scholar]
  140. Muniyamma, M.; Phipps, J.B. Studies in Crataegus. XII. Cytological evidence for sexuality in some diploid and tetraploid species of North American hawthorns. Can. J. Bot. 1985, 63, 1319–1324. [Google Scholar] [CrossRef]
  141. Baker, H.G. Support for Baker’s Law-As a Rule. Evolution 1967, 21, 853–856. [Google Scholar] [CrossRef] [PubMed]
  142. Key, B.A. Soil Enrichment under Chalk Scrub and re-Establishment of Chalk Grassland after Scrub Clearance. Ph.D. Thesis, University of Cambridge, Cambridge, UK, 1979. [Google Scholar]
  143. Borys, M.W.; Leszczyñska-Borys, H. Roots Attributes of Mexican Crataegus spp. trees. Rev. Chapingo Ser. Hortic. 2004, 10, 85–95. [Google Scholar] [CrossRef]
  144. Brinkman, K.A. Crataegus L. In Seeds of Woody Plants in the United States; Agriculture Handbook; United States Forest Service, United States Department of Agriculture: Washington, DC, USA, 1974; Volume 450, pp. 356–360. [Google Scholar]
  145. Hinckley, T.M.; Duhme, F.; Hinckley, A.R.; Richter, H. Drought relations of shrub species: Assessment of the mechanisms of drought resistance. Oecologia 1983, 59, 344–350. [Google Scholar] [CrossRef]
  146. Hobbs, J.J. Mount Sinai; University of Texas Press: Austin, TX, USA, 1995. [Google Scholar]
  147. Alonso-Marcos, H.; Nardi, F.D.; Scheffknecht, S.; Tribsch, A.; Hülber, K.; Dobeš, C. Difference in reproductive mode rather than ploidy explains niche differentiation in sympatric sexual and apomictic populations of Potentilla puberula. Ecol. Evol. 2019, 2019, 1–11. [Google Scholar] [CrossRef]
  148. Campbell, C.S.; Evans, R.C.; Morgan, D.R.; Dickinson, T.A.; Arsenault, M.P. Phylogeny of subtribe Pyrinae (formerly the Maloideae, Rosaceae): Limited resolution of a complex evolutionary history. Plant Syst. Evol. 2007, 266, 119–145. [Google Scholar] [CrossRef]
  149. Evans, R.C.; Campbell, C.S. The origin of the apple subfamily (Maloideae; Rosaceae) is clarified by DNA sequence data from duplicated GBSSI genes. Am. J. Bot. 2002, 89, 1478–1484. [Google Scholar] [CrossRef] [PubMed]
  150. Velasco, R.; Zharkikh, A.; Affourtit, J.; Dhingra, A.; Cestaro, A.; Kalyanaraman, A.; Fontana, P.; Bhatnagar, S.K.; Troggio, M.; Pruss, D.; et al. The genome of the domesticated apple (Malus [×] domestica Borkh.). Nat. Genet. 2010, 42, 833–839. [Google Scholar] [CrossRef] [PubMed]
  151. De Storme, N.; Mason, A. Plant speciation through chromosome instability and ploidy change: Cellular mechanisms, molecular factors and evolutionary relevance. Curr. Plant Biol. 2014, 1, 10–33. [Google Scholar] [CrossRef]
  152. Talent, N. Evolution of gametophytic apomixis in flowering plants: An alternative model from Maloid Rosaceae. Theory Biosci. 2009, 128, 121–138. [Google Scholar] [CrossRef]
  153. Vašková, D.; Kolarčik, V. Breeding Systems in Diploid and Polyploid Hawthorns (Crataegus): Evidence from Experimental Pollinations of C. monogyna, C. subsphaerica, and Natural Hybrids. Forests 2019, 10, 1059. [Google Scholar] [CrossRef]
  154. Hajrudinović, A.; Siljak-Yakovlev, S.; Brown, S.C.; Pustahija, F.; Bourge, M.; Ballian, D.; Bogunić, F. When sexual meets apomict: Genome size, ploidy level and reproductive mode variation of Sorbus aria s.l. and S. austriaca (Rosaceae) in Bosnia and Herzegovina. Ann. Bot. 2015, 116, 301–312. [Google Scholar] [CrossRef]
  155. Dyke, A.S. Late Quaternary Vegetation History of Northern North America Based on Pollen, Macrofossil, and Faunal Remains. Géographie Phys. Et Quat. 2005, 59, 211–262. [Google Scholar] [CrossRef]
  156. Baniaga, A.E.; Marx, H.E.; Arrigo, N.; Barker, M.S. Polyploid plants have faster rates of multivariate niche differentiation than their diploid relatives. Ecol. Lett. 2020, 23, 68–78. [Google Scholar] [CrossRef]
Figure 1. Geographic distributions of 747 hawthorn specimens in nine taxa (Table 1) belonging as follows: (A,B), in red, Crataegus subg. Americanae (C. chrysocarpa, filled squares; C. macracantha, filled diamonds); (A), in green, C. sect. Salignae (C. subg. Sanguineae; diploid C. saligna, smallest filled polygon, n = 35; allotetraploid C. erythropoda, larger filled polygon, n = 43; and allotetraploid C. rivularis, large open polygon, n = 86); and (B) in purple, C. sect. Douglasianae (C. subg. Sanguineae; diploid C. suksdorfii, small filled polygon, n = 76; autotriploid C. gaylussacia, inverted open triangles and arrow, n = 15; allopolyploid C. suksdorfii, open triangles, n = 116; and allotetraploid C. douglasii, filled squares, n = 205). See Supplementary Data Table S1 for locality data and other details of the vouchers for these maps; these data are a subset of those available online [42] (and other data portals; see below and Acknowledgments).
Agronomy 11 02133 g001
Figure 2. Cleared leaves of individuals (Table 1) of Crataegus subg. Americanae and subg. Sanguineae (Supplementary Data Table S2). Scale bar = 5 mm. (A) Crataegus saligna Greene, J.B. Phipps 6617, TRT00004761; (B) diploid C. suksdorfii (Sarg.) Kruschke, T.A. Dickinson 2006–16, TRT00001567; (C) C. rivularis Nutt., J.B. Phipps 6450, TRT00015999; (D) allotriploid C. suksdorfii (Sarg.) Kruschke, E.Y.Y. Lo 172, TRT00001606; (E) C. erythropoda Ashe, T.A. Dickinson 2009–17, TRT00002550; (F) C. douglasii Lindl., E.Y.Y. Lo 166, TRT00001275; (G) C. chrysocarpa Ashe, J.B. Phipps 6611, TRT00009133; and (H) tetraploid C. macracantha Lodd. ex Loudon, N. Talent 367, TRT00000137. See Supplementary Data Table S3 and [64,65] for complete voucher details.
Agronomy 11 02133 g002
Figure 3. (AH), Morphological data (Table 2) from subsamples (Table 1) of Crataegus subg. Americanae and subg. Sanguineae (Supplementary Data Table S2). Multistate descriptors were scored on multiple thorns (THNS) and flowers (KLOP, KLOS, KLOT) per specimen, and were averaged to provide a value for the specimen as a whole.
Agronomy 11 02133 g003
Figure 4. Morphological variation in subsamples of Crataegus subg. Americanae and subg. Sanguineae (Supplementary Data Table S2). Principal coordinates analysis (PCoA) biplot of eight descriptors as given in Table 2 and Figure 3. PCoA was carried out using the Cailliez correction for negative eigenvalues; the first five axes (of 106), accounting for 41.6% of the total sample variation, were shown to be significant using the broken-stick criterion [58]. Note that the vectors for calyx lobe pubescence and toothing, KLOP and KLOT, overlap completely.
Agronomy 11 02133 g004
Figure 5. (AE), Boxplots of morphological data (Table 3) from cleared leaves of subsamples of Crataegus subg. Americanae and subg. Sanguineae (Table 1). Plots summarize the values for measurements averaged over the three leaves for each of 31 voucher specimens (Supplementary Data Table S3).
Agronomy 11 02133 g005
Figure 6. Principal components analysis (PCA) of morphological descriptors of cleared leaves of subsamples (Table 1 and Table 3; Figure 5) of Crataegus subg. Americanae and subg. Sanguineae (Supplementary Data Table S2). (A) Biplot showing correlations between the five descriptors and the first two PCA axes. (B) Points represent two or three individual leaves from each of 31 vouchers. Neither axis accounts for a significant proportion of the total sample variance according to the Frontier broken-stick criterion, but the percentages shown both exceed the equidistribution of variance between the five axes.
Agronomy 11 02133 g006
Figure 7. Climate data for the collection localities of Crataegus sect. Douglasianae and C. sect. Salignae voucher specimens studied here (Table 1; Supplementary Data Table S1). (AI) Boxplots for nine of the standard WorldClim Bioclimatic variables selected from the WorldClim database v. 2.1 [91,92,94]. Widths of the bars enclosing the central 50% of the sample are proportional to samples sizes (Table 1); subgenera and sections are colored as previously. Note that bio3 is calculated as (bio2/bio7) * 100 = (bio2/(Max Temperature of Warmest Month−Min Temperature of Coldest Month)) * 100.
Agronomy 11 02133 g007
Figure 8. Climate niches of the Crataegus sect. Douglasianae and C. sect. Salignae samples studied here (Supplementary Data Table S1), described by PCA of nine Bioclimatic variables (see Figure 7 for explanations). (A,B) Biplots of descriptor-PC correlations, with taxa indicated by convex hulls. (C,D) Taxon convex hulls and points representing the sites at which vouchers were sampled; subgenera and sections are colored as previously. Taxa (Table 1) as shown in the legend. In (C,D), symbol size reflects site longitude, size increasing from east to west; note the smaller symbols in the lower right quadrant representing the eastern, disjunct occurrence of C. douglasii. Only the first three PC axes represent proportions of the total sample variance that are significant by Frontier’s criterion.
Agronomy 11 02133 g008
Table 2. Morphological descriptors measured on flowering herbarium specimens (collected April–June; Supplementary Table S2).
Acronym Used in Figures and TextDescription
THNLThorn length (mm)
THNDThorn diameter at base (mm)
THNSThorn curvature: 0, straight; 1, moderately curved; 2, very curved
KLOTCalyx lobe toothing: 0, no toothing, or only 1–2 teeth on a single lobe; 1, isolated teeth on more than one lobe; 2, several teeth on most lobes; densely toothed on each lobe
KLOPCalyx lobe pubescence: 0, completely glabrous; 1, scattered hairs, or hairs dense only locally; 2, dense enough to overlap; 3, hairs very dense, over the entire region
INFPInflorescence axis pubescence along the secondary veins: 0, completely glabrous; 1, scattered hairs, or hairs dense only locally; 2, dense enough to overlap; 3, hairs very dense, over the entire region
STAMNumber of stamens per flower.
STYLNumber of styles per flower.
Table 3. Descriptors of cleared leaves of individuals (Table 1) of Crataegus subg. Americanae and subg. Sanguineae (Supplementary Data Table S2). Methods by which these measurements were obtained are described in the online documents associated with the two MorphoBank databases published here (http://0-dx-doi-org.brum.beds.ac.uk/10.7934/P2423 and http://0-dx-doi-org.brum.beds.ac.uk/10.7934/P2523) [64,65].
Descriptor and AcronymExplanation
Square root-transformed Leaf Area0.5 (SQLA)Leaf Area (mm2) 1/2
Serration Density (SERRDEN) Leaf teeth/mm perimeter (calculated for entire leaf)
Minor Vein Density (MINDEN); = Sum of vein lengths for quaternary and higher order veins per unit area (mm/mm2)Minor vein length per unit Area (mm/mm2)
Major Vein Density (MAJDEN); = Sum of vein lengths for primary, secondary, and tertiary veins per unit area (mm/mm2)Major vein length per unit Area (mm/mm2)
Dissection Index−1 (INVDI); = 1 for a perfect circle (minimum P, for any given A) and approaches 0 as a leaf is increasingly lobed [36]Inverse of the dissection index [89], 2(Aπ)1/2/P, for A = leaf area, and P = leaf perimeter
Table 4. Range sizes for the Crataegus taxa studied here (Figure 1; Supplementary Data Table S1). Areal extent calculated for polygons in Figure 1; these do not account for the eastern North American distributions of C. chrysocarpa and C. macracantha [44]. Polygon areas (Figure 1) calculated using function areaPolygon in the R package geosphere [57]. States and provinces designated by their standard two-letter abbreviations [101].
TaxonRange, Areal Extent (km2) and as Percent of C. chrysocarpa Polygon (Figure 1B)Elevational Range (m above Sea Level)States/Provinces (Phipps 2015)
Crataegus chrysocarpa (4x)3,417,010143–2546All Canadian provinces; northernmost tier of states plus OR, WY, UT, CO. SD, IA, IL, CT, RI, MA
Crataegus macracantha (4x)2,479,523 (73%)231–2303All Canadian provinces except NS, NL, PE; northernmost tier of states except ID and ME, plus OR, WY, UT, CO. AZ, NM, SD, NE, KS, IA, MO, IL, IN, OH, WV, PA, VA, MD, CT, RI, MA
Crataegus saligna (2x)54,000 (2%)1551–2652UT, CO
Crataegus rivularis (4x)449,000 (13%)1272–3138ID, WY, NV, UT, CO, AZ, NM
Crataegus erythropoda (4x)107,000 (3%)1597–3138WY, CO, NM
Crataegus douglasii (4x)(western) 1,565,955
(Great Lakes) 274,936
(total) 1,840,891 (54%)
4–2098BC, AB, SK, WA, ID, MT, OR, CA, ON, MN, WI, MI
Crataegus gaylussacia (auto 3x)295 (<<1%)33–191Marin and Sonoma counties CA
Crataegus suksdorfii (2x)39,513 (1%)3–1499WA, OR, CA
Crataegus suksdorfii (allo 3, 4x)1,264,913 (37%)5–1594AK, BC, WA, ID, MT, OR, CA
Table 5. Linear mixed-effects model nested ANOVA for descriptors of cleared leaves (Table 3) of individuals of Crataegus subg. Americanae and subg. Sanguineae (Table 1; Supplementary Data Table S3). Multiple comparison of means (Tukey contrasts) for H0: between-taxon difference = 0; taxa with the same letter do not differ significantly (p < 0.05 or smaller). Links are provided to the MorphoBank folios containing the corresponding images.
AnalysisDescriptor (Table 3)
Taxon (Table 1) Leaf Area0.5 (SQLA)Serration Density (SERRDEN)Minor Vein Density (MINDEN)Major Vein Density (MAJDEN)Dissection Index−1 (INVDI)
F7,9411.7110.715.31 16.19 117.55 2
H0: Taxon Differences = 0 (Mixed model)p-Value<0.0001<0.0001<0.0001<0.0001<0.0001
H0: Difference between Mixed Model (taxon, Leaves) and Fixed Model (Taxon only) = 0p-Value0.99980.99990.99980.99990.9999
Crataegus saligna (2x)
https://morphobank.org/index.php/Projects/FoliosList/folio_id/957/project_id/2423
d, eaba
Crataegus rivularis (4x)
https://morphobank.org/index.php/Projects/FoliosList/folio_id/958/project_id/2423
a, b, c, ea, d, ea, baa, c, d
Crataegus erythropoda (4x)
https://morphobank.org/index.php/Projects/FoliosList/folio_id/1029/project_id/2423
a, c, d, ea, d, ea, ba, ba
Crataegus macracantha (4x)
https://morphobank.org/index.php/Projects/FoliosList/folio_id/1031/project_id/2423
https://morphobank.org/index.php/Projects/FoliosList/folio_id/1028/project_id/2523
a, b, c, da, b, c, fa, bba
Crataegus chrysocarpa (4x)
https://morphobank.org/index.php/Projects/FoliosList/folio_id/1030/project_id/2423
https://morphobank.org/index.php/Projects/FoliosList/folio_id/1027/project_id/2523
a, ba, b, caa, ba
Crataegus douglasii (4x)
https://morphobank.org/index.php/Projects/FoliosList/folio_id/1026/project_id/2523
aa, b, c, faab
Crataegus suksdorfii (allo 3, 4x)
https://morphobank.org/index.php/Projects/FoliosList/folio_id/1025/project_id/2523
da b ab, d
Crataegus suksdorfii (2x)
https://morphobank.org/index.php/Projects/FoliosList/folio_id/1024/project_id/2523
a, b, ceaab, c
1 F7,93. 2 F7,92.
Table 6. Distinguishability of the principal native Crataegus species of western North America (epithets; Table 1). Information on breeding system and ploidy level from references cited in the text (apo, pseudogamous apospory present, otherwise absent; sexuality has been demonstrated in 2x individuals, Supplementary Data Table S4). Fruit color codes: B, black; R, red. Shaded cells are those in which sympatry (N; below the diagonal; Figure 1) is matched with morphological distinctness (Y; above the diagonal; Figure 3 and Figure 4). (N) above the diagonal indicates species pairs that could be confused with each other; (Y) below the diagonal indicates species pairs that may exhibit small areas of sympatry (Figure 1).
Morphologically Distinct?
Taxonsali
rivu apoeryt apochry apomacr apodoug apo3x suks
apo
2x suks
gayl apo
Fruit color,
stamen number
B20B10B10R10R10B10B20B20B20
sali (2x)B20YYYYY(Y 1)(Y 1)(Y 1)
rivu (4x)B10N(Y 2)YY(Y 2)YYY
eryt (4x)B10NNYY(N)YYY
chry (4x)R10NNNY 3YYYY
macr (4x)R10NNNNYYYY
doug (4x)B10Y(Y 4)(Y 4)NNYYY
suks (3x)B20YYYNNNNN
suks (2x)B20YYYYYYY 5(N)
gayl (3x 6)B20YYYYYYYY
Allopatric?
1 Crataegus saligna has a distinctive leaf shape and thorn morphology [44]. 2 Crataegus rivularis has a distinctive leaf shape [44]. 3 Pyrenes of C. macracantha are excavated on their radial surfaces; those of C. chrysocarpa are not. 4 Southeastern Idaho and adjacent Western Wyoming. 5 Limited overlap may be present in the Columbia Gorge. 6 Apparently autotriploid [37].
Publisher’s Note: MDPI stays neutral with regard to jurisdictional claims in published maps and institutional affiliations.

