Article

Long-Term Effects of the Use of Organic Amendments and Crop Rotation on Soil Properties in Southeast Spain

by
Antonio Sánchez-Navarro
1,
Juan Sánchez-Martínez
1,
Eva María Barba-Corbalán
2,
Magdalena Valverde-Pérez
3,
Aldara Girona-Ruíz
1 and
María José Delgado-Iniesta
1,*
1
Department of Agricultural Chemistry, Geology and Pedology, Faculty of Chemistry, Campus de Espinardo, University of Murcia, 30100 Murcia, Spain
2
Chemical and Environmental Engineering Department, Polytechnic University of Cartagena, 30203 Cartagena, Spain
3
Department of Animal Production, Faculty of Veterinary Medicine, University of Murcia, 30100 Murcia, Spain
*
Author to whom correspondence should be addressed.
Submission received: 7 October 2021 / Revised: 9 November 2021 / Accepted: 15 November 2021 / Published: 22 November 2021

Abstract

:
The evolution of soil chemical properties over 20 years was monitored to assess the effects of the change in soil management from a rainfed to an irrigated model and the use of organic amendments and crop rotation. Intensive agriculture has been the activity that has caused most degradation and contamination of this soil. Long-term monitoring of the soil profile made it possible to assess its response to the application of sustainable agricultural techniques intended to offset these effects. Three profiles of the same soil were studied—P1 (1998), P2 (2003), P3 (2017)—to show the evolution in time and space. An incipient degradation process was detected in the first five years, verified by increases in salinity (2.3 dS m−1), exchangeable Na (0.5 g kg−1), and TN (1.3 g kg−1) in P2 in comparison with P1 (1.0, 0.2, and 1.1, respectively). There was also leaching towards the deep horizons for TN (0.4, 0.9, and 0.7 g kg−1 for P1, P2, and P3, respectively), and for assimilable elements such as P (1.1, 6.4, and 3.8), Fe (2.0, 2.1, and 5.6), Mn (0.3, 6.5, and 1.9), Zn (0.3, 0.5, and 0.9), and Cu (0.5, 0.6, and 1.3) (all mg kg−1, for P1, P2, and P3, respectively). Between 2004 and 2017, organic amendments (sheep manure) were reduced by 50%, crop rotation was intensified, and green fertilization and forage maize cultivation were included. As a result, P3 showed an improvement in comparison with P2, with decreases in EC (1.4 dS m−1), exchangeable Na (0.2 g kg−1), and TN (0.8 g kg−1). The change in soil management enhanced some soil functions (carbon sink and chemical fertility) and attenuated soil degradation.

1. Introduction

Since the Second World War, in developed countries and progressively in developing countries, the agricultural sector has undergone major changes aimed at increasing the production and profitability of farmland and, therefore, the ability to compete in an increasingly globalized market. Intensive agriculture has probably been the activity that has caused the most degradation and pollution in the soil and associated ecosystems [1]. In arid and semiarid areas, 30% of irrigated agricultural soils have been rapidly degraded due to the trend to excessively apply inorganic fertilizers and manures [2], to utilize poor quality water for irrigation [3,4,5,6,7], and to perform inadequate tillage [8,9].
As a result of such problems, society in general and, on its behalf, its leaders, are promoting other models of land management that are more respectful of the environment. In this scenario, the use of organic substrates, as substitutes for chemical fertilizers, and crop rotation are promoted by the proponents of sustainable agriculture and form part of the recommendations of the European Union in its Common Agricultural Policy (CAP). The indiscriminate use of chemical fertilizers and pesticides in conventional agriculture has led to a progressive increase in the area of abandoned soils due to the loss of their properties [10], in addition to degradation and desertification [11,12]. The traditional use in agriculture of strong acids such as HNO3 or H3PO4, used to prevent clogging in irrigation systems or as chemical fertilizers, can cause acidification of irrigation water with possible changes in the mineralogical composition of soil clays and can facilitate the dissolution and mobilization of CaCO3 and the release of some nutrients [13]. In southeast Spain there are many examples of accelerated soil degradation with the consequent contamination of nearby ecosystems, all as a result of poor agronomic management of soil and water resources. In this regard, the current agri-environmental problems in the Campo de Cartagena area (Murcia, Spain) deserve a special mention.
The soils of arid or semiarid regions, such as those in the area where this study was carried out, have low organic matter contents, and this organic matter is rapidly mineralized due to the climatic conditions [14]. As a result, the incorporation of organic amendments into the soil can represent a sustainable alternative, because it means both the active involvement of agricultural activity in the carbon cycle and an increase in the quality and fertility of the soils involved in this activity [15]. In this sense, there are numerous studies on the functions of soil as a carbon sink, and the use of organic fertilization and the incorporation of crop residues to increase long-lasting organic carbon in the soil and mitigate the greenhouse effect [16,17]. Similarly, crop rotation affects nutrient dynamics in the soil [18] and the chemistry of deep horizons [19]. However, a common weakness of many such studies is that they were conducted in very short time periods and focused only on the arable layer or the surface horizon (0–25 cm) or, when they included deeper layers, used fixed depth intervals without taking into account the natural arrangement of the soil in the morphogenetic horizons [20,21]. We therefore believe, as do some other authors, that it is necessary to monitor and predict long-term changes in soil properties across the entire soil profile if the soil is to be managed sustainably [22].
This environmental problem, which is widely evidenced in other areas of the planet, and the development of possible solutions, justify this study, whose overall objective was to avoid soil degradation as a consequence of the change in the management model, implementing sustainable agricultural practices. The present study was carried out in an experimental plot located in the municipality of Puebla de Don Fadrique, in the province of Granada (southeast Spain) (Figure 1). This is an area where, in the 1990s, an irrigation system was implemented that affected more than 2000 hectares and involved a significant change in the soil management.
A significant proportion of the cultivated soils have been subjected to the shift from rainfed, extensive agriculture to an irrigated model. Concurrently, traditional rainfed crops (cereals and almonds) have been replaced with horticultural crops (broccoli, tomato, celery, potato, etc.), whose management implies changing from an agrosystem that is only slightly aggressive with respect to the environment to another in which processes such as soil degradation, pollution, and overexploitation of aquifers are frequent. To investigate the effects of management on the soil properties, the horizons of three soil profiles were sampled. Profile 1 (P1) was sampled in 1998 and corresponded to a soil used for rainfed cereal cultivation. Profiles 2 and 3 (P2 and P3) were sampled in the same location, but in 2003 and 2017, respectively. The use of irrigation water on the farm began at the end of 1998, after the sampling of P1.
The hypotheses that justified this study were:
-
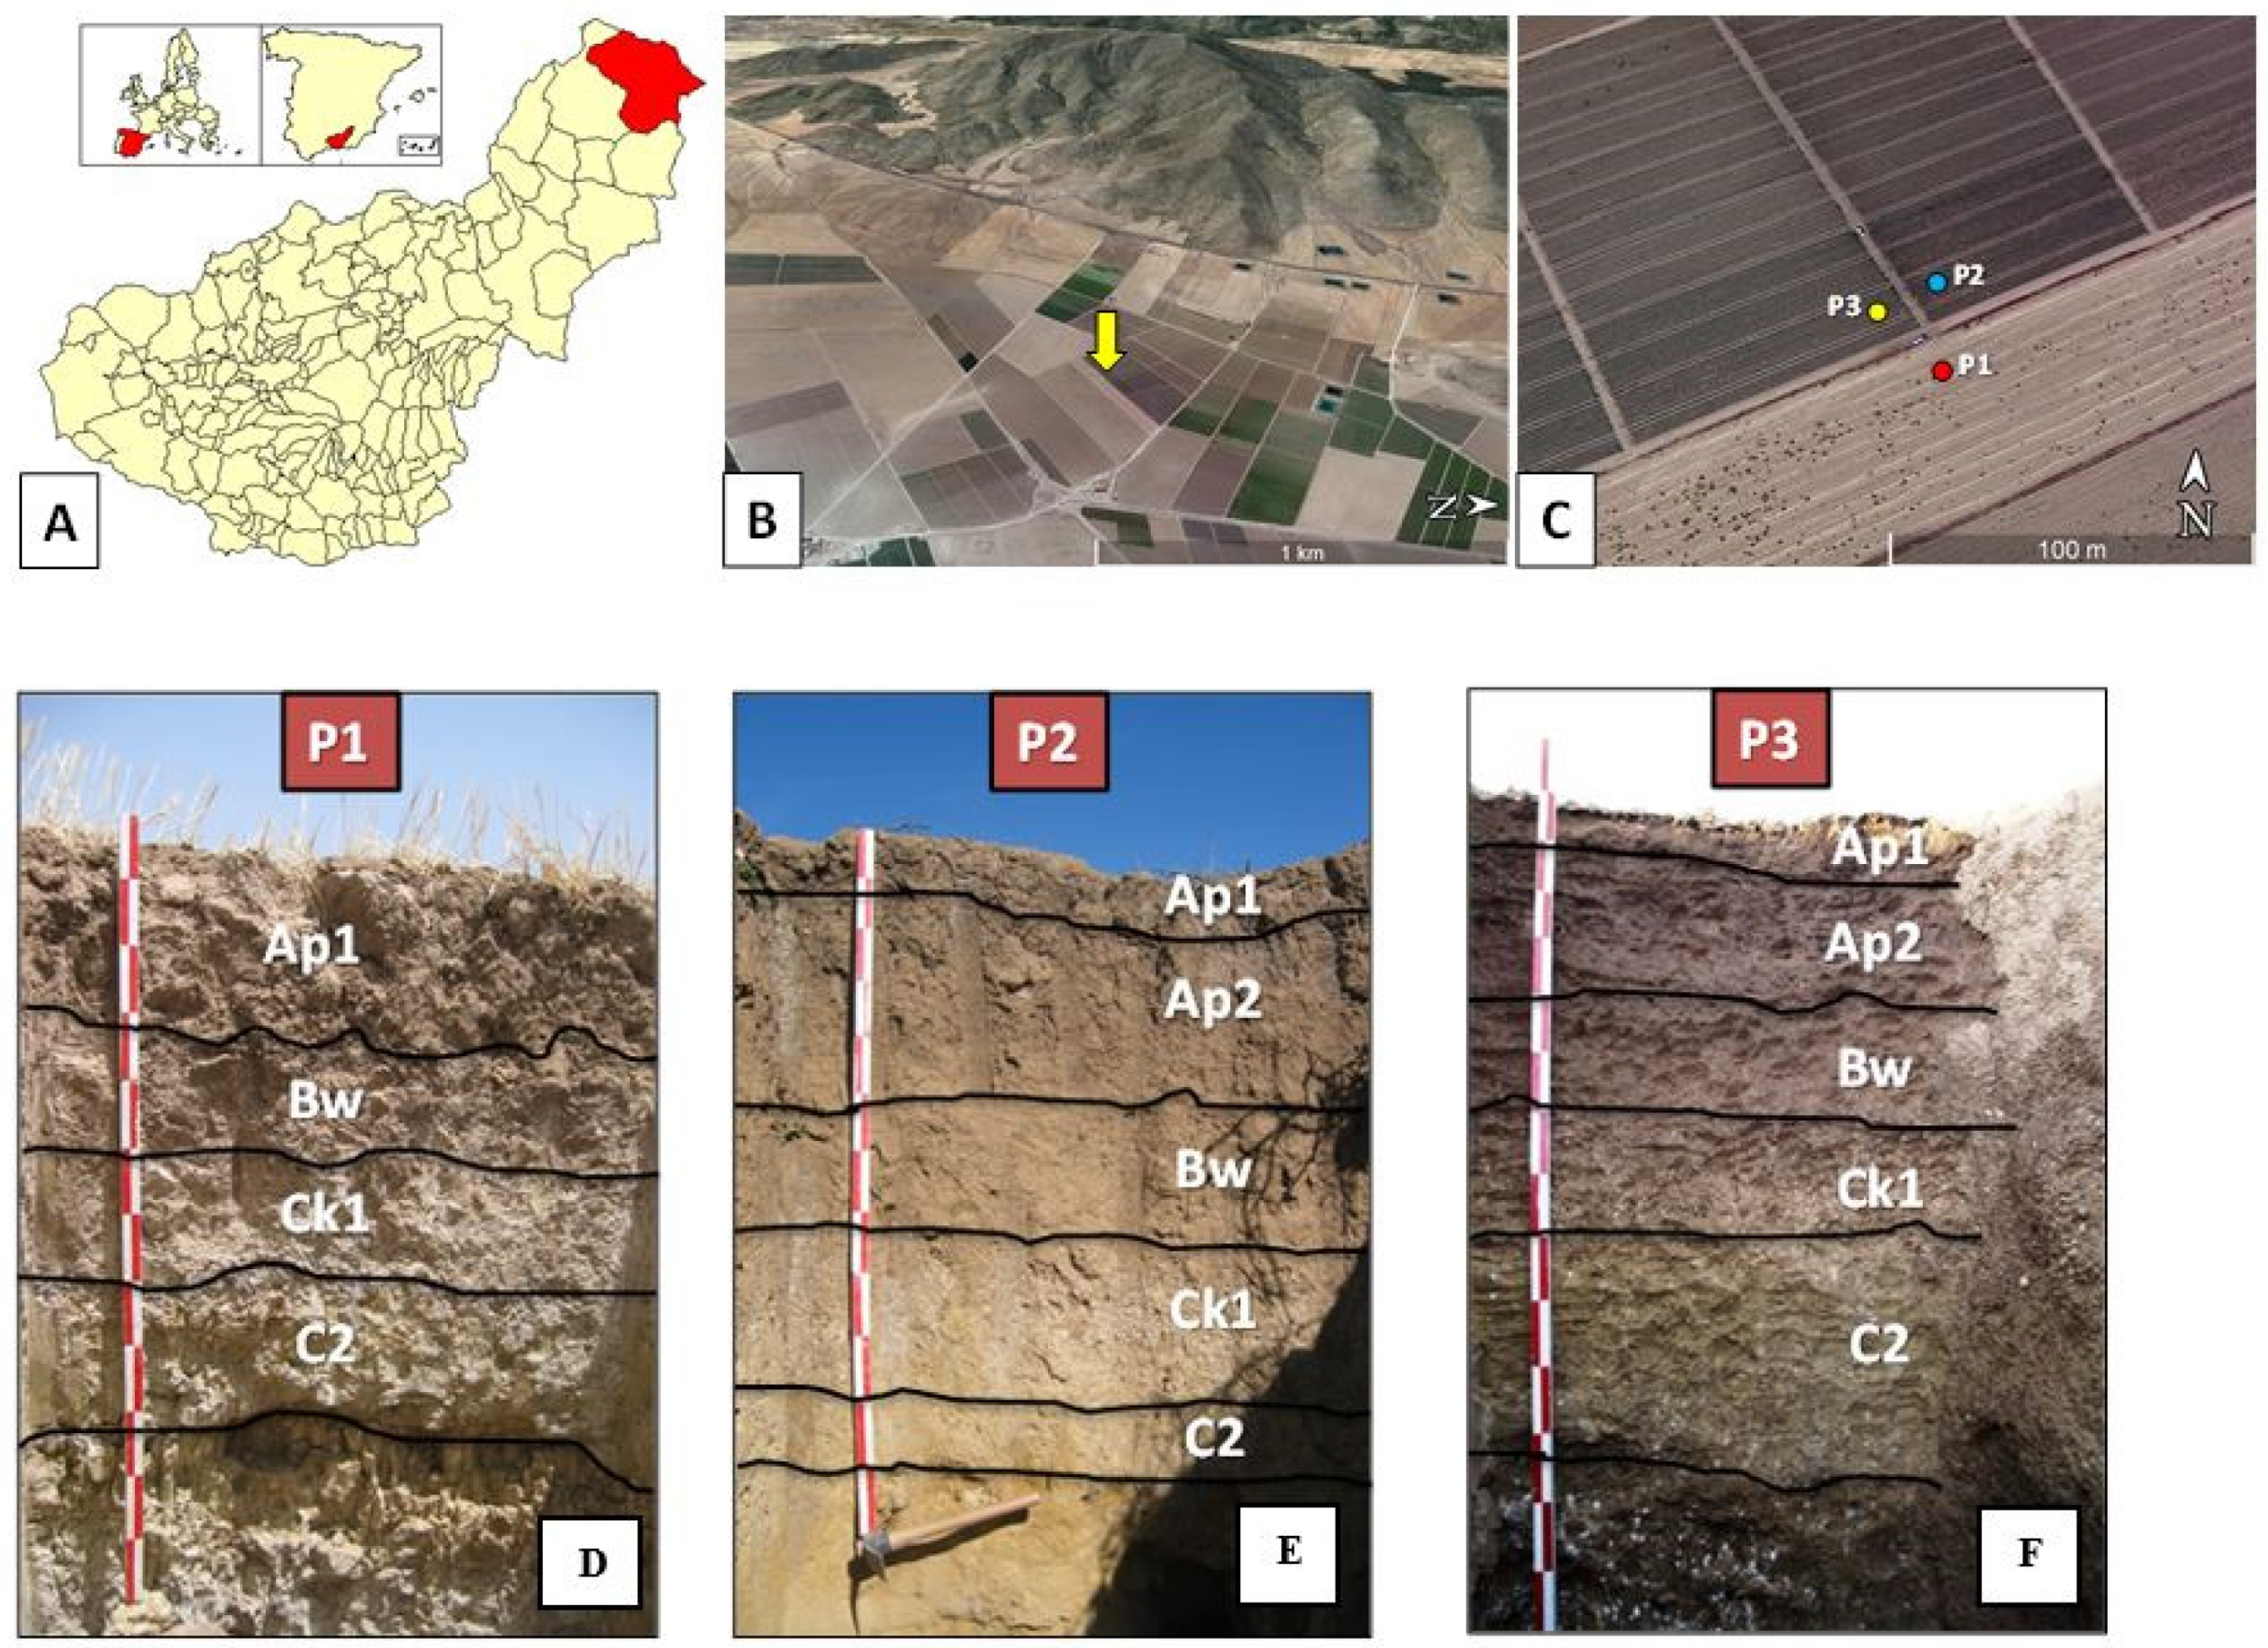
The change in the use to which the studied soil has been subjected, as a result of the introduction of irrigation and horticultural crops, entails a potential risk of accelerated soil degradation, as has happened in other, similar soil and climate zones. This must be manifested in the long term in some morphological properties, such as the color and thickness of the surface horizons, chemical properties (organic carbon (OC), electrical conductivity (EC), total nitrogen (TN), assimilable elements, etc.), and mineralogical properties of the soil. However, if the management involves sustainable agricultural techniques, such as the use of organic amendments and crop rotation, and if the evolution of soil horizons is monitored in the medium and long term, the degradation of this resource can be minimized.
Although agricultural activity takes place mainly in the upper horizons of the soil, changes in soil use can also affect deeper horizons, which are rarely studied. Therefore, it is necessary to monitor the soil profile as a whole.
The objectives of this study were as follows:
-
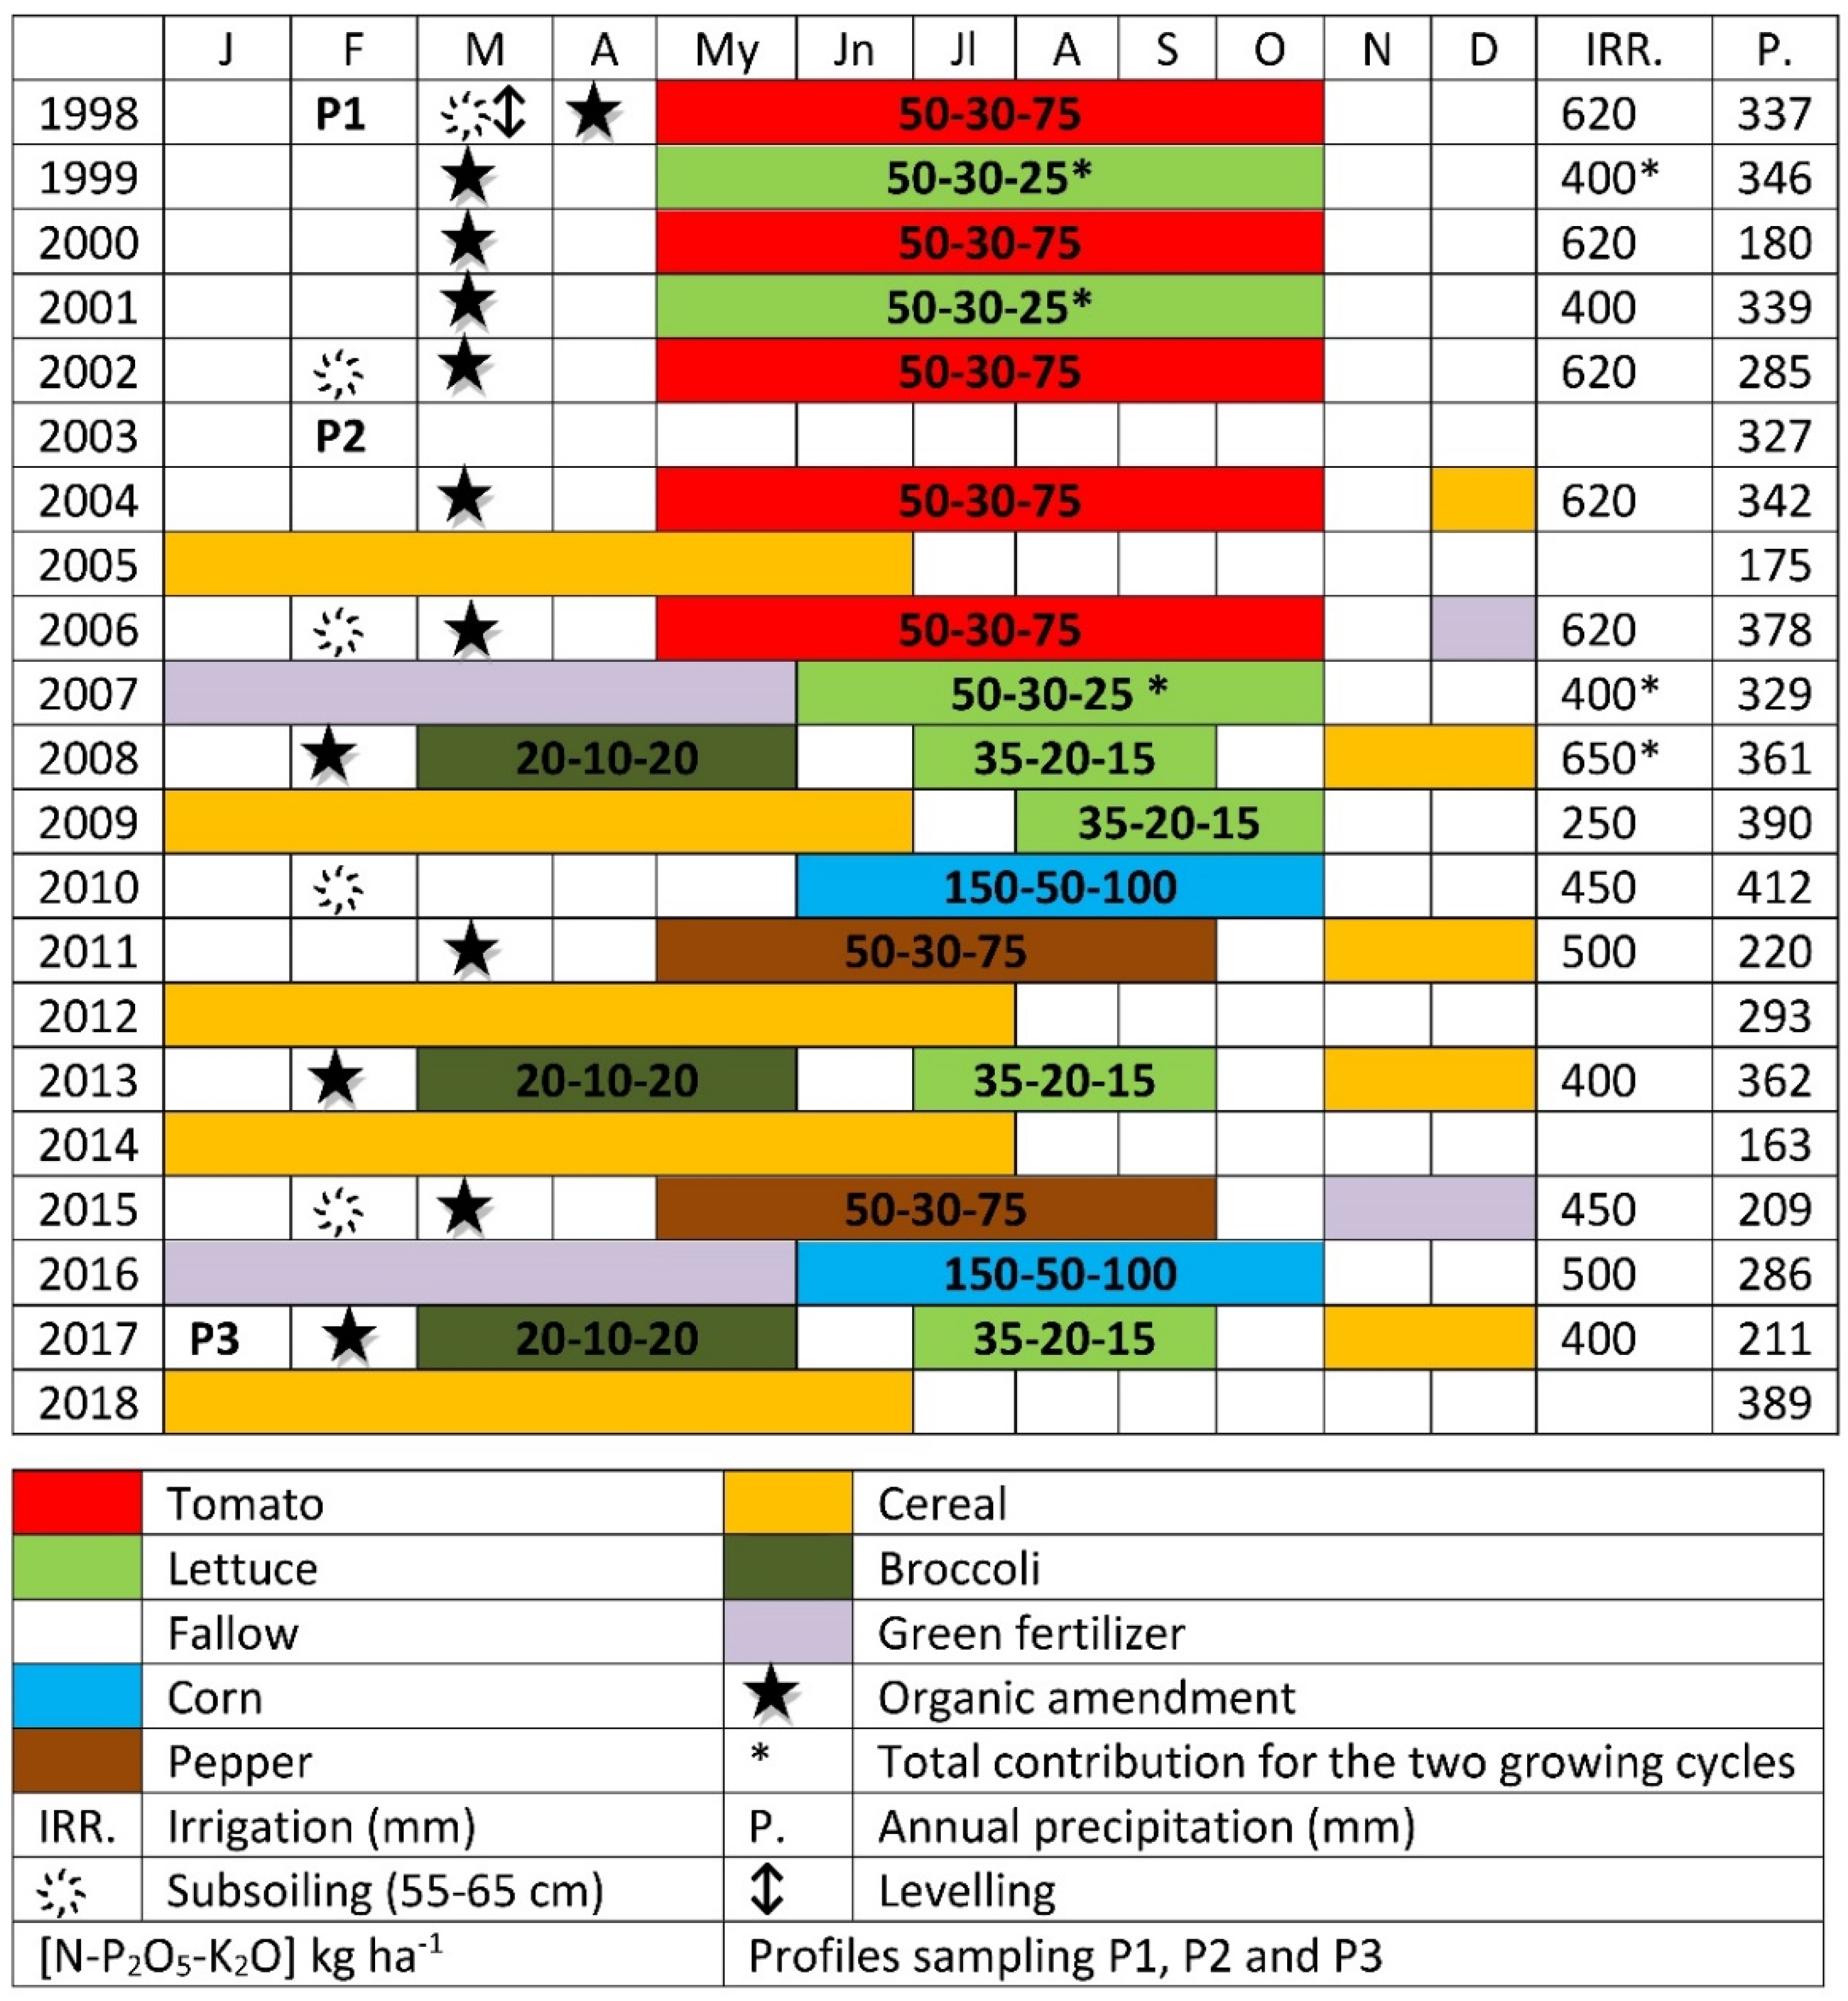
To establish the influence of organic amendments and crop rotation on some soil properties over a period of 20 years and to determine the intensity of degradation processes in the different horizons of the profile.
-
To promote a management model that enhances the soil ecological functions, such as the role of soil as a carbon sink, and minimizes soil degradation.
Regarding the innovative aspects of this work that were necessary to achieve the aforementioned objectives, the first concerns the sampling and monitoring unit (the pedon instead of arable layer samples). The soil was considered as a natural three-dimensional body formed by horizons, and its properties, including mineralogical and morphological ones, were monitored over two decades, in all horizons. This is vital because, although anthropic activity is carried out in the upper horizons, the consequences can be manifested in both the surface and deep horizons, and study of the latter is essential to reveal the processes of salinization and contamination that can affect the soil and aquifers. The second innovative aspect is the long-term nature of the study, which will provide reliable data on the soil response to the treatments and the management model applied (irrigation, organic amendment, subsoiling, crop rotation, green fertilizer, etc.), permitting the definition of a set of sensitive indicators for soil monitoring. This will allow managers to take measures to correct those variables that deviate from the desired value, and thus avoid soil degradation.

2. Materials and Methods

The experimental plot is located in the southeast of Spain (Figure 1), with an average annual precipitation of around 303 mm and an average annual temperature of 12.7 °C, and is classified within the supramediterranean bioclimatic stage. The geographic coordinates are P1: 37°50′30.34″ N; 2°26′20.99″ W; P2: 37°50′30.52″ N; 2°26′20.96″ W; P3: 37°50′30.41 N; 2°26′21.20″ W, the altitude is 948 m above sea level, and the area covers approximately 1 hectare with a natural slope of less than 2% (leveled to 0%) and has developed on alluvial sediments. The weather of the study area has a highly seasonal nature, with minimum temperatures of around −10 °C and maximum temperatures of around 40 °C. The soil moisture regime is xeric and the temperature mesic [23]. This plot is representative of the type of soil on which the region’s irrigation plan was carried out in the 1990s, so the results obtained in this study can be extrapolated.
In the sampling design, the evolution of the soil properties was monitored, in addition to changes in them due to irrigation. In this way, it was possible to consider a change in the management model to avoid soil degradation, if necessary. The pedon was adopted as the sampling and monitoring unit, as defined by [24]. During the study period, three trial pits, approximately 200 cm deep, 80 cm wide, and 300 cm long, were opened by means of a backhoe and all the horizons were sampled on the three faces of each trial pit, obtaining three samples from each horizon, one frontal and two laterals, thus ensuring the representativeness of the samples.
Three complete soil profiles (pedons) were sampled, following the FAO Guidelines for Soil Description [25]. Profile 1 (P1) was sampled in 1998 and corresponded to a soil used for rainfed cereal cultivation. It represents the initial starting point before the change in land use. Profiles 2 and 3 (P2 and P3) were sampled in the same location, but in 2003 and 2017, respectively (Figure 1). Both P2 and P3 corresponded to soils dedicated to summer vegetable cultivation under irrigated conditions and so had properties that, in part, were a consequence of the agronomic management that had been carried out on the farm for 5 and 19 years after the change of use, respectively. The distance among sampling points was close to 20 m, in order to avoid perturbations derived from previously made trial pits.
From 1998 to 2017, the plot was used, basically, to cultivate vegetables throughout the summer season: broccoli (3 years), tomato (5 years), pepper (2 years), lettuce (7 years), and corn (2 years). In addition, during the autumn and winter seasons, arable crops were cultivated with legumes (Vicia sativa L.) and oats (Avena sativa L.) as green manure (50 kg of oats and 125 kg of legume seeds were sown per hectare or even the soil was left bare (fallow) to meet CAP requirements). The water supply varied from 2500 to 6500 m3 ha−1, depending on the summer crop in the plot and on the cycles of repetition of the crop, because the autumn–winter crops did not receive any irrigation (Figure 2). The irrigation water used was hard, with a pH of 7.6 and an EC of 0.8 dS m−1, so it can be considered of good quality according to the combined Wilcox and Green index, based on the ratio of % Na to dissolved salts in the soil water. The irrigation water was of subterranean origin and its composition is presented in Table A1. The irrigation and fertilization were carried out simultaneously (fertigation) using drip irrigation. The cultivation system had a 2000 l tank for the nutrient solution with programmed stirring; electrovalves, filters, and polyethylene tubes (25 mm in diameter) were used to distribute the water or nutrient solution, and 14 mm diameter tubing was used to supply the self-compensating emitters (2 l h−1). Irrigation control was achieved with a set of Watermark electrical resistance blocks (Irrometer Inc., Riverside, CA, USA), which were installed about 15 cm from the plant row at a depth of 30 cm. The organic amendment consisted of 20,000 kg ha−1 yr−1of sheep manure, applied annually between 1998 and 2002 and biennially from 2003 until the end of the trial. Its most important physical–chemical and nutritional characteristics were: a moisture content between 60 and 65%; pH = 8.0–8.3; EC = 5.2–5.5 dS m−1; C/N = 20; OC = 440–480 g kg−1; TN = 22.3–24.0 g kg−1; and P2O5 = 14.1–14.5 g kg−1; K2O = 47 g kg−1; CaO = 28.3 g kg−1; MgO = 5.3 g kg−1; Na = 1.1 g kg−1; Fe = 2.3 g kg−1; Cu = 16 mg kg−1; Mn = 640 mg kg−1; Zn = 90 mg kg−1 The calculations of the nutritional needs of each summer crop were made based on the average extractions of nutrients from the soil by the crops; the organic amendments provided between 60 and 75% of these needs, with the rest added by fertigation. The supplementary provision of macro and micronutrients (Figure 2) was carried out by fertigation with soluble mineral fertilizers (KNO3, NH4NO3, HNO3, H3PO4, P2O5, MgSO4, K2SO4, and chelates of micronutrients). Their concentrations were adjusted according to the crop requirements, quantified by means of foliar analyses carried out during the vegetative cycle. The autumn–winter crops did not receive additional mineral fertilization.
Soil samples were air dried, sieved with a 2 mm sieve, and processed in order to analyze their properties and features [25]. The description of the consistency as dry (hardness), moist (friability), or wet (adherence and plasticity) was carried out according to the indications of [25]. Soil color was described using a Munsell Soil Color Chart, soil texture was determined by the Robinson pipette method [26], and TOC and TN were determined in an elemental analyzer (Leco, model CHNS-932). The estimation of total carbon capture was estimated from the OC and CaCO3 contents, respectively, according to the equations:
OCc = OC · BD · depth · 10
where OCc is organic carbon capture in Mg ha−1; OC (g kg−1); BD is bulk density (1.25 g cm−3); depth is the depth of each horizon (m); and
ICc = CaCO 3   · AWC · BD · depth · 10 MM CaCO 3
where ICc is the inorganic carbon capture in Mg ha−1; CaCO3 (g kg−1); AWC is atomic weight of carbon; BD is bulk density (1.25 g cm−3); depth is the depth of each horizon (m); MMCaCO3 is the molecular mass of CaCO3.
Moreover, pHw was determined in a 1:1 suspension of soil in water and pHKCl in a 1:1 suspension of soil in 1 M KCl [27], and EC in a saturated paste extract [28]; total carbonates (CaCO3) were estimated by volumetric analysis using a Bernard calcimeter [28]; the cation exchange capacity (CEC) and the exchangeable Na, K, and Mg were determined by means of the method described in [28]; the available contents of the cations Na, K, and Mg were measured by atomic absorption; and the available P was determined by Watanabe and Olsen’s method [28]. Atomic absorption was used to determine the available contents of the elements Fe, Cu, Mn, and Zn—that is, the contents extracted with a solution of 0.05 M DTPA, 0.01 M CaCl2, and 0.1 M triethanolamine at pH 7.3 [28].
Regarding the mineralogical analysis, the clay fraction was subjected to the following treatments prior to its analysis in oriented aggregates: removal of organic matter and carbonates, saturation with Mg2+ and ethylene glycol, and heating to 350 and 500 °C [29]. All samples were analyzed using an X-ray diffractometer and the minerals were identified using the database [30]. The working conditions were radiation Kα Cu; intensity 24 mA; 40 kV; Ni filter; window slit of 1; meter gap of 0.1; scanning speed, 1° 2Θ min−1; and sensitivity, 5 × 10³.
The data were analyzed using the General Linear Model of the SPSS Version 22.0 statistical package (IBM SPSS,). A one-way ANOVA and Tukey’s test were carried out in order to ascertain significant differences among the P1, P2, and P3 horizons.

3. Results

Profiles P1, P2, and P3 were relatively well developed, containing an Ap-Bw-C sequence of horizons. According to the results of the macromorphological study of the complete profiles (Table A2, Table A3 and Table A4), land use change caused modifications of differing importance in some soil properties. There were changes in the depth of the Ap horizons. In fact, in P2 and P3 the Ap horizon was divided into Ap1 and Ap2, and was more than 50 cm deep, whereas the Ap horizon of P1 was around 30 cm deep. The depths at which the rest of the horizons appear in profiles P2 and P3 have also been affected by surface leveling.
The soil texture in P1, P2, and P3 was silty clay loam for Ap and Bw, clay loam for C1, and loam for C2, except in P1, for which it was clay loam. The soil structure was blocky subangular for Ap and Bw in the three profiles.
Regarding soil color, the Ap1 horizon darkened very quickly from P1 to P3, changing from pale brown (10YR 6/3—dry) and dark yellowish-brown (10YR 4/3.5—moist) to brown (10YR 5/3—dry) and dark brown (10YR 3/3—moist). A whitish mottling was observed in the Ap1, Ap2, and C1 horizons of profiles P2 and P3, and analysis showed that this comprised soluble salts (Figure A1). Furthermore, the Bw horizon had reddish tones, and a lower CaCO3 content (Table 1) than the underlying horizons, so it was denoted as a cambic horizon. This feature was relevant for the soil taxonomic classification.
Profiles P1, P2, and P3 had low to moderate TOC contents that decreased progressively with depth (Table 1). The values were highest in the upper horizons (especially in P2 and P3, ≈10 g kg−1) and lowest in the C horizons (<3 g kg−1). The statistical analysis revealed significant differences in the TOC contents among P1, P2, and P3, specifically in the Ap1, Ap2, and C1 horizons.
The TN contents (Table 1), in general, did not vary significantly with the change in use of the cropland. As happened with TOC, the highest values of TN were found in the upper horizons of P1 and P2 (1.1 and 1.3 g kg−1, respectively). However, N accumulation was detected in the C1 and C2 horizons of P2 and P3, with a maximum of 0.9 g kg−1. This value even exceeded that measured in the surface horizon of P3 (0.8 g kg−1).
The C/N ratio differed significantly among Ap1, Ap2, and C2; it had values between 7 and 9 in horizons Ap and Bw of P1 and P2, whereas the maximum value (16.5) was found in horizon Ap2 of P3 (Table 1). The lowest C/N ratio found was in the C horizons of P2 and P3, a result of the increase in N mentioned in the previous section. The C/N ratios in the upper horizons (Ap1 and Ap2) of P3 were increased in comparison with P2 and were the closest to the values of the surrounding natural soils (C/N≈10), due to the presence of high concentrations of TOC.
The EC values varied significantly in all horizons with the change in the use of the cropland (Table 1). In P1, the EC was lower than 2 dS m−1 in all horizons of the profile. However, in P2, the EC was significantly (p < 0.05) increased in comparison with P1 in all horizons except Bw (1.2 dS m−1); therefore, the first 5 years of vegetable cultivation led to statistically significant increases in the EC. This increase in the EC was accentuated in the deep horizons (C1 and C2) of P2 that, in comparison to those of P1, reached EC values around four times higher. This aspect confirms the leaching of salts to the deep horizons during this first stage and an incipient salinization of the soil.
The dynamic of the total CaCO3 in the soil profile suggests its mobilization from the upper horizons, where its concentration was lower in P3 than in P1 (by 6% in Ap1 and by 7% in Bw), to the underlying C2 horizon, where its concentration rose by 20.8%. However, as can be seen, the decrease in surface CaCO3 was smaller than the increase at depth, indicating that inorganic carbon sequestration was occurring in the deep horizons (Table 2). The incorporation of carbonates and bicarbonates with the irrigation water, and the bioformation of CaCO3 due to the root respiration of the crops, may explain these results.
By contrast, organic carbon sequestration occurred mainly in the upper soil horizons, turning this soil into a carbon sink. This is supported by the fact that during the study period an increase in OCc of 35.0 Mg OC ha−1 was observed, most of which occurred in the upper horizon (31.5 Mg OC ha−1).
The pHw values of P1 were basic, ranging between 8.3, for the Ap1 horizon, and 8.6, for the C1 horizon (Table 1). The pHw values decreased slightly with the change in land use. Such decreases in P2 and P3, compared to the P1 values, were found in all horizons, both upper and deep.
The CEC values were relatively high in the A horizons, due to the presence of 2:1 clays (Figure 3) and humus, and decreased with increasing depth in the profile. Regarding the concentrations of basic cations, the change in soil use caused a short-term enrichment in Na, K, and Mg in P2 and a decrease in P3 in comparison with P2 (Table 3), with this trend being statistically significant in the Ap, Bw, and Ck1 horizons throughout the study period.
The vertical distributions of the available P concentration and the available micronutrient concentrations (Fe, Mn, Cu, and Zn) were similar in P1, P2, and P3; they were highest in the upper horizons, with significant increases throughout the study period (Table 3 and Table 4). In the case of P, this implies an increase in chemical fertility, due to its functions as a macronutrient.
In the case of Fe, the initial values tripled with the change of use, both in the arable layer and in the deep horizons, whereas the concentration of Mn in the arable layer doubled over the years of the study, with extremely high values in the deep horizons of P2, which subsequently stabilized in P3. The Cu values were doubled in all soil horizons and the Zn values were increased up to six-fold, when comparing P3 with P1. Finally, a statistically significant correlation was found between OC and available P and available micronutrients, so that the maximum concentrations of available micronutrients and P occurred in the horizons with the highest organic matter content.
The clay fraction of P1 and P3 was characterized using the method described in Section 2. As can be seen in Figure 3, there were no appreciable differences between the corresponding horizons of P1 and P3. The Ap horizons of both profiles featured the presence of illite (reflection at 1.0 nm) and kaolinite (0.7 nm). In the Bw and C1 horizons of P1 and P3, together with illite and kaolinite, there were trioctahedral smectites, characterized by their reflection at 1.4 nm in the Mg diagram, which expanded at 1.7 nm upon solvation in EG and disappeared in the heat treatment. Chlorites were observed in these horizons, characterized by the presence of a reflection at 1.4 nm, which persisted in the heat treatment. Of these minerals with basal spacing at 1.4 nm, only traces of smectites were seen in the Ap horizon (Figure 3). All of these can be considered as minerals derived from illite.
Profiles P1 and P2 were classified, according to [31], as Calcaric Vertic Cambisols (Loamic) because they were calcareous and possessed one cambic and one protovertic horizon. In contrast, P3 contained the above-mentioned horizon plus an A mollic horizon and a calcic horizon; consequently, it was classified as a Vertic Calcic Kastanozem (Cambic, Loamic).

4. Discussion

The change of use and management to which the soil was subjected has had consequences for its macromorphology, with the thickness of the A horizon and the depths of the different B and C horizons being affected. These were due to the subsoiling carried out at a depth of 50–60 cm every two or three years to eliminate the hardened tillage layer and improve the physical properties (in P2 and P3). This caused part of the Bw horizon in P1 to become part of the Ap horizon in P2 and P3, while the leveling of the soil affected both the thickness of the superficial horizon and the depth at which the B and C horizons appeared.
The surface soil horizon darkened extremely quickly from P1 to P3. This was due to the increase in the content of humic substances, following the addition of manure and crop residues, as reported by other authors [32]. The mineralization of these organic amendments, together with the mineral fertilizers provided by fertigation (nitrate, phosphates, sulfates, etc.) caused mottling in the Ap1, Ap2, and C1 horizons of the P2 and P3 profiles (Figure A1A) and contributed to the vertical mobilization of salts in the profile. However, the spots in the C2 horizons of the profiles (Figure A1B,C) have their origin in the genesis of the soil and correspond to CaCO3 accumulations. These spots, together with the oxidoreduction spots (Figure A1B) and other macromorphological and mineralogical characteristics, indicate specific conditions of hydromorphism, typical of soils with vertic or protovertic horizons and similar to those described by [33] in Vertisols in the province of Granada (Spain).
The TOC contents were low to moderate and decreased progressively with depth, as evidenced by [34] for other soils of the region. They increased as a consequence of the change in soil management, due to the incorporation of sheep manure, and also due to the application of nitrogen fertilizers, which caused an increase in the root biomass of the crops in the Ap horizons. These results are comparable to those obtained by [13]. Hence, there was a significant increase in TOC in the Ap1 horizon of the P2 and P3 profiles in comparison with P1 (33.3 and 21.7%, respectively). The authors of [19] found that organic fertilization can enhance the formation of organo-Ca complexes, which in turn improve soil aggregation and thus contribute to long-term TOC sequestration. The subsoiling to which the soil was subjected led to an accumulation of TOC in Ap2, the TOC content in this horizon being higher in P3 (significantly so) than in P2. Finally, the differences observed in the TOC contents of the B and C horizons among the three profiles must be related to the fluvial origin of this soil, rather than to a possible mobilization of soluble organic compounds.
The increased presence of C in the form of CaCO3 in the deep horizons of the P2 and P3 profiles must have arisen from the incorporation of carbonates and bicarbonates with the irrigation water and the bioformation of CaCO3 driven by the root respiration of the crops [35,36]. This CaCO3 washing process was probably favored by the use of acidic fertilizer solutions, a very frequent practice in fertigation for cleaning irrigation equipment. Together with the application of manure, this would have led to a decrease in soil pHw and pHKCl, as reported by [37,38], among others.
These results confirm that the change in management practices favored C sequestration in this soil. Similar results were reported by [36,39,40] in the case of OCc, and by authors such as [41] and [35] in the case of ICc. All this reinforces the role of soils in arid and semiarid climates as C sinks and validates the compatibility of the management system used throughout the study with trends in sustainable agriculture [42,43], which the European Union is promoting in terms of soil protection [44]. The evolution over time of the C/N ratio, which is an indicator of the capacity of ecosystems to store and recycle energy and nutrients [45], towards values similar to those of the soil under the climax vegetation, also appears to validate the management practices.
The inputs of N, whether from manure or mineral fertilizers, contributed to an increase in biomass in the long term [46], in the form of the harvested crop or the crop residues, but at the same time also caused vertical leaching of N to deep horizons. This process was also observed by other authors [9,47,48,49,50], who attributed it to tillage practices, in addition to excess irrigation and fertilization. If this is not remedied, it can lead to the contamination of the surrounding ecosystems.
In relation to salts and their dynamics in time and space, it should be pointed out that the increases in EC observed between 1998 and 2003 were due to the incorporation of soluble mineral fertilizers—such as sulfate, chloride, and nitrate—as well as organic amendments [9]. Similarly, the attenuation of EC and even its decrease in P3 may be explained by the decrease in sheep manure inputs, the introduction of other winter crops such as cereals and legumes (or even maize during the summer), and the adjustment of the fertigation programs [17,18,21]. The same factors would partly explain the rapid increases in K, Mg, and Na (from P1 to P2) and their subsequent declines (from P2 to P3), to which crop uptake and salt flushing would also have contributed.
The availability of other essential elements (P, Fe, Cu, Mn, and Zn) is also strongly affected by soil management and certain soil properties, such as pH and the amounts of CaCO3 and organic matter [51,52]. Thus, the strong increase in available P over the study period is justified not only by the P content of the manure added, but also by the chelating effect of the organic matter present in the manure, which favors the mobilization of the non-available fraction of P present in carbonate rich soils [53]. In our work, the availability of Fe was also strongly influenced by the microenvironment, with results similar to those obtained by other authors [37,51,52]. These authors concluded that the concentration of available Fe in the soil is the result of the balance between antagonistic factors. A basic or slightly basic reaction of the soil and high concentrations of CaCO3 (as in our work) cause immobilization of Fe in the form of insoluble salts and thus low Fe availability [54,55]. Conversely, organic matter favors the mobilization of Fe and similar metals through the formation of organometallic complexes [37,56,57]. A predominant role of the latter process would explain the increase in the availability of these essential elements over time in this work and their incorporation in available forms into the deep horizons. Because of this, it can be stated that the chemical fertility of the soil was significantly improved by the addition of organic amendments. This is very important for the good development of the crops, because in these soils with basic pH values and high limestone contents most of the divalent cations are present in precipitated forms and, therefore, very often the crops are deficient in these elements.
Crop rotation, especially since 2004, has increased the agronomic biodiversity [58], with the introduction of new crops such as cereals, broccoli, maize, or pepper and the use of oat-legumes mixtures as green manure, an objective promoted in the EU within its CAP.
Finally, at the taxonomic level, the soil management implemented has led to a progressive evolution of the soil (Calcisol → Kastanozem) that is the opposite of that described by [59] for similar soils (Kastanozem → Calcisol). This progressive evolution of the soil, together with the other results already mentioned, validates the sustainable agronomic management model that has been implemented.
In summary, we consider that irrigation and the introduction of horticultural crops in soils that had traditionally been dedicated to rainfed cereal crops caused changes in the color and thickness of the upper horizon and, as a consequence, a taxonomic change. Most of the chemical properties analyzed underwent variations, while mineralogical properties were not affected. The results obtained confirm that soil degradation studies should be carried out in the medium and long term and should consider the entire soil profile, because, although anthropogenic activity takes place at the surface, the consequences are manifested both at the surface and in the deep horizons, the analysis of the latter being fundamental to reveal the processes of salinization and contamination. Based on the above, it can be affirmed that the hypotheses that gave rise to this research work were adequate.

5. Conclusions

Because of the management model implemented after the commencement of irrigation, between 1998 and 2003 an incipient salinization process was observed throughout the soil profile, which was even more intense in the Ck1 and C2 horizons than at the surface itself. Leaching of N was also detected, shown by the increase in the concentration of this constituent in the deep horizons. Macromorphologically, these processes were reflected in the soil profile by the appearance of white spots in the most affected horizons. However, from 2004 onwards, corrective measures implemented in the sustainable soil management model—with the introduction of winter crops, the use of green manures, and the adjustment of fertilization and irrigation—slowed these degradation and contamination processes. As a result, a positive evolution of the soil was observed, as manifested in its morphological characteristics and in some chemical properties. There was a darkening and an increase in the thickness of the A horizon, to the detriment of the underlying Bw horizon, and an increase in its fertility of the soil, and in the functional capacity of the soil as a carbon sink. Together, these have led to a change at the taxonomic level and to the attenuation of the incipient degradation detected in the first five years.
This study shows that the agronomic soil management carried out since 2004 constitutes a model of sustainable agriculture that can be extrapolated to regions with similar cultivation problems, and that most of the chemical and physical-chemical properties analyzed can be considered as sensitive indicators of the management model implemented. These properties should be monitored in all soil horizons to effectively monitor soil degradation and associated ecosystems.

Author Contributions

Conceptualization: A.S.-N. Methodology: A.S.-N. and M.J.D.-I.; Software: J.S.-M. and E.M.B.-C.; Formal analysis: E.M.B.-C., M.V.-P. and A.G.-R.; Research: A.S.-N., J.S.-M. and M.J.D.-I.; Preparation of the original draft of the writing: A.S.-N., J.S.-M. and M.V.-P.; Review and editing of the writing: A.S.-N., M.J.D.-I. and A.G.-R.; Visualization: A.S.-N. and M.J.D.-I.; Supervision: A.S.-N. and M.J.D.-I.; Administration of the project: A.S.-N.; Acquisition of funds: A.S.-N. All authors have read and agreed to the published version of the manuscript.

Funding

This research received no external funding.

Institutional Review Board Statement

Not applicable.

Informed Consent Statement

Not applicable.

Data Availability Statement

Not applicable.

Acknowledgments

We thank David J. Walker for his revision of the written English in the manuscript.

Conflicts of Interest

The authors declare no conflict of interest.

Appendix A

Table A1. Analytical determinations of the irrigation water.
ECpHNa+K+Mg2+Ca2+ClCO32−HCO3SO42−NO3H2PO4
dS m−1 mg L−1
0.87.6114124352290340145180
Table A2. Macromorphological description of profile 1 (P1).
HorizonDepth (cm)Macromorphology of P1
Ap0–32Pale brown (10YR 6/3) for dry soil and dark grayish brown (10YR 4/2) for wet soil. Texture: silty clay loam. Structure: blocky subangular, coarse and very coarse, moderate to strong. Very sticky; very plastic; very firm; very hard. Many very fine pores, few fine and medium ones. Few roots, very fine. Strongly calcareous. Clear and wavy limit.
Bw32–51Yellowish brown (10YR 5/4) for dry soil and dark yellowish brown (10 YR 3.5/4) for wet soil. Texture: silty clay loam. Structure: blocky subangular fine, and medium, strong. Sticky; plastic; firm; hard. Shiny surfaces of pressure or sliding on aggregate faces. Many very fine pores and few fine ones. Very few roots, very fine. Strongly calcareous. Clear and smooth limit.
Ck151–70Very pale brown (10 YR 7/4) for dry soil and light yellowish brown (10YR 6/4) for wet soil. Texture: clay loam. Structure: blocky angular, medium, moderate. Sticky; slightly plastic; friable; slightly hard. Shiny surfaces of pressure or sliding on aggregate faces. Many very fine pores, few fine and medium ones. Strongly calcareous. Abundant medium gravels. Clear and smooth limit.
C270–92Very pale brown (10 YR 8/4) for dry soil and yellowish brown (10 YR 7/4) for wet soil. Texture: clay loam to loam. Structure: prismatic, medium and coarse, moderate. Very sticky; very plastic; very firm; very hard. Common medium pores. Strongly calcareous. Clear and smooth limit.
Table A3. Macromorphological description of profile 2 (P2).
HorizonDepth (cm)Macromorphology of P2
Ap10–13Pale brown (10YR 6/3) for dry soil and dark yellowish brown (10 YR 4/3.5) for wet soil. Many white, rounded spots made of soluble salts. Texture: silty clay loam. Structure: blocky subangular, medium and coarse, weak to moderate. Sticky; very plastic; very firm; very hard. Many fine pores and few fine ones. Strongly calcareous. Manure accumulations, slightly decomposed. Few very fine roots. Clear and smooth limit.
Ap213–53Pale brown (10YR 6/3) for dry soil and dark yellowish brown (10YR 4/4) for wet soil. Absence of spots. Texture: silty clay. Structure: blocky subangular, fine and medium, moderate. Sticky; non-plastic; friable; hard. Many very fine pores and few fine ones. Strongly calcareous. None roots. Gradual and smooth limit.
Bw53–72Brown to grayish brown (2.5 Y 5/1) for dry soil and brown (7.5 YR 4/4) for wet soil. Texture: silty clay loam. Structure: blocky subangular, fine and medium, moderate. Sticky; plastic; firm; hard. Shiny surfaces of pressure or sliding on aggregate faces. Many very fine pores. Very few rounded, small, limestone fragments. Strongly calcareous. Clear and smooth limit.
Ck172–100Very pale brown (10YR 7/4) for dry soil and yellowish brown (10YR 5/6) for wet soil. Many white, rounded spots. Texture: clay loam. Structure: massive. Slightly sticky; slightly plastic; friable; slightly hard. Shiny surfaces of pressure or sliding on aggregate faces. Many very fine pores and few fine ones. Few rounded, small, limestone fragments. Strongly calcareous. Clear and smooth limit.
C2100–110Very pale brown (10YR 8/4) for dry soil and yellowish brown (10YR 6/8) for wet soil. Texture: loam. Structure: massive. Slightly sticky; slightly plastic; friable; slightly hard. Common very fine pores. Very few rounded, small, limestone fragments. Strongly calcareous. Clear and smooth limit.
Table A4. Macromorphological description of profile 3 (P3).
HorizonDepth (cm)Macromorphology of P3
Ap10–20Brown (10YR 5/3) for dry soil and dark brown (10YR 3/3 for wet soil. Texture silty clay loam. Structure: blocky subangular, fine and medium, moderate. Sticky; plastic; very firm; very hard. Many very fine pores and few fine ones. Very few roots, fine. Strongly calcareous. Clear and smooth limit.
Ap220–50Light brownish gray (10YR 6/2) for dry soil and brown (10YR 4/3) for wet soil. Texture: silty clay loam. Structure: blocky subangular, fine and medium, moderate. Sticky; plastic; very firm; very hard. Many very fine pores. Very few roots, very fine. Strongly calcareous. Clear and smooth limit.
Bw50–68Pale gray (10YR 7/2) for dry soil and brown (10YR 5/3) for wet soil. Texture: silty clay loam. Structure: blocky subangular, fine and medium, moderate. Sticky; plastic; firm; very hard. Many very fine pores. Strongly calcareous. Clear and smooth limit.
Ck168–92Pale gray (10YR 7/2) for dry soil and pale brown (10YR 6/3) for wet soil. Texture: clay loam. Structure: massive. Common medium, clear, well-defined spots representing 5–10% of total volume. Slightly sticky; slightly plastic; friable; hard. Many very fine pores and few fine ones. Common rounded, small, limestone gravels. Strongly calcareous. Clear and smooth limit.
C292–125Very pale brown (10YR 8/2) for dry soil and light reddish brown (2.5YR 6/4) for wet soil. Texture: loam. Structure: massive. Slightly sticky; slightly plastic; friable; hard. Common fine pores. Very few rounded, limestone gravels. Strongly calcareous. Clear and smooth limit.
Figure A1. (A). Manure not yet decomposed in the Ap1 horizon and mottling of soluble salts (Ap2) of Profile 2. (B). Detail of carbonate mottling and oxidation-reduction mottling in the C2 horizon of Profile 2. (C). Detail of carbonates mottling in the C2 horizon of Profile 3.
Agronomy 11 02363 g0a1

References

  1. Tilman, D.; Fargione, J.; Wolff, B.; D’antonio, C.; Dobson, A.; Howarth, R.; Schindler, D.; Schlesinger, W.H.; Sinmerloff, D.; Swackhamer, D. Forecasting agriculturally driven global environmental change. Science 2001, 292, 281–284. [Google Scholar] [CrossRef] [Green Version]
  2. UNCED. Rio Declaration on Environment and Development. In Proceedings of the United Nations Conference on Environment and Development Earth Summit, Rio de Janeiro, Brazil, 3–14 June 1992. [Google Scholar]
  3. Hussein, J.; Adey, M.A.; Elwell, H.A. Irrigation and dryland cultivation effects on the surface properties and erodability of Zimbabwe vertisol. Soil Use Manag. 1992, 8, 96–103. [Google Scholar] [CrossRef]
  4. Fraiture, C.; Wichelns, D. Satisfying future water demands for agriculture. Agric. Water Manag. 2010, 97, 502–511. [Google Scholar] [CrossRef]
  5. Blecker, S.W.; Connolly, S.C.; Cardon, G.E.; Kelly, E.F. The role of mining and agricultural activity in creating coexisting but divergent soils, San Luis Valley, Colorado, USA. Geoderma 2013, 148, 384–391. [Google Scholar] [CrossRef]
  6. Giubergia, J.P.; Martellotto, E.; Lavado, R.S. Complementary irrigation and direct drilling have little effect on soil organic carbon content in semiarid Argentina. Soil Tillage Res. 2013, 134, 147–152. [Google Scholar] [CrossRef]
  7. Keil, R.G.; Mayer, L.M. Mineral matrices and organic matter. In Treatise on Geochemistry, 2nd ed.; Holland, H.D., Turekain, K.K., Eds.; Elsevier: Oxford, UK, 2012; Volume 12, pp. 337–359. [Google Scholar]
  8. Arnaldos, R. Study of the Soil Salinity in the Central-Eastern Sector of the Campo de Cartagena (Murcia). Ph.D. Thesis, University of Murcia, Murcia, Spain, 2001. [Google Scholar]
  9. Iqbal, M.; Khan, A.G.; Islam, K.R. Tillage and nitrogen fertilization impact on irrigated corn yields, and soil chemical and physical properties under semiarid climate. Int. J. Eng. Res. 2013, 1, 90–98. [Google Scholar] [CrossRef]
  10. Jabro, J.D.; Iversen, W.M.; Stevens, W.B.; Evans, R.G.; Mikha, M.M.; Allen, B.I. Physical and hydraulic properties of sandy loam soil under zero, shallow and deep tillage practices. Soil Tillage Res. 2016, 159, 67–72. [Google Scholar] [CrossRef]
  11. Al-Jaloud, A. Effect of irrigation with treated municipal wastewater on soil and crops. J. King Abdulaziz’s Univ. 1994, 5, 77–88. [Google Scholar]
  12. Gutiérrez-Castorena, E.V.; Gutiérrez-Castorena, M.; Ortiz-Solorio, C.A. Carbon capture and pedogenetic processes by change of moisture regimen and conventional tillage in Aridisols. Soil Tillage Res. 2015, 150, 114–123. [Google Scholar] [CrossRef]
  13. Khater, A.M.; El-Dewiny, C.Y.; Zaghloul, A.M. Release of certain nutrients as affected by acidification of irrigation water II. Zinc (kinetic study). J. Appl. Sci. Res. 2012, 7, 3740–3747. [Google Scholar]
  14. Bernal, M.P.; Sánchez-Monedero, M.A.; Paredes, C.; Roig, A. Carbon mineralization from organic wastes at different composting stages during their incubation with soil. Agric. Ecosyst. Environ. 1998, 69, 175–189. [Google Scholar] [CrossRef]
  15. Williams, H.; Tino, C.; Keller, T. The influence of soil management on soil health: An on-farm study in southern Sweden. Geoderma 2020, 360, 1–10. [Google Scholar] [CrossRef]
  16. Huang, X.; Jia, Z.; Guo, J.; Li, T.; Sun, D.; Meng, H.; Yu, G.I.; He, X.; Ran, W.; Zhang, S.; et al. Ten-year long-term organic fertilization enhances carbon sequestration and calcium-mediated stabilization of aggregate-associated organic carbon in a reclaimed Cambisol. Geoderma 2019, 355, 1–10. [Google Scholar] [CrossRef]
  17. Mathew, I.; Hussein, S.; Macdex, M.; Budiman, M.; Vincent, C. Crops for increasing soil organic carbon stocks—A global meta-analysis. Geoderma 2020, 367, 114230. [Google Scholar] [CrossRef]
  18. Adams, A.M.; Gillespie, A.W.; Dhillon, G.S.; Kar, G. Long-term effects of integrated soil fertility management practices on soil chemical properties in the Sahel. Geoderma 2020, 366, 1–17. [Google Scholar] [CrossRef]
  19. Gregory, A.S.; Dungait, J.A.; Watts, C.W.; Bol, R.; Dixon, E.R.; White, R.P.; Whitmore, A.P. Long-term management changes topsoil and subsoil organic carbon and nitrogen dynamics in a temperate agricultural system. Eur. J. Soil Sci. 2016, 67, 421–430. [Google Scholar] [CrossRef] [Green Version]
  20. Knebl, L.; Leithold, G.; Schulz, F.; Brock, C. The role of soil depth in the evaluation of management-induced effects on soil organic matter. Eur. J. Soil Sci. 2017, 68, 979–987. [Google Scholar] [CrossRef]
  21. Shiwakoti, S.; Zheljazkov, V.; Gollany, H.; Kleber, M.; Xing, B. Macronutrients in soil and wheat as affected by a long-term tillage and nitrogen fertilization in winter wheat–fallow rotation. Agronomy 2019, 9, 178. [Google Scholar] [CrossRef] [Green Version]
  22. Ashworth, A.J.; Owens, P.R.; Allen, F.L. Long-term cropping systems management influences soil strength and nutrient cycling. Geoderma 2020, 361, 1–7. [Google Scholar] [CrossRef]
  23. Staff, S.S. Keys to Soil Taxonomy, 12th Edn Washington; Natural Resources Conservation Service, United States Department of Agriculture: Washington, DC, USA, 2014. [Google Scholar]
  24. USDA, S. A Basic System of Soil Classification for Making and interpreting Soil Surveys. Soil Surv. Staff 1975, 436, 744. [Google Scholar]
  25. FAO. Guidelines for Soil Description; FAO: Rome, Italy, 2006; p. 100. [Google Scholar]
  26. Gee, G.W.; Bauder, J.W. Handbook of Soil Analysis: Mineralogical, Organic and Inorganic Methods; Klute, P.A., Ed.; American Society of Agronomy: Madison, WI, USA, 1986; Volume 9, pp. 383–411. [Google Scholar]
  27. Anderson, J.M.; Ingram, J.S. Tropical Soil Biology and Fertility: A Handbook of Methods. Soil Sci. 1993, 157, 265. [Google Scholar] [CrossRef]
  28. Soil Survey Laboratory Methods Manual, Soil Survey Investigations Report, Nº. 42, Version 4.0; United States Department of Agriculture, Natural Resources Conservation Service, National Soil Survey Center: Washington, DC, USA, 2004; p. 736.
  29. Moore, D.M.; Robert, C.; Reynolds, J.R. X-ray Diffraction and the Identification and Analysis of Clay Minerals; Oxford University Press: New York, NY, USA, 1997. [Google Scholar]
  30. International Centre for Diffraction Data (ICDD). Campus Boulevard Newtown Square, PA 19073, USA. 2002. [Google Scholar]
  31. IUSS Working Group WR. World Reference Base for Soil Resources 2006. World Soil Resources Reports No. 103; Food and Agriculture Organization: Rome, Italy, 2006. [Google Scholar]
  32. Lehmann, J.; Kleber, M. The contentious nature of soil organic matter. Nature 2015, 528, 60–68. [Google Scholar] [CrossRef] [PubMed]
  33. Alías, L.J.; Pérez-Pujalte, A. Vertisoles de la provincia de Granada. An. Edafol. Agrobiol. 1968, 27, 885–901. [Google Scholar]
  34. Pérez-Pujalte, A.; Ibáñez, M.A.; Torres, M.; Oyoarte, C.; Guirado, J.; Mendoza, R. Soil Map at Scale 1:100,000. Sheet 951 (Orce); Project LUCDEME; Ministry of Agriculture, Fisheries and Food: Madrid, Spain, 1990; 162p. [Google Scholar]
  35. Sojka, R.E.; Entry, J.A.; Shewmaker, G.E.; Fuhrmann, J.J. Critical Aspects of Soil and Water Management; Management of irrigated agriculture to increase carbon storage; Designing Sustainable Farms; Massey University: Palmerston Noth, New Zealand, 2007. [Google Scholar]
  36. Entry, J.A.; Sojka, R.E.; Shewmaker, G.E. Irrigation increases carbon in agricultural soils. In Proceedings of the 16th Triennial Conf. of ISTRO: Soil Management for Sustainability, Brisbane, Australia, 13–18 July 2003. [Google Scholar]
  37. Chen, X.; Wei, X.; Hao, M.; Zhao, J. Changes in soil iron fractions and availability in the loess belt of northern China after 28 years of continuous cultivation and fertilization. Pedosphere 2019, 29, 123–131. [Google Scholar] [CrossRef]
  38. Wei, X.R.; Shao, M.A.; Zhuang, J.; Horton, R. Soil iron fractionation and availability at selected landscape positions in a loessial gully region of northwestern China. Soil Tillage Res. 2010, 91, 120–130. [Google Scholar] [CrossRef]
  39. Hontoria, C.; Rodríguez, J.; Saa, A. Organic carbon content in soil and control factors in Iberian Peninsula. Edaphology 2004, 11, 149–157. [Google Scholar]
  40. Jensen, J.L.; Schjønning, P.; Watts, C.W.; Christensen, B.T.; Obour, P.B.; Munkholm, L.J. Soil degradation and recovery—Changes in organic matter fractions and structural stability. Geoderma 2020, 364, 1–15. [Google Scholar] [CrossRef]
  41. Entry, J.A.; Sojka, R.E.; Shewmaker, G.E. Irrigation increases inorganic carbon in agricultural soils. Environ. Manag. 2004, 33, S309–S317. [Google Scholar] [CrossRef]
  42. Romanyá, J.; Rovira, P.; Vallejo, R. Análisis del carbono en los suelos agrícolas de España. Aspectos relevantes en relación a la reconversión a la agricultura ecológica en el ámbito mediterráneo. Ecosistemas 2007, 16, 50–57. [Google Scholar]
  43. Visconti, F.; de Paz, J.M. Estimación de la capacidad potencial de secuestro y emisión de CO2 de los suelos agrícolas de la Comunidad Valenciana. Ecosistemas. Rev. Cient. Ecolog. Medio Amb. 2017, 26, 91–100. [Google Scholar] [CrossRef] [Green Version]
  44. Resolucióndel Parlamento Europeo sobre la protección del suelo 2021/2548(RSP). 25 pp. (22/04/2021).
  45. Goyal, S.; Chander, K.; Mundra, M.C.; Kapoor, K.K. Influence of inorganic fertilizers and organic amendments on soil organic matter and soil microbial properties under tropical conditions. Biol. Fertil. Soils 1999, 29, 196–200. [Google Scholar] [CrossRef]
  46. Blevins, R.L.; Thomas, G.W.; Smith, M.S.; Frye, W.W.; Cornelius, P.L. Changes in soil properties after 10 years continuous non-tilled and conventionally tilled corn. Soil Tillage Res. 1983, 3, 135–146. [Google Scholar] [CrossRef]
  47. Malhi, S.S.; Lemke, R. Crop residue and N fertilizer effects on crop yield, nutrient uptake, soil quality and nitrous oxide gas emissions in a second 4-yr rotation cycle. Soil Tillage Res. 2007, 96, 269–283. [Google Scholar] [CrossRef]
  48. Van Oost, K.; Quine, T.A.; Govers, G.; De Gryze, S.; Six, J.; Harden, J.W.; Ritchie, J.C.; McCarty, G.W.; Heckrath, G.; Kosmas, C.; et al. The impact of agricultural soil erosion on the global carbon cycle. Science 2007, 5850, 626–629. [Google Scholar] [CrossRef]
  49. Riley, W.; Ortiz-Monasterio, I.; Matson, P. Nitrogen leaching and soil nitrate, nitrite, and ammonium levels under irrigated wheat in northern Mexico. Nutr. Cycl. Agroecosyst. 2001, 61, 223–236. [Google Scholar] [CrossRef]
  50. Shi, Y.; Yu, Z.; Man, J.; Ma, S.; Gao, Z.; Zhang, Y. Tillage practices affect dry matter accumulation and grain yield in winter wheat in the North China Plain. Soil Tillage Res. 2016, 160, 73–81. [Google Scholar] [CrossRef]
  51. Shuman, L.M. Effect of organic matter on the distribution of manganese, copper, iron, and zinc in soil fractions. Soil Sci. 1998, 146, 192–198. [Google Scholar] [CrossRef]
  52. Shuman, L.M. Effect of phosphorus level on extractable micronutrients and their distribution among soil fractions. Soil Sci. Soc. Am. J. 1998, 52, 136–141. [Google Scholar] [CrossRef]
  53. Abdala, D.; Kumar, A.; Riberio, I.; Hugo, V. Phosphorus saturation of a tropical soil and related P leaching caused by poultry litter addition agriculture. Agric. Ecosyst. Environ. 2012, 162, 15–23. [Google Scholar] [CrossRef]
  54. Bavaresco, L.; Poni, S. Effect of calcareous soil on photosynthesis rate, mineral nutrition and source-sink ratio of table grape. J. Plant Nutr. 2003, 26, 2123–2135. [Google Scholar] [CrossRef]
  55. Abadía, J.; Vázquez, S.; Rellán-Álvarez, R.; El-Jendoubi, H.; Alvarez-Fernández, A.; López-Millán, A.F. Towards a knowledge-based correction of iron chlorosis. Plant Physiol. Biochem. 2011, 49, 471–482. [Google Scholar] [CrossRef] [PubMed]
  56. Larchevêque, M.; Ballini, C.; Korboulewsky, N.; Montès, N. The use of compost in afforestation of Mediterranean areas: Effects on soil properties and young tree seedlings. Sci. Total Environ. 2006, 369, 220–230. [Google Scholar] [CrossRef]
  57. Kaushik, R.D.; Gupta, V.K. Effect of organic matter on different forms of manganese, iron and cobalt in soils. Ann. Arid Zone 1997, 36, 19–24. [Google Scholar]
  58. FAO. Agricultural Biodiversity. In Proceedings of the Multifuncional Character of Agriculture and Land Conference, Background Paper 1, Maastricht, The Netherlands, 12–18 September 1999. [Google Scholar]
  59. Alías, L.J.; Ortiz, R. Aridisoles del Campo de Cartagena (Murcia)-I: Camborthids: Características generales y mineralógicas. An. Edafol. Agrobiol. 1977, 26, 3–4. [Google Scholar]
Figure 1. (A) Geopolitical situation of the study area. CC-BY-SA 3.0. Accessed: 22-04-2021. (B) Overhead view of the experimental plot (yellow arrow). (C). Detail of the plot, showing the P1 (red), P2 (blue), and P3 (yellow) locations. (DF) View of the three profiles (P1, P2, and P3) before sampling. The horizons were determined using the FAO Guidelines for Soil Description (FAO, 2006) and are delimited by black lines.
Agronomy 11 02363 g001
Figure 2. Chronogram. The cycle of the different crops, fallow periods, green fertilizer and fertilizer units (N-P2O5-K2O) applied, organic amendment, irrigation, and annual precipitation during the research period.
Agronomy 11 02363 g002
Figure 3. X-ray diffractogram comparing the clay mineralogies of horizon A of the P1 and P3 profiles for the different treatments. Mg: oriented aggregate saturated in magnesium; MgEG: oriented aggregate saturated in magnesium and ethylene glycol; MgEGT: oriented aggregate saturated in magnesium, ethylene glycol and thermal treatment (550 °C).
Agronomy 11 02363 g003
Table 1. Total organic carbon (TOC), total nitrogen (TN), C/N ratio, electrical conductivity (EC), CaCO3 content, and pH (water and KCl).
HorizonProfileDepth
(cm)
TOC
(g kg−1)
TN
(g kg−1)
C/NEC
(dS m−1)
CaCO3
(g kg−1)
pHwpHKCl
Ap1P10–327.8 a1.17.1 a1.0 a346 b8.3 c7.4 b
P20–1310.4 c1.38.0 b2.3 c358 b7.9 a7.2 a
P30–209.5 b0.811.5 c1.4 b326 a8.0 b7.6 c
Ap2P213–538.6 b1.27.4 a1.6 b3627.97.2 b
P320–5010.4 c0.616.5 b1.5 b3577.87.1 a
BwP132–516.70.88.21.2 a418 b8.4 b7.3 c
P253–728.00.89.71.2 a421 b7.9 a7.2 b
P350–685.80.69.51.6 b388 a7.9 a7.0 a
Ck1P151–702.9 a0.5 a5.60.5 a478 b8.6 c7.2 c
P272–1004.7 c0.6 a8.52.3 c487 b7.8 a7.1 b
P368–923.8 b0.7 b5.51.4 b426 a8.0 b7.0 a
C2P170–922.8 b0.4 b6.6 c0.4 a341 a8.5 c7.2 a
P272–1101.0 a0.9 a1.1 a2.2 c431 c7.8 a7.2 a
P392–1252.3 b0.7 b3.2 b1.7 b412 b8.1 b7.1 c
Profile 1 (P1), profile 2 (P2), and profile 3 (P3) horizons. For each horizon, values followed by different letters differ significantly at the p < 0.01 level. Data without letters do not present statistical differences. The results represent the mean values of three measurements.
Table 2. Organic carbon capture (OCc) and inorganic carbon capture (ICc) in the different horizons, in Mg C ha−1.
HorizonP1P2P3P3-P1
OCcICcOCcICcOCcICcOCcICc
Ap38.3166.159.9173.369.8165.131.5−1.0
Bw15.9119.119.0120.013.1110.6−2.8−8.6
Ck16.9136.216.4138.811.4121.44.5−14.8
C27.7112.54.7142.29.5136.01.823.4
P1: profile 1; P2: profile 2; P3: profile 3; P3-P1: difference between the profile 1 and profile 3 values.
Table 3. Cation exchange capacity (CEC), available elements (Na, K, Mg), and phosphorus (P).
HorizonProfileDepth
(cm)
CEC
(cmol(+) kg−1)
Na
(g kg−1)
K
(g kg−1)
Mg
(g kg−1)
P
(mg kg−1)
Ap1P10–3220.7 a0.2 a0.4 b0.4 a4.8 a
P20–1321.4 b0.5 b0.5 c0.5 b13.5 b
P30–2022.5 c0.2 a0.3 a0.3 a37.2 c
Ap2P213–5324.5 b0.4 b0.4 b0.4 b10.5 b
P320–5022.5 a0.2 a0.2 a0.3 a21.7 c
BwP132–5117.3 a0.2 a0.2 b0.4 b1.1 a
P253–7219.6 b0.4 b0.3 c0.5 c3.1 b
P350–6819.0 b0.2 a0.1 a0.2 a6.9 c
Ck1P151–7014.4 b0.2 a0.1 b0.5 c1.1 a
P272–10013.3 a,b0.4 b0.2 c0.4 b3.6 b
P368–9215.1 c0.2 a0.1 a0.3 a6.2 c
C2P170–9217.7 c0.2 a0.1 b0.7 b1.1 a
P272–11010.9 a0.2 a0.2 a0.3 a6.4 c
P392–12514.1 b0.3 b0.1 b0.7 b3.8 b
Values followed by different letters differ significantly at the p < 0.01 level, for each horizon. P1: profile 1; P2: profile 2; P3: profile 3. The results represent the mean values of three measurements.
Table 4. Available microelements (Fe, Mn, Cu, Zn) in P1, P2, and P3 horizons.
HorizonProfileDepth (cm)FeMnCuZn
(mg kg−1)
Ap1P10–322.4 b4.8 b1.4 b0.5 a
P20–132.1 a8.1 c1.2 a0.6 b
P30–206.8 c9.3a2.8 c3.2 c
Ap2P213–532.6 b5.5 b1.2 a0.6 b
P320–506.2 c9.0 c2.5 c1.8 c
BwP132–512.7 a5.3 b1.2 b0.4 b
P253–727.2 b29,1 c1.0 a0.3 a
P350–688.7 c5.2 a2.4 c2.5 c
Ck1P151–702.4 b1.2 a0.5 a0.8 b
P272–1002.0 a24.0 c0.7 b0.5 a
P368–926.5 c4.1 b1.9 c1.6 c
C2P170–922.0 a0.3 a0.5 a0.3 a
P272–1102.1 b6.5 c0.6 b0.5 b
P392–1255.6 c1.9 b1.3 c0.9 c
Values followed by different letters differ significantly at the p < 0.05 level, for each horizon. P1: profile 1; P2: profile 2; P3: profile 3. The results represent the mean values of three measurements.
Publisher’s Note: MDPI stays neutral with regard to jurisdictional claims in published maps and institutional affiliations.

