
Mapping Gaps in Sugarcane by UAV RGB Imagery: The Lower and Earlier the Flight, the More Accurate

 ,
,  ,
, 
 and
and
Abstract
:
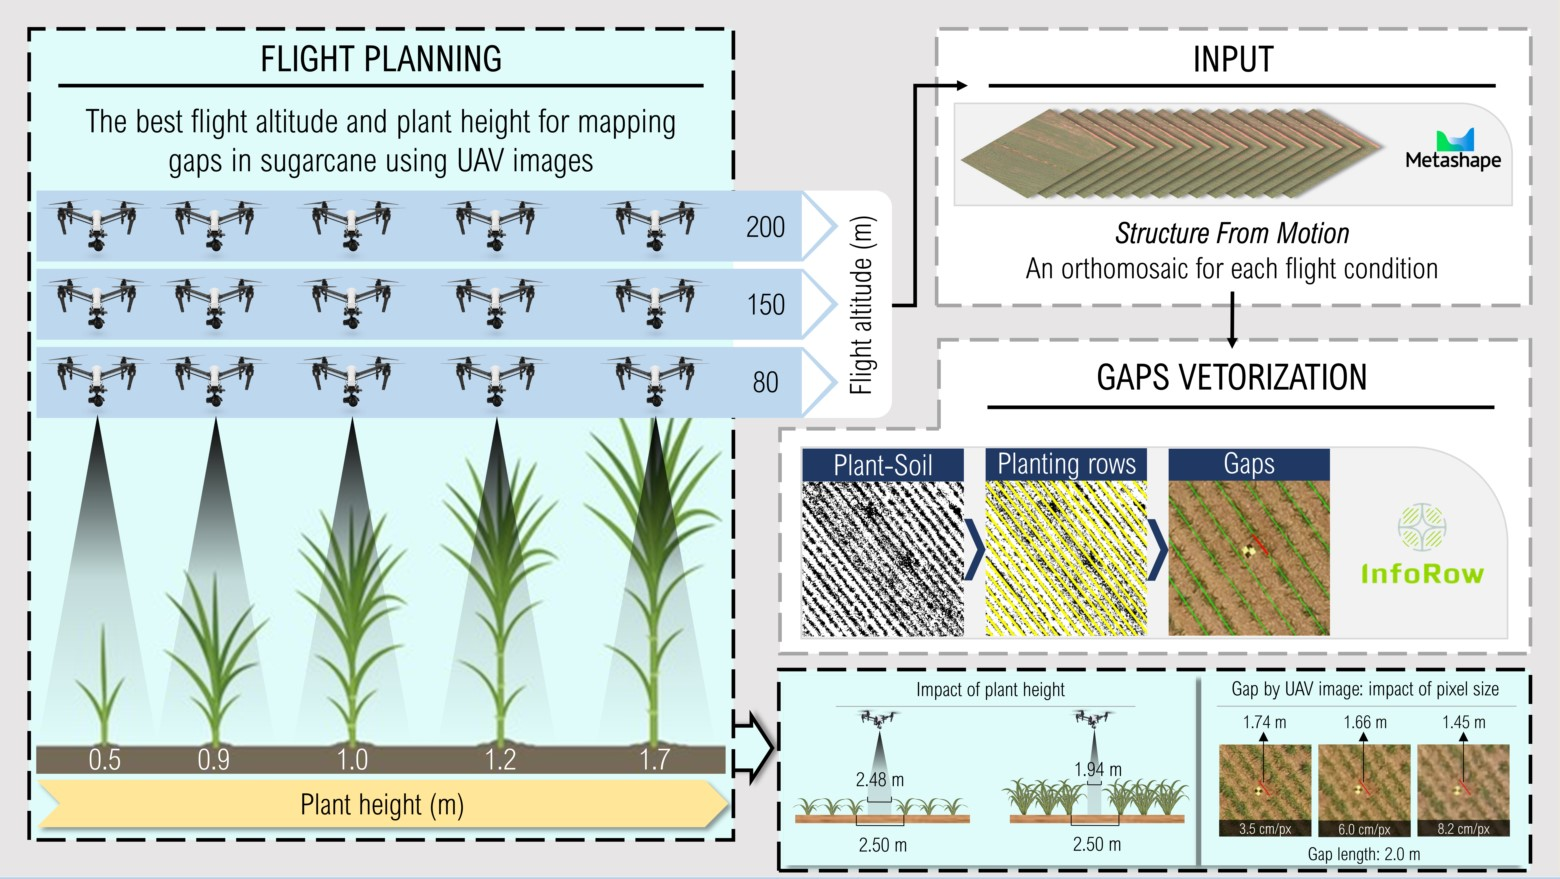
1. Introduction
2. Materials and Methods
2.1. Site
2.2. Aerial Platform and Sensor
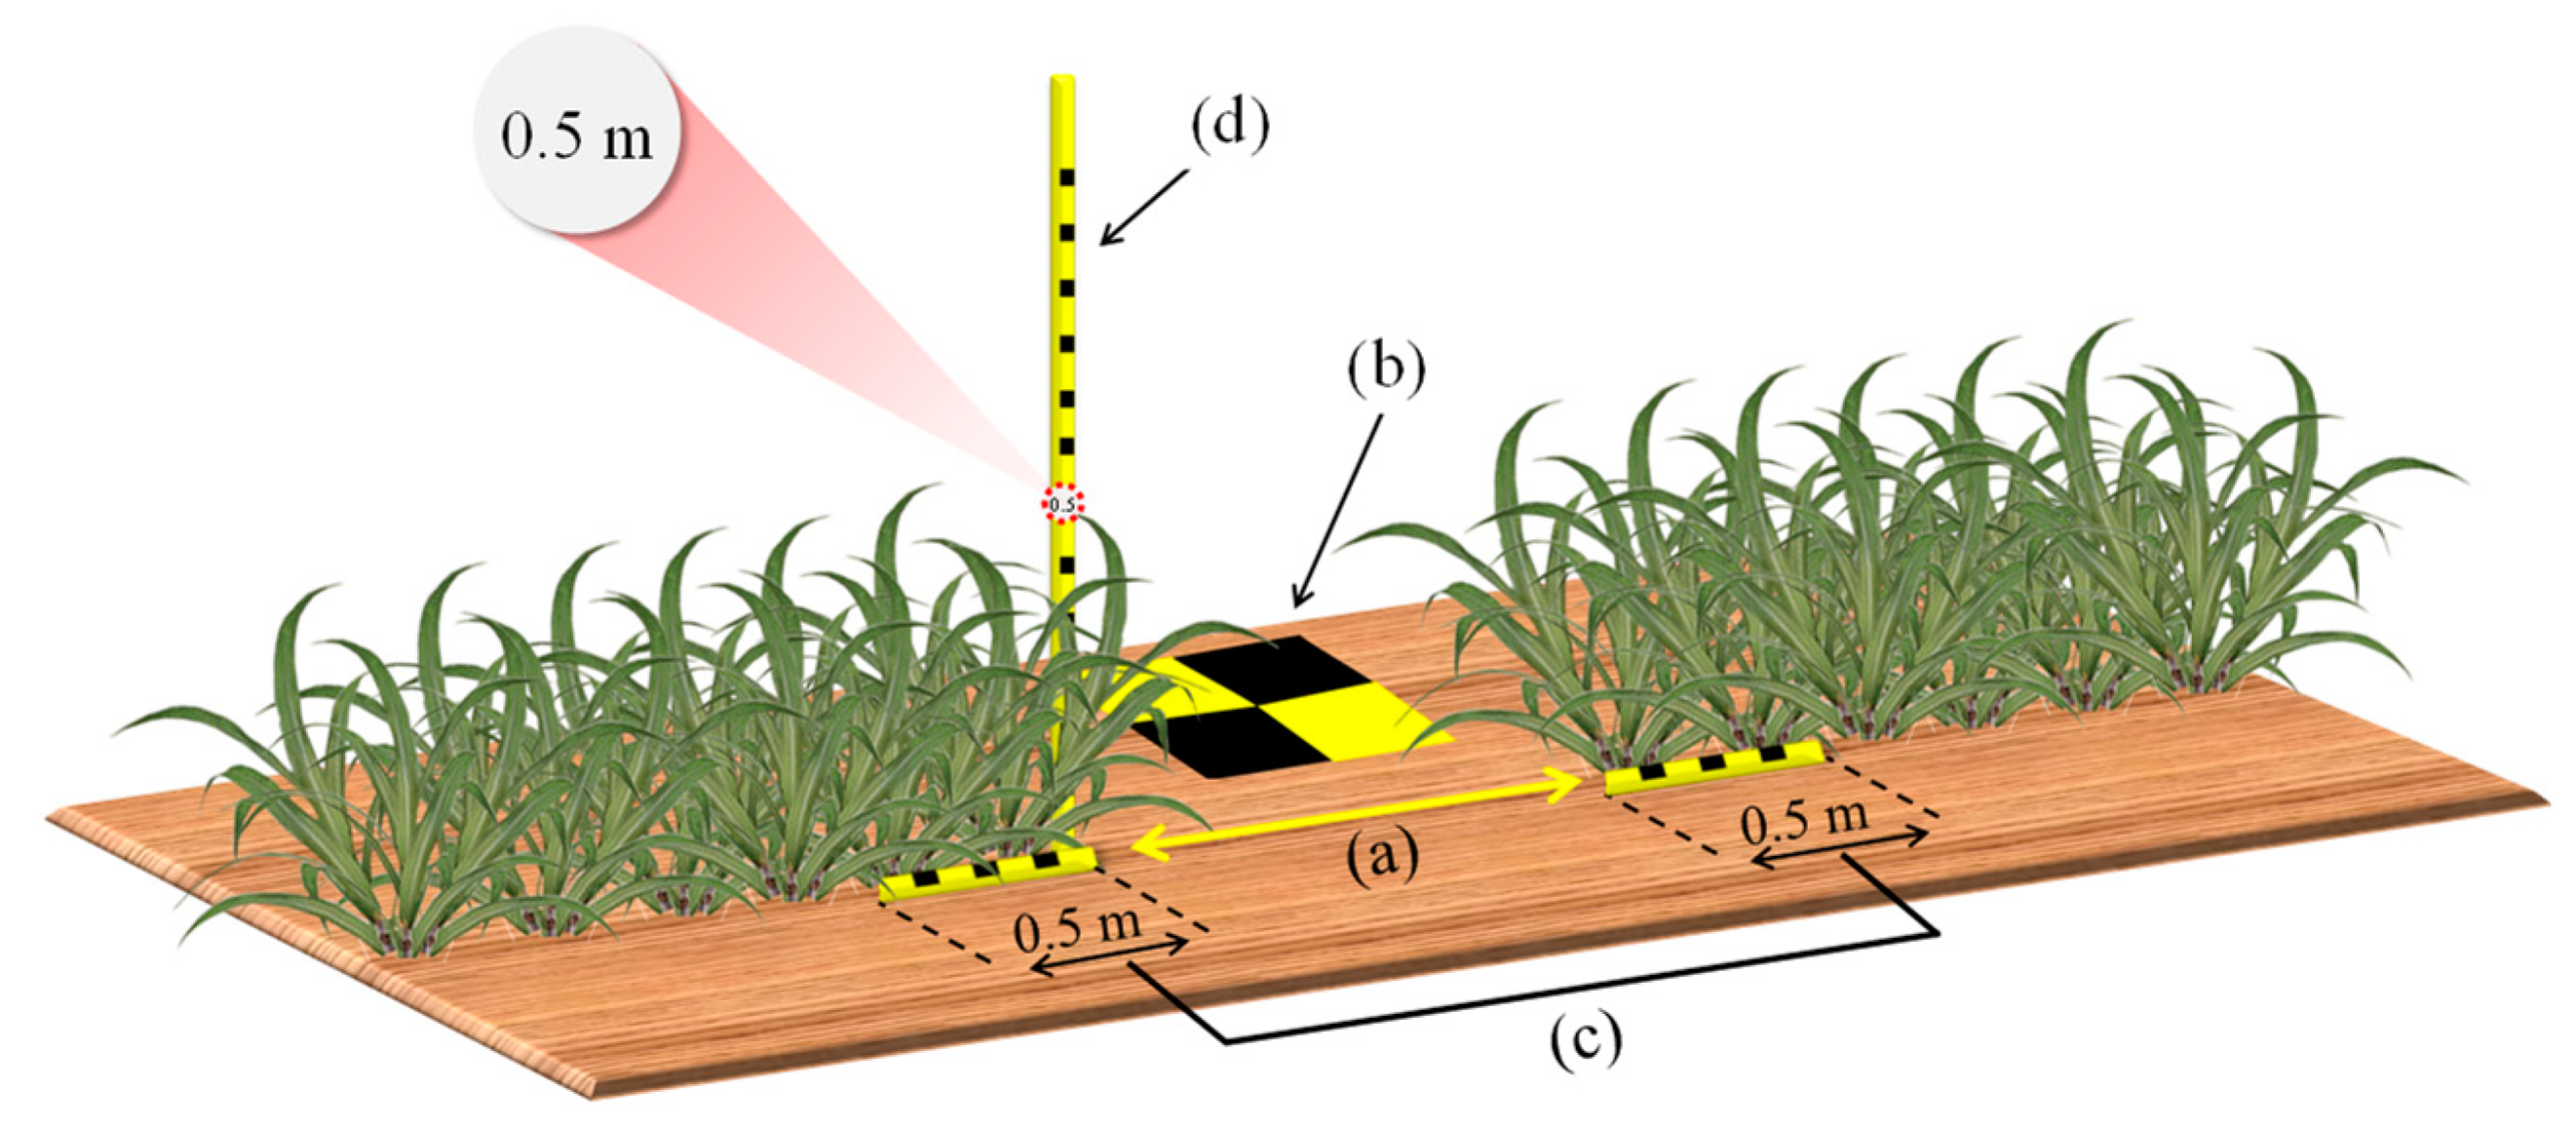
2.3. On-Field Sampling and Biometrics
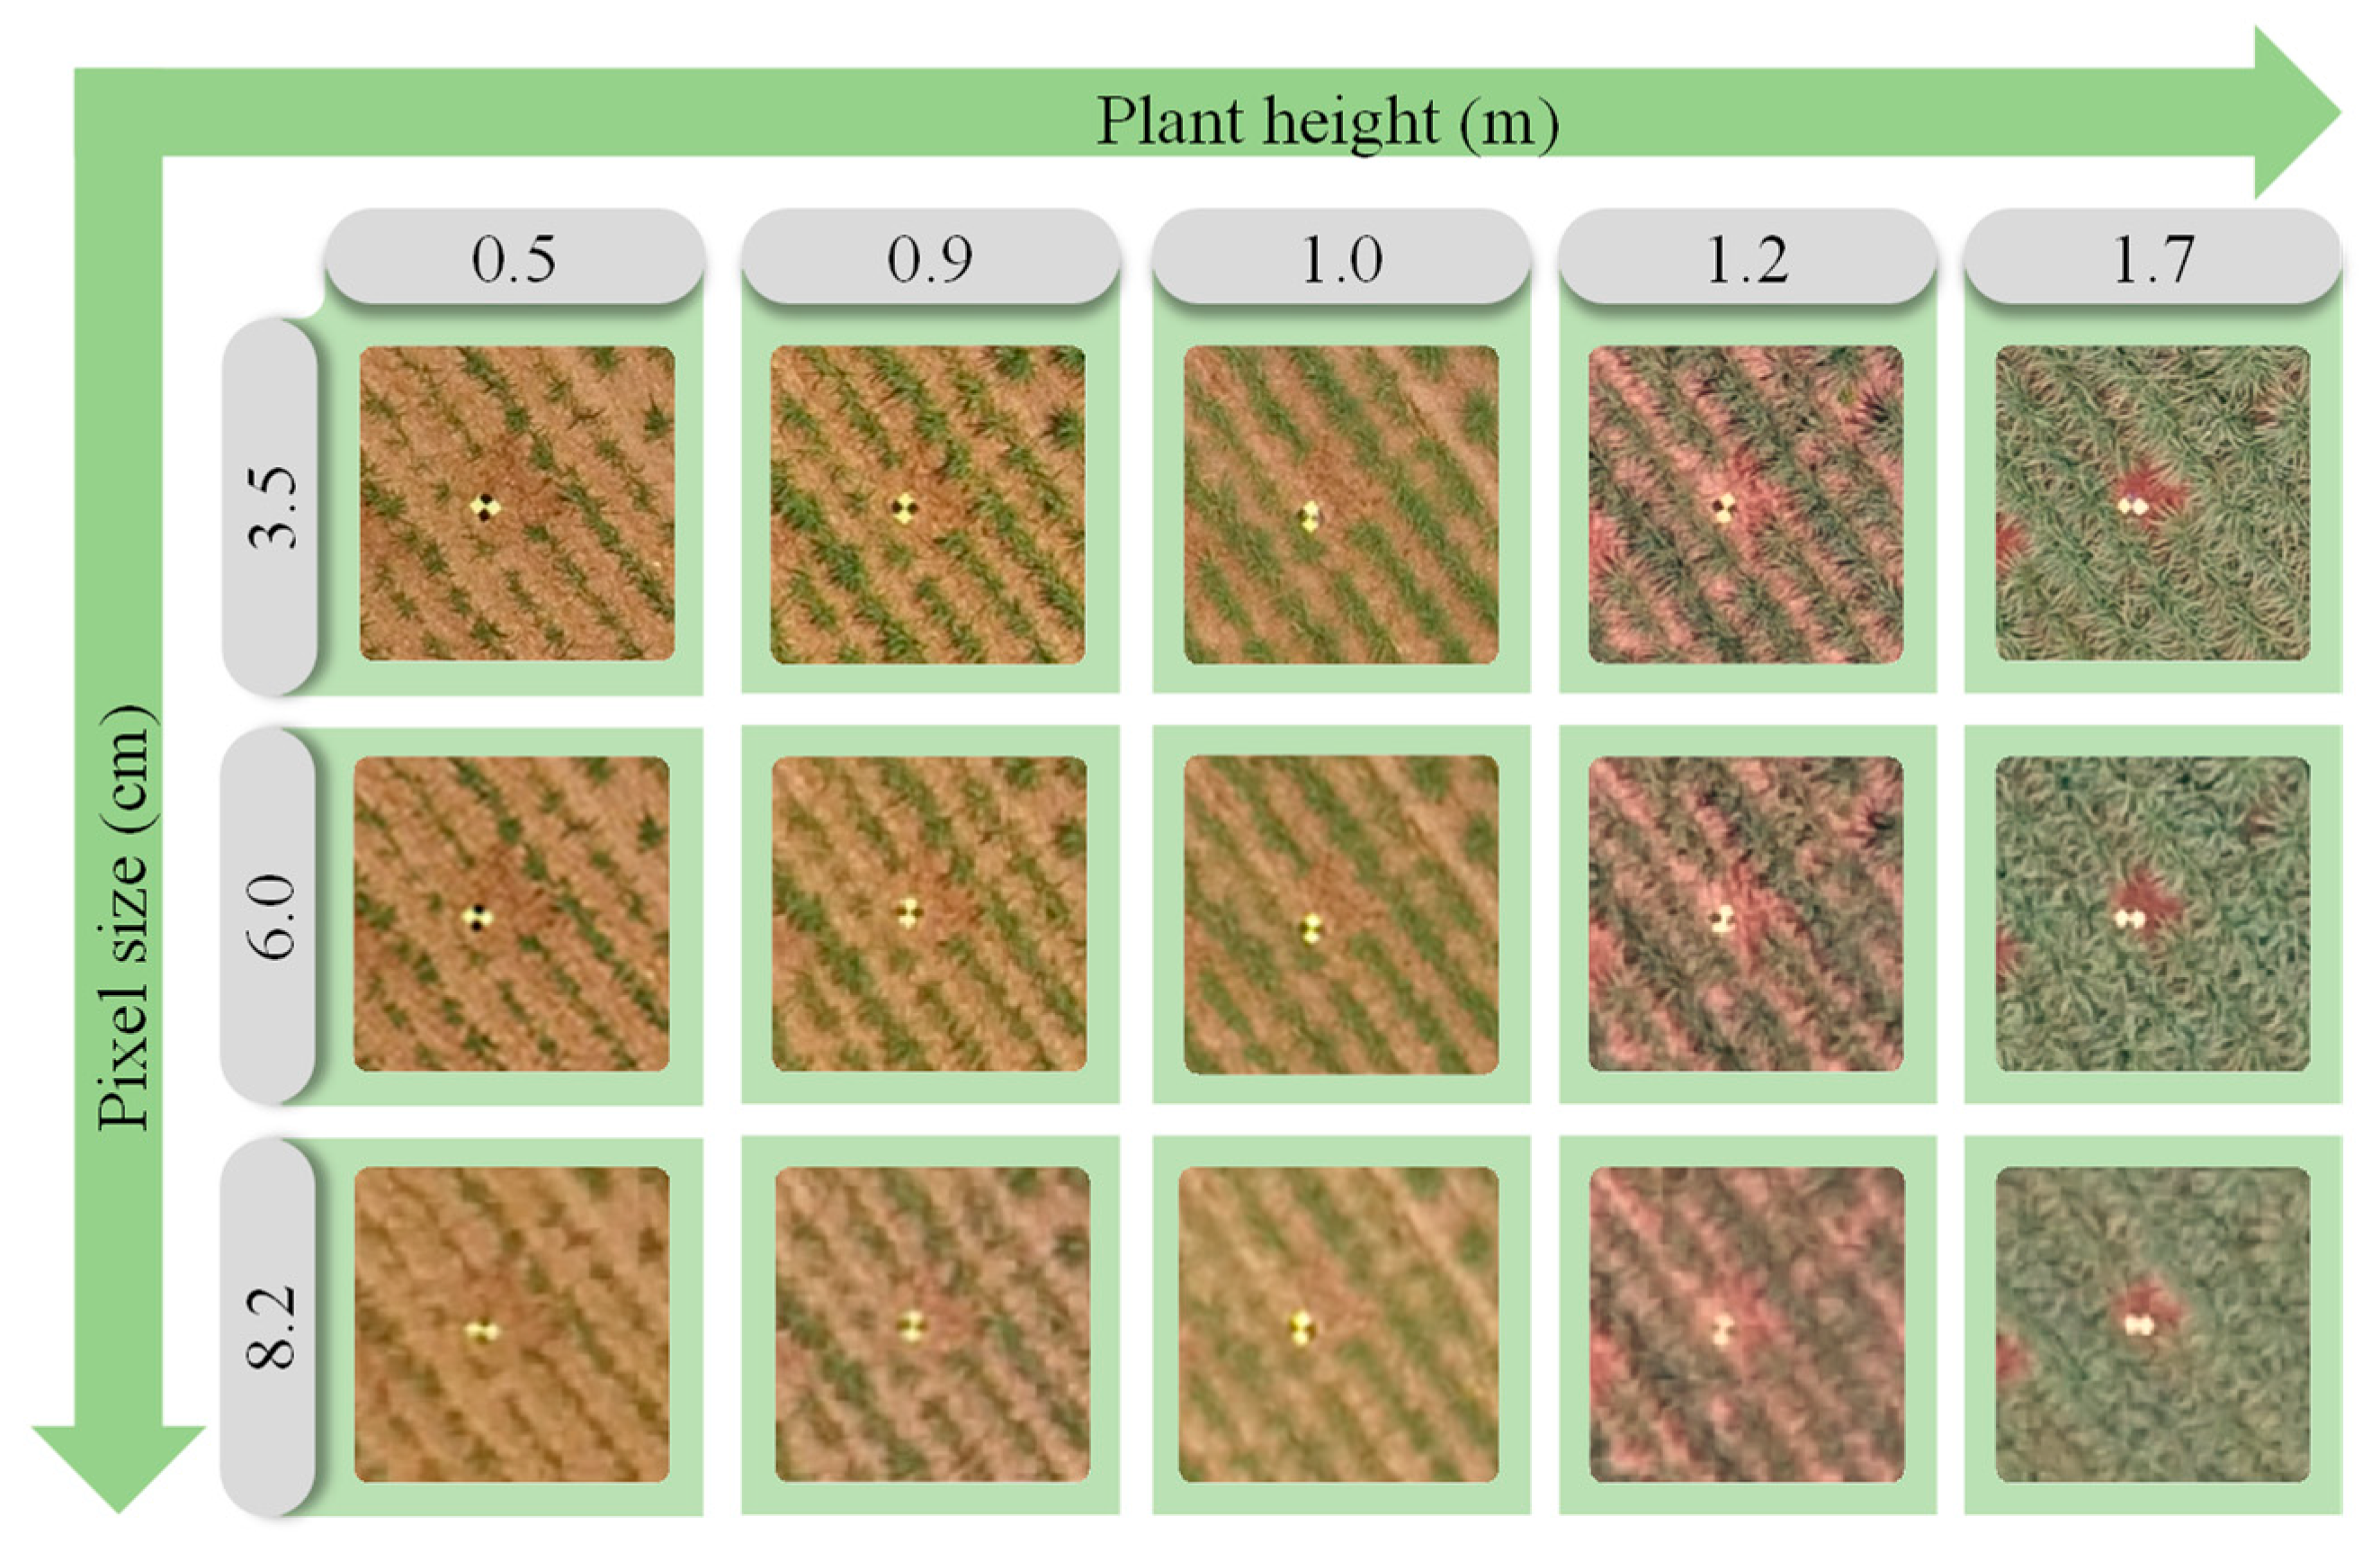
2.4. Processing of Image for Identification of Gaps
2.5. Validation of Protocol
3. Results
3.1. Crop’s Growth and Development
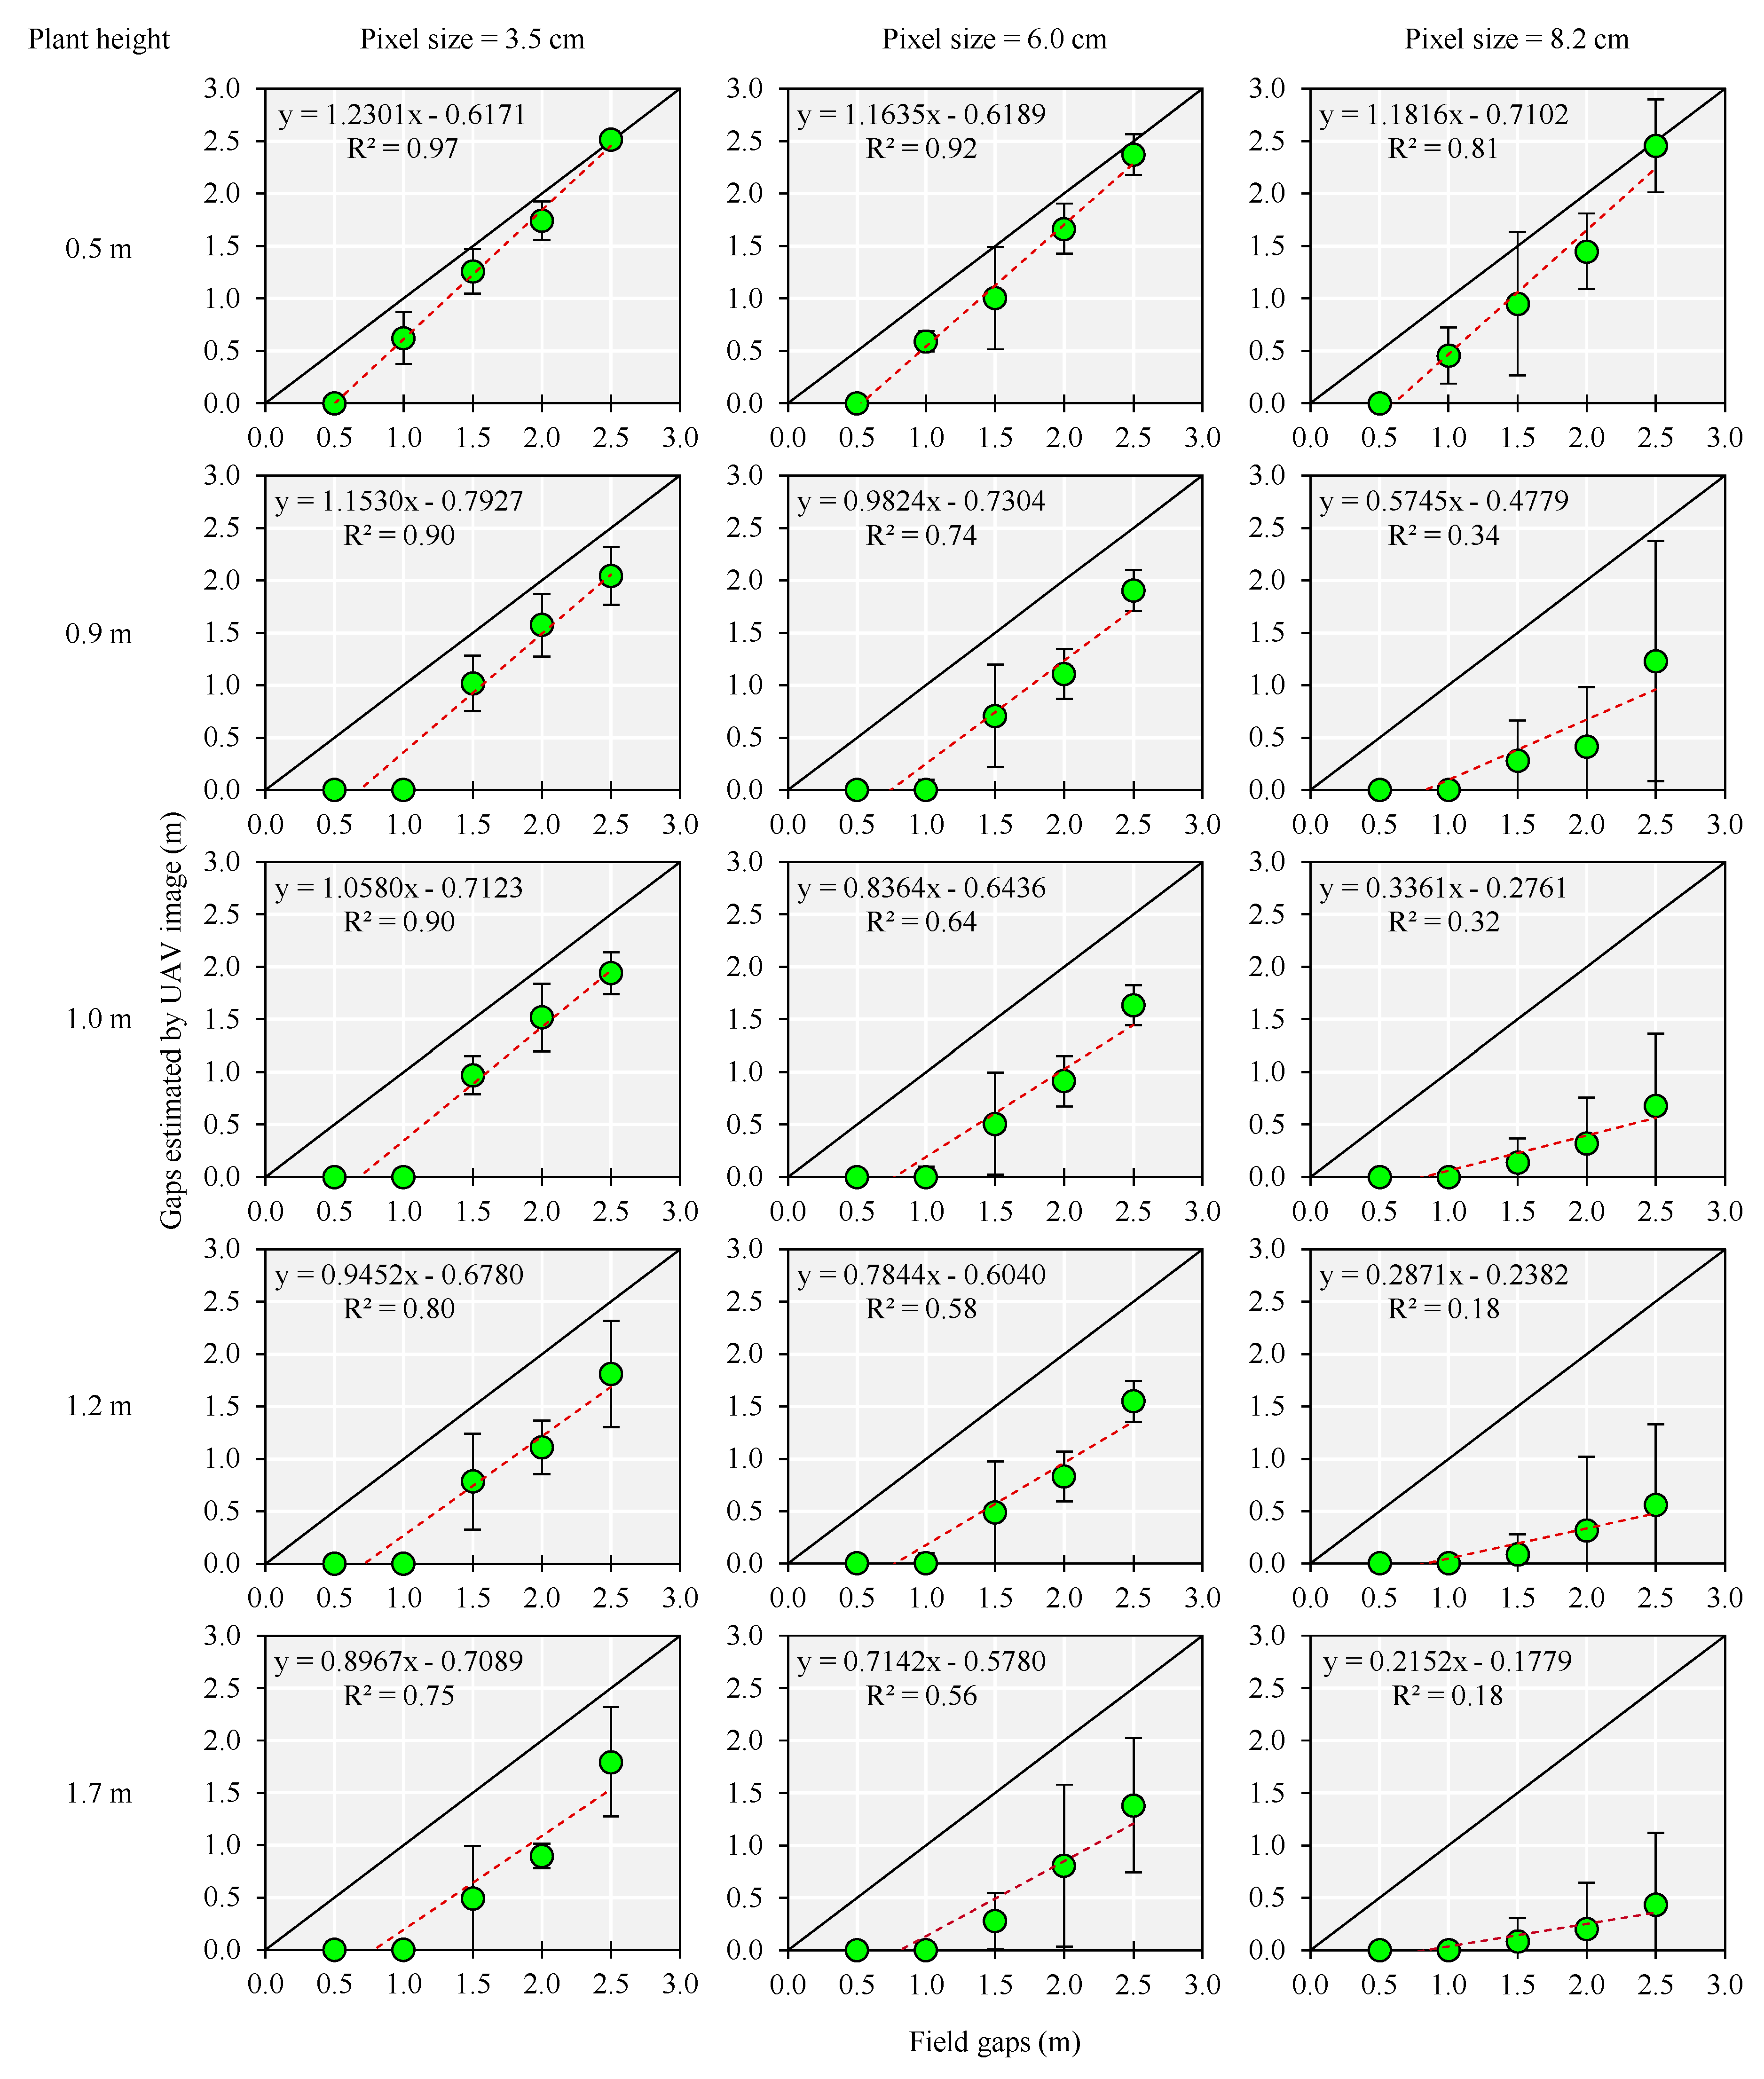
3.2. Prediction of Gaps
4. Discussion
5. Conclusions
Author Contributions
Funding
Acknowledgments
Conflicts of Interest
References
- Luna, I.; Lobo, A. Mapping Crop Planting Quality in Sugarcane from UAV Imagery: A Pilot Study in Nicaragua. Remote Sens. 2016, 8, 500. [Google Scholar] [CrossRef] [Green Version]
- Souza, C.H.W.; Lamparelli, R.A.C.; Rocha, J.V.; Magalhães, P.S.G. Mapping skips in sugarcane fields using object-based analysis of unmanned aerial vehicle (UAV) images. Comput. Electron. Agric. 2017, 143, 49–56. [Google Scholar] [CrossRef]
- Maldaner, L.F.; Molin, J.P.; Martello, M.; Tavares, T.R.; Dias, F.L.F. Identification and measurement of gaps within sugarcane rows for site-specific management: Comparing different sensor-based approaches. Biosyst. Eng. 2021, 209, 64–73. [Google Scholar] [CrossRef]
- Stolf, R. Methodology for gap evaluation on sugarcane lines. STAB 1986, 4, 12–20. [Google Scholar]
- Molin, J.P.; Veiga, J.P.S. Spatial variability of sugarcane row gaps: Measurement and mapping. Ciência Agrotecnol. 2016, 40, 347–355. [Google Scholar] [CrossRef] [Green Version]
- Amaral, L.R.; Zerbato, C.; Freitas, R.G.; Barbosa Júnior, M.R.; Simões, I.O.P.S. UAV applications in Agriculture 4.0. Rev. Cienc. Agron. 2020, 51, 1–15. [Google Scholar] [CrossRef]
- Xie, C.; Yang, C. A review on plant high-throughput phenotyping traits using UAV-based sensors. Comput. Electron. Agric. 2020, 178, 105731. [Google Scholar] [CrossRef]
- Tsouros, D.C.; Bibi, S.; Sarigiannidis, P.G. A Review on UAV-Based Applications for Precision Agriculture. Information 2019, 10, 349. [Google Scholar] [CrossRef] [Green Version]
- Yao, H.; Qin, R.; Chen, X. Unmanned Aerial Vehicle for Remote Sensing Applications—A Review. Remote Sens. 2019, 11, 1443. [Google Scholar] [CrossRef] [Green Version]
- Librán-Embid, F.; Klaus, F.; Tscharntke, T.; Grass, I. Unmanned aerial vehicles for biodiversity-friendly agricultural landscapes—A systematic review. Sci. Total Environ. 2020, 732, 139204. [Google Scholar] [CrossRef]
- Neupane, K.; Baysal-Gurel, F. Automatic Identification and Monitoring of Plant Diseases Using Unmanned Aerial Vehicles: A Review. Remote Sens. 2021, 13, 3841. [Google Scholar] [CrossRef]
- Osco, L.P.; de Arruda, M.d.S.; Gonçalves, D.N.; Dias, A.; Batistoti, J.; de Souza, M.; Gomes, F.D.G.; Ramos, A.P.M.; de Castro Jorge, L.A.; Liesenberg, V.; et al. A CNN approach to simultaneously count plants and detect plantation-rows from UAV imagery. ISPRS J. Photogramm. Remote Sens. 2021, 174, 1–17. [Google Scholar] [CrossRef]
- Bahuguna, S.; Anchal, S.; Guleria, D.; Devi, M.; Kumar, D.; Kumar, R.; Murthy, P.V.S.; Kumar, A. Unmanned Aerial Vehicle-Based Multispectral Remote Sensing for Commercially Important Aromatic Crops in India for Its Efficient Monitoring and Management. J. Indian Soc. Remote Sens. 2021, 1–11. [Google Scholar] [CrossRef]
- Valente, J.; Sari, B.; Kooistra, L.; Kramer, H.; Mücher, S. Automated crop plant counting from very high-resolution aerial imagery. Precis. Agric. 2020, 21, 1366–1384. [Google Scholar] [CrossRef]
- Guo, W.; Zheng, B.; Potgieter, A.B.; Diot, J.; Watanabe, K.; Noshita, K.; Jordan, D.R.; Wang, X.; Watson, J.; Ninomiya, S.; et al. Aerial imagery analysis—Quantifying appearance and number of sorghum heads for applications in breeding and agronomy. Front. Plant Sci. 2018, 871, 1544. [Google Scholar] [CrossRef] [PubMed] [Green Version]
- Feng, L.; Zhang, Z.; Ma, Y.; Du, Q.; Williams, P.; Drewry, J.; Luck, B. Alfalfa Yield Prediction Using UAV-Based Hyperspectral Imagery and Ensemble Learning. Remote Sens. 2020, 12, 2028. [Google Scholar] [CrossRef]
- Cholula, U.; da Silva, J.A.; Marconi, T.; Thomasson, J.A.; Solorzano, J.; Enciso, J. Forecasting yield and lignocellulosic composition of energy cane using unmanned aerial systems. Agronomy 2020, 10, 718. [Google Scholar] [CrossRef]
- Ramos, A.P.M.; Osco, L.P.; Furuya, D.E.G.; Gonçalves, W.N.; Santana, D.C.; Teodoro, L.P.R.; da Silva Junior, C.A.; Capristo-Silva, G.F.; Li, J.; Baio, F.H.R.; et al. A random forest ranking approach to predict yield in maize with uav-based vegetation spectral indices. Comput. Electron. Agric. 2020, 178, 105791. [Google Scholar] [CrossRef]
- Ge, H.; Ma, F.; Li, Z.; Du, C. Grain Yield Estimation in Rice Breeding Using Phenological Data and Vegetation Indices Derived from UAV Images. Agronomy 2021, 11, 2439. [Google Scholar] [CrossRef]
- Poblete, T.; Ortega-Farías, S.; Ryu, D. Automatic Coregistration Algorithm to Remove Canopy Shaded Pixels in UAV-Borne Thermal Images to Improve the Estimation of Crop Water Stress Index of a Drip-Irrigated Cabernet Sauvignon Vineyard. Sensors 2018, 18, 397. [Google Scholar] [CrossRef] [PubMed] [Green Version]
- de Jesús Marcial-Pablo, M.; Ontiveros-Capurata, R.E.; Jiménez-Jiménez, S.I.; Ojeda-Bustamante, W. Maize Crop Coefficient Estimation Based on Spectral Vegetation Indices and Vegetation Cover Fraction Derived from UAV-Based Multispectral Images. Agronomy 2021, 11, 668. [Google Scholar] [CrossRef]
- Mokhtari, A.; Ahmadi, A.; Daccache, A.; Drechsler, K. Actual Evapotranspiration from UAV Images: A Multi-Sensor Data Fusion Approach. Remote Sens. 2021, 13, 2315. [Google Scholar] [CrossRef]
- Santos, R.A.; Mantovani, E.C.; Filgueiras, R.; Fernandes-Filho, E.I.; Silva, A.C.B.; Venancio, L.P. Actual Evapotranspiration and Biomass of Maize from a Red–Green-Near-Infrared (RGNIR) Sensor on Board an Unmanned Aerial Vehicle (UAV). Water 2020, 12, 2359. [Google Scholar] [CrossRef]
- Alvares, C.A.; Stape, J.L.; Sentelhas, P.C.; Gonçalves, J.L.M.; Sparovek, G. Köppen’s climate classification map for Brazil. Meteorol. Z. 2013, 22, 711–728. [Google Scholar] [CrossRef]
- Rossi, M. Mapa Pedológico do Estado de São Paulo: Revisado e Ampliado; Institulo Florestal: São Paulo, Brazil, 2017; Volume 1, ISBN 9788564808164.
- Hu, P.; Guo, W.; Chapman, S.C.; Guo, Y.; Zheng, B. Pixel size of aerial imagery constrains the applications of unmanned aerial vehicle in crop breeding. ISPRS J. Photogramm. Remote Sens. 2019, 154, 1–9. [Google Scholar] [CrossRef]
- Yan, G.; Li, L.; Coy, A.; Mu, X.; Chen, S.; Xie, D.; Zhang, W.; Shen, Q.; Zhou, H. Improving the estimation of fractional vegetation cover from UAV RGB imagery by colour unmixing. ISPRS J. Photogramm. Remote Sens. 2019, 158, 23–34. [Google Scholar] [CrossRef]
- Zhang, D.; Mansaray, L.R.; Jin, H.; Sun, H.; Kuang, Z.; Huang, J. A universal estimation model of fractional vegetation cover for different crops based on time series digital photographs. Comput. Electron. Agric. 2018, 151, 93–103. [Google Scholar] [CrossRef]
- Ranđelović, P.; Đorđević, V.; Milić, S.; Balešević-Tubić, S.; Petrović, K.; Miladinović, J.; Đukić, V. Prediction of Soybean Plant Density Using a Machine Learning Model and Vegetation Indices Extracted from RGB Images Taken with a UAV. Agronomy 2020, 10, 1108. [Google Scholar] [CrossRef]
- Xu, J.X.; Ma, J.; Tang, Y.N.; Wu, W.X.; Shao, J.H.; Wu, W.B.; Wei, S.Y.; Liu, Y.F.; Wang, Y.C.; Guo, H.Q. Estimation of sugarcane yield using a machine learning approach based on uav-lidar data. Remote Sens. 2020, 12, 2823. [Google Scholar] [CrossRef]


| Pixel Size (cm) | Plant Height (m) | Gap Length (m) | |||||
|---|---|---|---|---|---|---|---|
| 0.5 | 1.0 | 1.5 | 2.0 | 2.5 | Total | ||
| 3.5 | 0.5 | 0.5 | 0.38 | 0.24 | 0.26 | 0.02 | 1.44 |
| 0.9 | 0.5 | 1.00 | 0.48 | 0.43 | 0.46 | 2.87 | |
| 1.0 | 0.5 | 1.00 | 0.53 | 0.48 | 0.56 | 3.07 | |
| 1.2 | 0.5 | 1.00 | 0.72 | 0.89 | 0.69 | 3.80 | |
| 1.7 | 0.5 | 1.00 | 1.01 | 1.10 | 0.71 | 4.32 | |
| 6.0 | 0.5 | 0.5 | 0.41 | 0.50 | 0.33 | 0.13 | 1.89 |
| 0.9 | 0.5 | 1.00 | 0.79 | 0.89 | 0.60 | 3.78 | |
| 1.0 | 0.5 | 1.00 | 0.99 | 1.09 | 0.87 | 4.45 | |
| 1.2 | 0.5 | 1.00 | 1.01 | 1.17 | 0.95 | 4.64 | |
| 1.7 | 0.5 | 1.00 | 1.22 | 1.19 | 1.12 | 5.03 | |
| 8.2 | 0.5 | 0.5 | 0.55 | 0.55 | 0.55 | 0.04 | 2.49 |
| 0.9 | 0.5 | 1.00 | 1.22 | 1.59 | 1.27 | 5.58 | |
| 1.0 | 0.5 | 1.00 | 1.36 | 1.68 | 1.82 | 6.36 | |
| 1.2 | 0.5 | 1.00 | 1.41 | 1.68 | 1.94 | 6.54 | |
| 1.7 | 0.5 | 1.00 | 1.41 | 1.80 | 2.06 | 6.77 | |
Publisher’s Note: MDPI stays neutral with regard to jurisdictional claims in published maps and institutional affiliations. |
© 2021 by the authors. Licensee MDPI, Basel, Switzerland. This article is an open access article distributed under the terms and conditions of the Creative Commons Attribution (CC BY) license (https://creativecommons.org/licenses/by/4.0/).
Share and Cite
Barbosa Júnior, M.R.; Tedesco, D.; Corrêa, R.d.G.; Moreira, B.R.d.A.; Silva, R.P.d.; Zerbato, C. Mapping Gaps in Sugarcane by UAV RGB Imagery: The Lower and Earlier the Flight, the More Accurate. Agronomy 2021, 11, 2578. https://0-doi-org.brum.beds.ac.uk/10.3390/agronomy11122578
Barbosa Júnior MR, Tedesco D, Corrêa RdG, Moreira BRdA, Silva RPd, Zerbato C. Mapping Gaps in Sugarcane by UAV RGB Imagery: The Lower and Earlier the Flight, the More Accurate. Agronomy. 2021; 11(12):2578. https://0-doi-org.brum.beds.ac.uk/10.3390/agronomy11122578
Chicago/Turabian StyleBarbosa Júnior, Marcelo Rodrigues, Danilo Tedesco, Rafael de Graaf Corrêa, Bruno Rafael de Almeida Moreira, Rouverson Pereira da Silva, and Cristiano Zerbato. 2021. "Mapping Gaps in Sugarcane by UAV RGB Imagery: The Lower and Earlier the Flight, the More Accurate" Agronomy 11, no. 12: 2578. https://0-doi-org.brum.beds.ac.uk/10.3390/agronomy11122578