
Cloning and Functional Analysis of the Soybean GmRIQ2 Promoter
by
 and
and
Binbin Zhang
1, 
Huayi Yin
1,
Zhihui Sun
1,
Xiaohui Song
1,
Jing Deng
1,
Qian Zhang
2,* and
Dongmei Li
1,* 1
Key Laboratory of Soybean Biology in Chinese Education Ministry (Northeastern Key Laboratory of Soybean Biology and Genetics & Breeding in Chinese Ministry of Agriculture), Northeast Agricultural University, Harbin 150030, China
2
Key Laboratory of Germplasm Enhancement and Physiology and Ecology of Food Crops in Cold Region, Ministry of Education, Northeast Agricultural University, Harbin 150030, China
*
Authors to whom correspondence should be addressed.
Agronomy 2022, 12(1), 227; https://0-doi-org.brum.beds.ac.uk/10.3390/agronomy12010227
Submission received: 16 November 2021
/
Revised: 20 December 2021
/
Accepted: 24 December 2021
/
Published: 17 January 2022
(This article belongs to the Special Issue Horticultural Genetics and Biotechnology)
Abstract
:The RIQ gene can optimize the structure of light-harvesting complex II by regulating the degree of granum stacking, and ultimately participates in plant light stress responses. The GmRIQ2 gene contributes to plant photoprotection and may be involved in negative regulation of yield. To understand the regulatory mechanisms of GmRIQ2 expression, we isolated the GmRIQ2 promoter (PGmRIQ2) from the KenFeng 16 soybean genome. Sequence analysis showed that several cis-acting elements were involved in hormone responsiveness, seed-specific regulation, anaerobic induction and light responsiveness. PGmRIQ2 was expressed in soybean roots. GUS activity was detected in Arabidopsis thaliana rosette leaves, stems and roots, indicating that PGmRIQ2 tended to drive expression in rosette leaf vascular tissue and had spatiotemporal expression characteristics at the early growth stage. Three promoter deletion fragments of 450 bp, 284 bp and 194 bp were obtained by 5′ deletion. These three fragments all drove GUS gene expression in Arabidopsis thaliana rosette leaves, stems and roots. GUS gene expression decreased with deletion fragment truncation. In addition, the PGmRIQ2 auxin (IAA), abscisic acid (ABA) and methyl jasmonate (MeJA) response elements were located at base pairs −1661~−450, −450~−284 and −284~−194, respectively, and the promoter was induced by IAA, ABA, MeJA and light.
1. Introduction
Regulation at the transcriptional level is the most critical link between the complex expression and multi-stage regulation of genes [1]. Promoters are contributors to transcriptional regulation and have several important characteristic sequences [2]. These sequences interact with transcription factors or the external environment to ensure accurate gene transcription and expression [2,3,4]. In addition, promoters indirectly control the initiation and degree of transcription, participating in the internal mechanism of functional gene expression regulation [5]. In plant genetic engineering, promoters are often used to regulate the expression of foreign genes in order to improve crop quality, increase crop yield, and enhance crop adaptability under adverse conditions [6]. Constitutive promoters have a wide range of applications in plant genetic engineering due to their highly efficient expression throughout the growth period in plants [7,8,9]. However, there are problems with the use constitutive promoters, such as metabolite accumulation and energy waste caused by excessive consumption, and the occurrence of gene silencing [10,11,12]. Therefore, researchers have focused on inducible promoters and tissue-specific promoters, hoping that they can replace constitutive promoters as regulators [3]. The former regulate the expression of foreign genes only in the presence of inducing conditions or factors and can be purposefully regulated according to desired outcomes [13,14]. The use of the latter can effectively alleviate unnecessary waste caused by overexpression because expression occurs only during a specific period or in a specific location [14,15,16].
Soybeans are rich in high-quality protein and fat. They are mainly used in the food and industrial material industries [17]. However, soybean plants are often exposed to a complex and changeable environment during the growth process, which affects normal growth and development and, in severe cases, leads to reduced production [18,19]. The existing research on soybean yield and stress resistance has revealed good prospects for development through soybean breeding [20]. The results of this kind of research can enable not only mitigation of the damage to crops caused by environmental changes but also cultivation of high-quality and high-yielding soybean varieties. In this regard, promoter function analyses are beneficial for mastering the regulatory mechanism of gene expression and can provide new efficient and convenient methods for plant genetic engineering through breeding, especially for soybean.
RIQ is a gene discovered in 2016 that protects the normal growth and development of plants by quenching excess light energy, which may be negatively correlated with yield [4,21,22,23]. In our previous research, GmRIQ2 (accession NO.: Glyma.04G174400) could enhance the tolerance of strong light stress and reduces photoinhibition in soybean [23]. However, there are few studies on the function or gene structure of the RIQ gene. In view of this scarcity, this study was performed to provide new ideas for exploration of the regulatory mechanism of the RIQ2 gene via analysis of the function of the promoter of the RIQ2 gene. Thus, the objectives of this study were to (1) verify the functions PGmRIQ2 (GmRIQ2 promoter) and determine the gulatory abilities of promoter of different deletion fragments, and (2) clarify the regulatory effects of different hormones on PGmRIQ2. This could provide a theoretical reference for research on the molecular function and mechanism of the GmRIQ2 gene and encourage further in-depth exploration of the regulatory network of its internal functional elements.
2. Materials and Methods
2.1. Plant Materials and Growth Conditions
The soybean cultivars KenFeng 16 (KF16) and DongNong 50 (DN50) were used as plant materials and were provided by the Soybean Research Institute of Northeast Agricultural University (Harbin, China). In a previous study, the RIQ2 gene was cloned from KF16, which is a main cultivar in Heilongjiang province, and the transformation efficiency of DN50 was higher than other cultivars; thus, these two cultivars were used as plant materials in this study. The soybean plants were grown in black soil: Vermiculite (1:1, both were purchased locally) under a photoperiod of 16/8 h light/dark at 23 °C in a greenhouse. At the same time, Columbia wild-type (WT) Arabidopsis thaliana seeds were raised on Murashige-Skoog Basal Salt Mixture medium supplemented with 4.43 g/L MS (Phyto Technology Laboratory, Shawnee Mission, KS, USA), 30 g/L sucrose and 8 g/L agar, adjusted to pH 5.8. The seedlings of Arabidopsis thaliana were grown in black soil: vermiculite (1:1) under a photoperiod of 16/8 h light/dark at 23 °C in a light incubator and were used for subsequent genetic transformation experiments.
2.2. Promoter Cloning and Sequence Analysis
An online tool of the Berkeley Drosophila Genome Project (BDGP) [24] was used to predict the transcription start site and core segment in the GmRIQ2 gene promoter sequence, and the regulatory sequence of the GmRIQ2 gene promoter was deduced with the online analysis website PlantCARE.
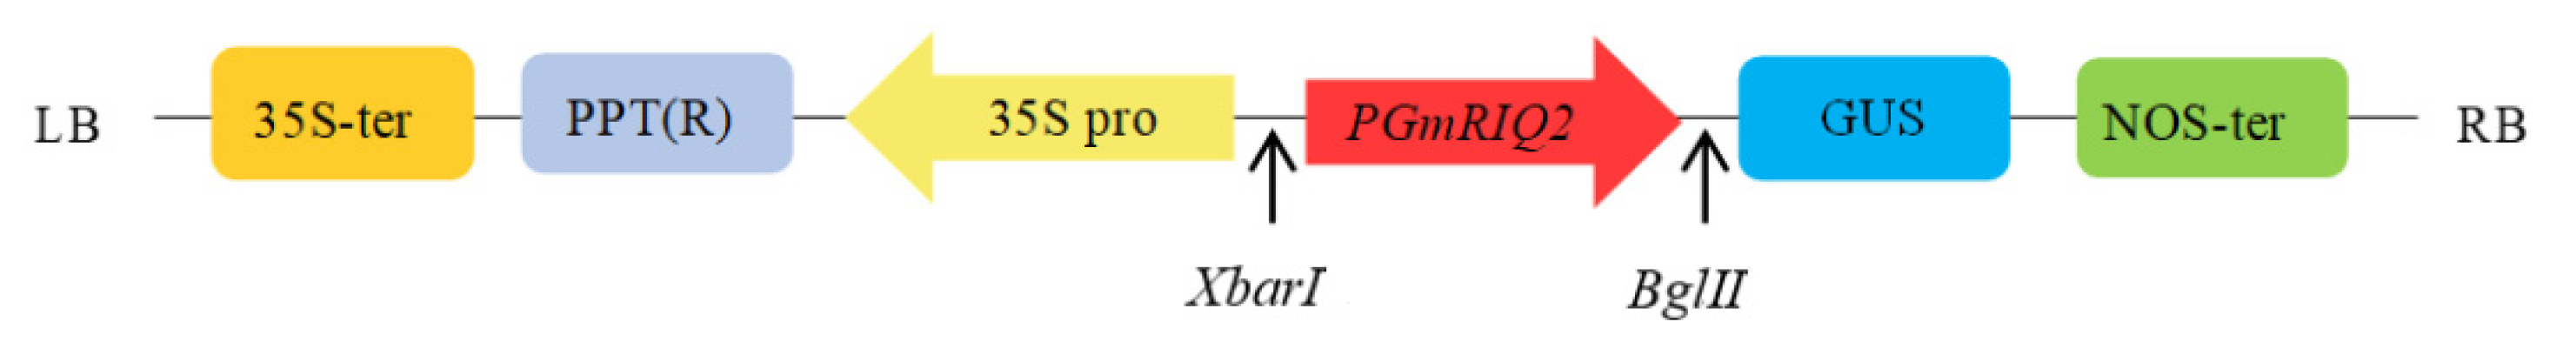
Polymerase chain reaction (PCR) was carried out using the primer pairs PGmRIQ2-1661-F and PGmRIQ2-1661-R (shown in Table 1) using PrimeSTAR Max with soybean KF16 genomic DNA as a template. The cycling conditions were as follows: 94 °C for 5 min; 35 cycles of 94 °C for 15 s, 55 °C for 15 s, and 72 °C for 90 s; and 72 °C for 10 min. Based on the site distribution of the pCAMBIA3301 vector, DNAMAN software (version 6.0, Lynnon Biosoft Co., San Ramon, CA, USA) was used to analyze the restriction enzyme cleavage sites within the promoter sequence of the GmRIQ2 gene. Finally, the XbarI and BglII restriction enzyme cleavage sites were selected. The PCR amplification product was purified, recovered and cloned into the pGM-T vector, and the positive ampicillin (Amp)-resistant clones were selected on LB plates containing Amp and sequenced. The full-length sequence of the promoter was named PGmRIQ2.
2.3. Construction and Transformation of a Promoter Expression Vector
PGmRIQ2 was used to replace the CaMV35S promoter in the plant expression vector pCAMBIA3301. PGmRIQ2 was connected to the β-glucuronidase (GUS) gene to form the pCAMBIA3301GmRIQ2::GUS plant expression vector. The vector construction is shown in Figure 1. The recombinant vector was transformed into E. coli, and the positive clones were identified by sequencing and stored. Then, the recombinant plasmids with the correct sequences were introduced into Agrobacterium tumefaciens strain EHA105 and Agrobacterium rhizogenic strain K599. To evaluate promoter activity and transformation efficiency, the expression of the reporter gene GUS gene was studied.
2.4. Construction and Transformation of the Expression Vector for Promoter Deletion Fragments
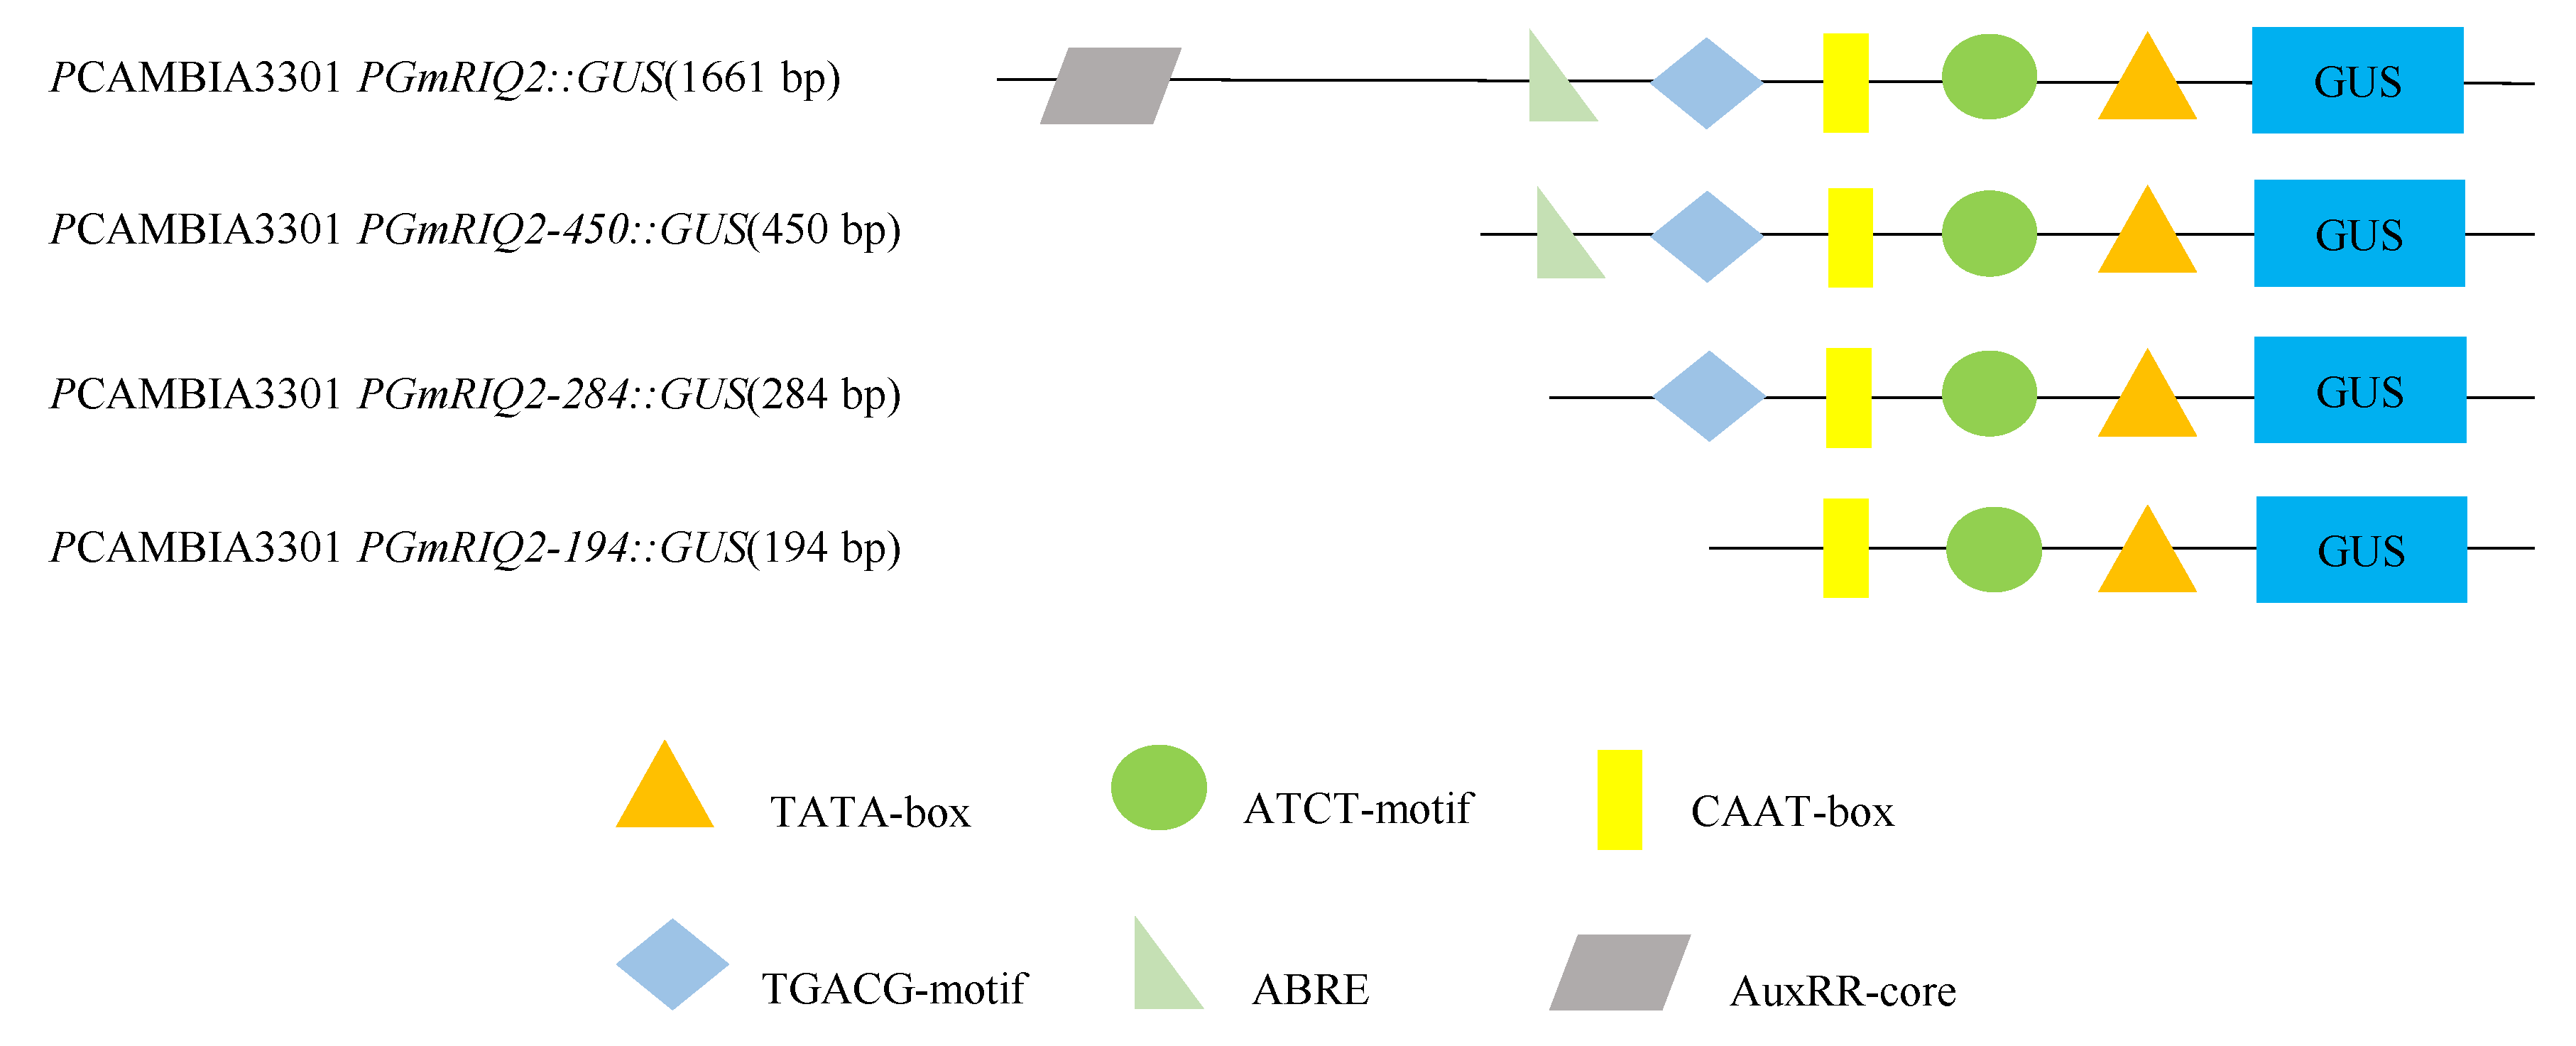
Based on the results of bioinformatics analysis of PGmRIQ2 and 5′ end deletion analysis, a series of deletion fragments of PGmRIQ2 were generated. Three deletion promoter fragments were ultimately constructed. The fragments amplified by PCR with the primer pairs PGmRIQ2-450-F/PGmRIQ2-450-R, PGmRIQ2-284-F/PGmRIQ2-284-R, and PGmRIQ2-194-F/PGmRIQ2-194-R (shown in Table 1) and the recombinant plasmid pCAMBIA3301PGmRIQ2::GUS as a template were named PGmRIQ2-450 (450 bp), PGmRIQ2-284 (284 bp) and PGmRIQ2-194 (194 bp), respectively.
Similarly, the recombinant plasmids were introduced into Agrobacterium tumefaciens strain EHA105 after the amplified fragment was cloned into the plasmid pCAMBIA3301 and determined to have the correct sequenced (Figure 2).
2.5. Cultivation and Identification of Transgenic Plants
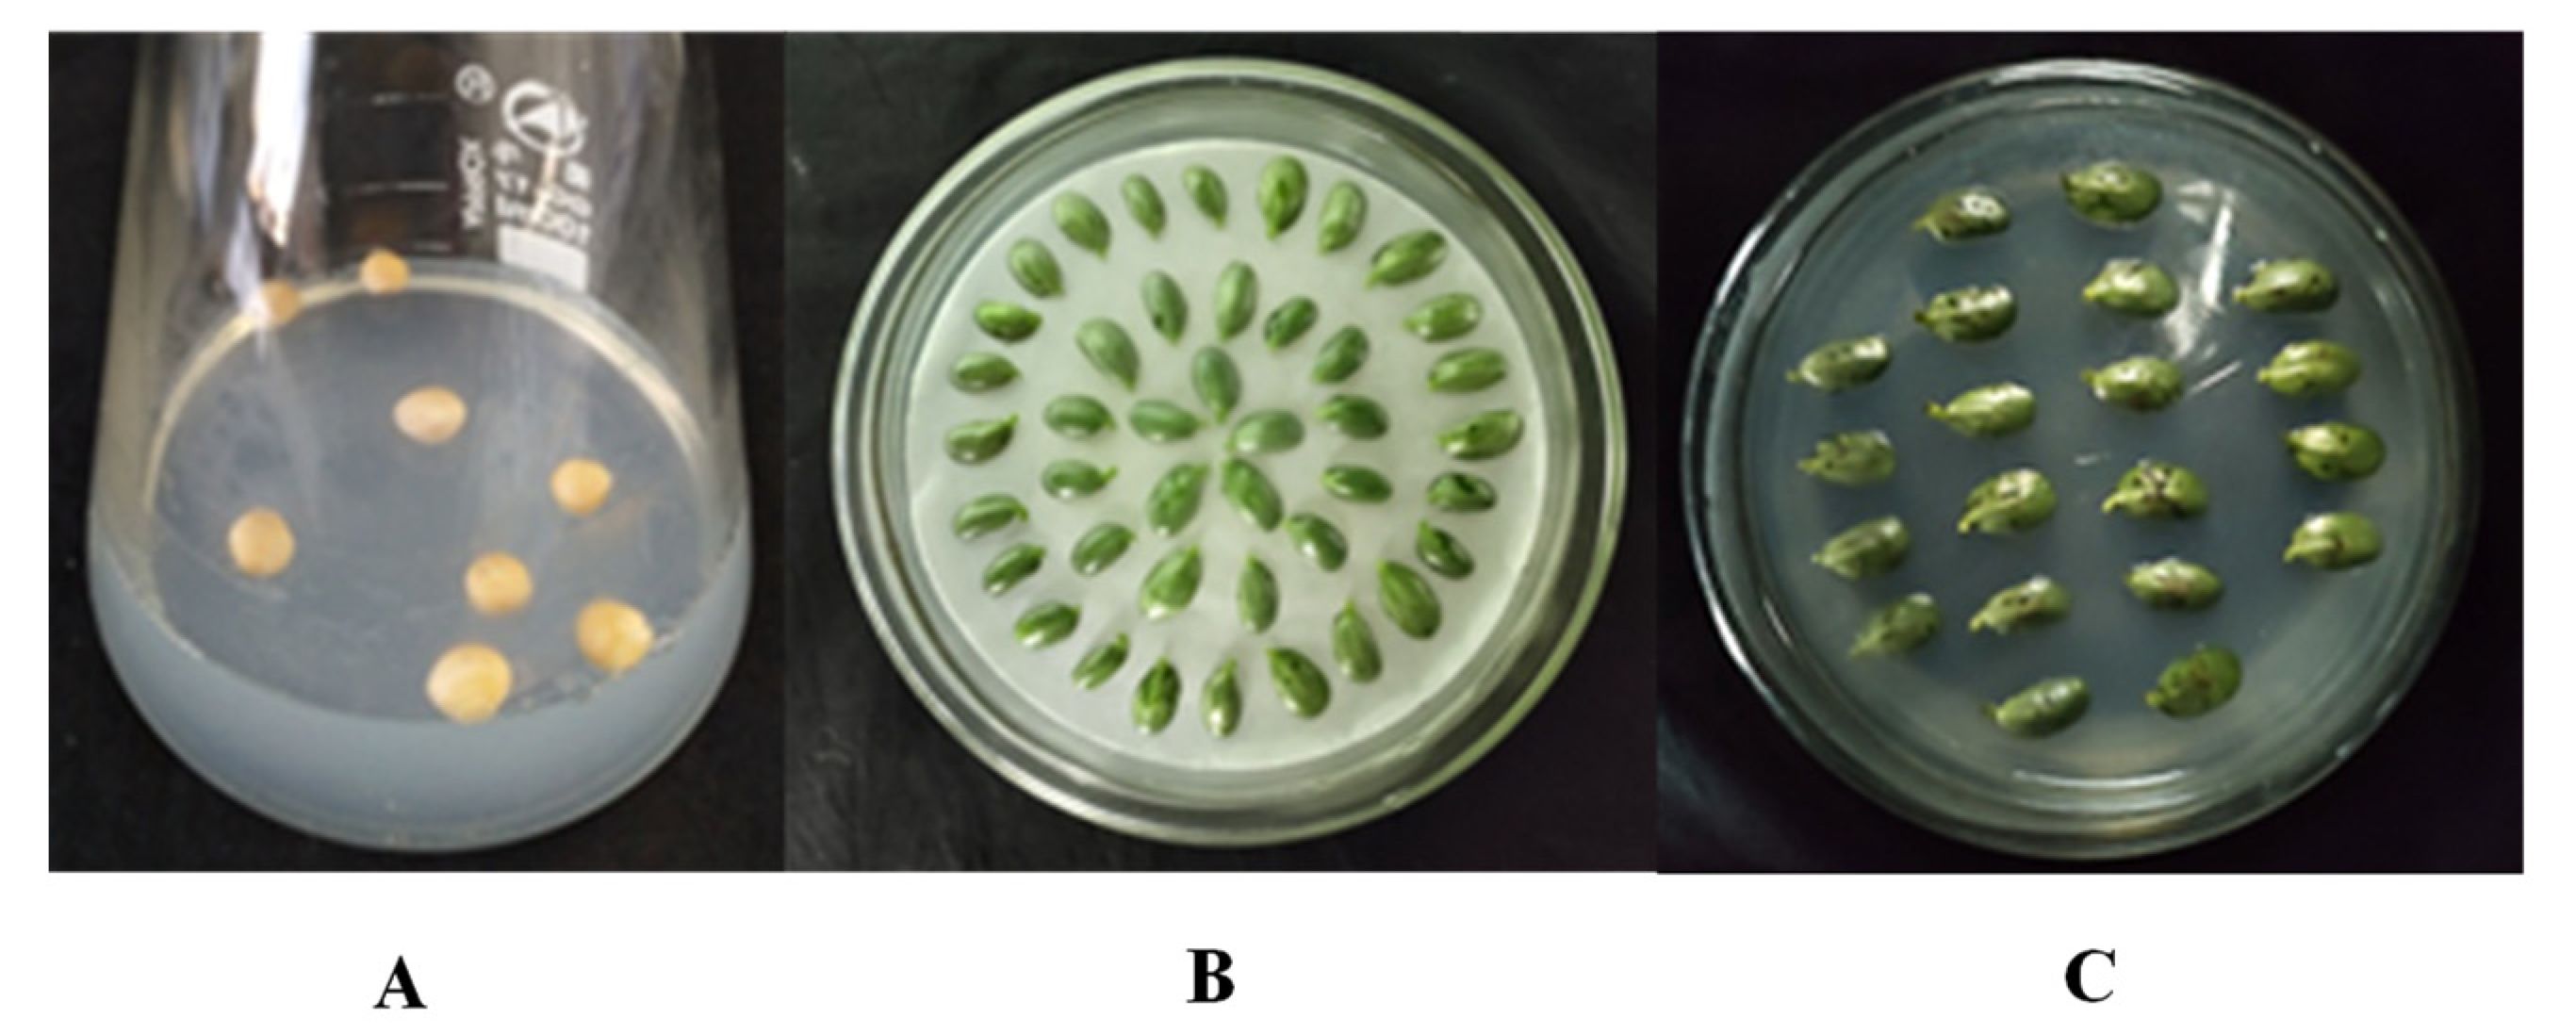
To obtain hairy roots, Agrobacterium rhizogene was used to infect soybean cotyledon nodes. The completely and healthy soybean seeds (DN50) were selected and disinfected with 10% sodium hypochlorite (NaClO) solution for 15 h, and then rinsed with sterile water 3 times. The seeds were sown in germination medium (GM) (Table 2 and Figure 3), and cultured under light for 5–7 days. The soybean cotyledonary nodes were scratched on a sterile operating table and infected with Agrobacterium rhizogenes K599 for 30 min. After that, the soybean cotyledon nodes were washed with sterile water 3–5 times, and the surfaces were wiped dry. The nodes were placed on solid co-culture medium (SCCM), cultured in the dark for 3 days, transferred to hairy root induction medium (RM), and cultured under light until hairy roots grew. DNA was extracted from the soybean roots by the cetyltrimethylammonium bromide (CTAB) method [25], and the primer pairs (PGmRIQ2-1661-F and PGmRIQ2-1661-R, PGmRIQ2-450-F and PGmRIQ2-450-R, PGmRIQ2-284-F and PGmRIQ2-284-R, PGmRIQ2-194-F and PGmRIQ2-194-R) were PCR-amplified as shown in Table 1 to detect positive roots. pCAMBIA3301 was used as control. The cycling conditions were as follows: 94 °C for 5 min; 35 cycles of 94 °C for 30 s, 55 °C for 30 s, and 72 °C for 30 s; and 72 °C for 10 min. The induced transformation efficiency of transgenic soybean roots was calculated as follows: hairy root transformation rate = number of hairy roots/number of explants × 100%; positive induction rate = number of positive roots/number of stained hairy roots × 100%.
The surfaces of Arabidopsis thaliana seeds were successively disinfected with 75% ethanol and 10% NaClO. The seeds were washed with sterile water, sown on 1/2 MS solid medium, incubated at 4 °C for 2–3 days, and then moved into a light incubator. After the seeds germinated, the seedlings were moved in a greenhouse with a photoperiod of 16/8 h light/dark at 23 °C. When flower buds appeared, the method of Clough et al. [28] was used. The opened flowers were cut, while the unopened bud leaves were completely soaked with transgenic Agrobacterium tumefaciens strain EHA105 for about 40 s. After the infestation was completed, the plants were treated in the dark for 24 h, and then transferred to a light incubator to continue to cultivate for 3–5 d under the original light conditions. The above steps were repeated 1–2 times until the seeds were harvested. Positive transgenic Arabidopsis thaliana was identified by phosphinothricin (PPT) resistance screening and PCR. PCR was carried out using the primer pairs PGmRIQ2-450-F/PGmRIQ2-450-R, PGmRIQ2-284-F/PGmRIQ2-284-R and PGmRIQ2-194-F/PGmRIQ2-194-R (shown in Table 1) with transgenic Arabidopsis thaliana leaf genomic DNA as a template.
2.6. Histochemical Staining
According to the method of Jefferson et al. [29], the plant tissue was stained. The washed tissue and GUS staining solution (0.1 M phosphate buffer pH 7.0, 0.5 M EDTA, 50 mM K3Fe(CN)6, 50 mM K4Fe(CN)6, Triton X-100, X-Gluc and ddH2O) were added to an Erlenmeyer flask. The pressure switch was turned on, and a vacuum was established. The vacuum was maintained for approximately 1 h, after which the samples were incubated overnight (37 °C). After staining, the staining solution was poured out, and the samples were decolorized with 70% ethanol three times. After complete decolorization, a stereomicroscope was used to observe and photograph the samples.
2.7. Hormone and Stress Management of Transgenic Arabidopsis Thaliana
Transgenic third-generation Arabidopsis thaliana seeds were sown in MS medium, vernalized at 4 °C for 2–3 days, transplanted to mixed nutrient soil and cultured in a light incubator for 15 days. Two groups of transgenic Arabidopsis thaliana were prepared. One group was treated with medium containing 50 μM auxin (IAA), and the other group was treated with medium lacking IAA. After treatment for 0.5, 1, 2, 4, 6, 8, 12 and 24 h, the leaves of the plants were taken, and GUS activity was measured. The hormone in the above steps was replaced with 100 μM abscisic acid (ABA) or 100 μM methyl jasmonate (MeJA), and the procedure was repeated to obtain plant materials treated with different hormones.
Transgenic Arabidopsis thaliana seeds were sown in MS medium containing 5 mg/L PPT, vernalized at 4 °C for 2–3 days, and transferred to a light incubator with a light intensity of 120 μmol/m2/s for 10 days. Two groups of transgenic Arabidopsis thaliana were prepared. One group was transferred to MS medium containing 250 mM mannitol for 2 days, and the other group was kept in the original MS medium for 2 days to measure GUS activity. The stress stimulus in the above steps was replaced by 200 mM NaCl or 300 μmol/m/s of light to obtain plant materials with different stress treatments.
2.8. GUS Fluorometric Quantitative Analysis
According to the method of Jefferson et al. [29], the GUS activity of the plant tissue was detected by fluorescence quantitative analysis. GUS extraction buffer (0.1 M phosphate buffer pH 7.0, 0.5 M EDTA, 10% SDS, Triton X-100, β-mercaptoethanol and ddH2O) was used to extract GUS protein from the soybean leaves, which was stored at 4 °C until use. A fluorescence spectrophotometer was used to measure the absorbance at 595 nm, and the concentration of GUS protein was calculated. Then, the fluorescence spectrophotometer was set to an excitation wavelength of 365 nm, an emission wavelength of 455 nm, and a slit width of 10 nm, and the fluorescence value was measured. Finally, the GUS activity was calculated. The determination was repeated three times for each sample.
2.9. Hormone Treatment of Soybean Plants
Soybean seedlings were grown in a greenhouse with a photoperiod of 16/8 h light/dark at 23 °C until the first fully expanded trifoliate leaves appeared, and were sprayed with medium containing 50 μM IAA. The leaves were taken at 0, 1, 3, 6, 9, 12 and 24 h after treatment; frozen with liquid nitrogen immediately; and stored at -80 °C until RNA extraction and fluorescence quantitative analysis. The hormone in the above steps was replaced with 100 μM ABA or 100 μM MeJA, and the procedure was repeated to obtain plant materials treated with different hormones.
All experiments were performed in triplicate. All data were analyzed using the general linear model procedure (GLM) in SPSS 17, IBM, New York, NY, USA. Comparisons were made using Duncan’s Multiple Range test (p < 0.05). The data are shown as the mean ± SE of three independent replicates.
2.10. Total RNA Extraction and Quantitative Real-Time (qRT)-PCR Analysis
Total RNA from soybean leaves was extracted by the TRIzol method (Takara, Shiga, Japan) [30]. cDNA was synthesized according to the instructions of a reverse transcription kit with ReverTra Ace qPCR RT Master mix with gDNA Remover (Toybo Life Science Shanghai). qRT-PCR analysis was performed on a Chromo4 RT-PCR system (Bio-Rad, Hercules, CA, USA). The soybean Actin4 gene (GenBank Accession No. AF049106) was used as the internal standard control, and the total RNA was reverse-transcribed into single-stranded cDNA using the primer pairs shown in Table 3. The qRT-PCR cycling conditions were as follows: 95 °C for 5 min and 40 cycles of 95 °C for 10 s, 60 °C for 20 s, and 72 °C for 30 s. All reactions were performed three times.
3. Results
3.1. Bioinformatics Analysis of the PGmRIQ2 Sequence
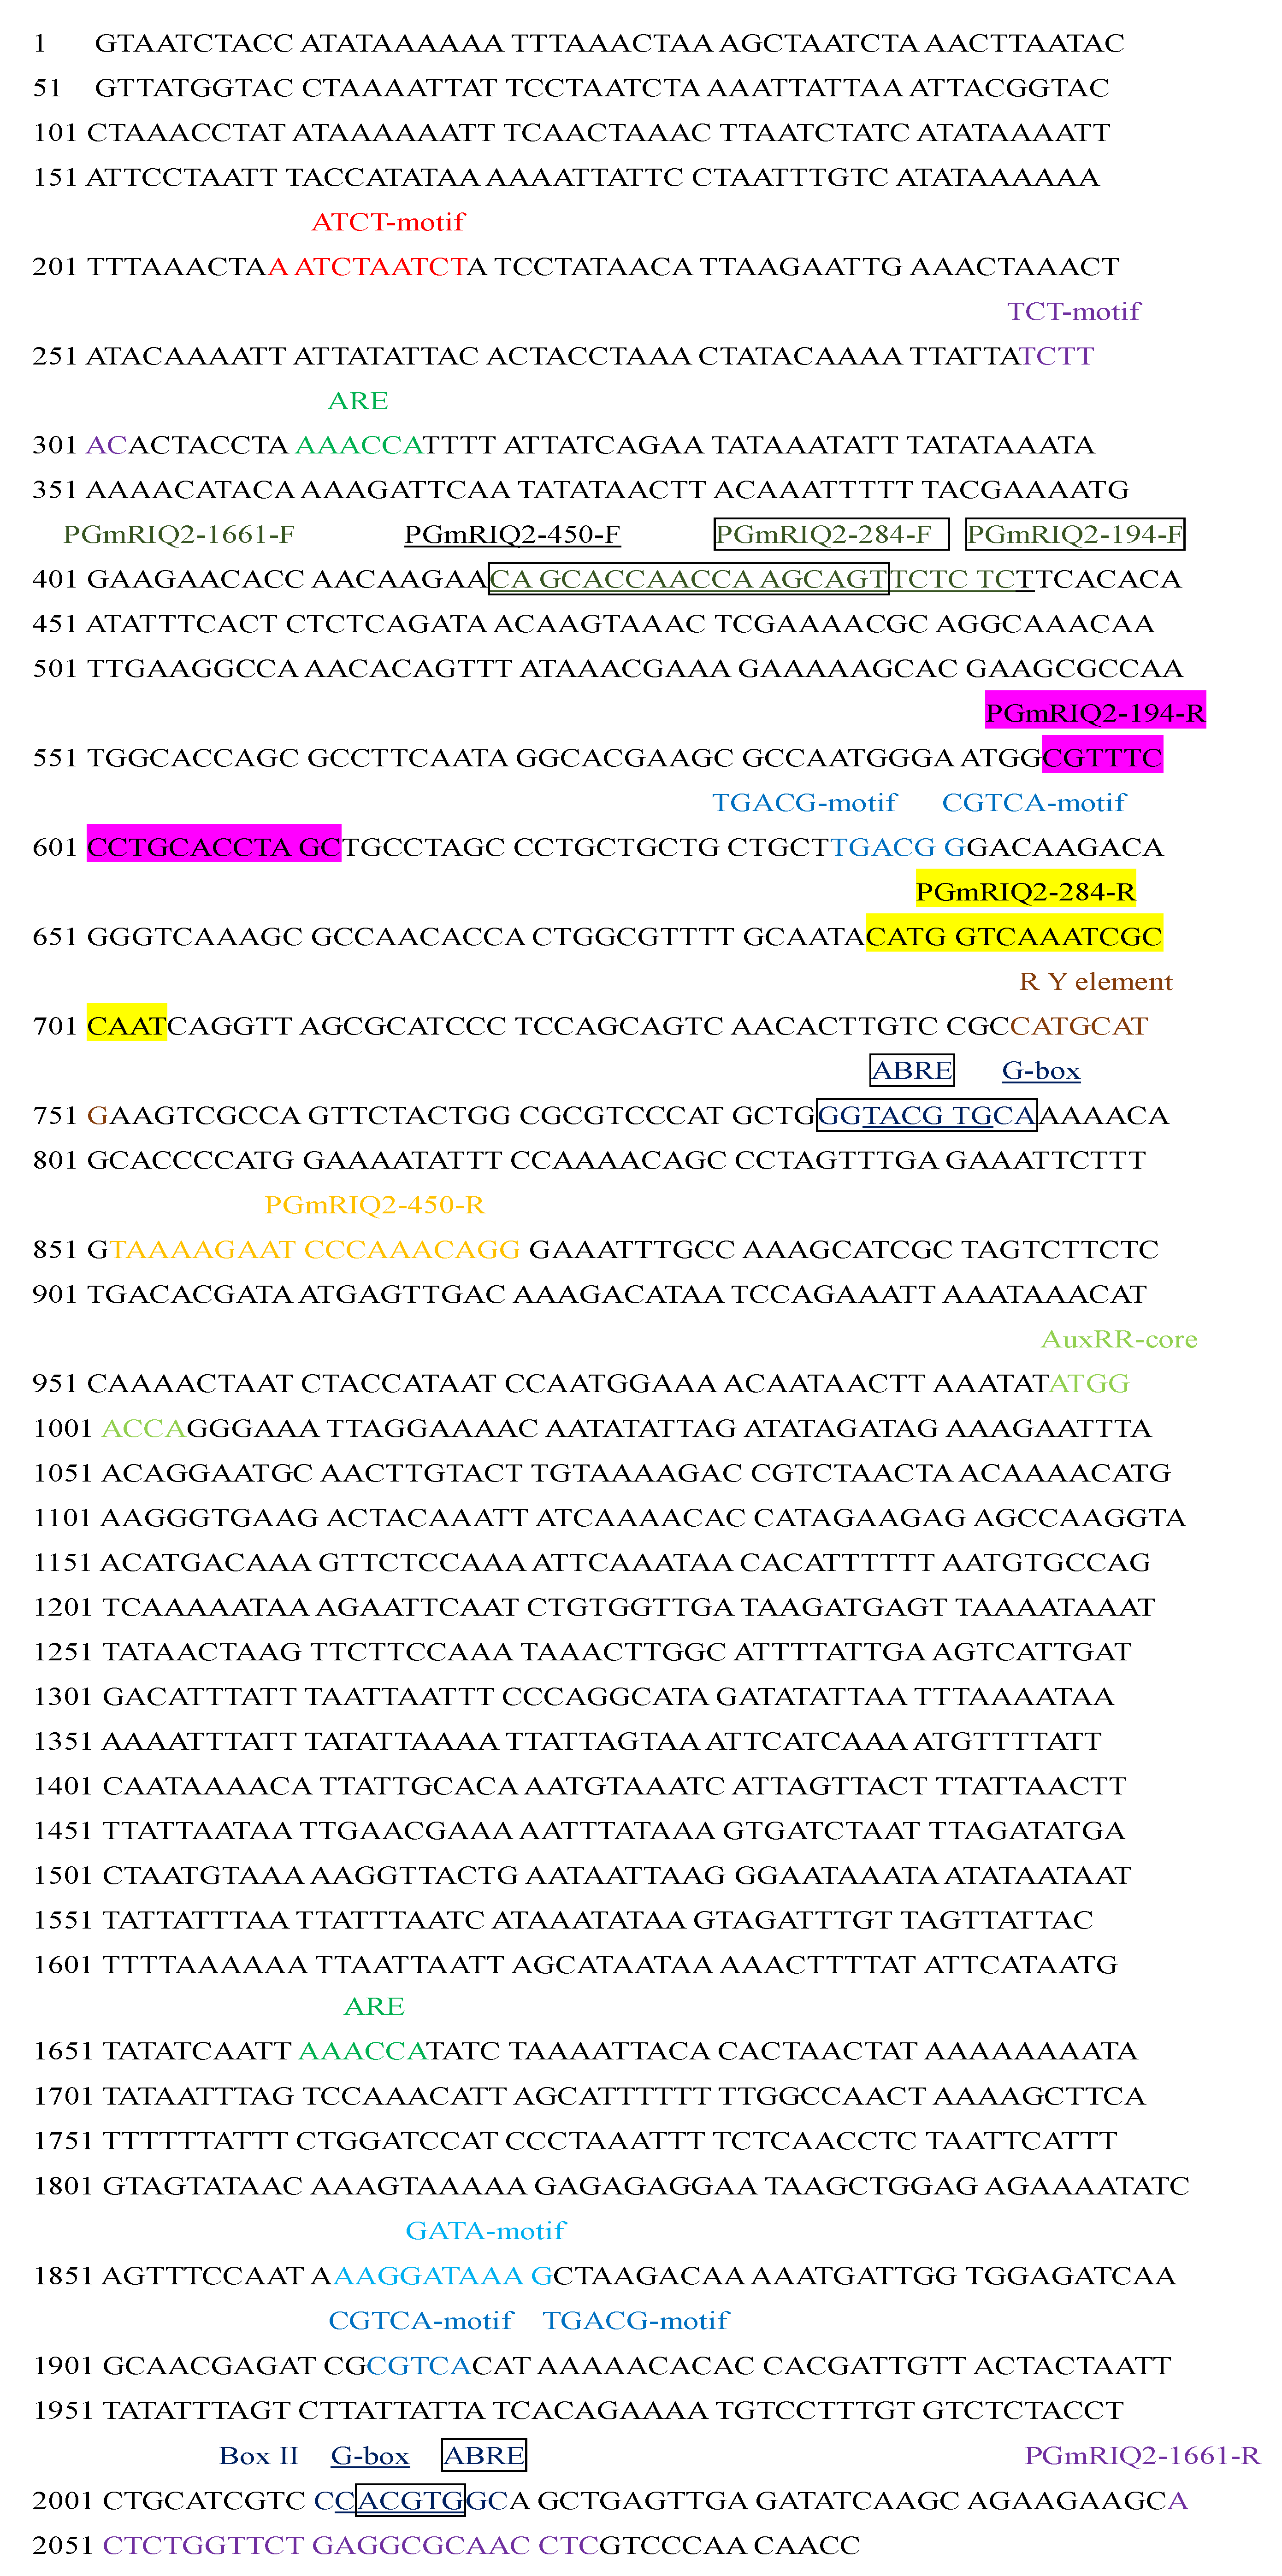
PGmRIQ2 was predicted with the BDGP online tool [24]. The results showed that there were four core promoter regions in the PGmRIQ2 sequence, which were located from base pairs −103 to −153, −516 to −566, −843 to −893, and −983 to −1033. The predicted probabilities were 0.83, 0.85, 0.87 and 0.94. The predicted transcription initiation sites were T, A, A and A. The cis-acting elements of PGmRIQ2 were predicted by using the PlantCARE online analysis website (Figure 4 and Table 4). It was found that the sequence contains a large number of basic promoter components, such as a TATA box and CAAT box. Also present were some cis-regulatory elements involved in abiotic stress responses, such as those involved in light responses (the ATCT-motif, Box II, the G-box, the GATA-motif and the TCT-motif); elements related to hormone responses (cis-acting elements involved in ABA responsiveness (ABA response elements, ABREs), a cis-acting regulatory element involved in IAA responsiveness (the AuxRR-core), and cis-acting regulatory elements involved in MeJA responsiveness (CDTCA- and TGACG-motifs)); a cis-acting regulatory element essential for anaerobic induction (the anaerobic response element, ARE); and a cis-acting regulatory element involved in seed-specific regulation (the RY-element).
3.2. GUS Gene Expression from PGmRIQ2 in Different Crops
The recombinant plant expression vector containing the 1661 bp full-length GmRIQ2 promoter and the GUS gene and the pCAMBIA3301 vector containing the CaMV35S promoter and the GUS gene were transferred into soybean and Arabidopsis thaliana, respectively. Histochemical staining was used to quickly determine whether PGmRIQ2 drove GUS gene expression and to analyze the transformation efficiency. The promoter was confirmed to drive GUS gene expression.
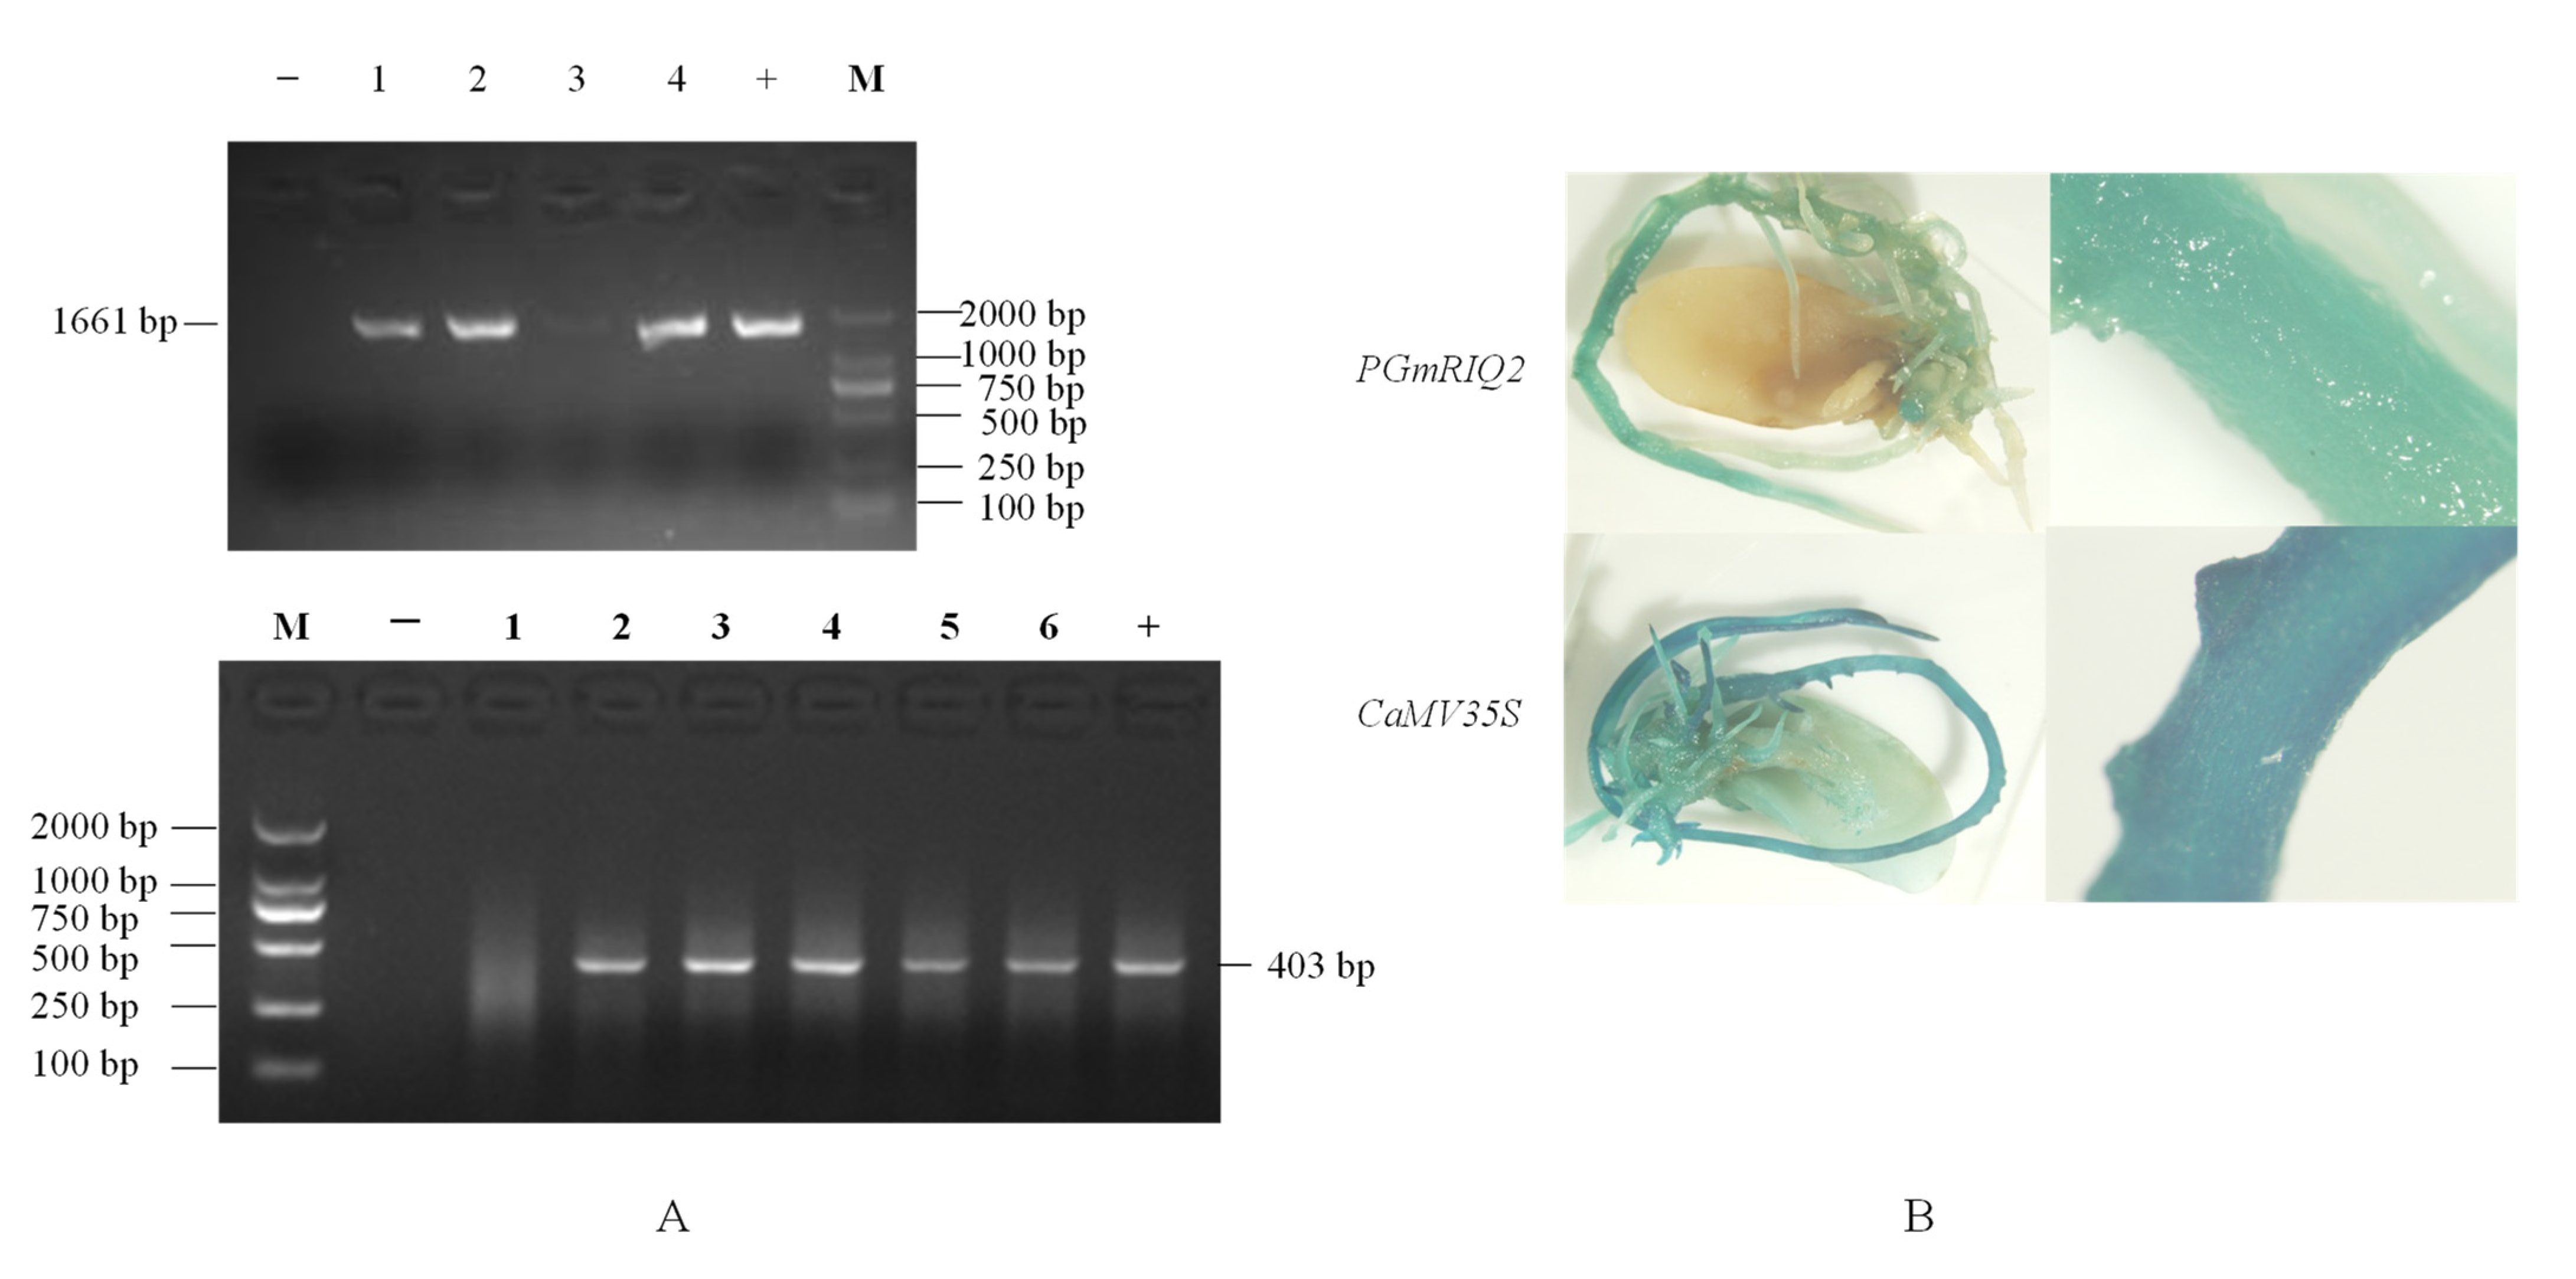
After PCR amplification, the results showed that the target bands were 1661 bp and 403 bp in size, indicating that two positive transgenic roots were successfully obtained (Figure 5A). By histochemical staining (Figure 5B), it was found that the hairy roots of transgenic soybean were blue under the influence of the PGmRIQ2 or CaMV35S promoter. The strong constitutive CaMV35S promoter resulted in a darker color than the PGmRIQ2 promoter. Combined with the results of PCR amplification, the findings revealed that both the pCAMBIA3301GmRIQ2::GUS recombinant expression vector and the pCAMBIA3301 empty vector were successfully transferred into soybean roots and could drive the expression of the GUS reporter gene. As shown in Table 5, the hairy root transformation rates of the two positive materials were 42.22% and 40%, respectively, while the positive induction rates of the two positive materials were 71.05% and 77.78%, respectively. The results showed that although the recombinant expression vector containing PGmRIQ2 had a slightly higher hairy root conversion rate than the other vector, the positive induction rate was lower. However, there was no significant difference between the vectors.
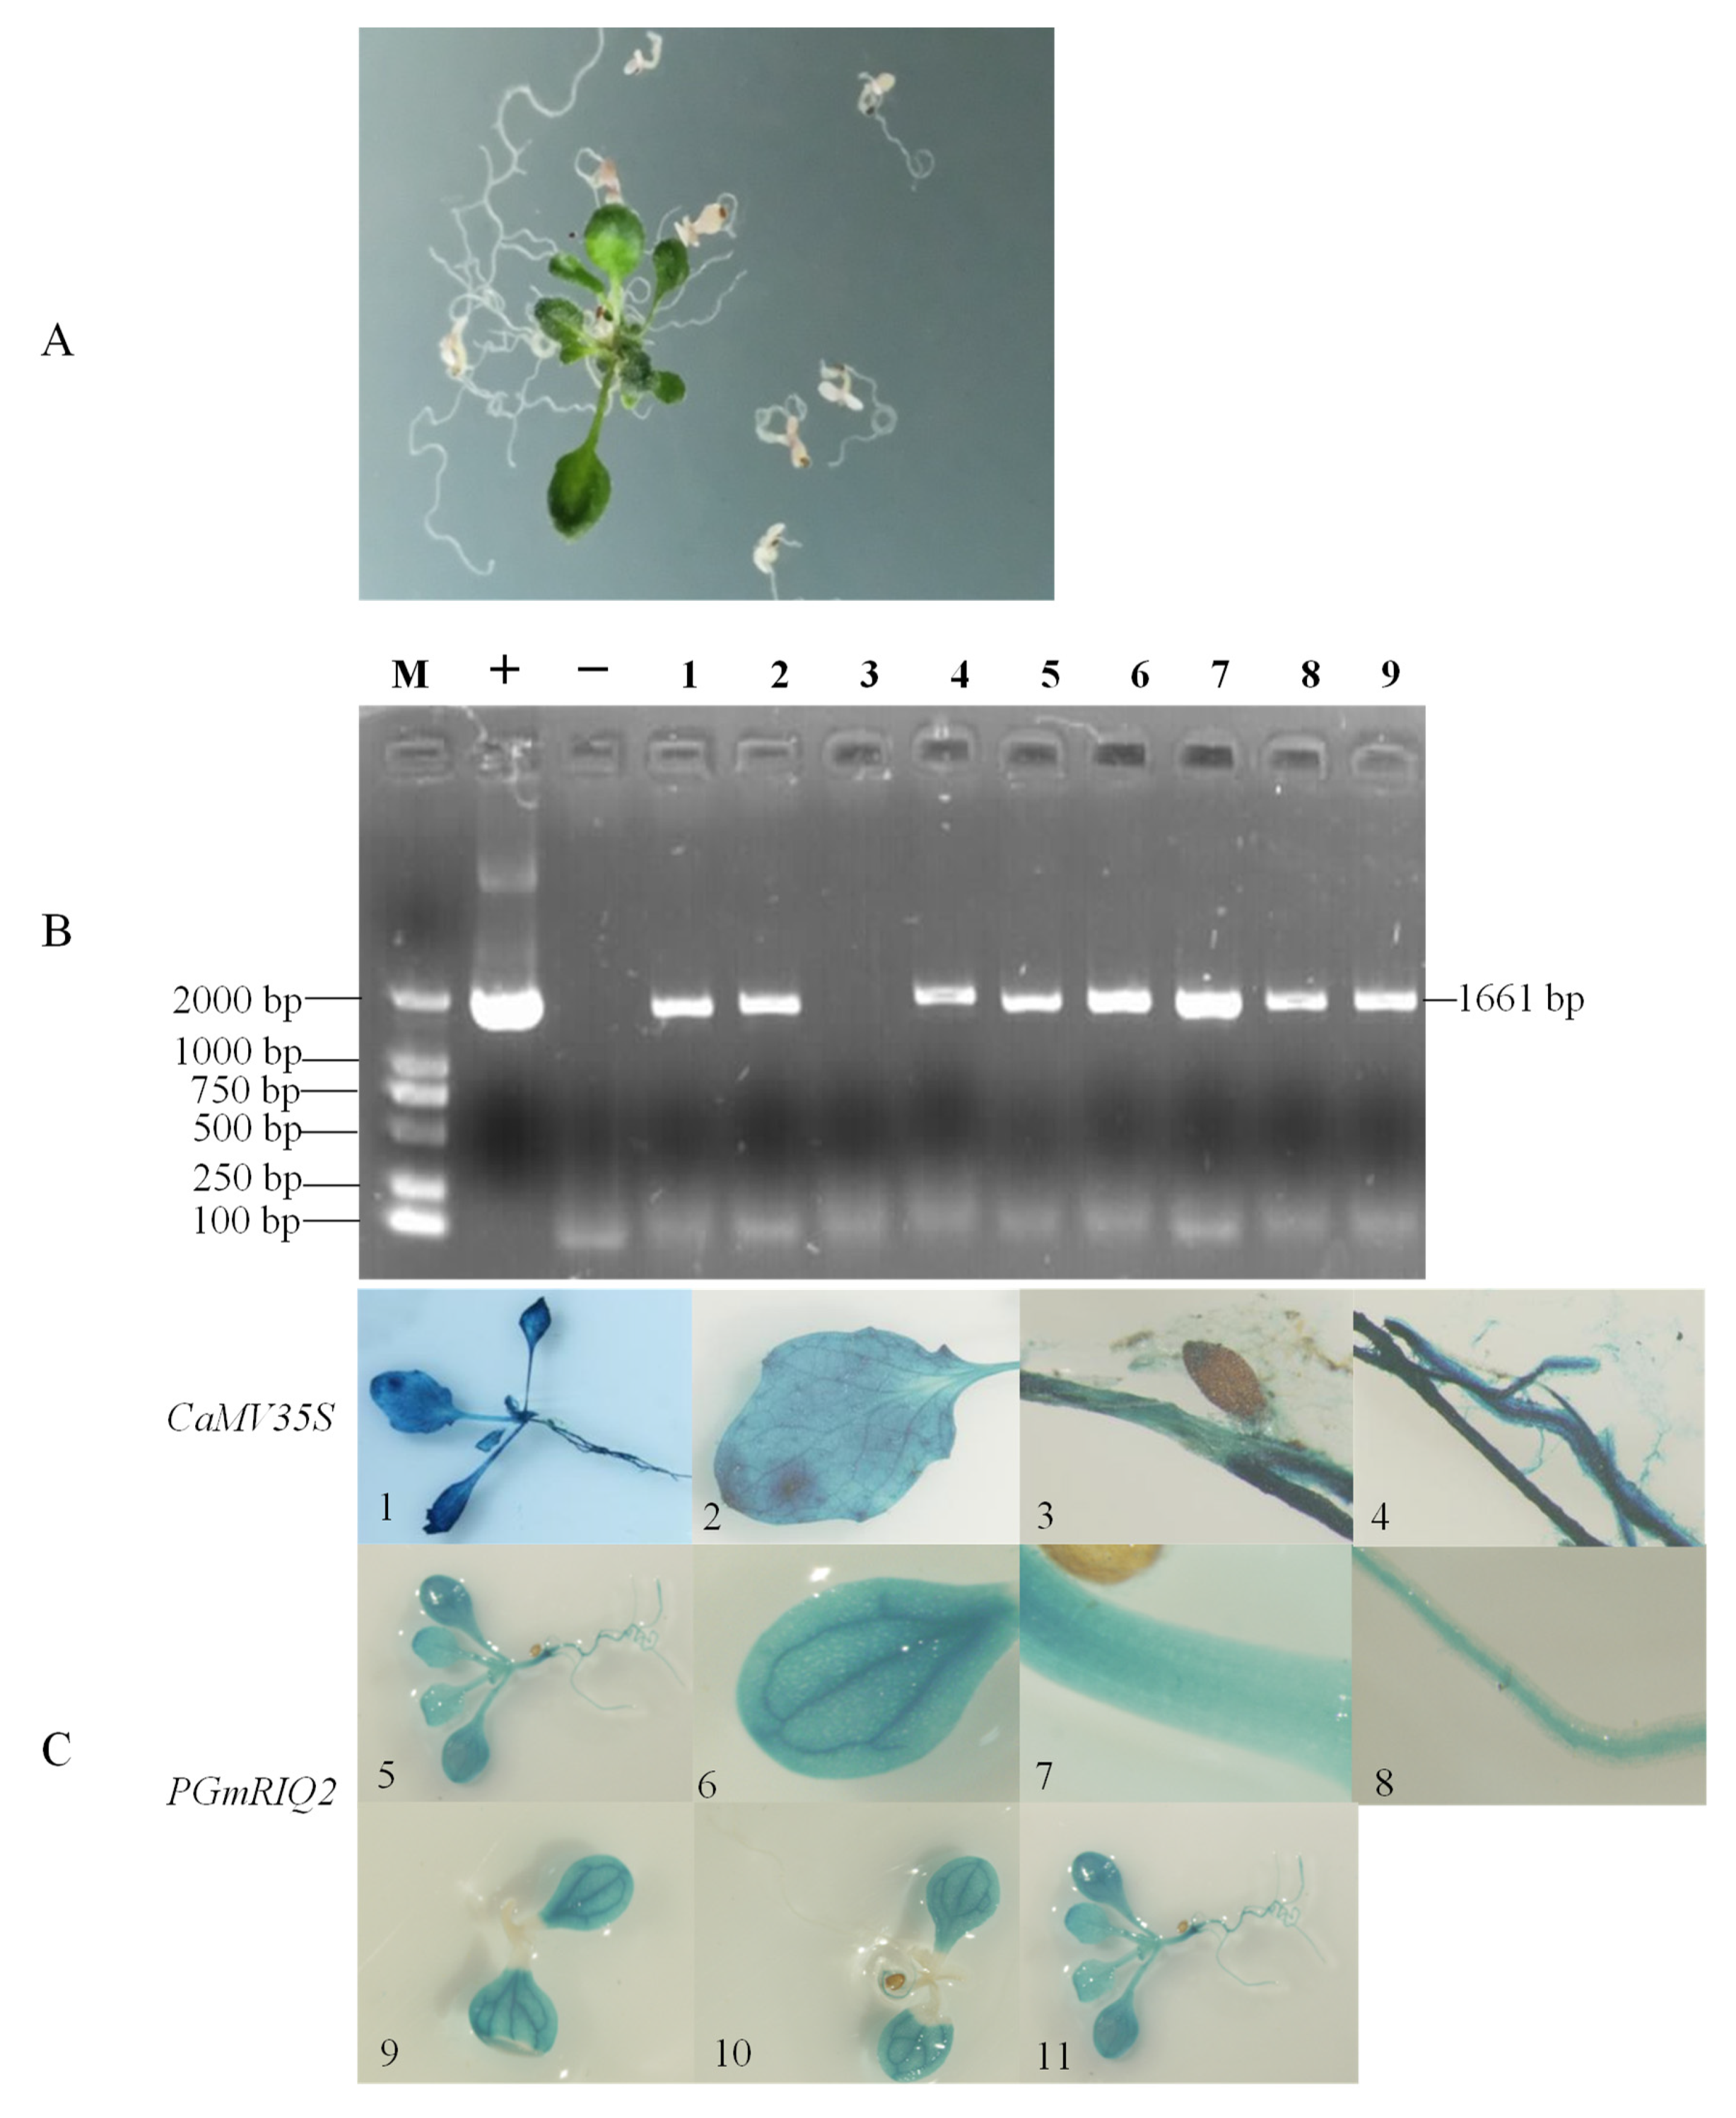
PCR amplification and PPT resistance screening were used to confirm the successfully produced transgenic Arabidopsis thaliana plants (Figure 6A,B). Histochemical staining showed that the GUS gene was expressed in Arabidopsis thaliana under the influence of the two promoters (Figure 6C). Although the PGmRIQ2 resulted in a slightly lower degree of staining (lighter staining, Figure 6C(5–11)) than the CaMV35S promoter (Figure 6C(1–4)), the blue color was obviously deeper and the expression level was obviously higher in the vascular tissue of rosette leaves than in the rest of the leaf tissue (Figure 6C(9–11)). This indicated that the GUS gene was efficiently expressed in the vascular tissues of rosette leaves. Subsequently, we found that the GUS gene expression level increased and that the expression area expanded with extension of the Arabidopsis thaliana growth period under the influence of the PGmRIQ2 promoter; thus, it had obvious spatiotemporal expression characteristics. In the early stage of growth, GUS was expressed only in the rosette leaves. It was gradually expressed in the whole plant, but it remained dominantly expressed in the vascular tissues of the rosette leaves.
3.3. GUS Gene Expression Driven by PGmRIQ2 Deletion Mutants in Arabidopsis Thaliana
Based on the bioinformatics analysis of PGmRIQ2 combined with the predicted positions and functions of the cis-acting elements in the sequence, PGmRIQ2 was truncated by the 5′ end deletion method, and three promoter deletion fragments were constructed. The deletion promoters were named PGmRIQ2-450 (450 bp), PGmRIQ2-284 (284 bp) and PGmRIQ2-194 (194 bp). To further study the ability of the PGmRIQ2 deletion mutant to drive the inducible activity of the GUS gene, the promoter deletion fragment-GUS constructs were transferred to Arabidopsis thaliana through an Agrobacterium tumefaciens-mediated inflorescence soaking method. The positive Arabidopsis thaliana plants were confirmed by PCR amplification and PPT screening (Figure 7A,B), and then the expression of the GUS gene was observed by histochemical staining (Figure 7C). We clearly observed that transgenic Arabidopsis thaliana was stained blue under the action of PGmRIQ2-450, PGmRIQ2-284 or PGmRIQ2-194, consistent with the expression pattern of the full-length promoter; however, the expression levels were different. With truncation of the promoter, the expression level of the GUS gene decreased. However, the differences in GUS gene expression were more obvious in rosette leaves (Figure 7C(2,6,10)) and roots (Figure 7C(4,8,12)) than in stems (Figure 7C(3,7,11)). The GUS gene was obviously preferentially expressed in the vascular tissue of rosette leaves. The expression levels in roots were lower than those in rosette leaves and stems. These results showed that the promoter deletion fragments of different lengths were all able to drive GUS expression, but the resulting expression level gradually decreased with fragment shortening. GUS was most highly expressed in rosette leaves, followed by stems, while it was most weakly expressed in roots. It was dominantly expressed in vascular tissue.
3.4. Functional Analysis of the GmRIQ2 Full-Length and Deletion Fragment Promoters
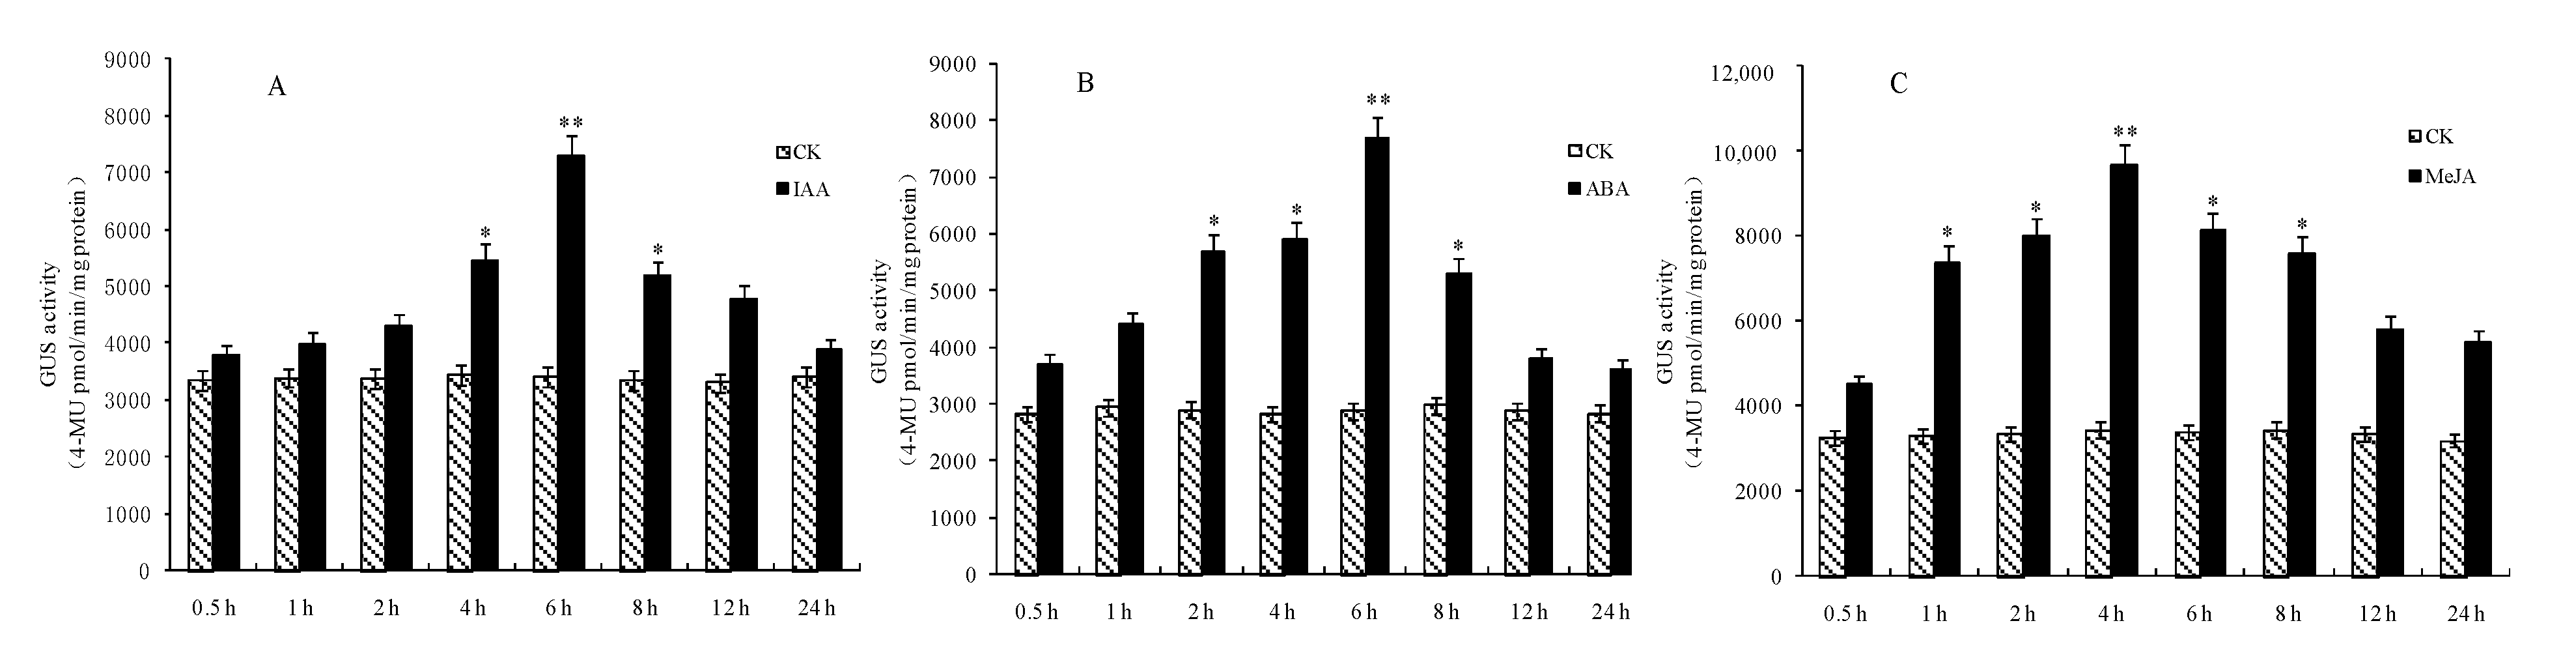
Transgenic Arabidopsis thaliana plants with GmRIQ2 promoters of different lengths were treated with hormones and stress. GUS activity was determined by GUS fluorescence quantitative analysis. Transgenic Arabidopsis thaliana plants with full-length PGmRIQ2 were treated separately with 50 μM IAA, 100 μM ABA and 100 μM MeJA (Figure 8). GUS activity first increased and then decreased with prolonged treatment. It peaked at 6 h, 6 h and 4 h after the respective treatments, reaching levels significantly higher than those in the control plants. These results suggest that these three hormones can induce GUS gene expression and are inducers of PGmRIQ2 and that the optimal response times for the hormones at the tested concentrations are 6 h, 6 h and 4 h, respectively.
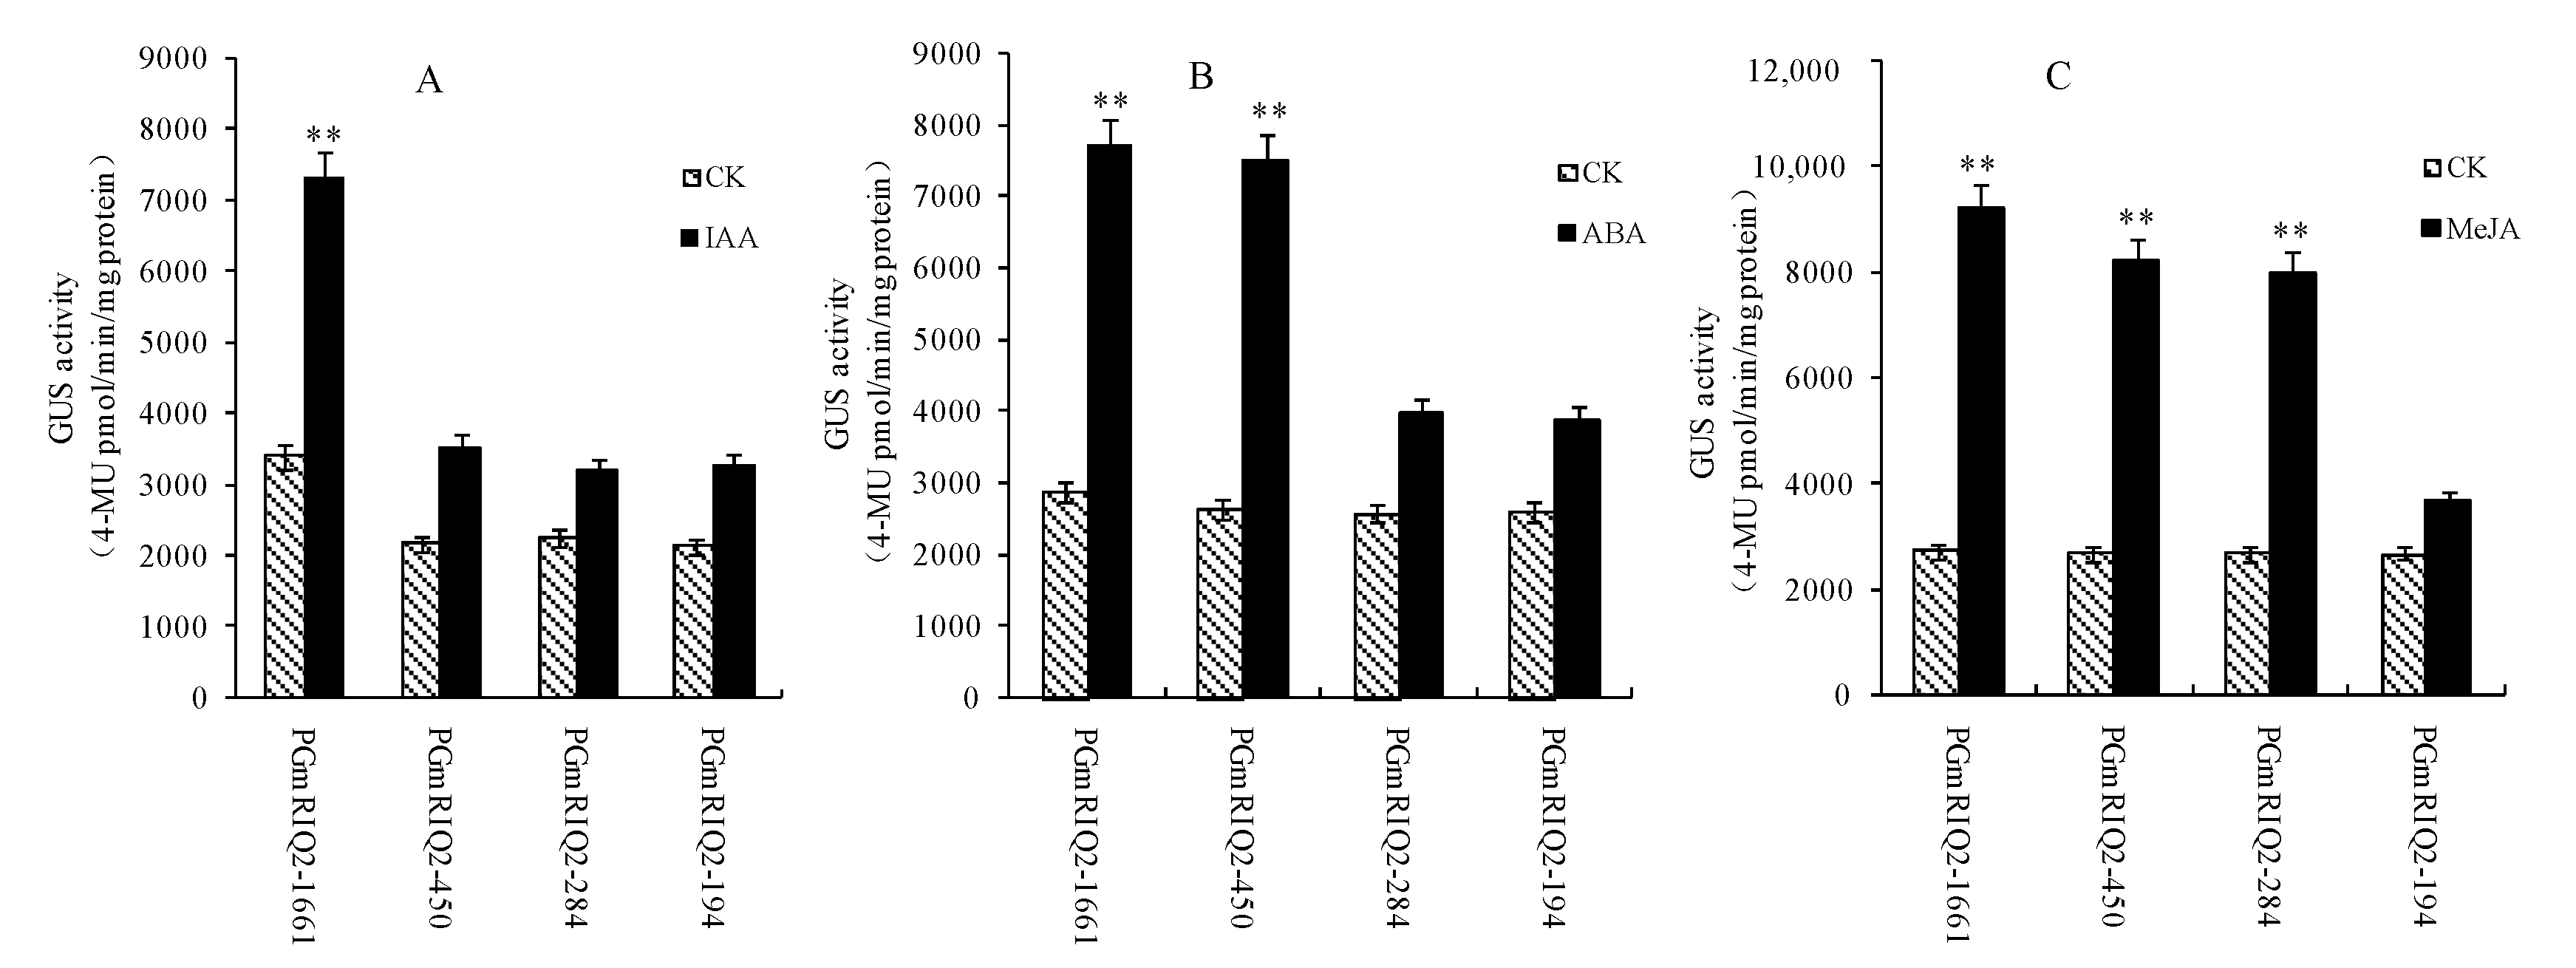
Similarly, transgenic Arabidopsis thaliana plants with PGmRIQ2 deletion mutants were treated separately with 50 μM IAA, 100 μM ABA and 100 μM MeJA, and samples were taken at the optimal response time for GUS fluorescence quantitative analysis. The results showed that GUS activity was significantly upregulated only in transgenic Arabidopsis thaliana with PGmRIQ2 after IAA induction (Figure 9A). The responses of the other plants to IAA were significantly reduced, and there were no significant differences between these plants and the control plants. These preliminary data suggest that the IAA-responsive regulatory element is located between base pair −1661 and base pair −450, consistent with the predicted position of the GGTCCAT element. After ABA induction, GUS activity was significantly increased in transgenic Arabidopsis thaliana containing PGmRIQ2 and PGmRIQ2-450 (Figure 9B). However, the responses of the other two materials to ABA were not markedly different from that of the control, indicating that the promoter segment with the missing response element had a weakened ability to elicit a response to ABA. These preliminary data suggest that the regulatory element for ABA is between base pair −450 and base pair −284, consistent with the predicted position of the ACGTG element. After treatment with MeJA, GUS activity was upregulated in transgenic Arabidopsis thaliana containing the PGmRIQ2, PGmRIQ2-450 and PGmRIQ2-284 promoters (Figure 9C). However, GUS activity in transgenic Arabidopsis thaliana with PGmRIQ2-194 was significantly decreased, which indicated that the ability of the promoter fragment without the MeJA response element to elicit a response was weakened. These preliminary data suggest that the regulatory element for MeJA is between base pair −284 and base pair −194, consistent with the predicted position of the TGACG element.
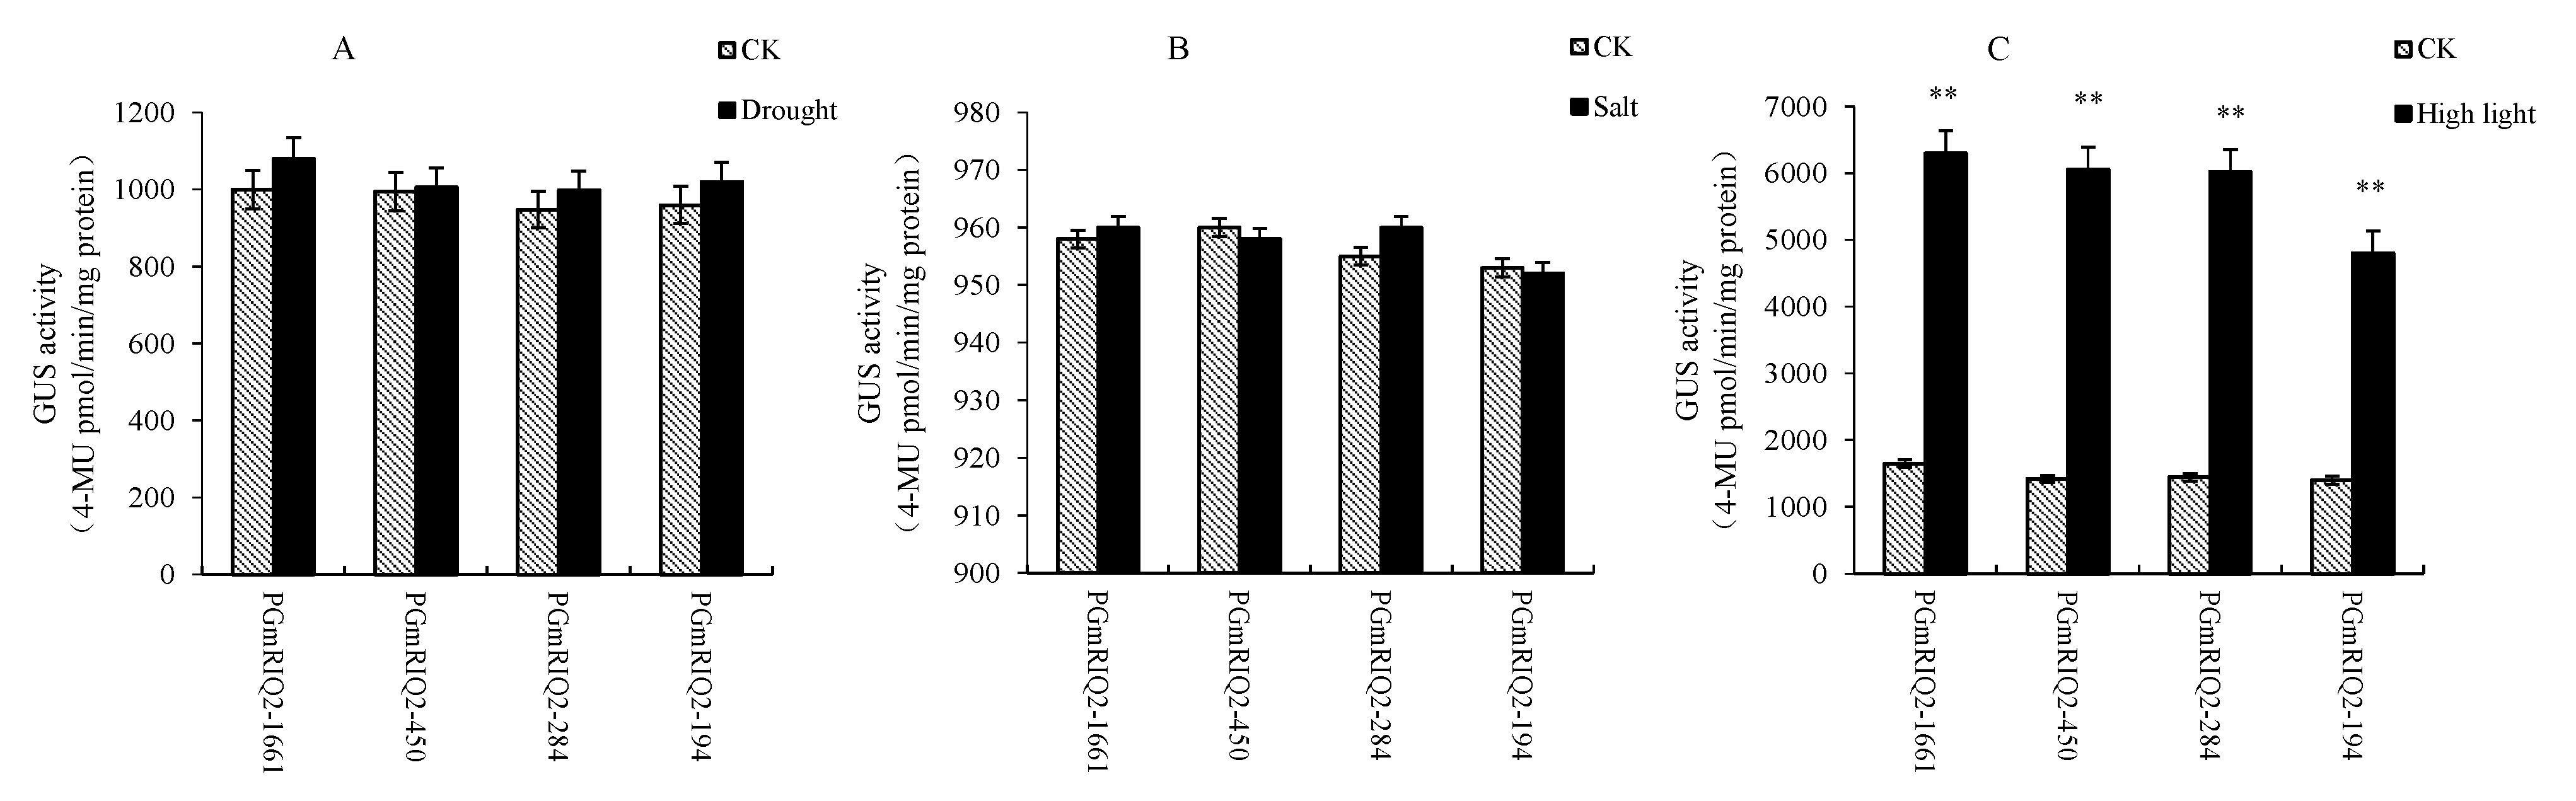
Transgenic Arabidopsis thaliana with PGmRIQ2 promoter fragments of different lengths were treated with 250 mM mannitol, 200 mM NaCl and 300 μmol/m2/s light. Quantitative analysis of GUS fluorescence showed that the GUS activity of all materials did not change significantly after treatment with 250 mM mannitol or 200 mM NaCl, and the regulatory elements related to drought and high-salt responses were not predicted to exist in the PGmRIQ2 sequence (Figure 10A,B). Therefore, NaCl was not an inducer of PGmRIQ2. However, in our previous studies, the GmRIQ2 gene was induced by drought, suggesting that there might be elements related to drought induction in other regulatory regions of the promoter. After 300 μmol/m2/s light treatment, the GUS activity of all materials was significantly increased (Figure 10C). Promoter element prediction showed that there were multiple light response regulatory elements in the PGmRIQ2 sequence. Given the results and previous research by our group, we conclude that the GmRIQ2 gene is induced by light and that light is the inducer of PGmRIQ2.
3.5. Gene Expression of GmRIQ2 in Hormone-Treated Soybean
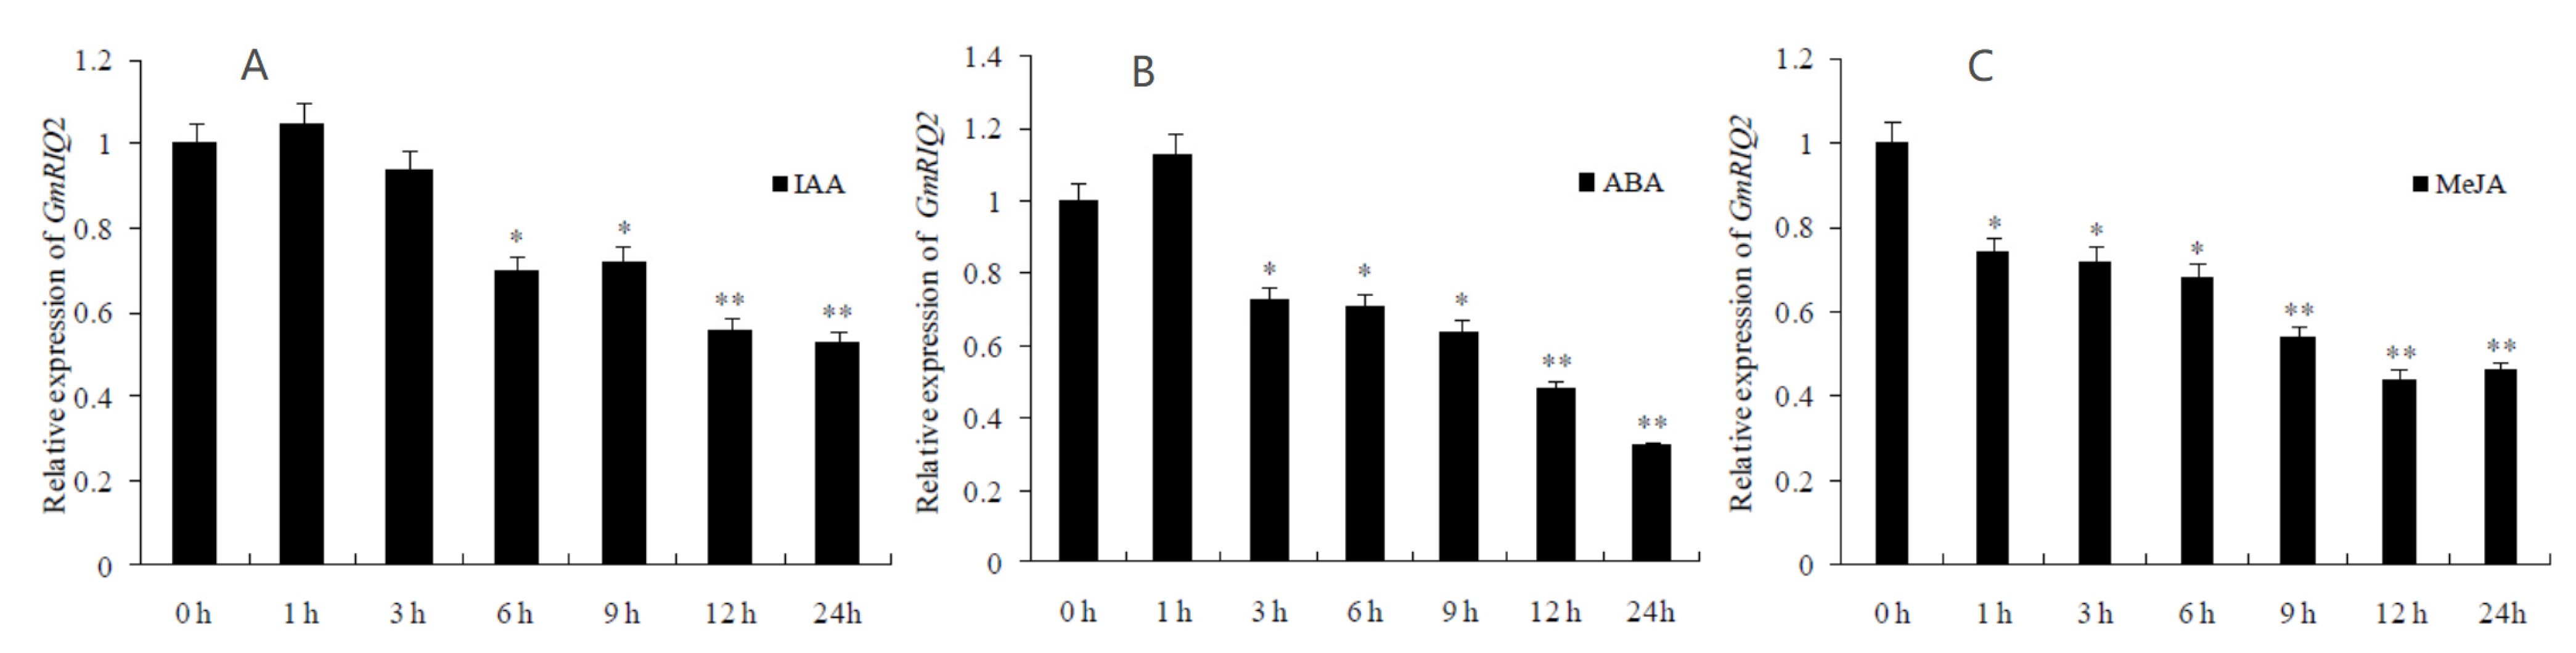
Soybean leaves were treated with hormones, and RNA was extracted from the leaves at different time points for fluorescence quantitative PCR analysis. The results showed that under the 50 μM IAA or 100 μM ABA treatment, the expression level of the GmRIQ2 gene increased slightly at first and then decreased significantly with increasing treatment time (Figure 11A,B). As shown in Figure 11C, under treatment with 100 μM MeJA, the expression level of the GmRIQ2 gene gradually decreased with increasing treatment time. This finding indicated that the expression level of the GmRIQ2 gene was negatively correlated with the treatment time. We conclude that the expression of the GmRIQ2 gene is negatively regulated by IAA, ABA and MeJA.
4. Discussion
4.1. Application of the GUS Gene in Promoter Activity Analysis
The GUS gene is a commonly used reporter gene. Histochemical staining can be used for rapid and easy localization, and enzyme activity detection can be used for simple and sensitive quantitative analysis [31,32,33,34]. To study the function of PGmRIQ2 in heterologous plants, GUS was used as a reporter gene. GUS histochemical staining showed that PGmRIQ2 drove GUS activity in rosette leaves, stems and roots of transgenic Arabidopsis thaliana. The GUS enzyme activity test showed that PGmRIQ2 was regulated by IAA, ABA, MeJA and light, but it did not respond to drought or high-salt stress. Previously, our research group transformed the GmRIQ2 gene into soybean cotyledon nodes through Agrobacterium tumefaciens-mediated transformation to obtain transgenic overexpressing soybean lines. PEG-simulated drought treatment showed that overexpression of the GmRIQ2 gene improved soybean drought resistance [23]. We speculate that although the predicted PGmRIQ2 sequence does not contain regulatory elements responding to drought, related elements in other regulatory regions of the promoter may exist. This possibility needs to be further explored.
4.2. Construction of Promoter Deletion Fragments by the 5′ End Deletion Method
Stable expression is widely used for plant genetic transformation due to its ability to produce genetically stable offspring and reliable experimental results [35,36]. Use of the 5′ end deletion method to construct a series of promoter deletion fragments of different lengths enables analysis of the localization and function of regulatory elements [37]. The distribution and basic functions of the elements in the PGmRIQ2 sequence were explored to provide a molecular basis for functional research on the GmRIQ2 gene. In this study, the 5′ end deletion method and histochemical staining were used to verify that all three promoter deletion fragments had transcriptional activity and that the expression patterns were consistent with that of the full-length promoter. The deletion promoter with a length of only 194 bp still drove gene expression. After hormone and stress treatment, the GUS enzyme activity test showed that the IAA, ABA, and MeJA response elements were located between base pairs −1661~−450, −450~−284 bp and −284~−194 bp, respectively. The promoters were induced by light signals, consistent with the initial predicted element distribution. We preliminarily speculate that PGmRIQ2 may be an inducible promoter. High-salt treatment did not significantly affect the enzyme activity of transgenic Arabidopsis thaliana, which indicates that the PGmRIQ2 sequence does not contain elements that respond to high-salt stress, consistent with the predictions. However, whether the GmRIQ2 gene is induced by high-salt stress needs to be explored in depth.
4.3. Sequence Analysis of PGmRIQ2
According to the results of bioinformatics prediction, the promoter of the GmRIQ2 gene contains several basic promoter elements, suggesting that the promoter has a basic initiating function. In addition, a large number of regulatory elements are present. The effects of changing light intensity indicate that PGmRIQ2 is induced by light signals, consistent with the finding that the predicted promoter sequence contains multiple light response elements. Therefore, light is likely to participate in the expression of the GmRIQ2 gene as an important regulatory signal, which is consistent with the conclusions of previous studies showing that the GmRIQ2 gene is regulated in response to light signals. Previous studies have also shown that the upstream sequence of the Phvul.009G190100 gene, which is homologous to the Arabidopsis thaliana AtRIQ2 gene, contains several cis-acting elements involved in the light response. It is speculated that its activity may be regulated by light signals, and this characteristic may be closely related to the localization of the gene product in chloroplasts [22]. In the current study, the hormone treatment experiment also indicated that the promoter is induced by IAA, ABA, and MeJA. This finding is consistent with the prediction that the promoter sequence contains one AuxRR core, two ABREs, two CGTCA-motifs, and two TGACG-motif response elements. It is speculated that the GmRIQ2 gene may also be induced and regulated by hormones. Previous studies have shown that the BnMicEmUp gene, which is homologous to the Arabidopsis thaliana AtRIQ2 gene, is regulated by ABA. ABA signalling may activate gene expression during embryonic development. This provides a reliable basis for the induction of GmRIQ2 gene expression by hormones [21]. These results are helpful for comprehensively understanding the molecular mechanisms and pathways of gene regulation and provide references for functional analysis of the GmRIQ2 gene.
4.4. GmRIQ2 Gene Promoter Expression of Vascular Tissue Specificity
The constituent promoter is highly expressed due to its different decisiveness during the growth period of the plant. Thus, the application of constituent promoter in the plant gene engineering is very wide [8]. However, there is also a waste of metabolic accumulation and energy waste caused by excessive consumption, resulting in damage to the balance and genetic silence [10,12]. Therefore, researchers have focused on the inducible promoter and tissue-specific promoters, which were expected to replace the constitutive promoters. The inducible promoter regulates exogenous gene expression only in certain conditions or with certain factors and can be used to adjust according to people’s expectations [3]. The tissue-specific promoters effectively alleviate excessive expressions of unnecessary waste by expressing in a specific period or place [13].
Li found that the transgenic Arabidopsis thaliana containing the lily MIR171a promoter drives GUS gene expression in the early stage of growth, but gradually does not express the GUS gene with the seedlings development. This promoter showed significant spatial and space specificity [38]. Bai et al. found that GmbZIP33 promoter of soybean was a typical tissue-specific promoter, which was significantly expressed in the vascular tissue of the transgenic Arabidopsis, but its activity was weaker than the CAMV35S promoter [39]. The results of this study show that the activity of the soybean PGmRIQ2 is slightly weaker than that of the CaMV35S strong promoter. The vascular tissue specificity of PGmRIQ2 is not obvious in the transgenic soybean root system. However, there is obvious vascular tissue specificity in the vascular tissues of the rosette leaves, stems and roots of the transgenic Arabidopsis thaliana, especially the rosette leaf vascular tissues. And there is spatial and space specificity in the early growth of transgenic Arabidopsis thaliana. Promoter deletion fragments also show obvious advantages in vascular tissue expression, and their expression pattern is consistent with the full-length promoter. After analysis, no elements related to the promoter sequence and specific expression were found. This may be a phenomenon caused by the expression of the promoter in a heterologous plant, and it may also be affected by external environmental factors [40].
In this study, the three promoter deletion fragments were cloned based on the distribution of hormone-related elements. In subsequent studies, the three promoter deletions can be rescinded in conjunction with the new prediction method and converted to the plant to perform functional analysis. At present, there are several specific promoters that have been identified, which are generally used in anti-disease and anti-seepage genetic engineering [41]. However, the actual promoters applied are limited due to their lower expression efficiency and the restriction of heterologous expression [42]. Therefore, PGmRIQ2 will provide a useful research direction and application prospects for the specific promoter of the vascular tissue.
5. Conclusions
In this research, the deletion method of 5′ end and tissue staining were used to verify that the three deletion promoter fragments of PGmRIQ2 (PGmRIQ2-450, PGmRIQ2-284 and PGmRIQ2-194) all have transcriptional activity, and the expression pattern is consistent with the full-length promoter of PGmRIQ2. Furthermore, these deletion promoter fragments all have the function of driving the expression of the reporter gene. After hormone or stress treatment, the GUS enzyme activity test confirmed that the response elements of IAA, ABA and MeJA are located between −1661~−450 bp, −450~−284 bp and −284~−194 bp, respectively. At the same time, the PGmRIQ2 is induced by light signals, and the PGmRIQ2 has the characteristics of an inducible promoter. Our study provides an important reference for research on the molecular function and mechanism of the GmRIQ2 gene and for further in-depth exploration of the regulatory network of its internal functional elements.
Author Contributions
B.Z., D.L. and Q.Z. designed the experiments and obtained funding for the research. B.Z. contributed to compiling and analyzing the data and wrote the manuscript. H.Y. and J.D. conducted statistical analysis. B.Z., X.S. and Z.S. performed the experimental analyses. D.L. and Q.Z. participated in the data analysis and supervised the writing of the manuscript. All authors read and approved the manuscript. All authors have read and agreed to the published version of the manuscript.
Funding
Special project for the cultivation of new breeds of genetically modified organisms (No. 2016ZX08004002), the postdoctoral scientific research developmental fund of Heilongjiang Province (No. LBH-Q18024) and Young talents project of Northeast Agricultural University (19QCO2).
Institutional Review Board Statement
Not applicable.
Informed Consent Statement
Not applicable.
Data Availability Statement
Not applicable.
Conflicts of Interest
The authors declare no conflict of interest.
References
- Zhang, C.X.; Wang, W.Q.; Jiang, X.N.; Chen, X.M. Review on plant gene promoters. Acta Genetica. Sinica. 2004, 31, 1455–1464. [Google Scholar]
- Cabre, L.; Peyrard, S.; Sirven, C.; Gilles, L.; Pelissier, B.; Ducerf, S.; Poussereau, N. Identification and characterization of a new soybean promoter induced by Phakopsora pachyrhizi, the causal agent of Asian soybean rust. BMC Biotechnol. 2021, 21, 27. [Google Scholar] [CrossRef] [PubMed]
- Li, J.; Zhang, F.C.; Wang, W.Q.; Huang, L.X. Advance in the Study of Higher Plant Promoter. Biotechnol. Lett. 2006, 17, 658–661. [Google Scholar]
- Yokoyama, R.; Yamamoto, H.; Kondo, M.; Takeda, S.; Ifuku, K.; Fukao, Y.; Kamei, Y.; Nishimura, M.; Shikanai, T. Grana-localized proteins RIQ1, and RIQ2, affect the organization of light-harvesting complex II and grana stacking in Arabidopsis. Plant Cell. 2016, 28, 2261–2275. [Google Scholar] [CrossRef] [Green Version]
- Kadonaga, J.T. Perspectives on the RNA polymerase II core promoter. Wires Dev. Biol. 2012, 1, 40–51. [Google Scholar] [CrossRef] [PubMed] [Green Version]
- Yang, R.J.; Bai, J.R.; Li, R.; Chang, L.F. Research progress of the inducible promoters in plant genetic engineering. J. Shanxi Agric. Sci. 2018, 46, 292–298. [Google Scholar]
- Li, T.; Sun, J.K.; Liu, J.T. Research progress of plant promoter. Biotechnol. Bull. 2015, 31, 18–25. [Google Scholar]
- Dutt, M.; Ananthakrishnan, G.; Jaromin, M.K.; Brlansky, R.H. Evaluation of four phloem-specific promoters in vegetative tissues of transgenic citrus plants. Tree Physiol. 2012, 32, 83–93. [Google Scholar] [CrossRef]
- Song, J.; Wang, D.; Zhang, F. Comparison of the Monte Carlo and guide to uncertainty in measurement methods in estimating measurement uncertainty: Indirect measurement of the CaMV35S promoter in mixed samples of genetically modified soybean. Food Control 2018, 90, 131–139. [Google Scholar] [CrossRef]
- Gittins, J.R.; Pellny, T.K.; Hiles, E.R.; Rosa, C.; James, D. Transgene expression driven by heterologous ribulose-1, 5-bisphosphate carboxylase/oxygenase small-subunit gene promoters in the vegetative tissues of apple (Malus pumila Mill.). Planta 2000, 210, 232–240. [Google Scholar] [CrossRef] [PubMed]
- Robinson, D.J. Environmental risk assessment of releases of transgenic plants containing virus-derived inserts. Transgenic Res. 1996, 5, 359–362. [Google Scholar] [CrossRef]
- Kumpatla, S.P.; Chandrasekharan, M.B.; Iyer, L.M.; Li, G.; Hall, T.C. Genome intruder scanning and modulation systems and transgene silencing. Trends Plant Sci. 2012, 3, 97–104. [Google Scholar] [CrossRef]
- Teng, H.Y. Research progress of drought inducible promoters in rice. Mol. Plant Breed. 2020, 18, 450–458. [Google Scholar]
- Giuliano, G.; Pichersky, E.; Malik, M.P.; Timko, P.A.; Scolnik, A.R. An evolutionarily conserved protein binding sequence upstream of a plant light-regulated gene. Proc. Natl. Acad. Sci. USA 1988, 85, 7089–7093. [Google Scholar] [CrossRef] [PubMed] [Green Version]
- Luo, Y.J.; Li, J.; Zhang, S.; Du, K.J. Research progress of plant promoter. North. Hortic. 2015, 22, 186–189. [Google Scholar]
- Qu, Y.; Zhang, N.; Chang, J.; Jin, X.; Wen, Y.K.; Si, H.J.; Wang, D. Cloning and Functional Analysis of Light-inducible, and Stem and Leaf-specific Expression Promoter ST-LS1 in Potato (Solanum tuberosumL.). J. Agric. Biotechnol. 2013, 21, 828–837. [Google Scholar]
- Kidokoro, S.; Watanabe, K.; Ohori, T.; Moriwaki, T.; Maruyama, K.; Mizoi, J.; Htwe, N.M.P.S.; Fujita, Y.; Sekita, S.; Shinozaki, K.; et al. Soybean DREB1/CBF-type transcription factors function in heat and drought as well as cold stress-responsive gene expression. Plant J. 2015, 81, 505–518. [Google Scholar] [CrossRef]
- Mahajan, S.; Tuteja, N.C. salinity and drought stresses: An overview. Arch. Biochem. Biophys. 2005, 444, 139–158. [Google Scholar] [CrossRef]
- Chen, Y.E.; Liu, W.J.; Su, Y.Q.; Cui, J.M.; Zhang, Z.W.; Yuan, M.; Zhang, H.Y.; Yuan, S. Different response of photosystem II to short and long term drought stress in Arabidopsis thaliana. Physiol. Plantarum. 2016, 158, 225–235. [Google Scholar] [CrossRef]
- Mengarelli, D.A.; Zanor, M.I. Genome-wide characterization and analysis of the CCT motif family genes in soybean (Glycine max). Planta 2021, 253, 1–17. [Google Scholar] [CrossRef]
- Mullineaux, C.W. Function and evolution of grana. Trends Plant Sci. 2005, 10, 521–525. [Google Scholar] [CrossRef]
- Shahmir, F.; Pauls, K.P. Identification gene structure and expression of bnmicemup: A gene upregulated in embryogenic brassica napus microspores. Front. Plant Sci. 2021, 11, 1899. [Google Scholar] [CrossRef] [PubMed]
- Deng, J.; Li, D.; Yin, H.; Ma, L.; Zhang, J.; Zhang, B. Overexpression of GmRIQ2-like (Glyma.04G174400) enhances the tolerance of strong light stress and reduces photoinhibition in soybean (Glycine max (L.) Merr.). Agriculture 2020, 10, 157. [Google Scholar] [CrossRef]
- Spradling, A.C.; Stern, D.; Beaton, A.; Rhem, E.J.; Laverty, T.; Mozden, N.; Misra, S.; Rubin, G.M. The Berkeley Drosophila Genome Project gene disruption project: Single P-element insertions mutating 25% of vital Drosophila genes. Genetics 1999, 153, 135–177. [Google Scholar] [CrossRef] [PubMed]
- Petya, S.; Marieta, T.; Tzveta, G.; Velitchka, G.; Angel, A. A Modified CTAB Method for DNA Extraction from Soybean and Meat Products. Biotechnol. Biotechnol. Equip. 2013, 27, 3803–3810. [Google Scholar]
- Nakamura, S.I.; Suzui, N.; Ito-Tanabata, S.; Ishii, S.; Kawachi, N.; Rai, H.; Hattori, H.; Fujimaki, S. Application of glutathione and dithiothreitol to oil seed rape (Brassica napus L.) roots affects cadmium distribution in roots and inhibits Cd translocation to shoots. Soil Sci. Plant Nutr. 2016, 62, 379–385. [Google Scholar] [CrossRef] [Green Version]
- Xu, H.; Zhou, X.; Lu, J.; Wang, J.; Wang, X. Hairy roots induced by Agrobacterium rhizogenes and production of regenerative plants in hairy root cultures in maize. Sci. China (Ser. C: Life Sci.) 2006, 4, 305–310. [Google Scholar] [CrossRef]
- Clough, S.J.; Bent, A.F. Floral dip: A simplified method for Agrobacterium-mediated transformation of Arabidopsis thaliana. Plant J. 1999, 16, 735–743. [Google Scholar] [CrossRef] [PubMed] [Green Version]
- Jefferson, R.A.; Burgess, S.M.; Hirsh, D. β-Glucuronidase from Escherichia coli as a gene-fusion marker. Proc. Natl. Acad. Sci. USA 1986, 83, 8447–8451. [Google Scholar] [CrossRef] [Green Version]
- Smale, S.T.; Kadonaga, J.T. The RNA polymerase II core promoter. Annu. Rev. Biochem. 2003, 72, 449–479. [Google Scholar] [CrossRef] [PubMed] [Green Version]
- Tian, G.; Wei, D.Y.; Xu, B.B. Advances in Cis-element Analysis and Application of Plant Inducible Promoter Prd29A. Anhui Agri. Sci. Bull. 2020, 26, 32–36. [Google Scholar]
- Alam, J.; Cook, J.L. Reporter genes: Application to the study of mammalian gene transcription. Anal. Biochem. 1990, 188, 245–254. [Google Scholar] [CrossRef]
- Yang, Y.; Li, J.J.; Wang, S.; Qiu, G.Z. Progresses on reporter gene and its application. Life Sci. Res. 2011, 15, 277–282. [Google Scholar]
- Wang, Y.; Yang, Z.W.; Kong, Y.B.; Li, X.H.; Li, W.L.; Du, H.; Zhang, C.Y. GmPAP12 is required for nodule development and nitrogen fixation under phosphorus starvation in soybean. Front. Plant Sci. 2020, 11, 450. [Google Scholar] [CrossRef] [PubMed]
- Zhao, X.B.; Tang, G.Y.; Shan, L. Common methods and progress of plant type II promoter function research. Life Sci. 2013, 6, 40–47. [Google Scholar]
- Zeng, X.L.; Zhao, C.L.; Wen, G.S.; Ding, C.; Zhang, H.L. Research advances in prediction and validation methods for structures and functions of promoters. Mol. Plant Breed. 2018, 16, 3915–3925. [Google Scholar]
- Qin, L.L.; Zhang, X.; Jiang, C.; Li, L.I. Cloning and functional analysis of BpZFP4 Promoter from Birch (Betula platyphylla). Bull. Bot. Res. 2019, 39, 917–926. [Google Scholar]
- Li, H.Y. Cloning and Promoter Function Analysis of Somatic Embryogenesis Related Gene MIR171 in Lily. Doctoral Dissertation, Ornamental Horticulture of Shenyang Agricultural University, Shenyang, China, 2018. [Google Scholar]
- Bai, L.J.; Liu, W.; Wang, Z.L.; Wang, W.T.; Wu, C.X.; Feng, Y.J. Cloning and transient expression analysis of soybean GmbZIP33 gene promoter. Soybean Sci. 2019, 38, 511–516. [Google Scholar]
- Morffy, N.; Strader, L.C. Plant promoter-proximal pausing? Nat. Plants 2021, 7, 862–863. [Google Scholar] [CrossRef]
- Miyano, M.; Sayaman, R.W.; Shalabi, S.F.; Senapati, P.; Lopez, J.C.; Angarola, B.L.; Hinz, S.; Zirbes, O.; Yee, L.D.; Sedrak, M.S.; et al. Breast specific molecular clocks comprised of ELF5 expression and promoter methylation identify individuals susceptible to cancer initiation. Cancer Prev. Res. 2021, 14, 779–794. [Google Scholar] [CrossRef]
- Dell’Aquila, M.; Fiorentino, V.; Martini, M.; Capodimonti, S.; Cenci, T.; Lombardi, C.P.; Raffaelli, M.; Pontecorvi, A.; Fadda, G.; Pantanowitz, L.; et al. How limited molecular testing can also offer diagnostic and prognostic evaluation of thyroid nodules processed with liquid-based cytology: Role of TERT promoter and BRAF V600E mutation analysis. Cancer Cytopathol. 2021, 129, 819–829. [Google Scholar] [CrossRef] [PubMed]
Figure 1.
Schematic diagram of the pCAMBIA3301PGmRIQ2::GUS construct.

Figure 2.
Construction of the recombinant expression vector of the PGmRIQ2 deletion fragment.

Figure 3.
Process of hairy root formation induced by Agrobacterium rhizogenes K599 in soybean cotyledon nodes. (A) Germination. (B) Co-cultivation. (C) Hairy root induction.
Figure 3.
Process of hairy root formation induced by Agrobacterium rhizogenes K599 in soybean cotyledon nodes. (A) Germination. (B) Co-cultivation. (C) Hairy root induction.

Figure 4.
Sequence analysis of the GmRIQ2 promoter (PGmRIQ2). The explanations of the gene sequences marked by different colors and black boxes are shown in Table 4.
Figure 4.
Sequence analysis of the GmRIQ2 promoter (PGmRIQ2). The explanations of the gene sequences marked by different colors and black boxes are shown in Table 4.

Figure 5.
PCR detection of transgenic soybean root tissue and GUS histochemical staining of soybean root tissue. (A) PCR detection of transgenic soybean root tissue. 1–6: different transgenic roots GUS pCAMBIA3301GmRIQ2::GUS PCR amplification bands; +: positive control; −: negative control; M: DNA Marker (DL2000). (B) Transgenic pCAMBIA3301PGmRIQ2::GUS and pCAMBIA3301 soybean roots.

Figure 6.
Detection of transgenic Arabidopsis with the full-length promoter of the GmRIQ2 gene and GUS staining. (A) 5 mg/L PPT resistance screening. (B), PCR detection. M: DNA marker (DL2000); +: positive control; −: negative control; 1–9: pCAMBIA3301GmRIQ2::GUS PCR amplification bands. (C), GUS staining results. 1–4: expression of the GUS gene in the whole plant, rosette leaves, stems and roots of transgenic pCAMBIA3301 Arabidopsis thaliana; 5–8: expression of the GUS gene in the whole plant, rosette leaves, stems and roots of transgenic pCAMBIA3301PGmRIQ2::GUS Arabidopsis thaliana; 9–11: expression of the GUS gene at 4, 6 and 10 days after germination of transgenic pCAMBIA3301PGmRIQ2::GUS Arabidopsis thaliana.

Figure 7.
Detection of transgenic Arabidopsis with the GmRIQ2 gene deletion fragment promoter and GUS staining. (A) PPT resistance screening. (B) a and c: 1–8 PCR amplification bands with annealing temperature of 56 °C; M: DNA marker (DL2000); b: 1–11 PCR amplification bands with annealing temperature of 56 °C. (C) GUS staining results. 1–4: expression of the GUS gene in the whole plant, rosette leaves, stems and roots of transgenic pCAMBIA3301PGmRIQ2-450::GUS; 5–8: expression of the GUS gene in the whole plant, rosette leaves, stems and roots of pCAMBIA3301PGmRIQ2-284: GUS; 9–12: expression of the GUS gene in the whole plant, rosette leaves, stems and roots of pCAMBIA3301PGmRIQ2-194::GUS Arabidopsis thaliana.

Figure 8.
Determination of GUS activity in Arabidopsis thaliana with the full-length promoter of the GmRIQ2 gene transformed by hormone treatment. (A) IAA: 50 μM; (B) ABA and (C) MeJA: 100 μM. The data are shown as the mean ± SE of three independent replicates. * and ** indicate significant difference at 0.05 and 0.01 levels, respectively.

Figure 9.
Hormone treatment after transformation of the GmRIQ2 gene deletion fragment promoter in Arabidopsis GUS. (A) IAA: 50 μM; (B) ABA and (C) MeJA: 100 μM. The data are shown as the mean ± SE of three independent replicates. ** indicate significant difference at 0.01 levels.
Figure 9.
Hormone treatment after transformation of the GmRIQ2 gene deletion fragment promoter in Arabidopsis GUS. (A) IAA: 50 μM; (B) ABA and (C) MeJA: 100 μM. The data are shown as the mean ± SE of three independent replicates. ** indicate significant difference at 0.01 levels.

Figure 10.
Determination of GUS activity of the transformed GmRIQ2 promoter (PGmRIQ2) in Arabidopsis under abiotic stress. (A) Drought: 250 mM mannitol; (B) salt: 200 mM NaCl; (C) high light: 300 μmol/m2/s. The data are shown as the mean ± SE of three independent replicates. ** indicate significant difference at 0.01 levels.

Figure 11.
Effects of hormones on the expression levels of GmRIQ2 in soybean KF16. (A) IAA: 50 μM; (B) ABA and (C) MeJA: 100 μM. The data are shown as the mean ± SE of three independent replicates. * and ** indicate significant difference at 0.05 and 0.01 levels, respectively.
Figure 11.
Effects of hormones on the expression levels of GmRIQ2 in soybean KF16. (A) IAA: 50 μM; (B) ABA and (C) MeJA: 100 μM. The data are shown as the mean ± SE of three independent replicates. * and ** indicate significant difference at 0.05 and 0.01 levels, respectively.


Table 1.
List of primers used for PCR.
| Primer Name | Primer Sequence (From 5′ to 3′) | Tm (°C) |
|---|---|---|
| PGmRIQ2-1661-F | GCTCTAGA(XbarI)CAGCACCAACCAAGCAGTTCTCTC | 55 |
| PGmRIQ2-1661-R | GAAGATCT(BglII)TACCATGAGGTTGCGCCTCAGAACCAGAGT | 55 |
| PGmRIQ2-450-F | GCTCTAGAGC(XbarI)CAGCACCAACCAAGCAGTTCTCTCT | 56 |
| PGmRIQ2-450-R | GAAGATCTTC(BglII)TACCATCCTGTTTGGGATTCTTTTA | 56 |
| PGmRIQ2-284-F | GCTCTAGAGC(XbarI)CAGCACCAACCAAGCAGT | 55 |
| PGmRIQ2-284-R | GAAGATCTTC(BglII)TACCATATTGGCGATTTGACCATG | 55 |
| PGmRIQ2-194-F | GCTCTAGAGC(XbarI)CAGCACCAACCAAGCAGT | 56 |
| PGmRIQ2-194-R | GAAGATCTTC(BglII)TACCATGCTAGGTGCAGGGAAACG | 56 |
| Bar-F | GCGGTACCGGCAGGCTGAAG | 55 |
| Bar-R | CCGCAGGAACCGCAGGAGTG | 55 |
| Medium | PH | Composition |
|---|---|---|
| GM | 5.8 | B5: 3.21 g; sucrose: 20 g; agar: 7.5 g |
| SCCM | 5.4 | Murashige and Skoog (MS): 0.449 g; sucrose: 30 g; MES: 3.9 g; agar: 7.5 g; acetosyringone (As): 100 mg/L; DTT: 154 mg/L |
| RM | 5.6 | MS: 0.449 g; sucrose: 30 g; MES: 0.59 g; agar: 7.5 g; cephalosporins: 250 mg/L |
Table 3.
Primers used for qRT-PCR.
| Primer Name | Primer Sequence (From 5′ to 3′) |
|---|---|
| Actin4-S | GTGTCAGCCATACTGTCCCCATT |
| Actin4-A | GTTTCAAGCTCTTGCTCGTAATCA |
| GmRIQ2-S | GTCACATAAAAACACACCACGA |
| GmRIQ2-A | TGCTTGATATCTCAACTCAGCT |
Table 4.
Predicted positions and functions of cis-regulatory elements in the GmRIQ2 promoter (PGmRIQ2).
Table 4.
Predicted positions and functions of cis-regulatory elements in the GmRIQ2 promoter (PGmRIQ2).
| Element | Core Sequence | Position | Number Present | Function |
|---|---|---|---|---|
| ABRE | ACGTG | 785 (+), 2012 (−) | 2 | Cis-acting element involved in ABA responsiveness |
| ARE | AAACCA | 311 (+), 1661 (+) | 2 | Cis-acting regulatory element essential for anaerobic induction |
| ATCT-motif | AATCTAATCC | 210 (+) | 1 | Part of a conserved DNA module involved in light responsiveness |
| AuxRR-core | GGTCCAT | 998 (−) | 1 | Cis-acting regulatory element involved in IAA responsiveness |
| Box II | CCACGTGGC | 2011 (+) | 1 | Part of a light responsive element |
| CGTCA-motif | CGTCA | 636 (−), 1913 (+) | 2 | Cis-acting regulatory element involved in MeJA responsiveness |
| G-box | CACGTG | 787 (+), 2010 (−) | 2 | Cis-acting regulatory element involved in light responsiveness |
| GATA-motif | AAGGATAAGG | 1862 (+) | 1 | Part of a light responsive element |
| RY-element | CATGCATG | 744 (+) | 1 | Cis-acting regulatory element involved in seed-specific regulation |
| TCT-motif | TCTTAC | 297 (+) | 1 | Part of a light responsive element |
| TGACG-motif | TGACG | 636 (+), 1913(−) | 2 | Cis-acting regulatory element involved in MeJA responsiveness |
Table 5.
Comparison of induction and transformation of hairy roots by different recombinant expression vectors.
Table 5.
Comparison of induction and transformation of hairy roots by different recombinant expression vectors.
| Agrobacterium rhizogenes Type | Number of Explants | Number of Hairy Roots | Positive Number | Conversion Rate | Positive Induction Rate |
|---|---|---|---|---|---|
| pCAMBIA3301PGmRIQ2::GUS | 90 | 38 | 27 | 42.22% | 71.05% |
| pCAMBIA3301::GUS | 90 | 36 | 28 | 40% | 77.78% |
Publisher’s Note: MDPI stays neutral with regard to jurisdictional claims in published maps and institutional affiliations. |
© 2022 by the authors. Licensee MDPI, Basel, Switzerland. This article is an open access article distributed under the terms and conditions of the Creative Commons Attribution (CC BY) license (https://creativecommons.org/licenses/by/4.0/).
Share and Cite
MDPI and ACS Style
Zhang, B.; Yin, H.; Sun, Z.; Song, X.; Deng, J.; Zhang, Q.; Li, D. Cloning and Functional Analysis of the Soybean GmRIQ2 Promoter. Agronomy 2022, 12, 227. https://0-doi-org.brum.beds.ac.uk/10.3390/agronomy12010227
AMA Style
Zhang B, Yin H, Sun Z, Song X, Deng J, Zhang Q, Li D. Cloning and Functional Analysis of the Soybean GmRIQ2 Promoter. Agronomy. 2022; 12(1):227. https://0-doi-org.brum.beds.ac.uk/10.3390/agronomy12010227
Chicago/Turabian StyleZhang, Binbin, Huayi Yin, Zhihui Sun, Xiaohui Song, Jing Deng, Qian Zhang, and Dongmei Li. 2022. "Cloning and Functional Analysis of the Soybean GmRIQ2 Promoter" Agronomy 12, no. 1: 227. https://0-doi-org.brum.beds.ac.uk/10.3390/agronomy12010227
Note that from the first issue of 2016, this journal uses article numbers instead of page numbers. See further details here.