Article

Evolutionary Variation of Accumulative Day Length and Accumulative Active Temperature Required for Growth Periods in Global Soybeans

1
Soybean Research Institute & MARA National Center for Soybean Improvement & MARA Key Laboratory of Biology and Genetic Improvement of Soybean (General) & State Key Laboratory for Crop Genetics and Germplasm Enhancement & Jiangsu Collaborative Innovation Center for Modern Crop Production, Nanjing Agricultural University, Nanjing 210095, China
2
Mudanjiang Branch of Heilongjiang Academy of Agricultural Sciences, Mudanjiang 157041, China
3
Institute of Economic Crops, Guangxi Academy of Agricultural Sciences, Nanning 530007, China
*
Authors to whom correspondence should be addressed.
Submission received: 28 March 2022 / Accepted: 13 April 2022 / Published: 15 April 2022
(This article belongs to the Special Issue Frontier Studies in Legumes Genetic Breeding and Production)

Abstract

:
Soybean (Glycine max (L.) Merr.) is a typical short-day and thermophilic crop. This study aimed to reveal the required accumulative day length (ADL) and accumulative active temperature (AAT) for DSF (days of sowing to flowering) and DFM (days of flowering to maturity) in global soybeans. A sample consisted of 354 varieties from 27 countries in five geographic regions, which were tested in Nanjing, China in two spring-sowing and two summer-sowing seasons. The ADL and AAT were calculated from the climatological data provided by the Public Service of Nanjing Meteorological Bureau. The results showed that the average DSF and DFM of global soybeans were 41.0 d and 83.3 d, which required ADLDSF of 606.6 d·h and AATDSF of 1185.9 d·°C, ADLDFM of 1126.7 d·h and AATDFM of 2145.1 d·°C, respectively, all with a wide variation among/within geographic and MG(maturity-group)-set subpopulations. From the multiple regression of DSF and DFM on required ADL and AAT, the ADL, AAT and ADL×AAT contributed 38.5%, 44.79% and 17.10% to DSF variation and 86.98%, 11.42% and 0.54% to DFM variation, respectively, and their relative importance to DSF and DFM varied among the geographic and MG subpopulations. The geographic subpopulations matched only partially with the genomic marker clusters, indicating multiple genetic sources of each subpopulation and that genetic exchange happened among subpopulations.

1. Introduction

Soybean (Glycine max (L.) Merr.) is a typical short-day and thermophilic crop, and its growth and development are affected by photo-thermal conditions [1,2,3]. Garner [4] discovered the phenomenon of photoperiodism and proposed that photoperiod is an important environmental factor that affects the growth period of soybean. It was shown that temperature is also one of the key factors affecting soybean flowering and maturity [5]. Thus, the two factors, photoperiod and temperature, affect flowering and the development of soybeans, especially, affect the adaptability of soybean varieties to geographic regions, which limits the extension of elite varieties to broad areas.
Soybean originated in China where it has been cultivated for ~5000 years [6], and it is also one of the fastest expanding crops in the world during the past century due to it being rich in protein (~40%) and oil (~20%) contents. The planting area of soybean has expanded to latitudes between 53°N and 35°S [7,8]. Previous studies have shown that soybean originated from Huang-Huai River Valleys or Changjiang River Valleys and its south in China (these two areas are close neighbors) [9,10,11,12]. Thus, the original soybean accessions were not suitable for environments at high and low latitudes. Later, soybeans spread from the center of origin northward to Northeast China then to Russia, eastward to the Korean Peninsula and Japan islands, southward to Southeast Asia, South Asia and Africa, and westward to Europe then to northern North America, southern North America and Central and South America [9]. After long-term adaptation to local geographical and meteorological, as well as sowing seasonal conditions, specific soybean types corresponding to the environment, especially local day length and seasonal temperature, have been developed in different geographical regions. Along with the expansion of soybeans, 13 maturity groups (MGs) have formed globally. The MG system of soybean was first established in 1944 when MGI ~ MGVII were defined; then, the earlier MGs (MG000 ~ MG0) and the later MGs (MGVIII ~ MGX) were added to the system. At present, soybean accessions are divided into MG000 ~ X in a total of 13 MGs [13,14].
Short day length and high temperature promote the reproductive development of soybeans, whereas long day length and low temperature have the opposite effect [4,15,16,17,18,19]. Soybean has been used as a model plant for studies on plant photoperiod responses [4]. Previous studies on the effect of day length and temperature on soybean growth and development were mostly conducted under controlled conditions in labs or in a phytotron with day length and temperature fixed, which were very different from the systematically varied conditions under natural environments in previous experiments. Numerous studies have been reported on photoperiod responses, such as critical photoperiod [20,21], continuous dark phase effects [22,23], the presence of conductive substances [24,25], etc., but these studies mainly focused on the response of DSF to day length and temperature, and there is very little information about the response of DFM to day length and temperature. Thus, questions remain of how DSF and DFM respond to naturally varied day length and temperature, how differences in responses to the changed day length and temperature exist among geographic and MG subpopulations, and whether day length by temperature interaction exists on DSF and DFM. However, under the natural conditions in previous experiments, the effects of day length and temperature are mixed, and researchers have to find a method to evaluate and separate the two main effects from their interactions. An additional concern is that scientists have to find a location where all maturity groups or all soybeans from global geographic regions can grow and develop to finish their life cycle, allowing their DSF and DFM to be compared under an identical environmental background. It was suggested that the accumulative day length (ADL, d·h) and accumulative active temperature (AAT, d·°C) might be suitable indicators for evaluating daily-changed day length and temperature because both involve the measurement of degree and duration for growth periods as well as a life cycle. In statistics, multiple (partial) regression analysis can be used to separate the mixed effect into component factors, and previous studies have also shown that all maturity groups of soybeans can finish their life cycles around Nanjing (or 30–32 °N) in China [26].
The present study aimed at characterizing global soybeans for their growth period (DSF and DFM) response to ADL and AAT as well as their interaction under natural conditions in fields, and further exploring their evolutionary changes among geographic subpopulations and among MG sets to see how soybeans adapted to local environments during their global dissemination. The experiment in this study was conducted under field environment conditions in Nanjing, China. ADL and AAT were used as experienced day length and temperature indicators. The ADL, AAT and ADL × AAT effects and their relative contribution to DSF and DFM were evaluated using multiple regression analysis. Clustering analysis based on genomic markers was performed to evaluate the consistency and difference between genetic differentiation and geographic differentiation regarding the response of their growth periods to ADL and AAT.

2. Materials and Methods

2.1. Plant Materials and Field Experiments

A total of 354 varieties from 27 countries was chosen as a representative sample of the world soybean germplasm population (WSGP) from the germplasm storage at the National Center for Soybean Improvement, Nanjing Agricultural University, Nanjing, China. According to the previous study by Liu et al. [9], the source of the materials was grouped into five regions, coded as O, A, B, C, and D. “O” represents that the materials came from the origin center of the soybean in China, including Huang-Huai River Valleys (HCHN) and Changjiang River Valleys and its south (SCHN). “A” represents that the materials were from the north dissemination route, including Northeast China (NCHN), Far-East Russia (RUFE) and southern Sweden (SSWE). “B” represents that the materials were from the east dissemination route, including the Korean peninsula (KORP) and the Japan islands (JPAN). “C” represents that the materials came from the south dissemination route, including Southeast Asia (SEAS), South Asia (SASI) and Africa (AFRI). “D” represents that the materials were from the west dissemination route, including northern North America (NNAM), southern North America (SNAM) and Central and South America (CSAM). These materials are grouped into 13 maturity groups (MGs, MG 000, 00, 0, I, II, ~ X), in which MG I ~ VII are the primary MG set, mainly from the origin center; MG 000 ~ 0 are the early MG set, derived during the recent century; and MG VIII ~ X are the late MG set derived in the recent couple of centuries [13,14,27]. These three MG sets of 000 ~ 0, I ~ VII and VIII ~ X are designated as E, P and L, respectively (Supplementary Tables S1 and S2).
All varieties were tested in Spring 2015 (April 23 sowing), Spring 2016 (April 25 sowing), Summer 2016 (June 18 sowing) and Summer 2017 (June 22 sowing) at Nanjing Jiangpu Experimental Station (32°07′ N, 118°62′ E), Jiangpu, Nanjing, China. A randomized complete block design with two replications was used with drill sowing, row length 2 m, row spacing 0.4 m, 10 seedlings per row and conventional field management.

2.2. Measurement of Growth-Period Traits

According to Fehr and Caviness [28], the emergence date (Ve), first flowering date (R1) and maturity date (R8) were recorded for all the tested materials. From the data, DSF and DFM were calculated for further analysis.
Daily day length and temperature data were obtained from the Public Service of Nanjing Meteorological Bureau. The daily maximum and minimum temperature were used to calculate the daily average temperature, from which the daily active temperature was calculated as the accumulated daily average temperature over all the days except those less than 10 °C (in fact, all daily average temperature values were more than 10 °C in the present study). At the same time, the daily sunrise time and sunset time were obtained, from which the daily day length was calculated from their difference (Supplementary Figure S1).
The accumulative day length and accumulative active temperature for DSF and DFM were obtained from the summation of daily day length and daily active temperature during the respective periods, which were designated as ADLDSF and AATDSF, and ADLDFM and AATDFM, respectively.

2.3. Statistical Analysis

The DSF, DFM, ADLDSF, ADLDFM, AATDSF and AATDFM for the 4 environments’ 8 blocks were calculated using SAS/STAT 9.4 software package (SAS Institute Inc., Cary, NC, USA). PROC UNIVARIATE was used to perform descriptive statistical analysis on the 6 traits, with their significance among subpopulations tested. PROC GLM was used to perform an analysis of variance (ANOVA) and multiple regression analysis. The linear model of ANOVA is:
y i j k = μ + t i + r j ( i ) + g k + ( g t ) i k + ε i j k ,
where µ is the population mean, gk is the effect of the kth genotype, ti is the effect of the ith environment, rj(i) is the jth block effect in the ith environment, (gt)ik represents the interaction effect between ith genotype and jth environment and εijk is the residual. The heritability was estimated as [29]:
h 2 = σ g 2 / ( σ g 2 + σ g e 2 / n + σ ε 2 / n r ) ,
where σ g 2 is the genotypic variance, σ g e 2 is the variance of genotype-by-environment interaction, σ ε 2 is the error variance, n is the number of environments and r is the number of replications. The genetic coefficient of variation is calculated as GCV (%) = σg/μ × 100%.
The multiple regression model was:
y i = a + b 1 x 1 i + b 2 x 2 i + b 12 x 1 i x 2 i + ε i ,
where yi, x1i and x2i are BLUP values of ith genotype for a growth period trait, a is the intercept, b1, b2 and b12 are corresponding regression coefficients and εi is the random residual following N(0, σ2). Here, x1i and x2i represent ADL and AAT values, whereas x1ix2i represents the interaction or correlation between x1 and x2, assuming the three terms are independent of each other.
The phenotypic variation of DSF or DFM explained by required ADL, AAT and their product was estimated as:
R 2 S 1 / ( S 1 + S 2 + S 12 ) R 2 S 2 / ( S 1 + S 2 + S 12 ) R 2 S 12 / ( S 1 + S 2 + S 12 )
where R2 is the coefficient of determination of the multiple regression model, S1 is the sum of squares of ADL, S2 is the sum of squares of AAT and S12 is the sum of squares of the product of ADL and AAT.

2.4. SNP Genotyping and Clustering Analysis

Restriction-site-associated DNA sequencing (RAD-seq) was conducted at BGI Tech, Shenzhen, China for genotyping the materials, which has been reported in Liu et al. [9,30]. A total of 97,706 SNPs were finally obtained for the 354 varieties and then divided into SNPLDB (SNP linkage disequilibrium block) genomic markers using the software RTM-GWAS [31,32] under linkage disequilibrium D′ > 0.7 criterion. The SNPLDB marker is characterized by multiple haplotypes, which is especially appropriate for the germplasm population. Finally, 15,954 SNPLDB markers, each with 2~13 haplotypes, were identified.
A genetic similarity coefficient matrix was constructed with SNPLDB data using the corresponding program in RTM-GWAS (https://github.com/njau-sri/RTM-GWAS, accessed on 16 June 2021 [33]). Based on the genetic similarity coefficient matrix, a neighbor-joining cluster analysis of the global soybeans was conducted using MEGA 7.0 software (Mega Limited, Auckland, New Zealand) [34].

3. Results

3.1. Wide Variation of ADL and AAT Required for DSF and DTM in Global Soybeans

Under field environment conditions, it is presumed that the experienced ADL and AAT are essential for the appropriate growth period. The DSF and DFM with their required ADL and AAT are shown in Figure 1, which showed a linear positive correlation for DSF on ADLDSF and AATDSF, and for DFM on ADLDFM and AATDFM. This indicated that more ADL and AAT are required for longer DSF and DFM. The analysis of variance for DSF, ADLDSF, AATDSF, DFM, ADLDFM and AATDFM showed that significant variations existed among genotypes, environments and genotype-by-environment interactions (GEIs), respectively. In particular, variations among environments and GEIs were mainly due to the different sowing seasons (spring-sowing and summer-sowing) involved (Supplementary Table S3).
The present study concentrated on the main effect of ADL and AAT on DSF and DFM, leaving the environment and GEI for future studies. The average DSF of the global soybeans was 41.0 d (32.1% of the entire growth period, i.e., days from sowing to maturity) with a wide range of 20.6–95.5 d and high heritability (h2 95.7%). The global soybeans required an average ADLDSF of 606.6 d·h (day·hour) for flowering (with h2 95.8%), which was about 34.1% of the ADL for the entire growth period. ADLDSF varied greatly among global soybeans with a wide range of 311.7–1382.3 d·h. The global soybeans required an average AATDSF of 1185.9 d·°C for flowering (with h2 99.2%), which was about 34.8% of the AAT for entire growth period. AATDSF varied also greatly with a range of 622.6–2726.2 d·°C (Table 1).
The average DFM of the global soybeans was 83.3 d (67.9% of the entire growth period) with a wide range of 45.8–114.6 d, and h2 of 80.7%. The global soybeans required an average ADLDFM of 1126.7 d·h for flowering maturity (with h2 78.5%), about 65.9% of the ADL for the entire growth period. ADLDFM ranged in 652.0–1487.4 d·h and varied greatly. The global soybeans required an average AATDFM of 2145.1 d·°C (day·°C) for flowering-maturity (with h2 70.9%), about 65.2% of the AAT for the entire growth period. AATDFM ranged in 1251.5–2755.2 d·°C and varied also greatly (Table 1). Thus, the reproductive growth period needs about two times the ADL and AAT of the vegetative growth period on average. However, depending on geographical origin and maturity group, the ADL and AAT of DSF and DFM varied greatly among global soybeans, as global soybeans adapted to their respective local day length and temperature conditions. The maximums of DSF, ADLDSF and AATDSF were 4.64, 4.43 and 4.38 times of their minimums, whereas the maximums of DFM, ADLDFM and AATDFM were 2.52, 2.28 and 2.20 times their minimums, respectively. This suggested that the vegetative growth stage (DSF) is more sensitive to environmental resources, whereas the reproductive stage (DFM) is more stable for its required environmental resources.

3.2. Evolutionary Changes from the Center of Origin to Various Geographic Regions in ADL and AAT Required for Growth-Period Traits in Global Soybeans

From the center of origin O (HCHN and NCHN), soybean was disseminated northward to A (NCHN, RUFE and SSWE), and the average DSF decreased from 41.9 d to 26.4 d, with ADLDSF reduced significantly from 621.9 d·h (ranging 388.4~1098.8 d·h) to 397.5 d·h (ranging 311.7~552.5 d·h) and AATDSF reduced significantly from 1211.1 d·°C (ranging 763.5~2202.8 d·°C) to 785.4 d·°C (ranging 622.4~1077.6 d·°C). The DFM decreased from 88.1 d to 66.5 d on average, with ADLDFM reduced significantly from 1191.9 d·h (ranging 834.0~1479.4 d·h) to 936.2 d·h (685.0~1274.8 d·h) and AATDFM reduced from 2289.7 d·°C (ranging 1661.1~2694.1 d·°C) to 1814.7 d·°C (ranging 1339.8~2477.6 d·°C) (Table 1).
Soybean was disseminated eastward from the center of origin O to B (KORP and JPAN), and the DSF decreased from 41.9 d to 38.1 d on average, with ADLDSF reduced to 565.9 d·h (ranging 368.6~975.7 d·h) and AATDSF reduced to 1105.5 d·°C (ranging 734.5~1883.9 d·°C). The DFM decreased from 88.1 d to 85.1 d on average, with ADLDFM reduced to 1159.1 d·h (ranging 652.0~1476.4 d·h) and AATDFM reduced to 2228.1 d·°C (ranging 1251.5~2732.9 d·°C) (Table 1).
Soybean was disseminated southward from the center of origin O to C (SEAS, SASI and AFRI), the DSF increased from 41.9 d to 70.6 d on average, with ADLDSF increasing significantly to 1035.4 d·h (ranging 579.0~1382.3 d·h), and AATDSF increased significantly to 2017.8 d·°C (ranging 1125.4~2726.2 d·°C). The DFM changed from 88.1 d to 87.8 d on average, with ADLDFM reduced significantly to 1120.8 d·h (859.5~1458.0 d·h) and AATDFM changed to 2016.9 d·°C (ranging 1437.5~2715.7 d·°C) (Table 1).
Soybean was disseminated westward from the center of origin O to D (NNAM, SNAM and CSAM), the DSF decreased from 41.9 d to 39.4 d on average, with ADLDSF reduced to 584.9 d·h (ranging 336.8~1372.7 d·h) and AATDSF increased significantly to 1143.7d·°C (ranging 661.3~2708.3 d·°C). The DFM changed from 88.1 d to 88.7 d on average, with ADLDFM reduced significantly to 1200.6 d·h (746.8~1487.4 d·h) and AATDFM changed to 2289.8 d·°C (ranging 1449.1~2755.2 d·°C) (Table 1).
In summary, DSF, ADLDSF and AATDSF decreased significantly in the northward dissemination of soybean from the center of origin but increased significantly in the southward dissemination. DFM, ADLDFM and AATDFM decreased significantly also in the northward dissemination, but no significant change was observed for ADLDFM and AATDFM in the southward dissemination. In the eastward and westward dissemination, the reductions in or changes of ADL and AAT for both DSF and DFM were not as large as the former two dissemination regions. Among the four dissemination routes, D was the most recent one but with the widest variation in DSF and DFM along with their variation of required ADL and AAT, indicating a very wide extension and a fruitful breeding effort, especially extending and adapting to South America. The relationship between DSF/DFM and ADL/DFM can also be observed roughly in Figure 1, in which the linear gradients for DSF was generally higher than those for DFM and both varied among subpopulations for DSF and DFM, respectively.
In this study, the percentage of ADLDSF (PDLDSF) and the percentage of ADLDFM (PDLDFM) to the total ADL required for the entire growth period were used to evaluate the relative amounts of ADL for DSF and DFM, respectively. The relative amounts of AAT for DSF and DFM were defined in the same way and referred as PATDSF and PATDFM, respectively. The PDLDSF in O, B and D (34.2%, 32.9% and 32.2%, respectively) was at about the same level but was significantly lower in A (29.9%) and significantly higher in C (47.7%) than that in O, B and D. The PATDSF was similar to PDLDSF and was also at about the same level in O, B and D (34.5%, 33.2% and 32.8%, respectively) but lower in A (30.3%) and higher in C (49.8%). The PDLDFM was also at about the same level for O, B and D (65.8%, 67.1% and 67.8%, respectively) but was significantly lower in A (70.1%) and significantly higher in C (52.3%) than in O, B and D. The PATDFM was also similar to PDLDFM, with O, B and D at the same level (65.5%, 66.8% and 67.2%, respectively) and lower in A (69.7%) and higher in C (50.2%) (Table 1). Therefore, the patterns of required ADL and AAT were different among the geographic regions as well as between DSF and DFM.

3.3. Evolutionary Changes from the Primary MG Set to Early and Late MG Sets in ADL and AAT Required for Growth-Period Traits in Global Soybeans

As MGs are mainly determined by geographic regions in addition to local sowing seasons, evolutionary changes in ADL and AAT for MG sets are related to those for geographic changes. The primary maturity groups of soybeans in the center of origin were MG I~VII, but after its dissemination northward and southward and adaption to local conditions, the MG was expanded to MG 000~0 and MG VIII~X. In this study, MG I~VII was simplified as primary MG set, and MG 000~0 and MG VIII~X were simplified to emerged-early MG set and emerged-late MG set, respectively.
From the primary MG set to the emerged-early MG set, the average DSF decreased from 39.1 d to 23.0 d (Table 2), with ADLDSF reduced significantly from 580.5 d·h (ranging 336.8~1285.2 d·h) to 346.0 d·h (ranging 311.7~418.9 d·h) and AATDSF reduced significantly from 1132.8 d·°C (ranging 638.2~2539.0 d·°C) to 691.3 d·°C (ranging 622.6~819.1 d·°C). The average DFM decreased from 85.7 d to 55.6 d, with ADLDFM reduced significantly from 1165.0 d·h (ranging 652.0~1476.4 d·h) to 791.5 d·h (ranging 685.0~1006.8 d·h) and AATDFM reduced significantly from 2235.1 d·°C (ranging 1252.0~2755.0 d·°C) to 1514.9 d·°C (ranging 1340.0~1931.0 d·°C) (Table 2).
From the primary MG set to the emerged-late MG set, the average DSF increased from 39.1 d to 77.5 d, with ADLDSF increased significantly to 1129.6 d·h (ranging 751.7~1382.3 d·h) and AATDSF increased significantly to 2213.7 d·°C (ranging 1458.5~2726.2 d·°C). The DFM changed from 85.7 d to 87.6 d on average, but this was not significant; ADLDFM changed to 1099.7 d·h (ranging in 895.5~1487.4 d·h), which was not significant either, and AATDFM reduced significantly to 1920.6 d·°C (ranging in 1437.0~2700.0 d·°C) (Table 2).
The DSF, ADLDSF and AATDSF all decreased significantly from the primary MG set to the emerged-early MG set, and increased significantly in the emerged-late MG set. The DFM, ADLDFM and AATDFM decreased significantly from the primary MG set to the emerged-early MG set and decreased significantly from the primary MG set to the emerged-late MG set. That indicated that the emerged-late MG set reduced ADL and AAT for DFM in comparison to the primary and early MG sets.
The PDLDSF and PATDSF of the primary MG set were 32.8% and 33.2%, whereas PDLDFM and PATDFM were 67.2% and 66.8%, respectively. The PDLDSF and PATDSF, as well as PDLDFM and PATDFM, of the emerged-early MG set were similar to those of the primary MG set (30.5% and 31.4%, as well as 69.5% and 68.5%, respectively). However, the PDLDSF and PATDSF of the emerged late MG set increased to 50.7% and 53.6%; accordingly, PDLDFM and PATDFM decreased to 49.3% and 46.4%, respectively. Therefore, in the late MG set, the required day length and temperature resources for DSF increased, but the required day length and temperature resources for DFM decreased (Table 2).

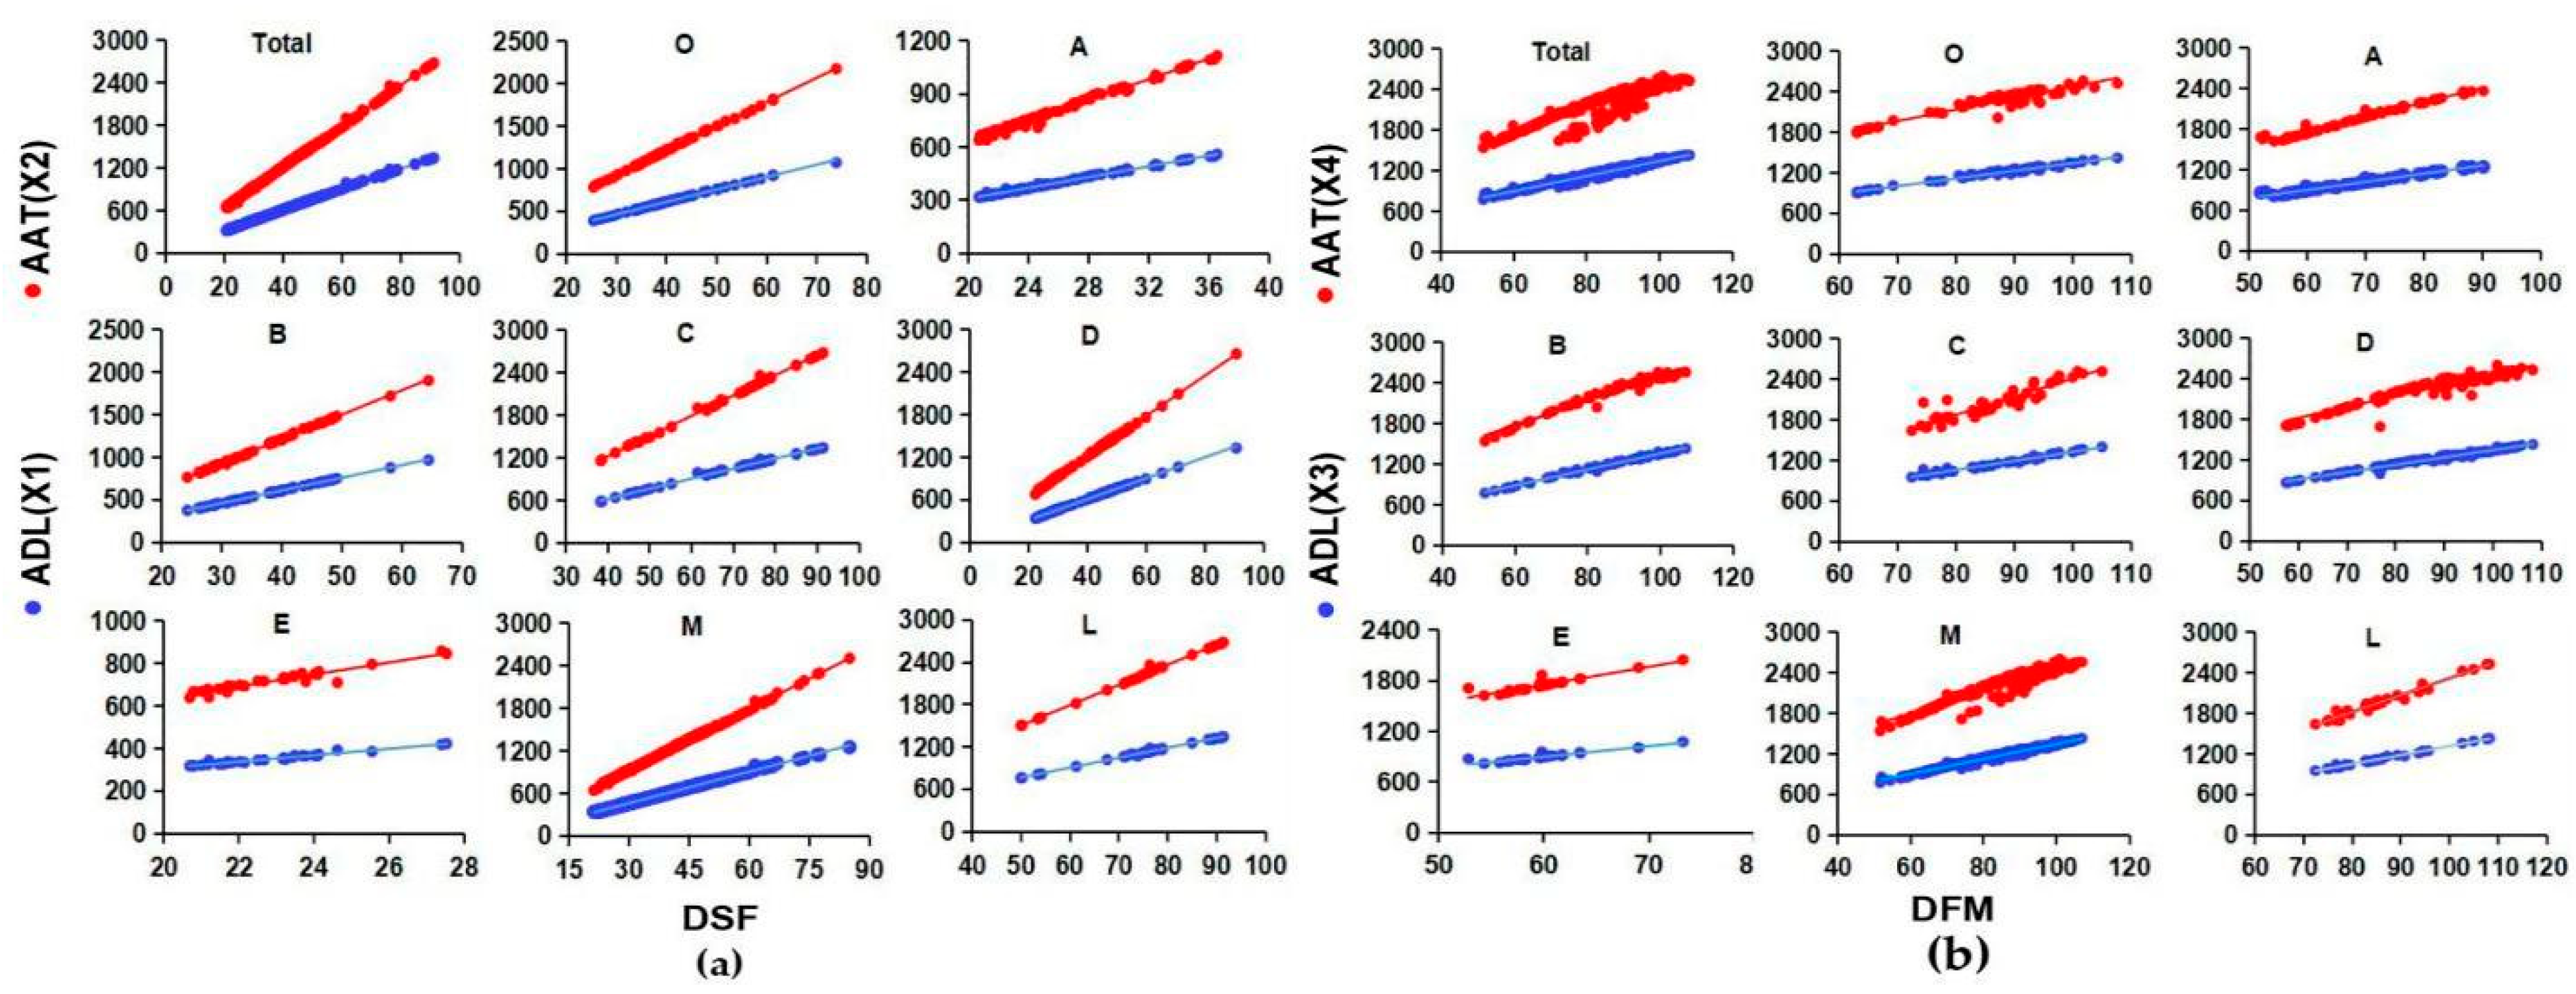
3.4. Relative Importance of ADL, AAT and ADL×AAT in Determining Growth Periods of Geographic and MG Subpopulations

Although the role of day length in DSF or transferring from vegetative growth to flowering development has been reported, there has been very little research on the role of day length in DFM or the reproductive period. Here, multiple regression analysis was used to evaluate the relative importance of ADL, AAT and ADL × AAT to DSF and DFM. In multiple regression of DSF or DFM on ADL and AAT, the contribution of the independent variables (ADL and AAT) to the dependent variable (DSF or DFM) can be estimated to include three parts, i.e., contribution from ADL(x1), from AAT(x2) and the correlation/interaction between ADL and AAT (ADL × AAT or x1x2). The regression model is as Equation (3), where x1x2 represents the correlation or interaction between x1 and x2, but assuming x1, x2 and x1x2 are independent from each other [35].
In the whole population, the ADLDSF, AATDSF and (ADL × AAT)DSF contributed 38.05%, 44.79% and 17.10% variation to DSF, which indicated that, in addition to ADLDSF, AATDSF was somewhat more important to DSF variation, and their interaction (ADL × AAT)DSF accounts for a certain part to DSF variation (Table 3).
The relative contributions of ADL, AAT and (ADL × AAT) to DSF and DFM varied among the geographic subpopulations. In O, A, B, C and D, DSF was composed of 29.33%, 67.51%, 84.79%, 0.54% and 44.66% contribution from ADLDSF, and 15.38%, 23.65%, 0.23%, 97.56% and 19.92% contribution from AATDSF, and 55.25%, 8.55%, 14.89%, 1.66% and 35.37% contribution from (ADL × AAT)DSF, respectively. Therefore, in O and D, DSF was characterized with higher contribution from (ADL × AAT)DSF interaction or joint ADL-AAT contribution (55.23% and 35.37%, respectively). In A and B, DSF was characterized with higher contribution from ADLDSF (67.51% and 84.79%, respectively). In C, DSF was characterized with higher contribution from AATDSF. Thus for DSF, ADLDSF is most important for A and B subpopulations, and AATDSF is most important for C subpopulations, whereas (ADL × AAT)DSF is more important for O and D subpopulations, or the importance of accumulative day length ADLDSF varied among geographic subpopulations. In other words, during the evolutionary process, from O to the subregions, the major contributor to DSF changed from (ADL × AAT)DSF to ADLDSF in A, B and D, and to AATDSF in the C subregion (Table 3, Supplementary Tables S4 and S5).
The regression of DFM on ADLDFM and AATDFM in each geographic group showed that in O, A, B, C and D, DFM was composed of 88.69%, 1.57%, 71.87%, 93.24% and 82.30% contribution from ADLDFM, 9.57%, 34.44%, 27.43%, 4.25% and 16.26% contribution from AATDFM, and 0.52%, 62.30%, 0.07%, 1.07% and 0.97% contribution from (ADL × AAT)DFM, respectively. Therefore, in O, B, C and D, DFM was characterized with higher contribution from ADLDSF, whereas only in A was DFM characterized with higher contribution from (ADL × AAT)DFM and AATDFM (62.30% and 34.44%). Thus, for DFM or turning from flowering to maturity, ADLDFM is most important for all subregions except A, whereas (ADL × AAT)DFM and AATDFM are the most important for the A subpopulation. Therefore, during the evolutionary process, from O to the subregions, the major contributor to DFM remained as ADLDFM in O, B, C and D, except A, in which it changed to (ADL × AAT)DFM (Table 3, Supplementary Tables S4 and S5).
For MG sets, the regression of DSF on ADLDSF and AATDSF showed that AATDSF contributed the most to DSF in the primary MG set (54.30%) and the emerged-late MG set (84.74%), whereas ADLDSF contributed the most to DSF in the emerged-early MG set (71.35%). The regression of DFM on ADLDSF and AATDSF showed that ADLDFM contributed the most to DFM in the primary MG set (78.64%) and the emerged-late MG set (93.98%), whereas (ADL × AAT)DFM and ADLDFM contributed majorly to the emerged-early MG set (47.25% and 39.08%, respectively). Thus, the AAT was important to DSF in primary and emerged-late MG sets, but the ADL was most important to DSF in the emerged-early MG set. The ADL was most important to DFM in primary and emerged-late MG sets, but (ADL × AAT)DFM and ADLDFM were more important to DFM in the emerged-early MG set (Table 3, Supplementary Tables S4 and S5).

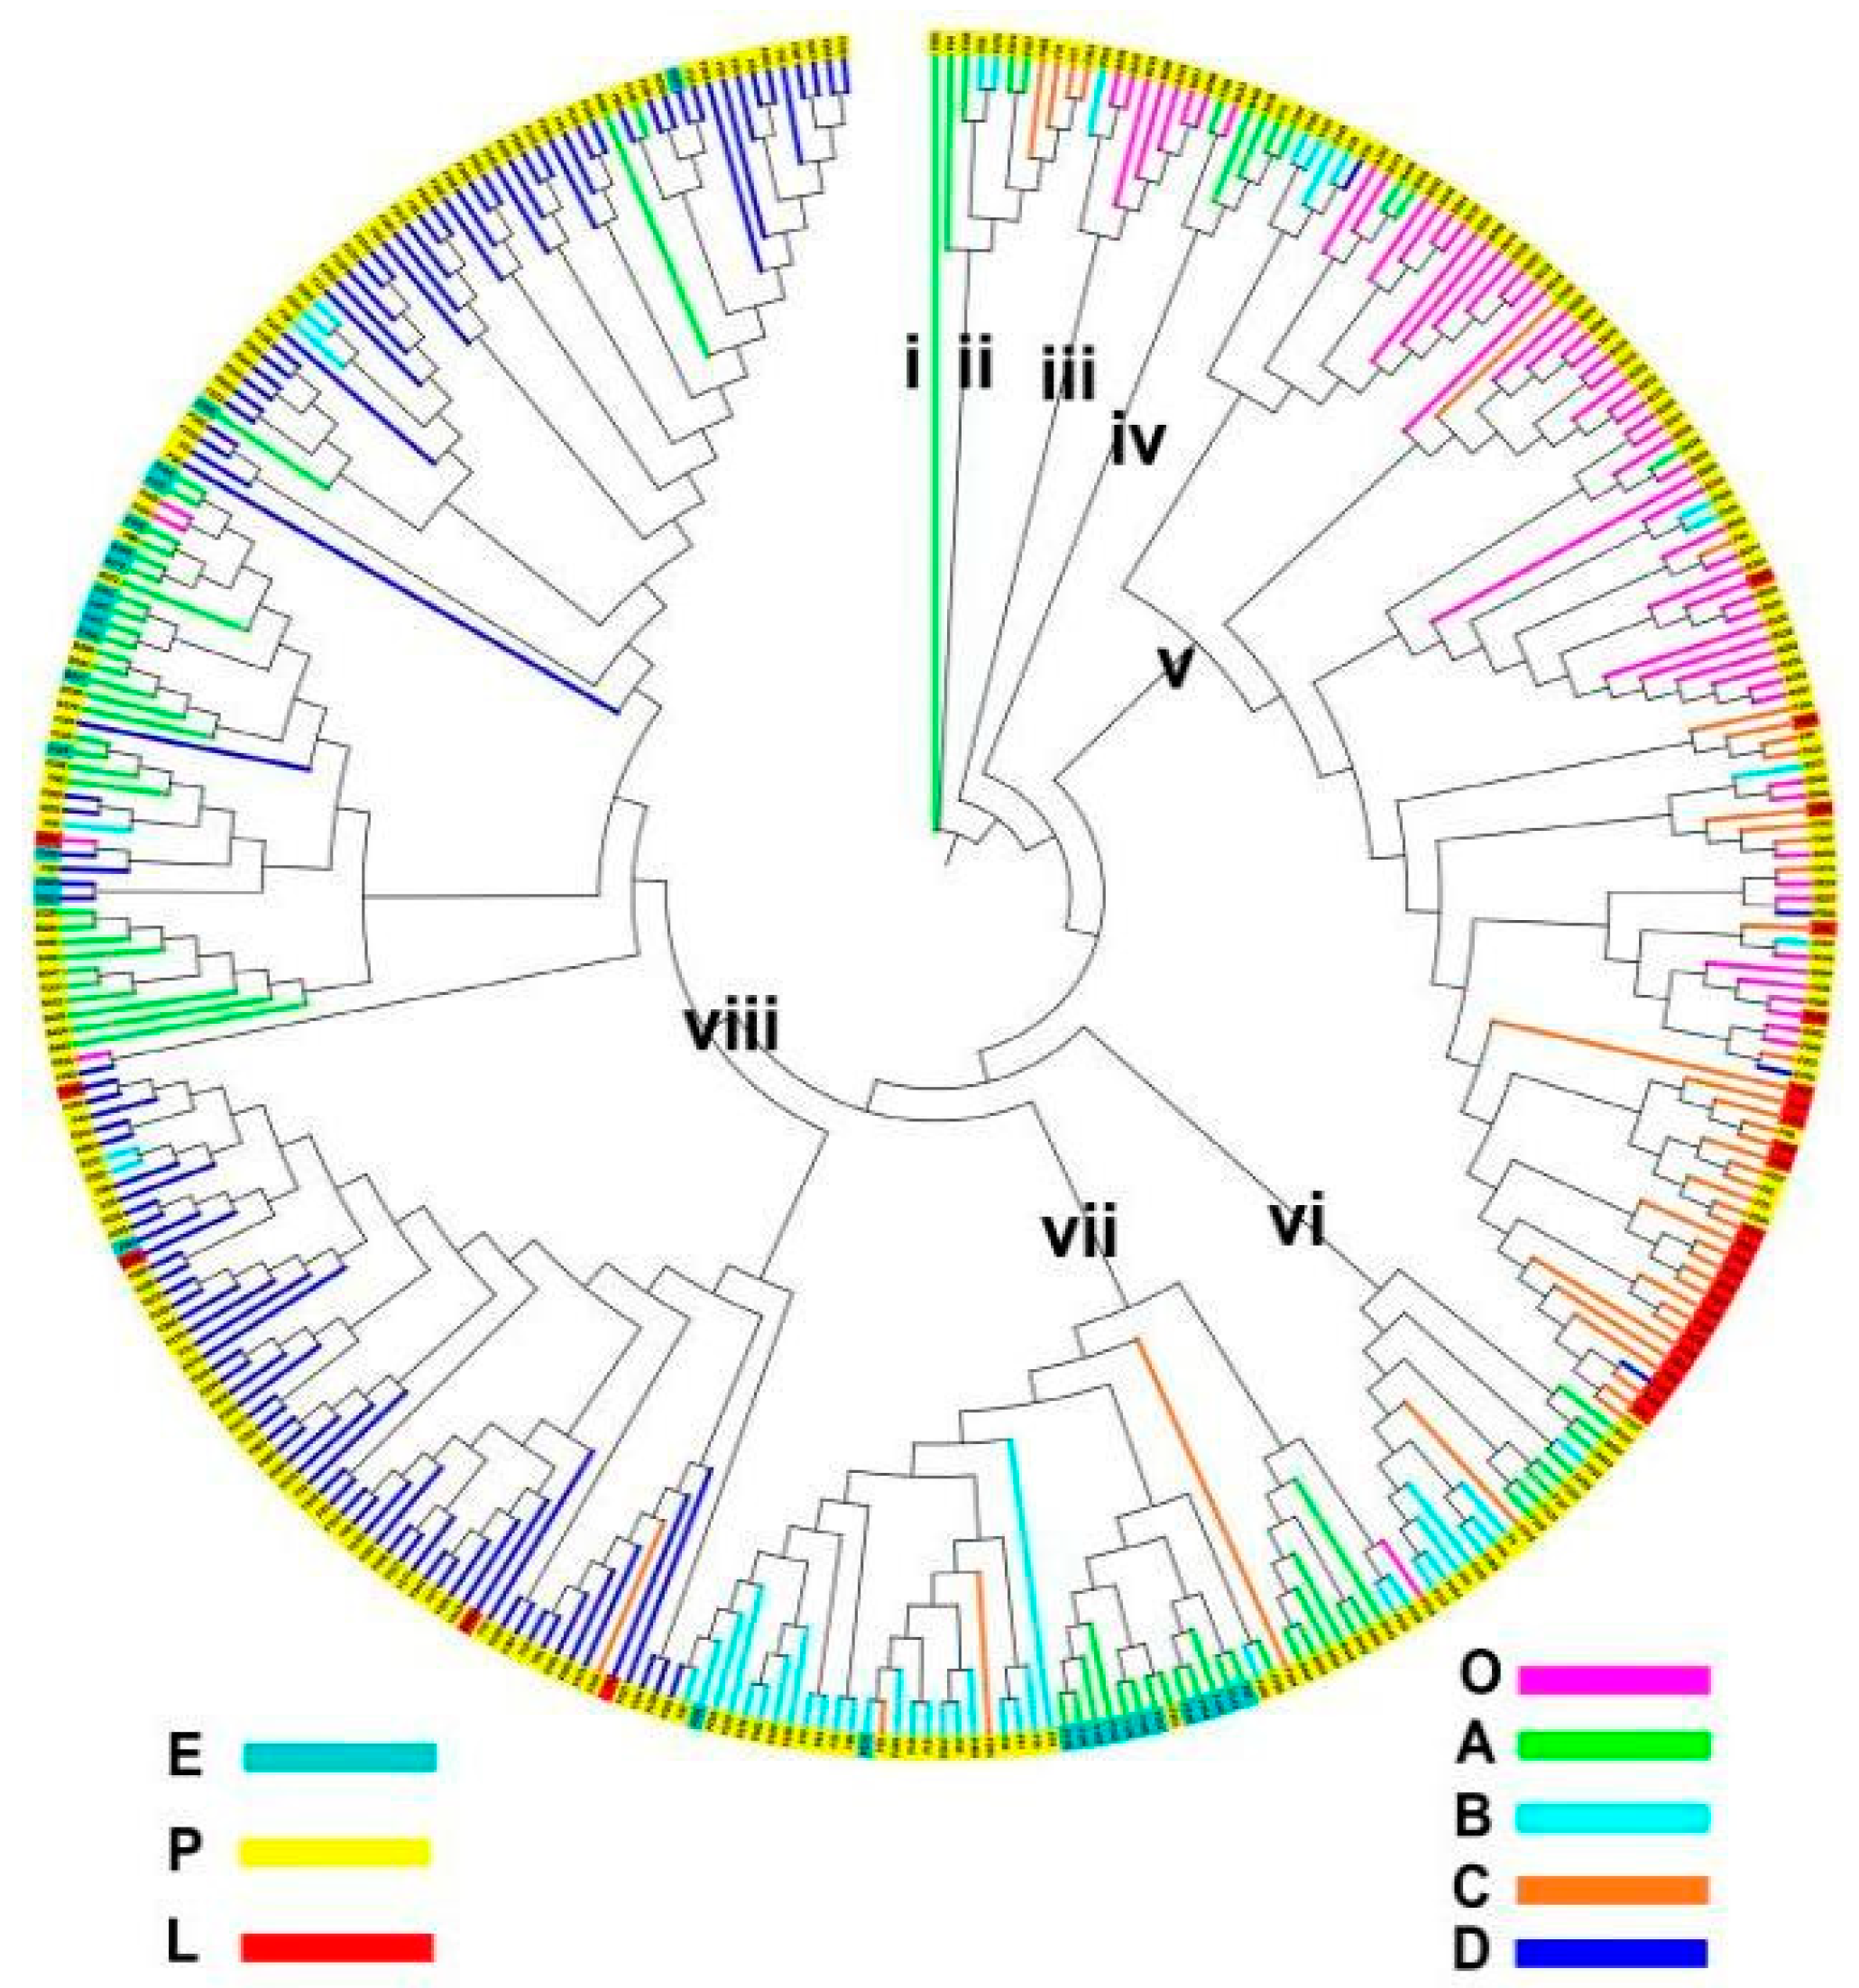
3.5. Genetic Clustering of the Global Soybeans and ADL and AAT Variation among and within the Clusters

According to He et al. [33], the 97,706 SNPs were grouped into 15,954 SNPLDB markers each with 2~13 haplotypes/alleles. Neighbor-Joining tree analysis based on SNPLDB markers showed that the 354 varieties may be grouped into eight clusters (Figure 2, Table 4). Among these clusters, clusters i~iv are minor ones consisting of only 1 to 10 varieties as neighboring clusters of geographic regions O, A, B and C, mainly in the primary MG set. Clusters v~viii are the major ones, consisting of 104, 17, 52 and 156 varieties, respectively. In cluster v, the varieties were mainly from the center of origin O (52) and southward route region C (37), containing mainly primary MG set varieties (79) and emerged-late MG set varieties (25), indicating O and C having a close genetic relationship. In clusters vi and vii, the varieties are mainly from northward and eastward route regions A and B, including a major part from the primary MG set and some from the emerged-early MG set. Cluster viii was the largest one, consisting of 156 varieties, mainly from northward and westward route regions, A (33) and D (112), indicating that A and D have a close genetic relationship, including a major part of varieties belonging to the primary MG set; both emerged early (17) and the late MG set (5) was involved. Here, the varieties in region A have most of their genetic sources from the center of origin O, but A has separated from O and is becoming close to B and D. Therefore, in current global soybeans, there are two major cluster groups: one is cluster v, containing mainly O and C varieties, and the other is clusters vi, vii and viii, containing mainly A, B and D varieties. All the emerged-early and -late MG sets are included in clusters v~viii. The genetic clustering was not parallel to geographic differentiation, and the ADL and AAT required for DSF and DFM on average did not vary obviously among the eight clusters, with no significant difference in ADLDFM and AATDFM, respectively.
Here, the two major clusters were inspected for their ADL and AAT required (Supplementary Table S6). The soybeans in cluster v showed that ADLDSF was 794.9 d·h (ranging 399.0~1382.0 d·h), and AATDSF was 1552.1 d·°C (ranging 805.0~2726.0 d·°C). The ADLDFM was 1152.8 d·h (ranging 834.0~1479.4 d·h) and AATDFM was 2160.4 d·°C (ranging 1437.0~2733.0 d·°C). The soybeans in cluster viii showed that ADLDSF was 536.0 d·h (ranging 312.0~1099.0 d·h), and AATDSF was 1049.8 d·°C (ranging 628.0~2203.0 d·°C), whereas ADLDFM was 1138.1 d·h (ranging 731.0~1478.4 d·h) and AATDFM was 2175.0 d·°C (ranging 1419.0~2755.0 d·°C). The required ADL and AAT in Cluster v and viii had their ranges extended more than that of their component regions.
In summary, the inconsistency between geographic subpopulations and genomic clusters indicated the existence of multiple genetic sources in each subpopulation and genetic exchange happened already among the subpopulations.

4. Discussion

4.1. Separating Phenological Traits into Degree and Duration of Accumulative Day Length and Accumulative Active Temperature (ADL and AAT) Helped to Understand Directly the Functions of Eco-Factors in Geographic Dissemination Process

DSF and DFM are important phenological and evolutionary traits. The present study separates the two traits into the degree and duration of two basic environment factors of day length (ADL) and effective temperature (AAT), respectively. The responses of growth-period traits (DSF and DFM) to ADL and AAT in global soybeans were analyzed, and then the evolutionary changes among geographic subpopulations and among MG sets were explored to see how adaptation occurred in soybeans during their global dissemination.
The results showed both wide ranges of DSF and DFM in global soybeans with an average DSF of 41.0 d and DFM of 83.3 d, respectively. The average ADLs required for DSF and DFM were 606.6 d·h and 1126.7 d·h, and the average AATs were 1185.9 d·°C and 2145.1 d·°C, respectively. About 34.1% and 65.9% of the total ADL(d·h) were required for vegetative and reproductive growth, whereas 34.8% and 65.2% were required for AAT, respectively. In northward dissemination from the center of origin, both DSF and DFM with their required ADL and AAT were reduced; this was consistent with previous studies on the vegetative period and reproductive period of northern spring soybean, shortened with the delay of phenological period [36,37], but in southward dissemination, DSF with its ADL and AAT increased, whereas DFM with its ADL and AAT did not change or changed slightly less. However, no obvious changes were found in eastward and westward dissemination. In comparison with the primary MG set, the late MG set increased their requirements of ADL for DSF but decreased their requirement of ADL and AAT for DFM.
To extend soybeans to further high or low latitude, breeding for earliness and long juvenile period are required, respectively. In global soybeans, the entire growth period (DSF + DFM) of the earliest variety N27294 was 70.2 d (22.4 + 47.8), with the total ADL of 1021.9 d·h (336.9 + 685.0) and AAT of 1987 (653.2 + 1339.8) d·°C. For the latest variety, N341262, the entire growth period was 173.7 d (93.2 + 80.5), with a total ADL of 2326.5 d·h (1349.4 + 977.1) and AAT of 4265.0 d·°C (2664.1 + 1600.9). The latter requires almost 2.2 times of the former. Human intervention is required to obtain distinct extremes. In the global population, the lowest ADL and AAT were 311.7 d·h and 622.4 d·°C for DSF and 652.0 d·h and 1251.5 d·°C for DFM, respectively; altogether, an ADL of 963.7 d·h and AAT of 1873.9 d·°C might finish a life cycle. The largest ADL and AAT were 1382.3 d·h and 2726.2 d·°C for DSF and 1487.4 d·h and 2755.2 d·°C for DFM, respectively; altogether, ADLs of 2869.7 d·h and 5481.4 d·°C might also finish a life cycle. The latter required almost 3 times that of the former. Thus, it implies that using ADL and AAT might achieve further progress than using DSF and DFM in breeding for earlier emergence and/or longer juvenile period soybeans.
In addition to the merit of using ADL and AAT in studying the variety’s requirements for and functions of eco-factors in the geographic dissemination process and breeding for phenological traits of soybean, it might also benefit the understanding and utilization of the properties of phenological traits in cultivation. Tan et al. [38] reported an investigation of the long-term soybean phenology data and climate-related data collected at 51 stations across China from 1992 to 2018, which showed that the growth-period traits varied along with the climate changes. Their results indicated that the average temperature (0.34 ± 0.09 °C/decade) increased, but cumulative sunshine hours decreased (−33.98 ± 1.05 h/decade); the vegetative growth period shortened (−0.52 ± 0.24 d/decade), but the reproductive growth period slightly extended (0.05 ± 0.26 days/decade); and the trends in soybean key growth periods diverged among regions. It seems that this study has noticed the influence of climate changes (average temperature and cumulative sunshine hours) on growth periods, which are similar to our ADL and AAT, but it focused on the influence of environmental changes on growth-period traits, whereas our study emphasized on the required ADL and AAT for different regional soybean varieties. Since day length and temperature are the main environmental factors affecting soybean growth period varied among geographic regions [1,2,3,4,5], soybeans from different eco-regions have different responses to climate changes. Combining ours and Tan et al.’s results, it is suggested that growth periods might be predicted for future soybean production, utilizing the required ADL and AAT information of global varieties and predicted climate changes (predicted ADL and AAT) in different regional sites.

4.2. The Relative Importance of ADL, AAT and ADL×AAT in Determining Growth Period Traits and the Understanding of ADL × AAT Function

The present study also featured the detection of ADL × AAT effect based on separating DSF and DFM into their components of ADL and AAT, for which multiple regression was used to estimate the ADL, AAT and ADL × AAT effects and their relative contribution to explore their relative importance in the adaptation of soybeans to various geo-regions. The results showed that, in global soybeans, the contribution patterns of ADL, AAT and ADL × AAT were different for DSF and DFM variation. For DSF variation, AAT contributed the most (44.79%), whereas ADL and ADL × AAT contributed 38.50% and 17.10% variation, respectively. For DFM variation, ADL contributed the most (86.98%) with AAT and ADL × AAT contributed 11.42% and 0.54% variation, respectively. During the evolutionary dissemination, from O to the geo-regions, the major contributor for DSF variation changed from ADL × AAT to ADL in A, B and D and AAT in the C sub-region, whereas for DFM, its major contributor remained as ADL in O, B, C and D, but was changed to ADL × AAT in A. For DSF variation in different MGs, AAT was important to DSF variation in primary and late MG sets, but ADL was most important to DSF variation in the early MG set. For DFM variation in different MGs, ADL was most important to DFM variation in primary and late MG sets, but ADL × AAT and ADL were more important to DFM variation in the early MG set.
The contribution of ADL and AAT to DSF or DFM are easy to understand independently, but the contribution of ADL × AAT to DSF or DFM needs to be explained. It means ADL and AAT joint contribution or their correlated/interacted contribution, a positive ADL × AAT indicates ADL and AAT contributing to DSF or DFM in the same direction while a negative ADL × AAT indicates ADL and AAT contributing to DSF or DFM in an opposite direction. For example, in the global population, ADL, AAT and ADL × AAT contributed 38.05%, 44.79% and 17.10% to DSF variation, respectively, in which 17.10% DSF variation was due to ADL × AAT. Here, the regression coefficient of (ADL × AAT)DSF was negative, which means that, in this contribution, the ADL and AAT have a negative correlation or interaction, contributing to DSF or DFM in an opposite direction. In Supplementary Table S4, for DSF, all the regression coefficients of (ADL × AAT)DSF, except that of the early MG set (E), were positive, and all the regression coefficients of (ADL × AAT)DFM, except those of the A sub-region and E MG set, were negative. In addition, all the regression coefficients of ADL and AAT were positive for DSF, and all the coefficients of ADL for DFM were positive, but all the coefficients of AATDFM were negative, except the A sub-region and E MG set. That means the AAT and ADL × AAT performed different patterns for DSF and DFM. The above understanding is based on a statistical concept, and further study on their biological mechanism is needed.

4.3. Responses of Growth Periods to ADL and AAT in Genotypic Clusters

Global soybeans were genetically clustered to evaluate whether the genetic differentiation and geographic differentiation were consistent and to characterize their response of growth periods to ADL and AAT. The global soybeans were grouped into four major and four minor clusters: in the former (clusters v~viii), O and C were mainly located in cluster v, A and B mainly in cluster vi and vii and A and D mainly in cluster viii, whereas in the latter (clusters i~iv), there were scattered varieties from various geo-regions. The ADL and AAT required for DSF and DFM varied slightly among the eight clusters, with no significant difference for ADLDFM and AATDFM. The required ADL and AAT in clusters v and viii had their ranges extended more than those of their component geo-regions.
It was assumed that the genetic clusters should coincide with the geographic subpopulations if each geographic subpopulation had unique genetic sources. In the present study, each of the geographic subpopulations involved several different genetic clusters, and each cluster involved several subpopulations; therefore, each genetic cluster might have its ADL and AAT response extended to compose of several subpopulations. Thus, a geographic subpopulation may come from multiple genetic sources, or extensive germplasm exchange among the subpopulations happened in history.

5. Conclusions

DSF and DFM are important phenological and evolutionary traits. The present study separated the two traits into the degree and duration of two basic environment factors of day length and temperature, respectively, i.e., ADL and AAT. DSF is more sensitive to ADL and AAT than DFM, and their sensitivity also varies in different geographical subpopulations and MG sets. For DSF, ADLDSF and AATDSF decreased significantly from geographical region O to northward region A but increased significantly to southward region C, whereas for DFM, ADLDFM and AATDFM decreased significantly in region A, but there was no increase in region C in comparison to region O. Their changes in region B and D were not as large as in A and C. The westward region were the newest ones but with the widest variation in DSF and DFM as well as their required ADL and AAT. This study also explored the ADL and AAT independent and joint/interaction effect on DSF and DFM. In the global population, ADL and AAT are more important to DSF variation, and their interaction (ADL × AAT) accounts for a certain part of DSF variation, but ADL is the dominant contributor to DFM. The relative contributions of ADL, AAT and ADL × AAT to DSF and DFM varied greatly among the geographic subpopulations. Another feature of this study is that genetic cluster is not fully consistent with geographical differentiation in the global population, indicating that multiple genetic sources existed in each geographical subpopulation. In addition, this study found that not only DSF but also DFM was related to ADL, which has been minimally reported previously.

Supplementary Materials

The following supporting information can be downloaded at: https://0-www-mdpi-com.brum.beds.ac.uk/article/10.3390/agronomy12040962/s1, Figure S1: Variation of accumulative day length (ADL) and accumulative active temperature (AAT) among months in experiments site in 2015, 2016 and 2017. Table S1: Distribution of material subgroups and maturity group of World Soybean Germplasm Population (WSGP). Table S2: Source information of the tested varieties in the World Soybean Germplasm Population (WSGP). Table S3: Analysis of variance of growth period traits, accumulative day length and accumulative active temperature in the World Soybean Germplasm Population (WSGP). Table S4: Regression analysis of variance of growth period traits, accumulative day length and accumulative active temperature. Table S5: Estimation of parameters in regression of growth period traits on accumulative day length and accumulative active temperature. Table S6: Variation of growth period traits, accumulative day length and accumulative active temperature in genetic clusters of the World Soybean Germplasm Population (WSGP).

Author Contributions

J.G. designed the study. C.W. performed the experiments. C.W. and J.H. analyzed the data. X.H. and Y.P. participated in the data analysis. X.L., C.Z., W.Z., W.W. and G.X. participated in the field experiments. C.W., J.H. and J.G. drafted the manuscript. All authors approved the manuscript. All authors have read and agreed to the published version of the manuscript.

Funding

This work was supported by the National Key Research Development Program of China (2021YFF1001204), the Program of Jiangsu Province (JBGS-2021-014), the MOE 111 Project (B08025), the MOE Program for Changjiang Scholars and Innovative Research Team in University (PCSIRT_17R55), the Fundamental Research Funds for the Central Universities (KYZZ201901), the MARA CARS-04 Program, the Primary Research & Development Plan of Jiangsu Province (BE2021358) and the Jiangsu JCIC-MCP, the Guidance Foundation of Sanya Institute of Nanjing Agricultural University (NAUSY-ZZ02, NAUSY-MS05).

Institutional Review Board Statement

Not applicable.

Informed Consent Statement

Not applicable.

Data Availability Statement

The data presented in this study are available in the Supplementary Material.

Conflicts of Interest

The authors declare no conflict of interest.

References

  1. Gaynor, L.; Lawn, R.; James, A. Agronomic studies on irrigated soybean in southern New South Wales. I. Phenological adaptation of genotypes to sowing date. Crop. Pasture Sci. 2012, 62, 1056–1066. [Google Scholar] [CrossRef]
  2. Garner, W.W. Comparative responses of long-day and short-day plants to relative length of day and night. Plant Physiol. 1933, 8, 347–356. [Google Scholar] [CrossRef] [Green Version]
  3. Garner, W.W.; Allard, H.A. Further studies in photoperiodism. The response of the plant to relative length of day and night. J. Agric. Res. 1923, 23, 871–920. [Google Scholar] [CrossRef] [Green Version]
  4. Garner, W.W.; Allard, H.A. Effect of the relative length of day and night and other factors of the environment on growth and reproduction in plants. J. Agric. Res. 1920, 18, 553–606. [Google Scholar] [CrossRef]
  5. Song, Y.H.; Ito, S.; Imaizumi, T. Flowering time regulation: Photoperiod- and temperature-sensing in leaves. Trends Plant Sci. 2013, 18, 575–583. [Google Scholar] [CrossRef] [Green Version]
  6. Newell, T.; Hymowitzc, A. Taxonomy of the genus Glycine, domestication and uses of soybeans. Econ. Bot. 1981, 35, 272–288. [Google Scholar]
  7. Watanabe, S.; Harada, K.; Abe, J. Genetic and molecular bases of photoperiod responses of flowering in soybean. Breed. Sci. 2012, 61, 531–543. [Google Scholar] [CrossRef] [Green Version]
  8. Hartman, G.L.; West, E.D.; Herman, T.K. Crops that feed the World 2. Soybean—Worldwide production, use, and constraints caused by pathogens and pests. Food Secur. 2011, 3, 5–17. [Google Scholar] [CrossRef]
  9. Liu, X.; He, J.; Wang, Y.; Xing, G.; Li, Y.; Yang, S.; Zhao, T.; Gai, J. Geographic differentiation and phylogeographic relationships among world soybean populations. Crop J. 2020, 8, 260–272. [Google Scholar] [CrossRef]
  10. Wen, Z.; Zhao, T.; Ding, Y.; Gai, J. Genetic diversity, geographic differentiation and evolutionary relationship among ecotypes of Glycine max and G. soja in China. Sci. Bull. 2009, 54, 4393–4403. [Google Scholar] [CrossRef] [Green Version]
  11. Zhao, T.; Gai, J. The Origin and Evolution of Cultivated Soybean [Glycine max (L.) Merr.]. Sci. Agric. Sin. 2004, 37, 954–962. [Google Scholar]
  12. Gai, J.Y.; Xu, D.H.; Gao, Z.; Shimamoto, Y.; Kitajima, S. Studies on the evolutionary relationship among eco-types of G. max and G. soja in China. Acta Agron. Sin. 2000, 26, 513–520. [Google Scholar]
  13. Hartwig, E.E.; Caldwell, B.E. Varietal development. In Soybeans: Improvement, Production, and Uses; Caldwell, B.E., Ed.; American Society of Agronomy: Madison, MI, USA, 1973. [Google Scholar]
  14. Norman, A.G. Soybean Physiology, Agronomy, and Utilization; Academic Press: Cambridge, MA, USA, 1978. [Google Scholar]
  15. Gaynor, L.G.; Lawn, R.J.; James, A.T. Agronomic studies on irrigated soybean in southern New South Wales. I. Phenological adaptation of genotypes to sowing date. Crop Pasture Ence 2011, 62, 1067–1077. [Google Scholar] [CrossRef]
  16. Han, T.; Wu, C.; Tong, Z.; Mentreddy, R.S.; Tan, K.; Gai, J. Postflowering photoperiod regulates vegetative growth and reproductive development of soybean. Environ. Exp. Bot. 2006, 55, 120–129. [Google Scholar] [CrossRef]
  17. Cober, E.R.; Stewart, D.W.; Voldeng, H.D. Photoperiod and Temperature Responses in Early-Maturing, Near-Isogenic Soybean Lines. Crop Sci. 2001, 41, 721–727. [Google Scholar] [CrossRef]
  18. Morandi, E.N.; Casano, L.M.; Reggiardo, L.M. Post-flowering photoperiodic effect on reproductive efficiency and seed growth in soybean. Field Crop. Res. 1988, 18, 227–241. [Google Scholar] [CrossRef]
  19. Wang, Z.; Reddy, V.R.; Acock, M.C. Testing for Early Photoperiod Insensitivity in Soybean. Agron. J. 1998, 90, 389–392. [Google Scholar] [CrossRef] [Green Version]
  20. Borthwick, H.A.; Parker, M.W. Effectiveness of photoperiodic treatments of plants of different age. Jpn. J. Crop Ence 1938, 100, 245–249. [Google Scholar] [CrossRef]
  21. Cober, E.R.; Molnar, S.J.; Charette, M.; Voldeng, H.D. A new locus for early maturity in soybean. Crop Sci. 2010, 50, 524–527. [Google Scholar] [CrossRef]
  22. Li, X.M.; Wu, C.X.; Ma, Q.B. Morphology and anatomy of the differentiation of flower bud and the process of flowering reversion in soybean cv. Zigongdongdou. Acta Agron. Sin. 2005, 31, 1437–1442. [Google Scholar]
  23. Hamner, K.K.; Nanda, K.C. Investigations on the effect of “light break” on the nature of the endogenous rhythm in the flowering response of biloxi soybean (Glycine, max, L. Merr.). Planta 1962, 58, 164–174. [Google Scholar] [CrossRef]
  24. Tomasz, P.I.; Steven, K.M. The Effect of Grafting on the Flowering of Near-Isogenic Lines of Soybean. Crop Sci. 2003, 43, 1760–1763. [Google Scholar] [CrossRef]
  25. Shanmugasundaram, S.; Wang, C.C.; Toung, T.S. Photoperiodic Response of Flowering in Two-Branched Soybean Plants. Bot. Gaz. 1979, 140, 4141–4147. [Google Scholar] [CrossRef]
  26. Liu, X. A Study on Geographic Differentiation, Genetic Dissection and Phylogenetic Relationship of the World Soybean. Ph.D. Thesis, Nanjing Agricultural University, Nanjing, China, 2015. [Google Scholar]
  27. Liu, X.; Wu, J.A.; Ren, H.; Qi, Y.; Li, C.; Cao, J.; Zhang, X.; Zhang, Z.; Cai, Z.; Gai, J. Genetic variation of world soybean maturity date and geographic distribution of maturity groups. Breed. Sci. 2017, 67, 221–232. [Google Scholar] [CrossRef] [Green Version]
  28. Fehr, W.R.; Caviness, C.E. Stages of soybean development. In Special Report 80, Cooperative Extension Service, Agriculture and Home Economic Experiment Station; Iowa State University: Ames, IA, USA, 1977; pp. 1–11. [Google Scholar]
  29. Nyquist, W.E.; Baker, R.J. Estimation of heritability and prediction of selection response in plant populations. Crit. Rev. Plant Sci. 1991, 10, 235–322. [Google Scholar] [CrossRef]
  30. Liu, X.; Li, C.; Cao, J.; Zhang, X.; Wang, C.; He, J.; Xing, G.; Wang, W.; Zhao, J.; Gai, J. Growth period QTL-allele constitution of global soybeans and its differential evolution changes in geographic adaptation versus maturity group extension. Plant J. 2021, 108, 1624–1643. [Google Scholar] [CrossRef]
  31. Barrett, J.C.; Fry, B.; Maller, J.; Daly, M.J. Haploview: Analysis and visualization of LD and haplotype maps. Bioinformatics 2005, 21, 263–265. [Google Scholar] [CrossRef] [Green Version]
  32. Wall, J.D.; Pritchard, J.K. Haplotype blocks and linkage disequilibrium in the human genome. Nat. Rev. Genet. 2003, 4, 587–597. [Google Scholar] [CrossRef]
  33. He, J.; Meng, S.; Zhao, T.; Xing, G.; Yang, S.; Li, Y.; Guan, R.; Lu, J.; Wang, Y.; Xia, Q.; et al. An innovative procedure of genome-wide association analysis fits studies on germplasm population and plant breeding. Theor. Appl. Genet. 2017, 130, 2327–2343. [Google Scholar] [CrossRef]
  34. Lewis, P.O.; Kumar, S.; Tamura, K.; Nei, M. MEGA: Molecular Evolutionary Genetics Analysis, Version 1.02. Syst. Biol. 1995, 44, 576–577. [Google Scholar] [CrossRef]
  35. Aiken, L.S.; West, S.G. Multiple Regression: Testing and Interpreting Interactions; Sage: New York, NY, USA, 1991. [Google Scholar]
  36. Setiyono, T.D.; Weiss, A.; Specht, J.; Bastidas, A.M.; Cassman, K.G.; Dobermann, A. Understanding and modeling the effect of temperature and daylength on soybean phenology under high-yield conditions. Field Crop. Res. 2007, 100, 257–271. [Google Scholar] [CrossRef] [Green Version]
  37. Choi, D.H.; Ban, H.Y.; Seo, B.S.; Lee, K.J.; Lee, B.W. Phenology and Seed Yield Performance of Determinate Soybean Cultivars Grown at Elevated Temperatures in a Temperate Region. PLoS ONE 2016, 11, e0165977. [Google Scholar] [CrossRef]
  38. Tan, Q.; Liu, Y.; Dai, L.; Pan, T. Shortened key growth periods of soybean observed in China under climate change. Sci. Rep. 2021, 11, 8197. [Google Scholar] [CrossRef]
Figure 1. (a) Scatter plots of ADLDSF (blue) and AATDSF (red) for DSF of geographic subpopulations and MG subpopulations in WSGP. (b) Scatter plots of ADLDFM (blue) and AATDFM (red) for DFM of geographic subpopulations and MG subpopulations in WSGP. “Total” represents the total 354 varieties in WSGP. “O” represents the varieties from the center of origin in both Huang-Huai River Valleys (HCHN) and Chang-jiang River Valleys and its south (SCHN). “A” represents the varieties from Northeast China (NCHN), Far-East Russia (RUFE) and southern Sweden (SSWE); “B” represents the varieties from the Korean peninsula (KORP) and Japan islands (JPAN); “C” represents the varieties from Southeast Asia (SEAS), South Asia (SASI) and Africa (AFRI); “D” represents the varieties from northern North America (NNAM), southern North America (SNAM) and Central and South America (CSAM). “E” represents the early MG-set varieties (MG 000~0); “P” represents the primary MG-set varieties (MG I~VII); “L” represents the late MG-set varieties (MG VIII~X). The same is true for the latter figure.
Agronomy 12 00962 g001
Figure 2. Neighbor-joining tree of 354 soybean varieties of the WSGP based on SNPLDB markers. “O” represents the varieties from the center of origin in both Huang-Huai River Valleys (HCHN) and Chang-jiang River Valleys and its south (SCHN). “A” represents the varieties from Northeast China (NCHN), Far-East Russia (RUFE) and southern Sweden (SSWE); “B” represents the varieties from the Korean peninsula (KORP) and Japan islands (JPAN); “C” represents the varieties from Southeast Asia (SEAS), South Asia (SASI) and Africa (AFRI); “D” represents the varieties from northern North America (NNAM), southern North America (SNAM) and Central and South America (CSAM). “E” represents the early MG set varieties (MG 000~0); “P” represents the primary MG set varieties (MG I~VII); “L” represents the late MG set varieties (MG VIII~X).
Agronomy 12 00962 g002
Table 1. Variation of growth period traits, accumulative day length and accumulative active temperature among geographic subpopulations in the World Soybean Germplasm Population (WSGP).
TraitGeo-Pop.Class Midpoint ValueNMeanGCV (%)Range
DSF
(d)
(PropDSF %)23.530.537.544.551.558.565.572.579.586.5>90
O (32.2 B)34311284201006541.9 B22.825.6–77.0
A (28.6 D)47208000000007526.4 C16.920.6–37.1
B (31.0 BC)415151051100005138.1 B22.824.3–66.6
C (44.2 A)0025415615254570.6 A22.939.0–95.5
D (30.2 C)18374262271100111739.4 B32.522.6–94.8
All (32.1)72766053391397162635341.040.720.6–95.5
ADLDSF
(d·h)
(PDLDSF %)<32037047057067077087097010701170>1220
O (34.2 B)0310261283210065621.9 B22.0388.4–1098.8
A (29.9 C)546195000000075397.5 C16.3311.7–552.5
B (32.9 B)061614941100051565.9 B22.3368.6–975.7
C (47.7 A)000263156157451035.4 A22.2579.0–1382.3
D (32.2 B)025306252531101117584.9 B31.6336.8–1372.7
All (34.1)58075535240898158353606.639.6311.7–1382.3
AATDSF
(d·°C)
(PATDSF%)<6507609801200142016401860208023002520>2630
O (34.5 B)05142712420100651211.1 B21.8763.5–2202.8
A (30.3 C)651180000000075785.4 C15.5622.4–1077.6
B (33.2 B)0915178110000511105.5 B21.6734.5–1883.9
C (49.8 A)000381571434452017.8 A22.81125.4–2726.2
D (32.8 B)0391812369110011171143.7 B30.6661.3–2708.3
All (34.8)6104655964159815353531185.939.1622.6–2726.2
DFM (d)(PropDFM %)46.553.560.567.574.581.588.595.5102.5109.5116.5
O (67.8 C)00833712209216588.1 A15.960.1–114.1
A (71.4 A)220121889510007566.5 B18.147.8–93.4
B (68.9 BC)242367677705185.1 A21.445.8–112.8
C (55.8 D)0001811976304587.8 A12.770.3–111.1
D (69.8 B)0441481514212214111788.7 A17.352.1–114.6
All (67.9)4282639334946564426235383.320.245.8–114.6
ADLDFM
(d·h)
(PDLDFM %)<720760840920100010801160124013201400>1440
O (65.8 B)00740312191181651191.9 A14.2834.0–1479.4
A (70.1 A)1201181586600075936.2 B16.9685.0–1274.8
B (67.1 B)23315847693511159.1 A19.2652.0–1476.4
C (52.3 C)002581243641451120.8 A14.7859.5–1458.0
D (67.8 B)032126101916261941171200.6 A14.9746.8–1487.4
All (65.9)326253034414551494093531126.718.2652.0–1487.4
AATDFM
(d·°C)
(PATDFM %)<1400147016101750189020302170231024502590>2660
O (65.5 B)00372351415124652289.7 A13.01661.1–2694.1
A (69.7 A)31710714972600751814.7 C17.61339.8–2477.6
B (66.8 B)223146566106512228.1 A18.01251.5–2732.9
C (50.2 C)03668560542452016.9 B18.31437.5–2715.7
D (67.2 B)05171061317311981172289.8 A14.01449.1–2755.2
All (65.2)5272328382936396345203532145.117.91251.5–2755.2
Note: DSF: days from sowing to flowering; ADLDSF: DSF required accumulative day length; AATDSF: DSF required accumulative active temperature; DFM: days from flowering to maturity; ADLDFM: DFM required accumulative day length; AATDFM: DFM required accumulative active temperature. Geo-pop.: Geographic groups; PropDSF: The proportion of DSF in a life cycle; PDLDSF: Percentage of accumulative day length during DSF to that in a life cycle; PATDSF: Percentage of accumulative active temperature during DSF to that in a life cycle; PropDFM: The proportion of DSF in the life cycle; PDLDFM: Percentage of accumulative day length during DFM to that in a life cycle; PATDFM: Percentage of accumulative active temperature during DFM to that in a life cycle. N: the number of accessions; GCV: genotypic coefficient of variation. “O” represents the center of origin; “A” represents Northeast China (NCHN), Far-East Russia (RUFE) and southern Sweden (SSWE); “B” represents the Korean peninsula (KORP) and Japan islands (JPAN); “C” represents Southeast Asia (SEAS), South Asia (SASI) and Africa (AFRI); “D” represents northern North America (NNAM), southern North America (SNAM) and Central and South America (CSAM); the superscripts of A, B, C and D indicate multiple comparisons.
Table 2. Variation of growth period traits, accumulative day length and accumulative active temperature among MG sets in the world soybean germplasm population (WSGP).
TraitMGClass Midpoint Value(Frequency)NMeanGCV (%)Range
DSF
(d)
(PropDSF%)23.530.537.544.551.558.565.572.579.586.5>90
E (29.3 B)2920000000003123.0 C8.2220.6–27.7
P (30.9 B)4374605336128231029239.1 B30.7022.6–88.6
L (46.9 A)0000311513163077.5 A16.0651.0–95.5
All (32.1)72766053391397162635341.040.720.5–95.5
ADLDSF
(d·h)
(PDLDSF%)<32037047057067077087097010701170>1220
E (30.5 C)52600000000031346.0 C7.7311.7–418.9
P (32.8 B)0547553523688231292580.5 B30.0336.8–1285.2
L (50.7 A)000004016127301129.6 A15.7751.7–1382.3
All (34.1)58075535240898158353606.639.6311.7–1382.3
AATDSF
(d·°C)
(PETDSF%)<6507609801200142016401860208023002520>2630
E (31.4 B)52600000000031691.3 C6.8622.6–819.1
P (33.2 B)17865596213832102921132.8 B29.2638.2–2539.0
L (53.6 A)000022151325302213.7 A16.21458.5–2726.2
All (34.8)6104655964159815353531185.939.1622.6–2726.2
DFM
(d)
(PropDFM%)46.553.560.567.574.581.588.595.5102.5109.5116.5
E (70.7 A)1217110000003155.6 B8.547.8–71.5
P (69.1 A)371937264239514424029285.7 A17.945.8–112.8
L (53.1 B)000167750223087.6 A14.370.3–114.6
All (67.9)4282639334946564426235383.320.245.8–114.6
ADLDFM
(d·h)
(PDLDFM %)<720760840920100010801160124013201400>1440
E (69.5 A)12081100000031791.5 B8.2685.0–1006.8
P (67.2 B)26152428344148493872921165.0 A15.7652.0–1476.4
L (49.3 C)00255743022301099.7 A16.1859.5–1487.4
All (65.9)326253034414551494093531126.718.2652.0–1487.4
AATDFM
(d·°C)
(PETDFM %)<1400147016101750189020302170231024502590>2660
E (68.6 A)318802000000311514.9 C8.31340.0–1931.0
P (66.8 A)251024292733386343182922235.1 A14.81252.0–2755.0
L (46.4 B)04547231022301920.6 B19.01437.0–2700.0
All (65.2)5272328382936396345203532145.117.91251.5–2755.2
Note: MG: maturity group; DSF: days from sowing to flowering; ADLDSF: DSF required accumulative day length; AATDSF: DSF required accumulative active temperature; DFM: days from flowering to maturity; ADLDFM: DFM required accumulative day length; AATDFM: DFM required accumulative active temperature. PropDSF: The proportion of DSF in a life cycle; PDLDSF: Percentage of accumulative day length during DSF to that in a life cycle; PATDSF: Percentage of accumulative active temperature during DSF to that in a life cycle; PropDFM: The proportion of DSF in a life cycle; PDLDFM: Percentage of accumulative day length during DFM to that in a life cycle; PATDFM: Percentage of accumulative active temperature during DFM to that in a life cycle. N: the number of accessions; GCV: genotypic coefficient of variation. “E” represents the early MG set (MG 000~0); “P” represents the primary MG set (MG I~VII), “L” represents the late MG set (MG VIII~X); the superscripts of A, B and C indicate multiple comparisons.
Table 3. Decomposition of determination coefficient in multiple regression analysis of growth period traits on accumulative day length, accumulative active temperature and their interaction.
TraitSource of VariationTotalSub-Population
O A B C D E P L
DSFModel R299.9099.999.799.999.899.998.799.999.6
ADLDSF (x1)38.0529.3367.5184.790.5444.6671.3537.241.43
AATDSF (x2)44.7915.3823.650.2397.5619.9227.3654.3084.74
(x1 x2)DSF17.1055.258.5514.891.6635.370.018.3713.48
Residual0.060.040.290.090.240.051.280.090.35
DFMModel R298.9098.798.399.498.699.588.998.899.2
ADLDFM (x3)86.9888.691.5771.8793.2482.32.5378.6493.98
AATDFM (x4)11.429.5734.4427.434.2516.2639.0819.854.76
(x3 x4)DFM0.540.5262.300.071.070.9747.250.290.46
Residual1.061.231.690.631.430.4811.141.220.8
Note: DSF: days from sowing to flowering; ADLDSF: DSF required accumulative day length; AATDSF: DSF required accumulative active temperature; DFM: days from flowering to maturity; ADLDFM: DFM required accumulative day length; AATDFM: DFM required accumulative active temperature; (x1 × x2)DSF: the interaction between ADL and AAT for DSF; (x3 × x4) DFM: the interaction between ADL and AAT for DFM.“O” represents the center of origin; “A” represents Northeast China (NCHN), Far-East Russia (RUFE) and southern Sweden (SSWE); “B” represents the Korean peninsula (KORP) and Japan islands (JPAN); “C” represents Southeast Asia (SEAS), South Asia (SASI) and Africa (AFRI); “D” represents northern North America (NNAM), southern North America (SNAM) and Central and South America (CSAM). “E” represents the early MG-set (MG 000~0); “P” represents the primary MG-set (MG I~VII), “L” represents the late MG-set (MG VIII~X).
Table 4. The frequency distribution of geographic and MG-set subpopulations in 8 genotypic clusters of world soybean germplasm population (WSGP).
Genetic Distance ClusterGeographic SubpopulationMG-Set SubpopulationTotal
OABCDEPL
i 1 1 1
ii 424 10 10
iii7 1 8 8
iv15 6 6
v5238374 7925104
vi 881 17 17
vii12126311438 52
viii43361112171345156
Total657551461173129330354
Publisher’s Note: MDPI stays neutral with regard to jurisdictional claims in published maps and institutional affiliations.

