
Influence of the New Energy Context on the Spanish Agri-Food Industry


Departamento de Ingeniería Agroforestal, Escuela Técnica Superior de Ingeniería Agronómica, Alimentaria y de Biosistemas, Universidad Politécnica de Madrid, Avenida Puerta de Hierro, No. 2–4, 28040 Madrid, Spain
*
Author to whom correspondence should be addressed.
Agronomy 2022, 12(4), 977; https://0-doi-org.brum.beds.ac.uk/10.3390/agronomy12040977
Submission received: 23 March 2022
/
Revised: 8 April 2022
/
Accepted: 12 April 2022
/
Published: 18 April 2022
(This article belongs to the Special Issue Selected Papers from 11th Iberian Agroengineering Congress)
Abstract
:The Spanish agri-food industries face a new energy context radically different from the one existing less than a year ago. A comparable situation is occurring in other European countries. The great variability and different seasonality of the agro-industries condition the adaptation measures to be implemented. This article quantifies the impact of the new energy context on real industries with quite different consumption patterns. More than 1000 scenarios have been analysed to determine the effectiveness of adaptation measures. The study results demonstrate the critical situation to which the sector is subjected. The new tariff system affects the agri-food sector in an unequal way, benefiting industries with marked seasonality. In just one year, the electricity bill has increased between 62% and 151%. The savings generated by implementing measures such as optimising contracted power to a new hourly discrimination system (up to 6%) or shifting consumption to lower-cost periods (up to 21%) do not seem sufficient. If prices do not fall drastically, immediate installation of generation systems, such as photovoltaic panels, appears essential to maintain the viability and competitiveness of the sector.
1. Introduction
In the European Union, the agri-food industry represents more than 15% of the manufacturing industry, with a turnover of more than 1,205,000 million euros [1]. In Spain, its importance is increasing, being the leading manufacturing branch of the industrial sector, with 23.3% [2].
This importance means that the food and beverage industry was responsible for the highest industrial energy consumption in 2019, 18.5%, more than 2 billion euros [2]. The sector’s high electrical energy consumption stands out, with almost 60% of the total, exceeding 90% in some agro-industries, such as wineries. This consumption also has the peculiarity of being highly seasonal in many subsectors, reflecting agricultural production.
Therefore, the substantial change in the energy context has had an enormous impact on the sector. The new Spanish electricity tariff system, which came into force in June 2021, together with the increase in the price of electricity and gas, has led to a significant rise in the energy bill for many agribusinesses, limiting their viability and competitiveness.
Furthermore, the limited electricity interconnection capacity in some countries, such as Spain, means that prices on the electricity market are higher than in many Member States. This means that the electricity-consuming industries face competitive problems due to their higher energy costs [3].
Numerous previous studies have focused on reducing electricity bills through different measures: optimisation of contracted power, both at the residential level [4] and for large consumers and industries [5,6]; managing peak electricity loads on manufacturing lines [7]; automated analysis of electricity bills for large companies [8]; implementation of renewables to reduce the amount of the bill for buildings [9], etc. There are also previous works regarding the design of tariff systems [10], the effect of the subsidised electrical energy tariff on residential energy [11], and so on.
Despite the great scientific interest in energy markets [12], there is no evidence of recent studies that analyse the current energy context with its drastic changes. Nor have previous studies focused on the agri-food industry and its differentiating characteristics from other sectors. Given the seasonality of the production of many industries and processes, the new hourly discrimination system, the variation of energy prices, and contracted power will affect them unevenly.
A period is beginning in which rapid adaptation to the new context will be key to maintaining the competitiveness of many companies. The highly fragmented nature of the agroindustrial sector—96.1% of the more than 30,500 companies have fewer than 50 employees, and 79% have fewer than 10 [2]—makes it difficult to adapt and implement measures to control energy bills and improve energy efficiency.
This study evaluates the change to a new tariff system (which makes the power term cheaper and the energy term more expensive) and the increase in electricity prices.
2. New Energy Context
2.1. New Tariff System
In Spain, the final amount of the electricity bill is due to different components: network access tolls (remuneration to maintain the electricity transmission and distribution networks), charges (financing of renewables, tariff deficit, extra costs of non-peninsular territories), value-added tax (VAT), a special tax on electricity, cost of energy, profit margin of the retailer, and rent for metering equipment. Most of these costs have regulated prices.
Electricity tariffs are directly linked to network access tolls. The toll structure was established by the National Markets and Competition Commission (CNMC), as well as the price of the tolls in each period. And this same structure is adopted by the Ministry of Ecological Transition and Demographic Challenge (MTERD) in what it calls tariff segments, applying the charges and capacity payments for these same periods.
The new tariff system started to materialise in January 2020, when the CNMC Circular 3/2020 [13] was published, establishing the new tolls and the calculation methodology. Due to COVID-19, the entry into force of the new tolls was delayed for almost a year. On 9 March 2021, the MTERD published the methodology for calculating the charges [14]. A few days later, the CNMC published the values of the new tolls [15], and on 19 April, the Ministry did the same with the charges and capacity payments [16].
The change in tariffs has been motivated to discourage consumption during periods of greater grid overload and encourage the development of electrification and electric vehicles. It is based on the criteria of sufficiency (financed by remuneration), economic efficiency (principle of causality of network costs, paying more when it costs more), transparency and objectivity (published calculation methodology), and nondiscrimination (same characteristics within each tariff group).
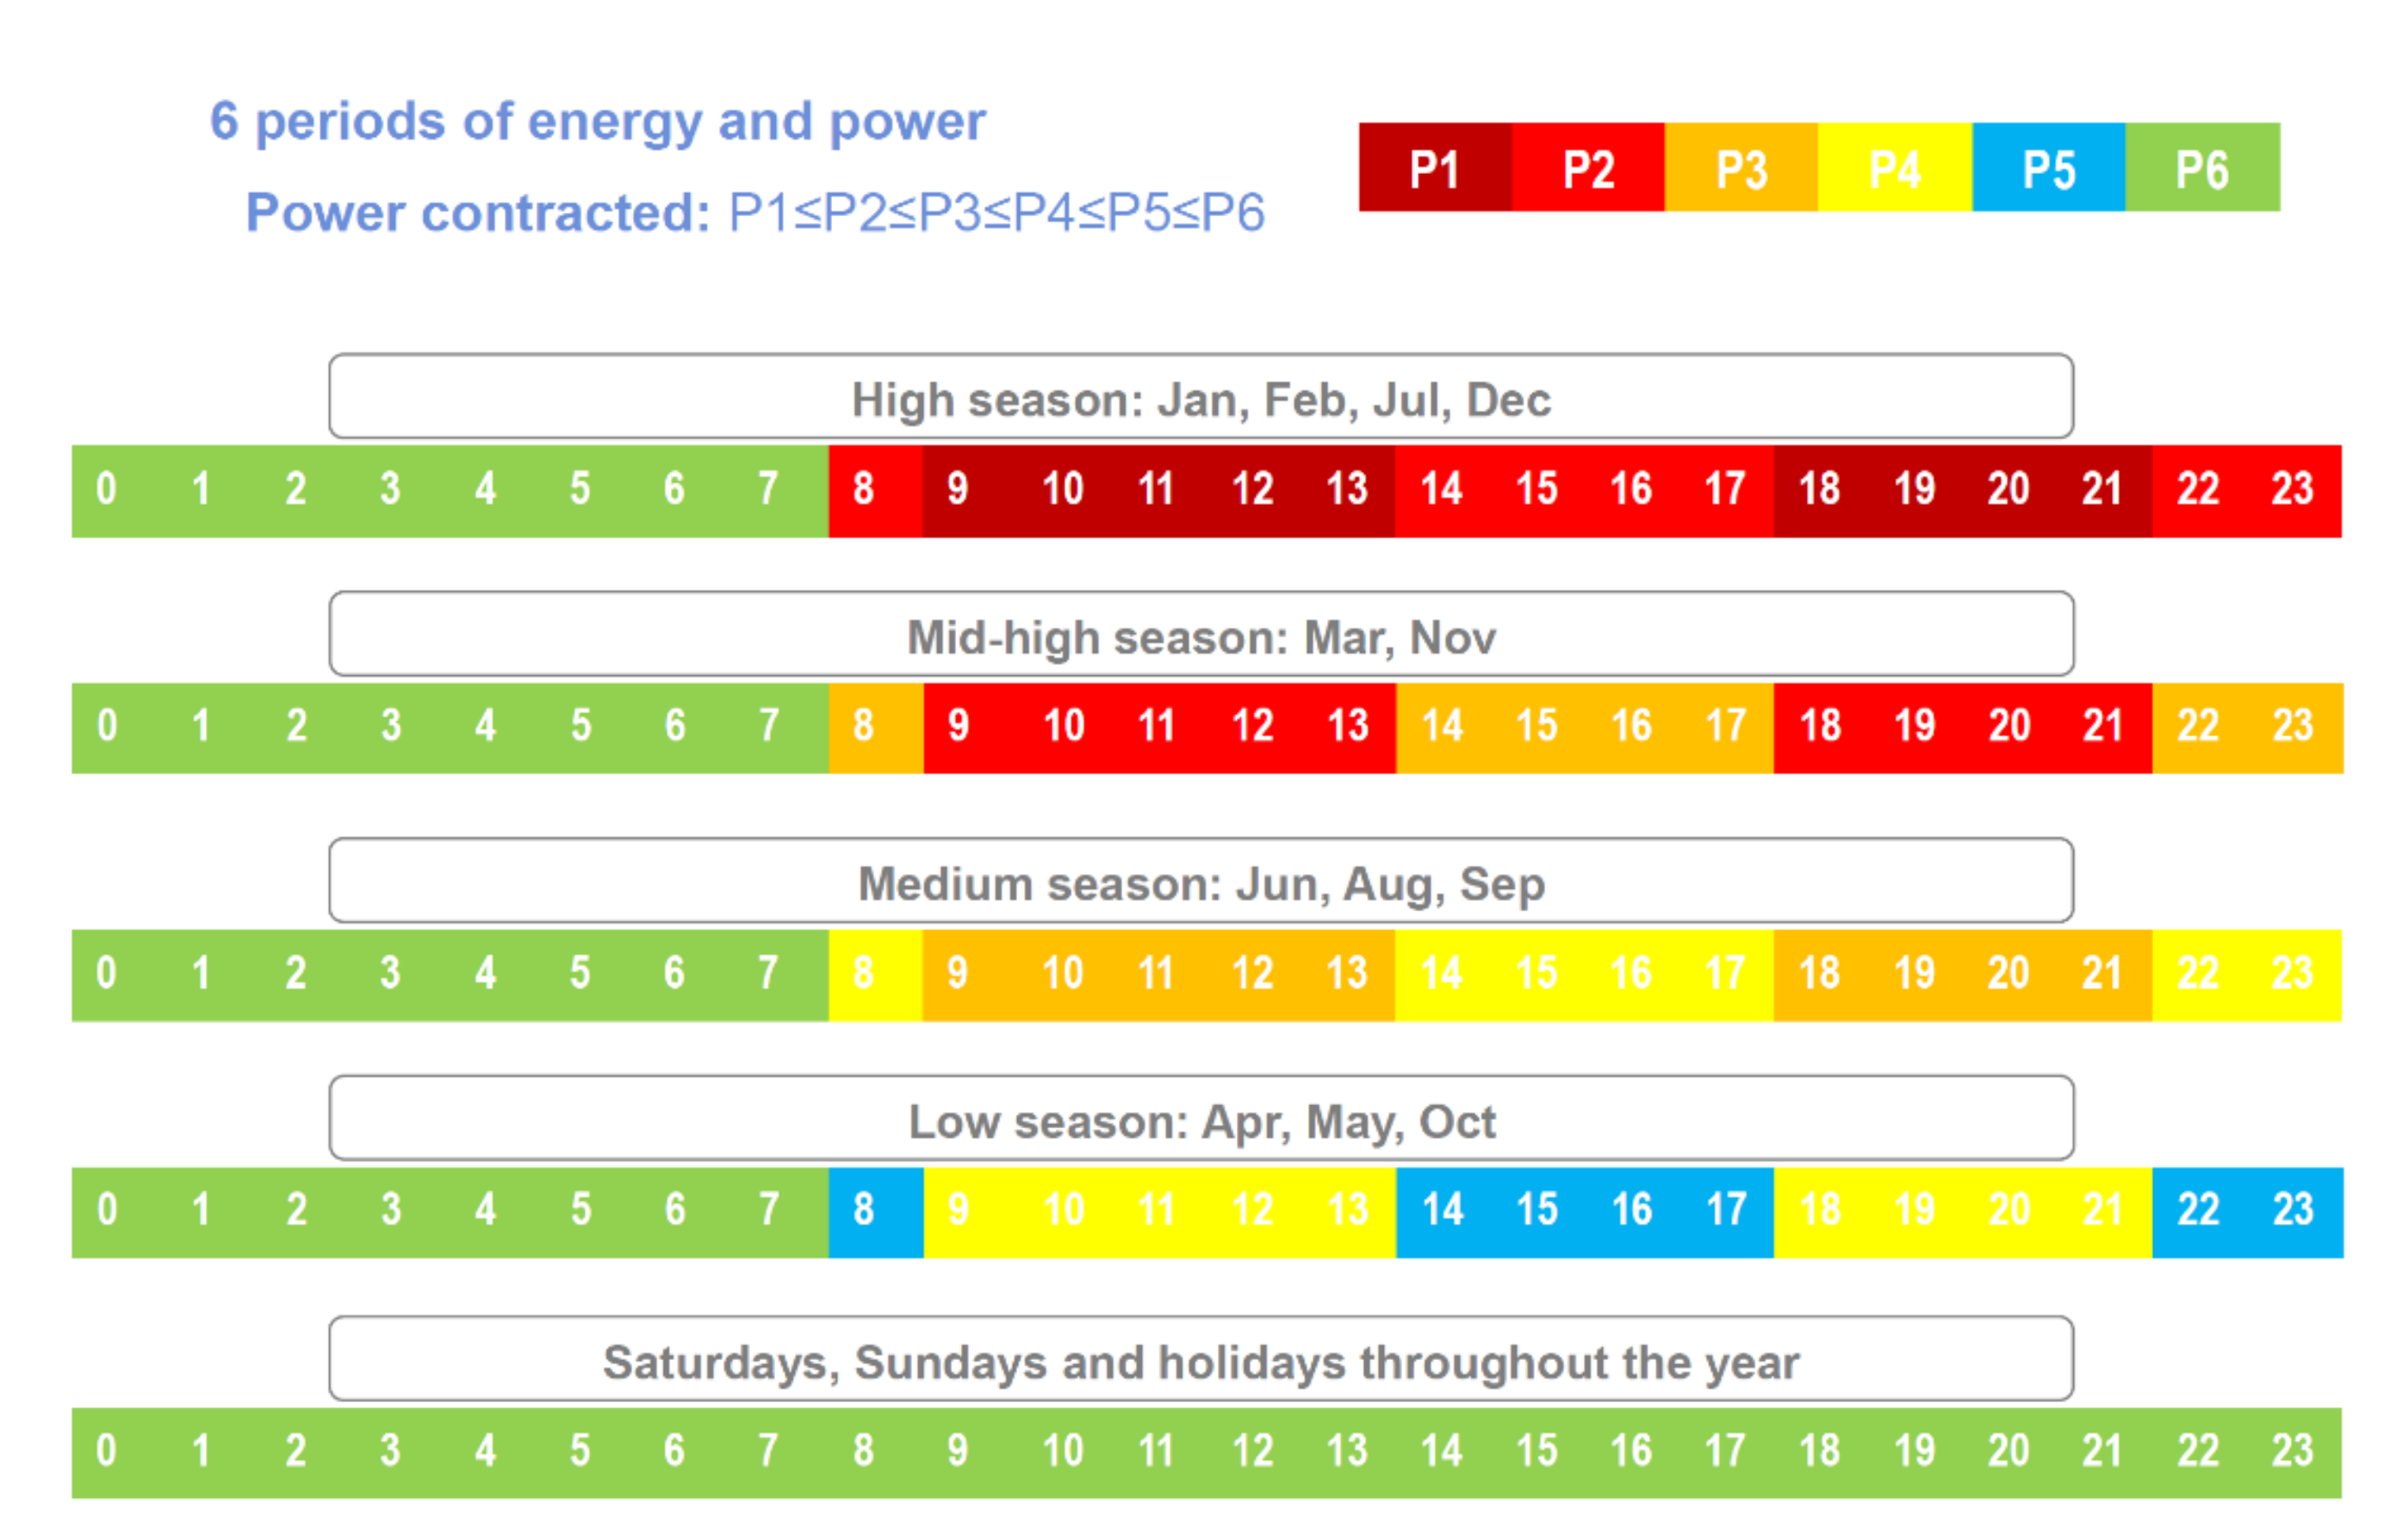
In this new tariff system, all tolls introduce hourly discrimination, encouraging the use of networks in periods when saturation is lower. Most small and medium-sized agro-industries (15 kW < P < 450 kW) go from having 3 periods (old 3.0A and 3.1A tariffs) to having 6 periods of energy and power (3.0TD and 6.1TD tariffs). There are different variability factors: five geographical areas (mainland Spain, Balearic Islands, Canary Islands, Ceuta, and Melilla); four seasons where consumption is penalised in the months of highest demand (high, medium-high, medium, and low); different periods for weekends and public holidays.
Although this type of tariff has six periods, each month there are only three periods involved, with the timetables remaining the same throughout the months. In mainland Spain, the most expensive hours each month are from 9:00 to 13:59 and from 18:00 to 21:59, from Monday to Friday. Overnight (00:00 to 07:59) and weekends are the cheapest of the 6 existing periods. The rest of the day corresponds to the intermediate period (Figure 1).
In the new tariff system, there has been a significant variation in the number of daily hours in each period, with the lowest and highest cost hours gaining importance and the intermediate cost hours losing importance.
Furthermore, the price of tolls and charges, which have a direct impact on the last price offered to the consumer, has undergone a radical change. The tolls plus energy-related charges (€/kWh) tripled in just one month. Thus, for example, high-voltage supplies went from 0.014 (P1), 0.013 (P2), and 0.008 (P3) in May 2021 to 0.051 (P1), 0.039 (P2), 0.022 (P3), 0.012 (P4), 0.004 (P5), and 0.003€/kWh (P6) in June 2021.
On the other hand, the tolls and charges for the power term (€/kW yearly) have undergone a not insignificant reduction, although limited by having to pay for 6 periods instead of only 3. Thus, the high voltage supply went from 59.173 (P1), 36.491 (P2), and 8.368 (P3) to 30.536 (P1), 25.895 (P2), 14.909 (P3), 12.095 (P4), 3.939 (P5), and 2.109 €/kW yearly (P6).
2.2. Price Increases
The increase in tolls, charges, and other regulated costs led to an initial rise in the price of energy (€/kWh) offered to the consumer. As a reference, the evolution of the prices offered by a marketing company for the high-voltage supply [17]: from values close to 0.092 (P1), 0.086 (P2), and 0.069 €/kWh (P3) before the tariff change, to 0.171 (P1), 0.147 (P2), 0.117 (P3), 0.097 (P4), 0.083 (P5), and 0.077€/kWh (P7) with the new system (Figure 2a).
However, this first increase has been dwarfed by the unstoppable rise in electricity prices in wholesale markets. Less than a year later, in March 2022, bid prices have quadrupled: 0.340, 0.310, 0.291, 0.267, 0.243, and 0.231 €/kWh for P1, P2, P3, P4, P5, and P6, respectively (Figure 2a). This is so despite the fact that during the last few months, the special tax on electricity and the tolls and charges were reduced to mitigate the strong impact on the bill. It should also be noted that the price increases occurred prior to the conflict in Ukraine, which is expected to affect the energy production sector.
On the other hand, the power term offered to customers has been reduced concerning the old system, passing on the reduction in tolls and charges. Thus, for example, from 59.167 (P1), 36.464 (P2), and 8.359 €/kW (P3) yearly to 24.732 (P1), 21.529 (P2), 12.320 (P3), 9.897 (P4), 2.834 (P5), and 1.571 €/kW yearly (P6) (Figure 2b). However, it is necessary to clarify that previously 3 periods were paid, and the new tariffs for all 6 are paid monthly.
In short, the new tariff system attempts to encourage consumption during periods of lower network overload. At the same time, there has been a strong change in prices, making the power term cheaper and the energy term more expensive (especially during peak demand hours), with the overall result of a strong increase in electricity costs.
3. Materials and Methods
3.1. Calculation of Electricity Bill
The calculation of the amount of the annual bill was carried out using Microsoft Excel and Visual Basic for Applications (VBA) programming. In each scenario analyzed, the calculation conditions set out in the regulations, and the values of the energy and power terms for the corresponding date were considered.
The tariff system of the electricity supply companies has been reproduced for the power range of most agro-industries, including penalties, electricity tax, meter rental, VAT, etc.
The energy term is calculated by multiplying the kWh consumed in each period by the energy price for that period (€/kWh).
The billing of power varies from the old system to the new one. In the former system, the amount corresponding to power included both the contracted power and the penalties for excesses. Thus, if there are excesses, the billed power (Pb, kW) that multiplies the power term in each period (€/kW) is higher than the contracted power (Pc, kW). The power demanded (Pd, kW) is increased by twice the difference between it and 1.05 of the contracted power, according to Equation (1). On the other hand, at least 85% of the contracted power will be billed, even if the power demand is lower.
In the new system, the billing of the contracted power is separated from the penalty for excess power (Pep, €). On the one hand, the contracted power is billed by multiplying it by the price per kW for each period. For the usual power ranges of agro-industries, excess power is billed according to the number of times the contracted power is exceeded and not according to the maximum register. All the power demanded is checked every 15 min, and those that have exceeded the contracted power are billed (n quarter-hour intervals). Thus, in each period, the penalty for excess power is calculated according to Equation (2).
where Kp is a coefficient that varies according to the period and tariff type (e.g., from 1 in P1 to 0.026 in P6 in the analysed industries); tep is an excess power term currently worth 1.4064.
The optimisation of the contracted power was carried out using the Solver tool, conditional on obtaining the minimum annual amount.
3.2. Analyses Performed
To assess the impact of the new energy context on the agri-food sector, a three-pronged approach has been adopted:
3.2.1. Analysis of Four Real Industries with Quite Different Consumption Patterns
First, an analysis of the consumption of real industries, representative of their corresponding sectors, was carried out. Agro-industries with very marked and different patterns have been selected.
The quarter-hourly consumption data have been obtained thanks to collaborations in previous projects, such as the European projects TESLA (Transferring Energy Save Laid on Agroindustry) and Scoope (Saving COOPerative Energy); specifically:
- (a)
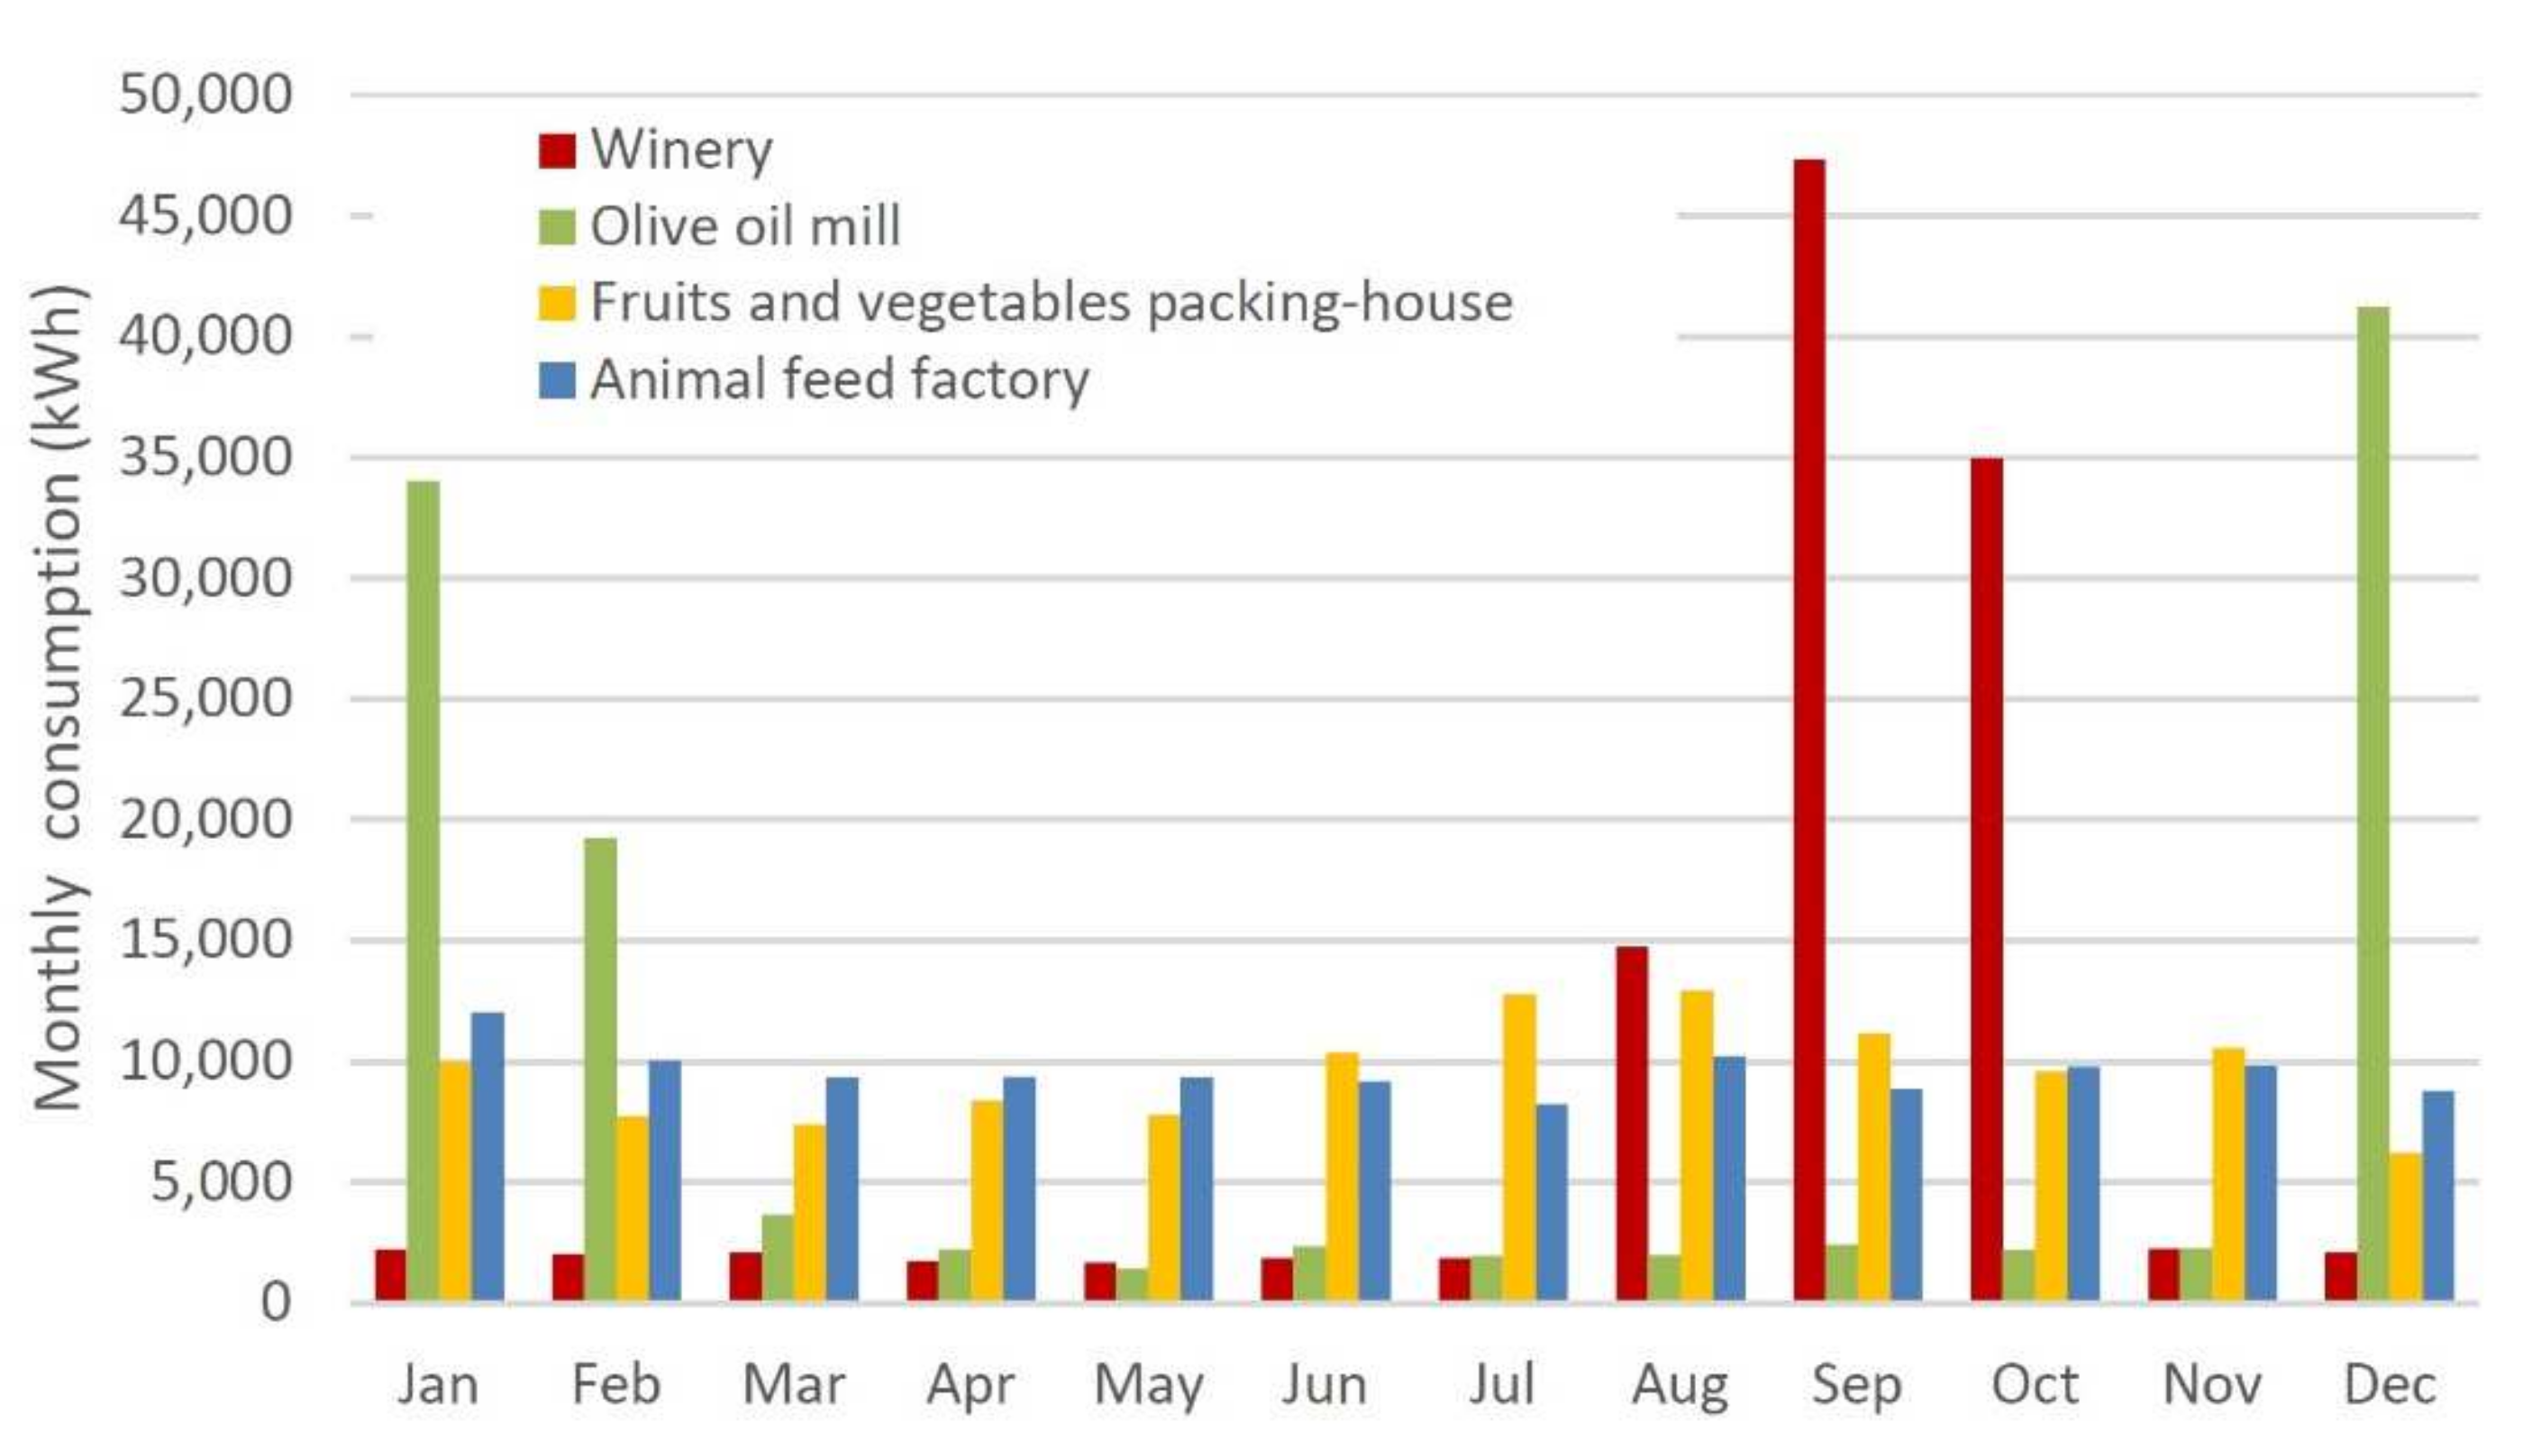
- Winery: pattern of consumption with strong seasonality in the early autumn. There is a peak in the energy consumption and power required by the processing machinery. Additionally, at this time of year, activities are common on weekends. Pattern: strong seasonal consumption in summer-autumn.
- (b)
- Oil mill: like the winery, but with the months of highest demand in winter, coinciding with the olive harvest. Pattern: strong seasonal consumption in winter.
- (c)
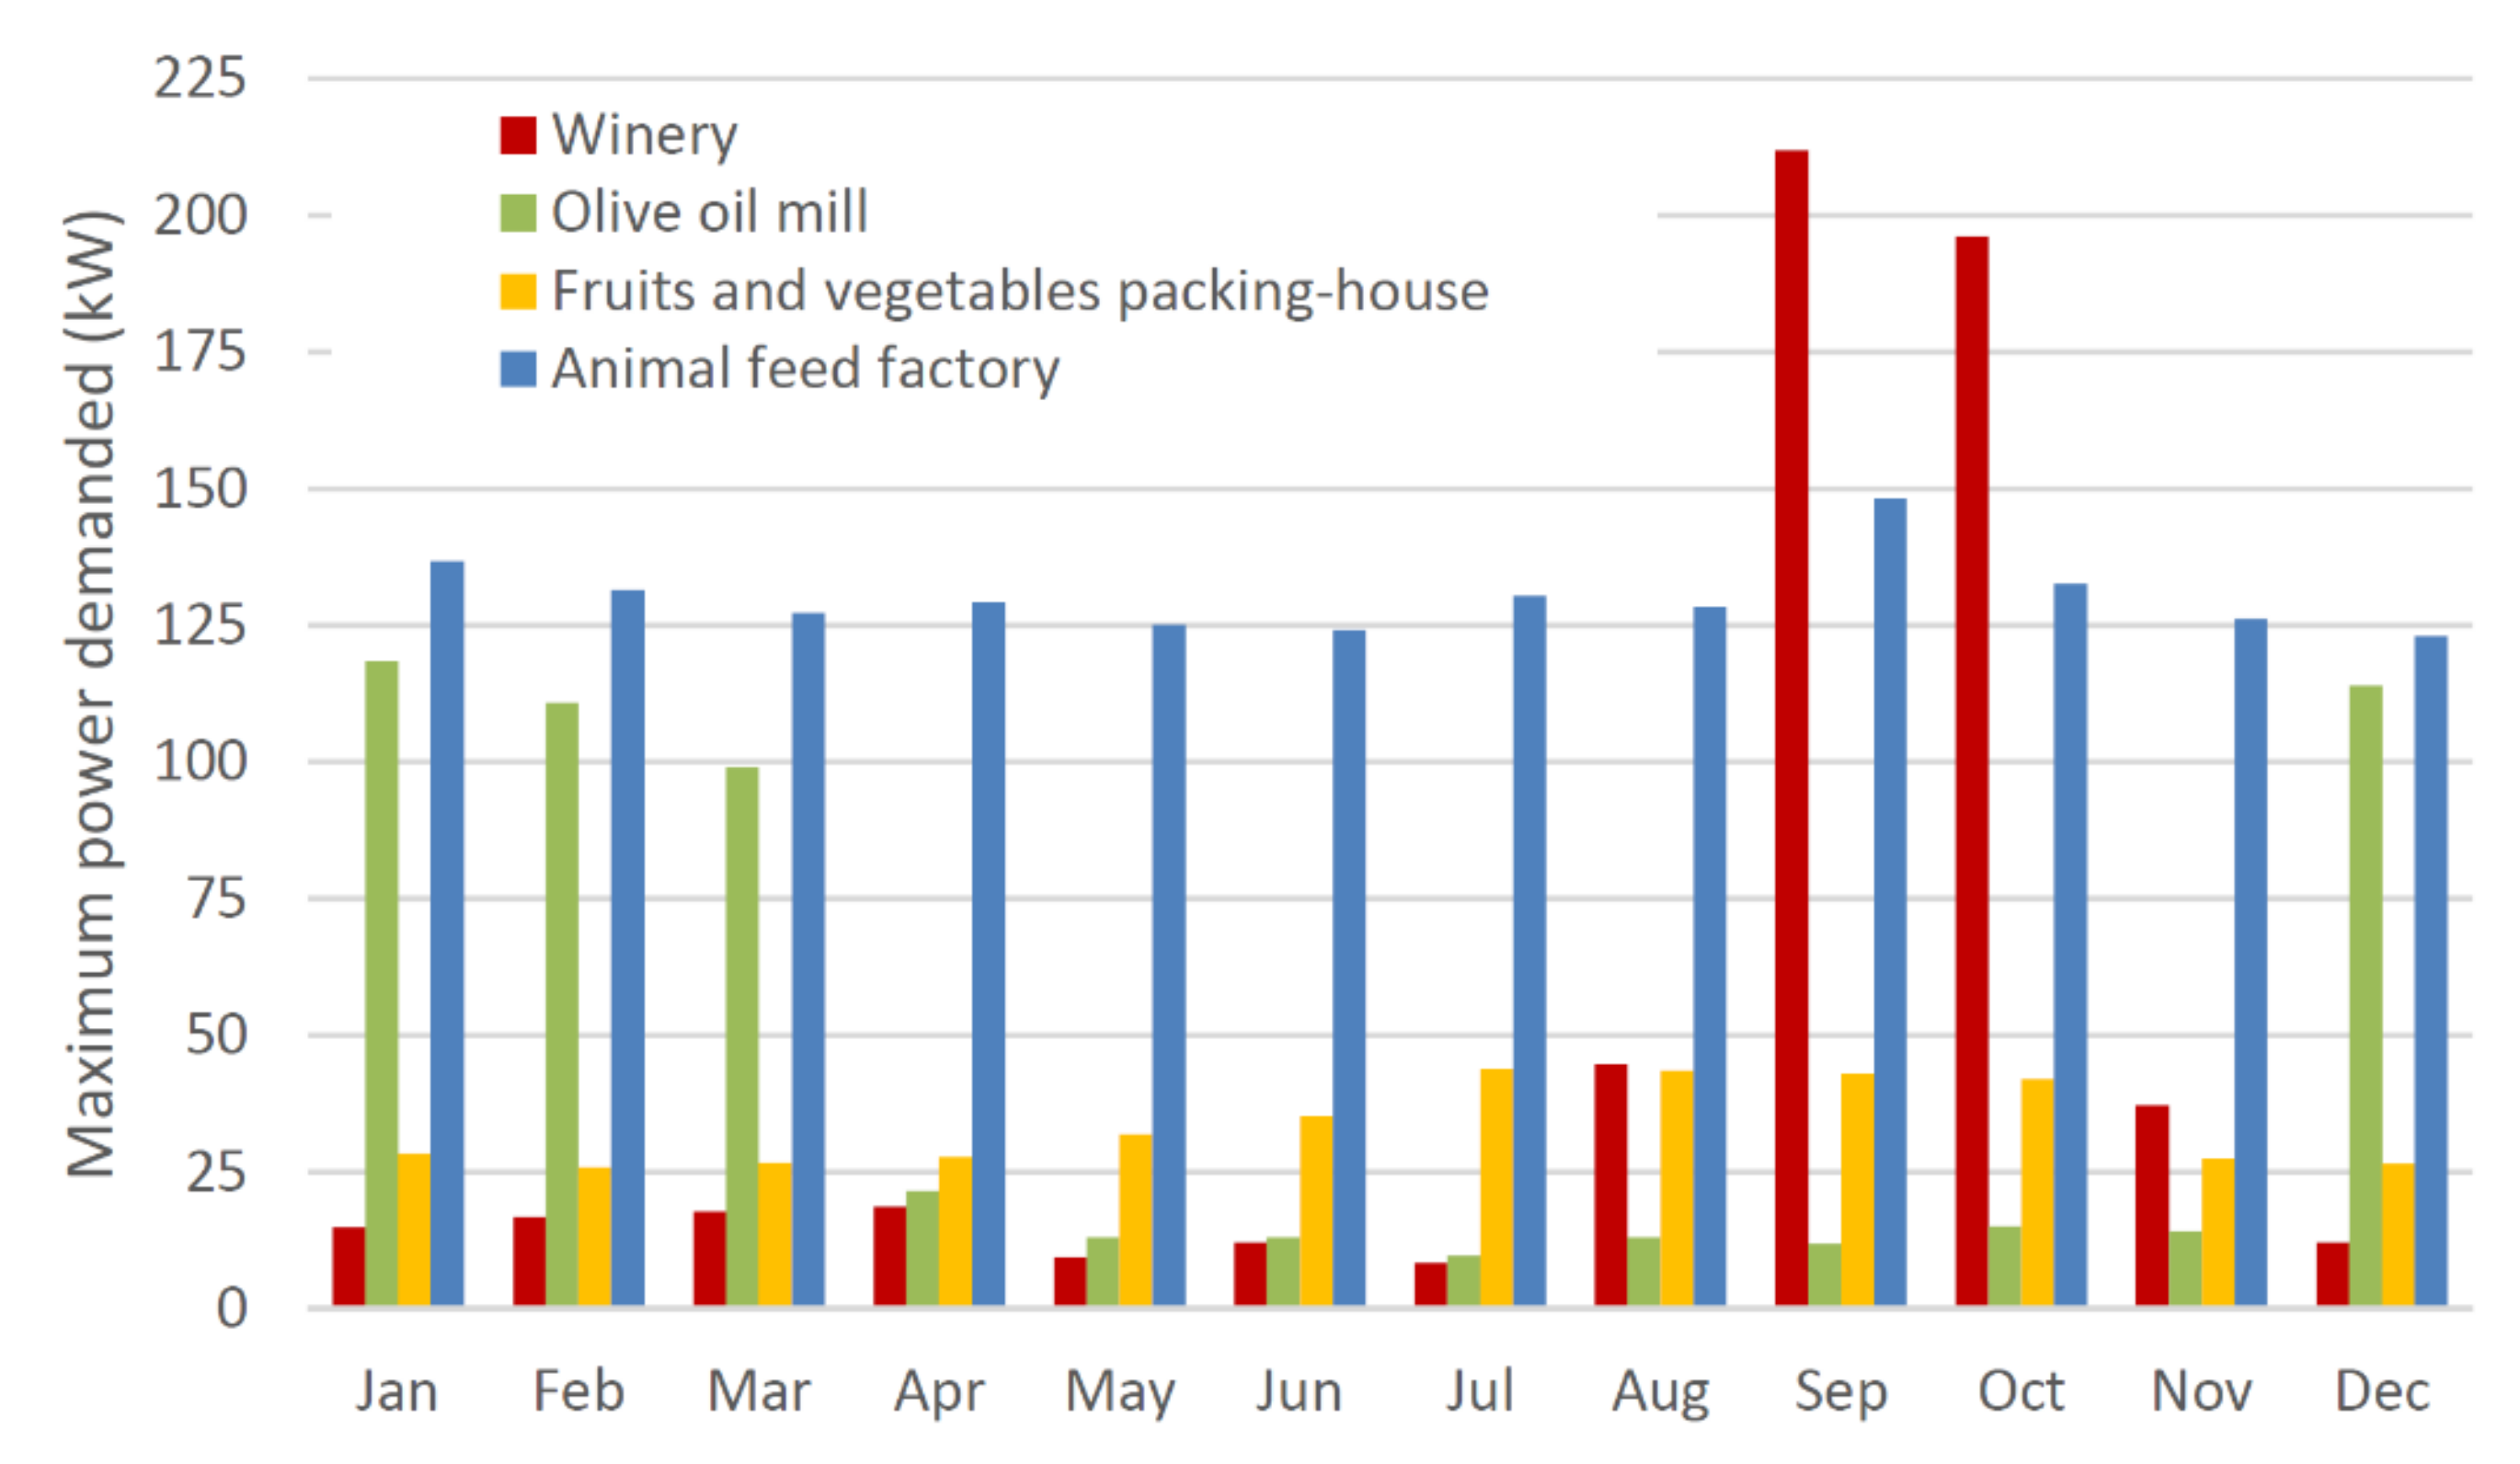
- Fruit and vegetable packing-house: relatively constant demand throughout the year. The consumption of refrigeration equipment is evident on all days of the week, with moderate power maintained throughout most of the day. Pattern: stable consumption throughout the year, with no power peaks during each day.
- (d)
- Feed mill: constant demand throughout the year, concentrated from Monday to Friday during working hours. It is characterised by high-powered equipment, usually operating for a small number of hours per day. Pattern: stable consumption throughout the year, with power peaks each day.
The four selected industries have a similar annual consumption between 106,950 and 123,764 kWh. To maintain the same reference frame, the annual consumption of each industry has been unified at 115,000 kWh. For this purpose, the consumption data (energy and power) for the different periods were extrapolated by applying a small global correction factor, maintaining the same distribution of consumption and power demanded. The corrected factor applied was 0.929 in the winery, 1.075 in the oil mill, 0.945 in the fruit and vegetable packing-house, and 1.051 in the feed mill.
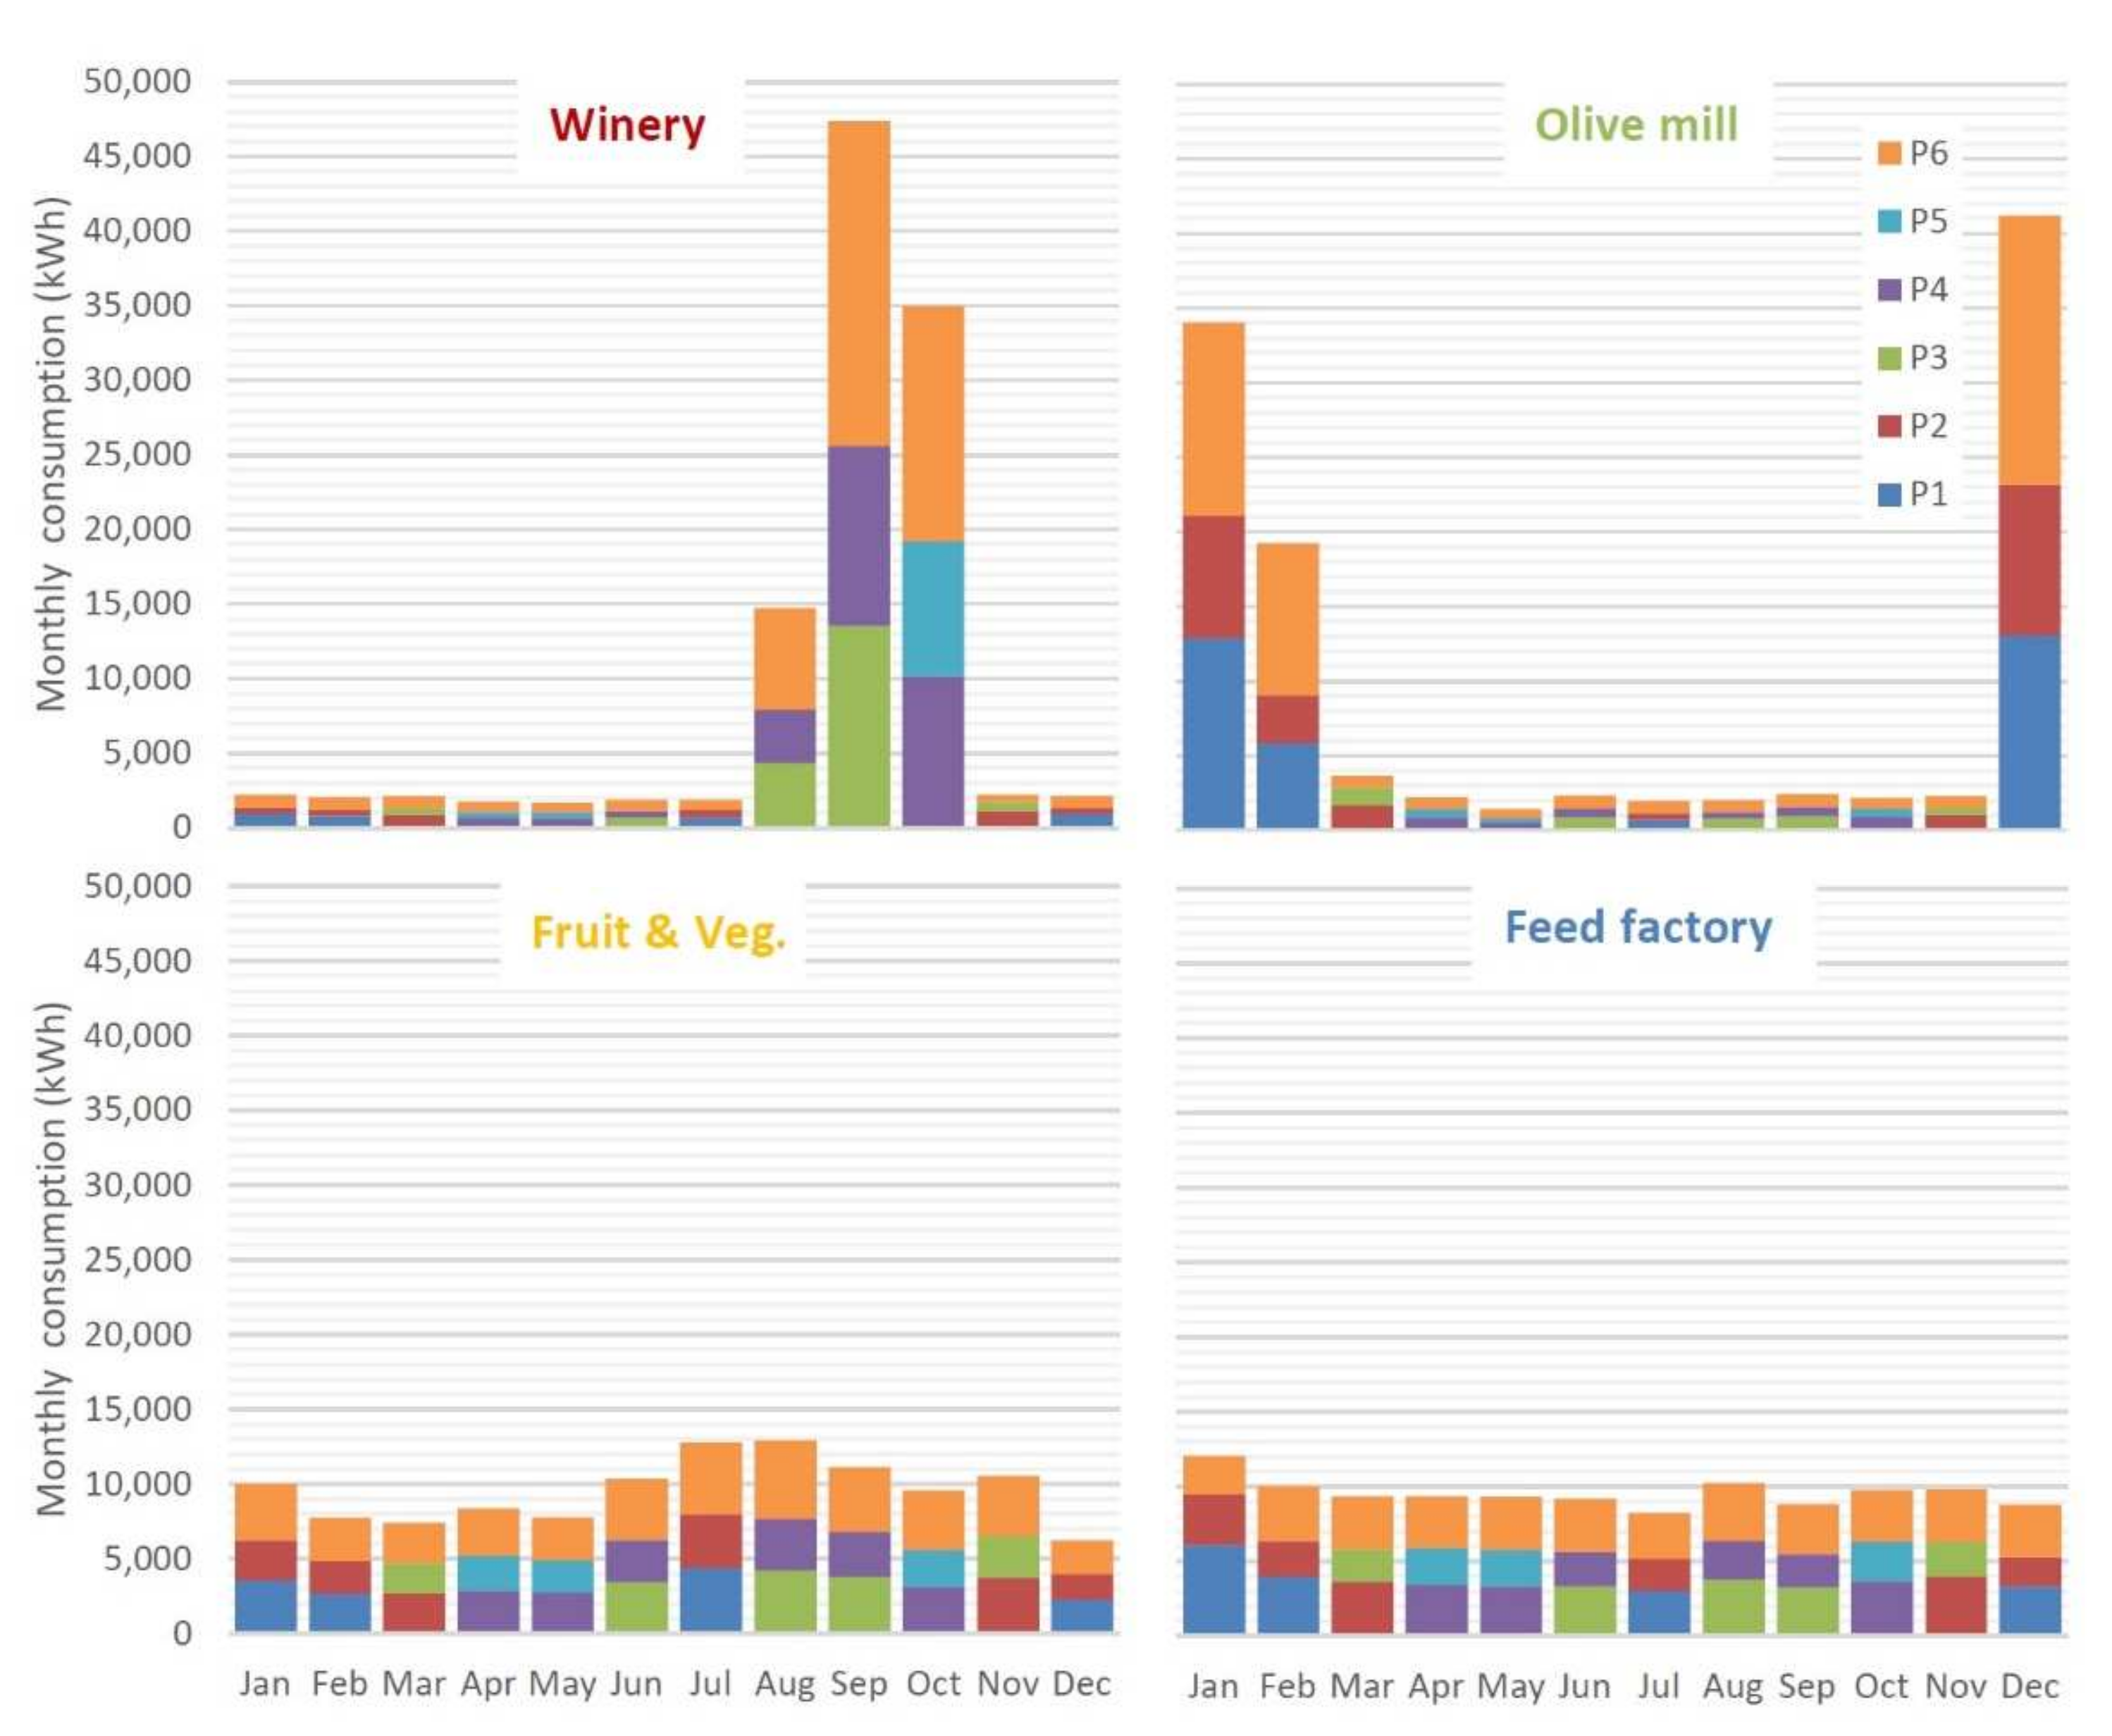
Figure 3 and Figure 4 summarise the monthly consumption and maximum power demand, highlighting the differences in their demand patterns. Figure 5 shows the distribution of consumption in the different periods of the new tariff system, obtained from the consumption curves by a quarter of an hour.
The analysis is based on three reference scenarios: the first one with the old pricing system and the other two with the current pricing system. The first scenario uses prices from May 2021 for a full year as a starting point for assessing changes. The second scenario uses prices from July 2021; it is intended to quantify the impact of the change in the tariff system. The third scenario uses prices from March 2022, allowing us to quantify the impact that the substantial increase in the price of energy in recent months will have on industries that sign new contracts, renegotiate their contracts, or have contracts with variable prices depending on the market.
In all scenarios, the contracted power has been optimised, calculating the values that minimise the annual amount of the bill.
3.2.2. Sensitivity Analysis of the above Consumption Patterns
In each of the industries, 231 additional scenarios have been analysed. The consumption pattern for each month has been modified, with different percentages of distribution between the most expensive, intermediate, and cheapest hours. The aim is to quantify the potential savings generated by changing consumption habits and shifting to lower cost periods. In addition, to analyse the impact of potential future variations regarding energy price, it has been modified from −50% to +50%, with an interval of 10%.
3.2.3. Sensitivity Analysis in Fictitious Industries with Different Seasonality
Finally, the energy cost of different seasonal consumption patterns has been quantified. For this purpose, a fictitious industry was used, with the same annual consumption as the real industries analysed (115,000 kWh). A maximum monthly demand of 50 kW was assumed for all periods. The same distribution of consumption between expensive, intermediate, and cheap hours has been assumed.
The different consumption patterns analysed are: concentrated consumption during half a year (January–June, July–December, April–September, and October–March), with the rest of the year without consumption; in quarters (Jane–March, April–June, etc.) and over two months (January–February, March–April, etc.)
For each of the defined seasonal patterns, 10 additional scenarios were analysed, modifying the energy price. In total, 154 scenarios were analysed.
4. Results
4.1. Impact of the 2021 Tariff Change
The period of adaptation to the new tariff system may affect companies in the sector unevenly. Most industries will not experience significant variations in their bill if they adapt their contracted power to the new system. The lower penalty on the power term offsets the increase in the energy term.
However, industries with very marked seasonality and consumption peaks in the months with lower prices, such as the winery analysed, take greater advantage of the drop in the fixed power term (Figure 6).
In the winery, fixed costs decrease from 14.7 k€ to 6.5 k€ (a reduction of 56%), benefiting from the lower penalty in the months without production. With peak consumption in September and October (the lowest-cost months), the amount of energy hardly increases compared to the former system (1%). As a result, an annual savings of 31% is achieved in the electricity bill compared to the former tariff system.
The oil mill’s peak consumption occurs in months with higher power and energy costs. As a result, it hardly benefits from the lower penalty in the off-season months due to seasonality. Although the amount of power is reduced by 26%, it is neutralised by the 19% increase in the energy term, with a reduction in the annual bill of barely 3%.
In the fruit and vegetable packing-house, the lower contracted power limits the savings achieved with the power term, with an annual amount similar to that which would have been maintained in the old system.
In the case of the feed mill, with higher power demand, the savings would reach 7% per year (Figure 6).
All results are based on scenarios with optimised contracted power. The annual amount of the bill will be higher if the contracted powers are not adapted to the new hourly discriminating system. By not requesting a change, the contracting powers of the old system are assigned to the new one: P1 → P1; P2 → P2, P3, P4, and P5; P3 → P6. Thus, maintaining the contract powers of the former system, the variation of the bill would be −26% for the winery, +3% for the oil mill, +5% for the fruit and vegetable packing-house, and +10% for the animal feed factory (Figure 7). In other words, the bill can be reduced by between 5% and 15% compared to the scenario without optimisation. Many industries are likely paying these increases as they do not know how to adapt their power to the new system of hourly discrimination with monthly variations.
In short, this type of change in the tariff system (which makes the power term cheaper and the energy term more expensive) should not increase the cost of the electricity bill if the contracted power is adapted to the new hourly discrimination. Seasonal industries with consumption peaks in the months with the lowest energy costs can take advantage of the change in the system to significantly reduce their electricity costs (31% in the winery analysed).
4.2. Impact of the Electricity Price Increase Experienced So Far (March 2022)
The tremendous increase in energy prices on wholesale markets has magnified the potential to improve the new tariff system. All industries whose prices are subject to wholesale market variations, who must sign new contracts, or whose prices are updated, will have to assume a much higher annual amount than what they would have paid a year earlier.
Thus, the winery would pay 62% more than under the former tariff system, compensating a part of the huge increase in the energy price (from 12.1 k€ to 37.6 k€) with the reduction of the power term (Figure 6). The annual amount in the oil mill increases by 103%, penalised by months of higher costs (from 12.3 k€ to 41.4 k€ in the energy term). The fruit and vegetable packing-house increases by 151%, since in the former system it was the one that paid the least for power. The animal feed factory increases by 89%.
The amount in euros that can be achieved by optimising the power is like that obtained with the July 2021 prices. However, considering that the fixed term reduces its importance, the percentage of savings that can be achieved compared to the total decreases, with a maximum of 6% (Figure 7).
If all costs finally paid by the consumer (taxes, charges, etc.) are transferred to the average annual price per kWh consumed, the following average values result: 0.38 €/kWh in the winery, 0.43 €/kWh in the oil mill, 0.37 €/kWh in the fruit and vegetable packing-house, and 0.43 €/kWh in the animal feed mill.
Such high prices require immediate corrective measures to maintain the sector’s viability.
In industries with relatively constant demand throughout the year, the implementation of Photovoltaic (PV) could be a solution, as shown in previous studies [18]. The constant demand pattern allows the energy generated by PV to be used throughout the year, leading to greater profitability.
Another alternative to mitigate the current high prices could be the use of generators. Considering the current price of diesel (1.1 €/L; approximately 0.12 €/kWh), the payback on the purchase of gensets could be less than one year, depending on the relationship between the prices of the different energy sources. Gensets would be better suited to the seasonal pattern; as equipment with a lower investment cost than PV, they can be profitable with fewer operating hours per year.
These changes in generation (photovoltaic/gensets) can have a particularly important impact on the energy costs of industries. The consumption patterns defined in this study show guidelines for using one system or the other.
4.3. Sensitivity Analysis of the Distribution of Consumption between Periods
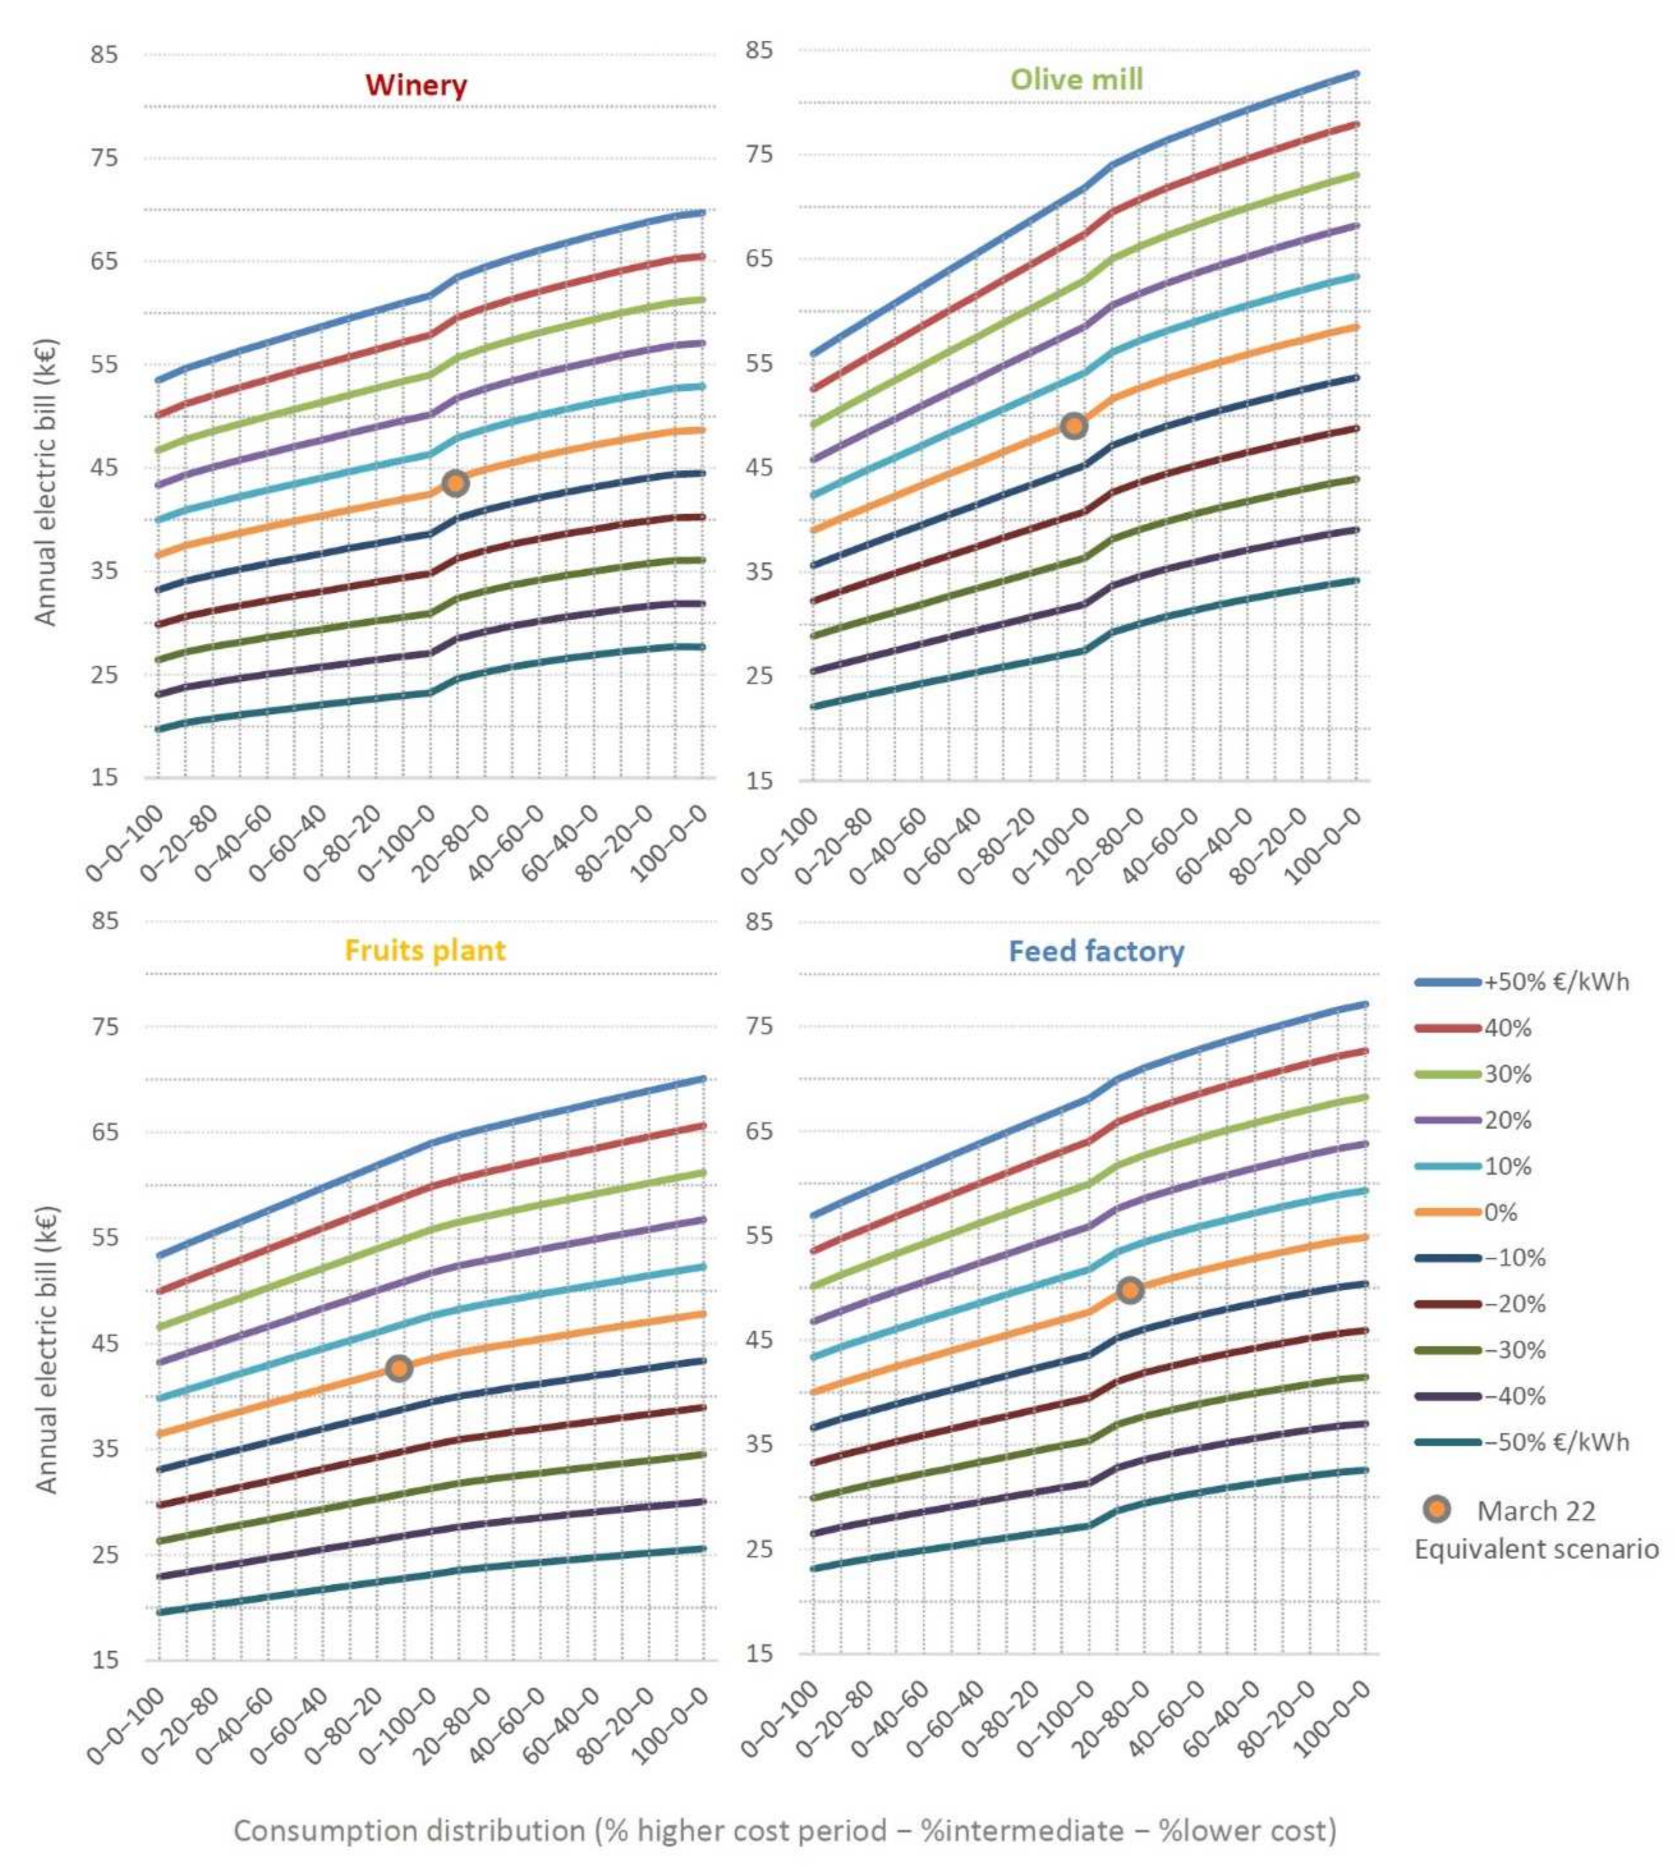
Shifting consumption to lower-cost periods of the month is another measure that helps to reduce the amount of the bill. It is a clear option that industries can evaluate in the face of rising electricity prices: shifting consumption to night or weekend hours. However, it is necessary to quantify the potential savings to determine whether it is worth making changes in the production process or the organisation of work shifts. For this purpose, different fictitious consumption distributions have been analysed. The starting point is a scenario with all consumption concentrated in the lowest cost period of each month, progressively shifting it to more expensive periods, first to the intermediate and then to the highest cost period until reaching 100%.
Given the volatility of prices, the analysis has been carried out for different scenarios of variation in the price of the current energy term.
The maximum potential improvement, shifting all consumption in the expensive period to all consumption in the lower cost period, ranges from 23% (+50%€/kWh) to 29% (−50%€/kWh) in the winery, 32–35% in the olive mill, 24% in the fruit and vegetable packing-house, and 26–29% in the feed mill (Figure 8).
However, based on the actual scenario, the potential improvement is smaller. If the industries were able to shift all consumption to the lowest-cost period each month, the savings generated compared to the March 2022 scenario would be 16% in the winery, 21% in the oil mill, 14% in the fruit and vegetable packing-house, and 19% in the feed mill. The differences between the distinct types of industries are due to the existing original distribution, their proximity to the ideal scenario of all consumption in P6, and penalties for overruns. As can be seen, this concept can contribute to mitigating the cost increase but cannot solve it, even with drastic changes in production schedules.
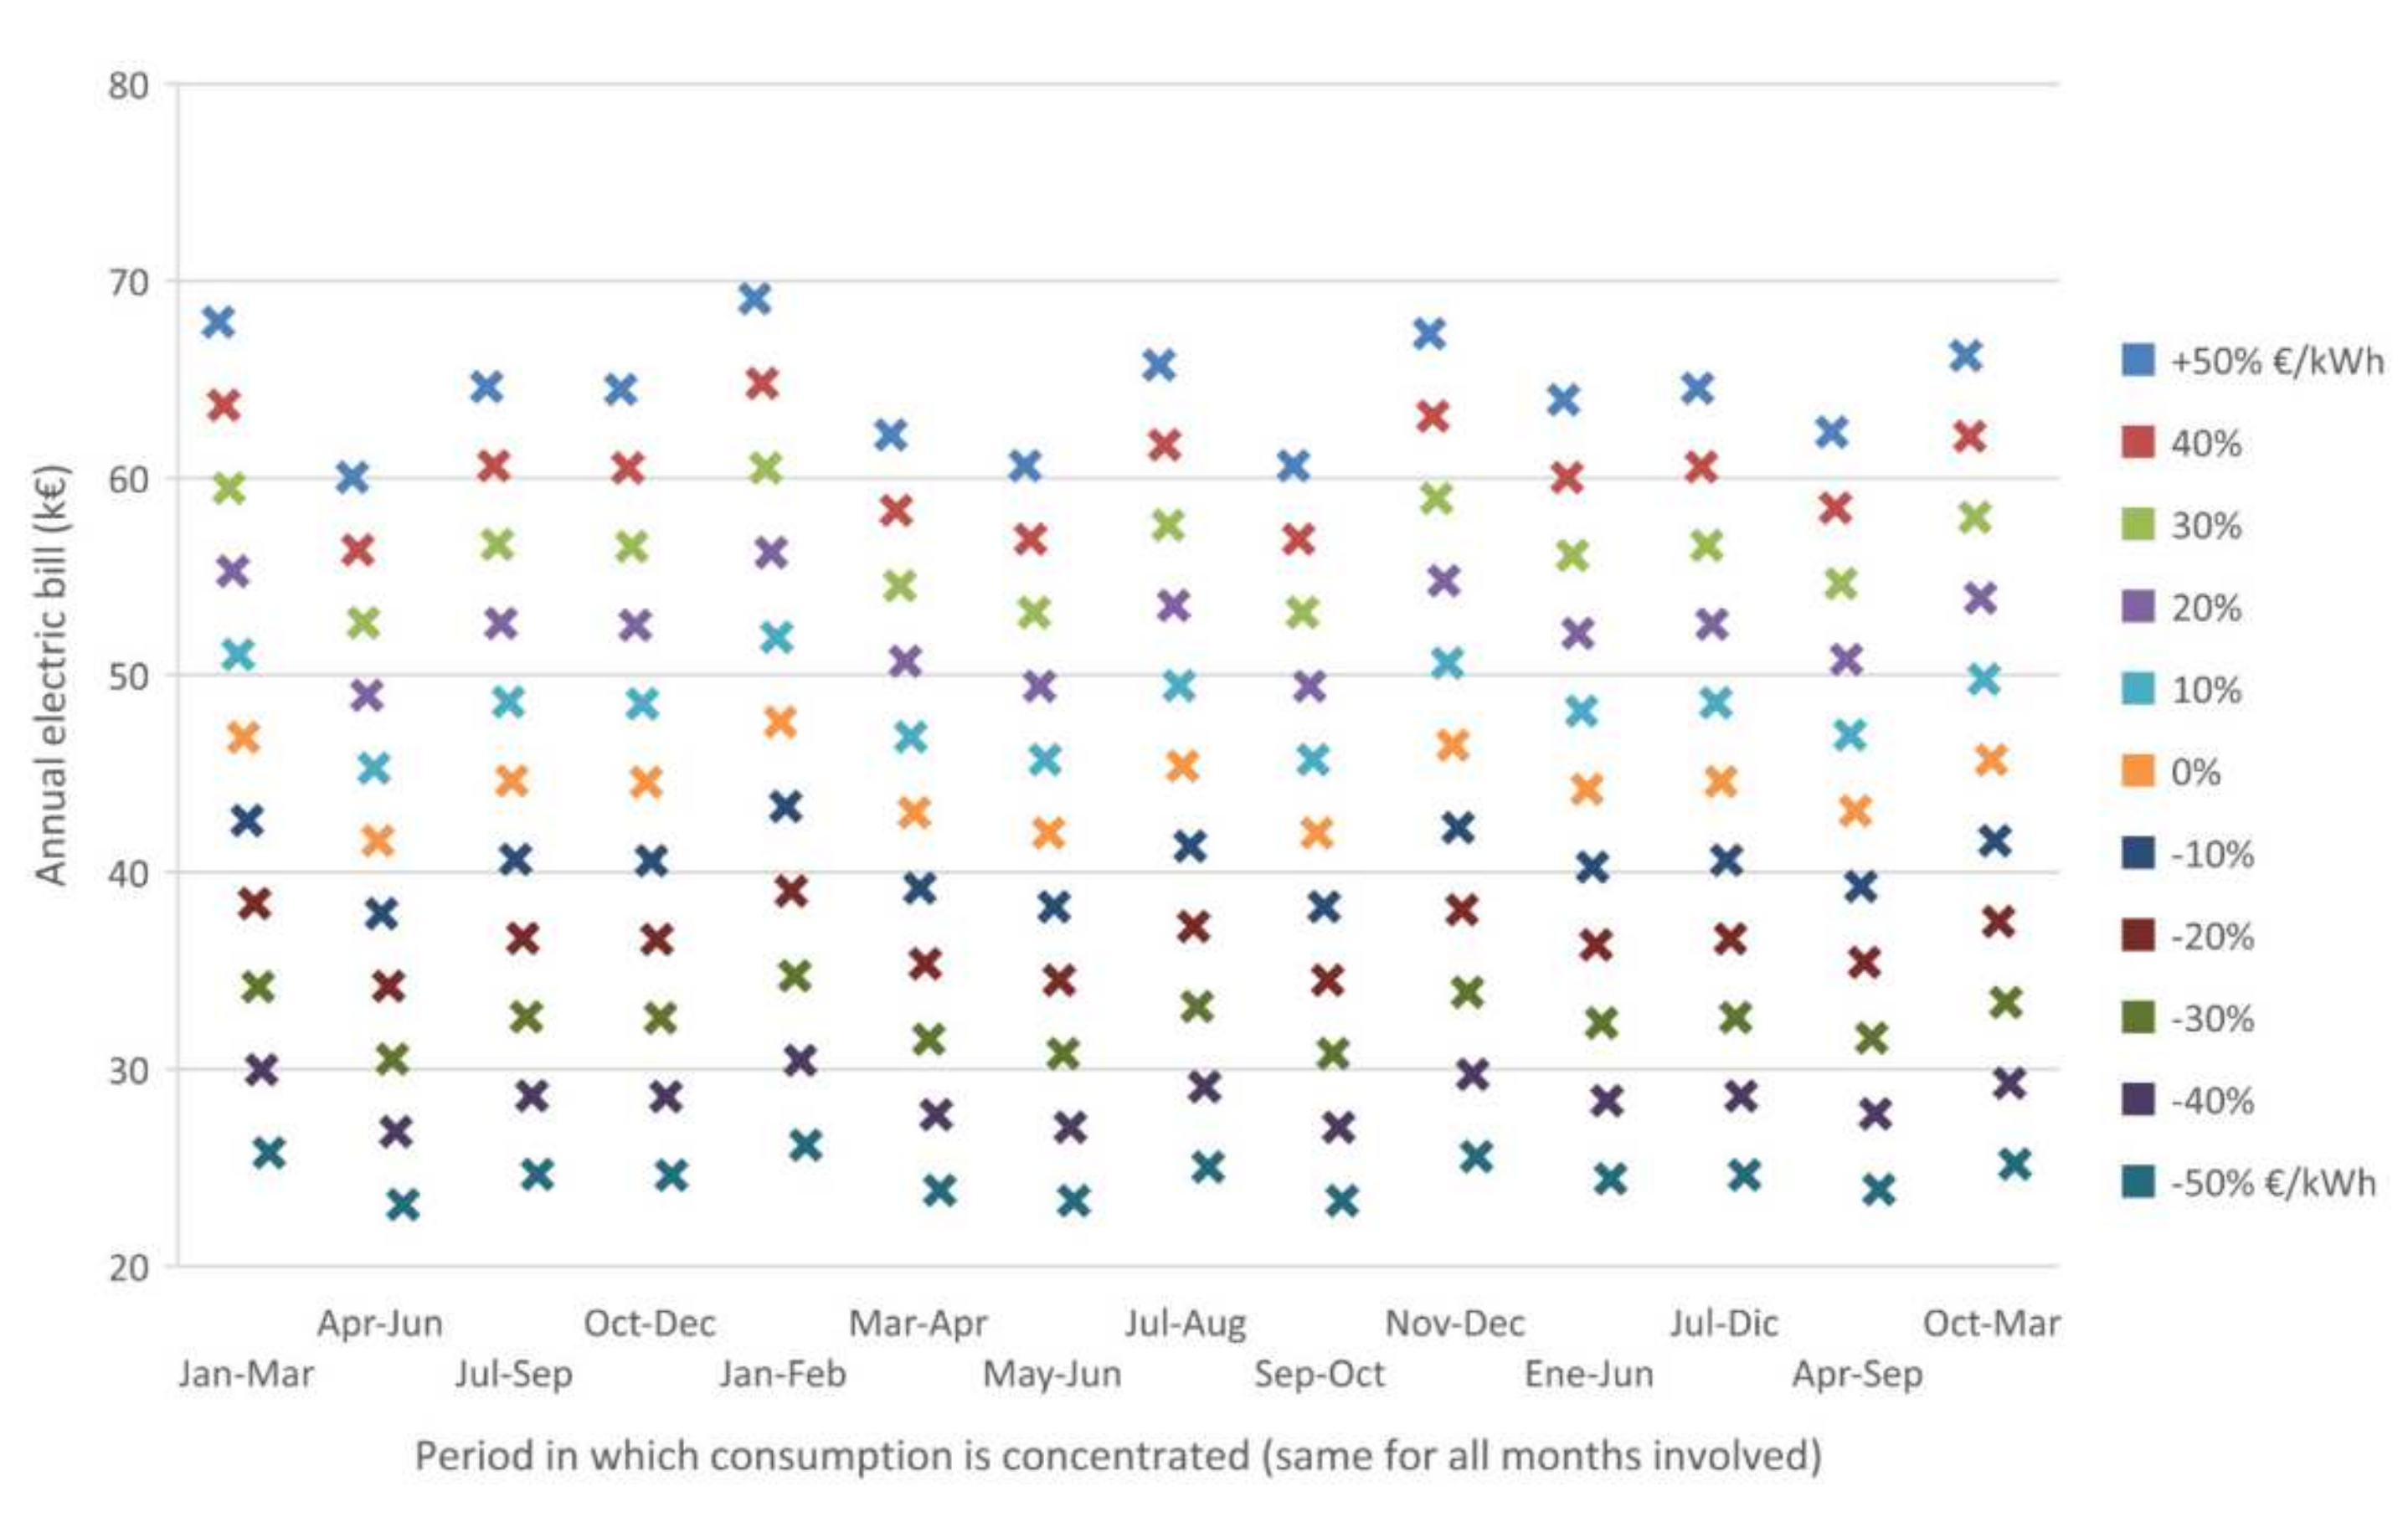
4.4. Sensitivity Analysis of Seasonal Changes in the Demand Pattern (Dummy Industries)
After studying the demand of four real industries in-depth, a sensitivity analysis of other annual consumption distribution patterns is proposed, which can be used as a reference for other industries or agricultural and livestock holdings. As in the previous analysis, given the volatility of prices, the analysis has been carried out for different scenarios of variation in the price of the current energy term.
If consumption periods are seasonal, industries that concentrate their consumption in spring (Apr–Jun) are less penalised than those in winter, autumn or summer, as they coincide with the months with the lowest power and energy costs (Figure 9).
If consumption is bimonthly, the bill can be reduced by up to 12% in May-Jun or Sep-Oct compared to Jan-Feb. When consumption is concentrated over half a year, the differences between periods are not very significant. Again, as in the previous section, the reductions achieved are not important enough to solve the problem.
5. Discussion
5.1. New Tariff System
With the substantial change in the Spanish tariff system, most industries and farms in the sector have quite different tariffs, with seasonality and 6 periods that change throughout the months instead of the same three periods every month. Hourly discrimination changes, with the lowest- and highest-cost hours gaining importance and the intermediate-cost hours losing importance.
In addition, the price of the energy term has increased significantly (€/kWh) compared to the former tariffs. On the other hand, the power term (€/kWh) has undergone a significant reduction.
This new tariff system affects the agri-food sector in an unequal way. Seasonal industries with consumption peaks in the months with the lowest energy costs can take advantage of the change in the system to significantly reduce their electricity costs (31% in the period analysed). To do this, it is necessary to have contractually maintained fixed prices for the energy term (€/kWh) from June 2021.
In most agro-industries, this type of change in the tariff system (which lowers the power term and makes the energy term more expensive) should not imply an increase in the cost of the electricity bill if the contracted power is adapted to the new hourly discrimination.
5.2. Energy Price Increases
The huge rise in the price of energy on wholesale markets has dwarfed the potential for improving the new tariff system. All industries that have market-indexed prices must sign new contracts or have had their prices updated at the beginning of the year, or they will assume dramatic increases compared to the previous year. These increases range from 62% to 151% in the industries analysed.
Considering all fixed costs, taxes, etc., the average annual price per kWh consumed is 0.38€/kWh in the winery, 0.43 €/kWh in the oil mill, 0.37 €/kWh in the fruit and vegetable packing-house, and 0.43 €/kWh in the feed mill.
The current situation, aggravated by the war in Ukraine, seems to indicate high prices for the coming months or even years. To mitigate the impact of the exorbitant price, measures must be implemented urgently.
Constant hourly discrimination throughout the year should make it easier for industries to plan peak consumption activities, shifting them to lower-cost periods where possible. Agro-industries with the connection of powerful process machinery during limited hours, such as feed mills, are better candidates to implement this measure. Based on the actual scenarios analysed and shifting all consumption to the period of lowest monthly cost, the savings generated would be between 14% and 21%. These reductions are not especially important, so this concept is one more that contributes to mitigating the cost increase; but it cannot solve it, even with drastic changes in production schedules.
6. Conclusions
The agri-food industries are facing a new energy context radically different from what existed less than a year ago due to the tariff change in June 2021 and the increase in the price of energy in wholesale markets. Rapid implementation of adaptation measures may be key to maintaining the competitiveness and viability of the sector in the short- and medium-term.
In just one year, electricity bills have increased by up to 150%. The savings generated by implementing measures such as optimising contracted power to a new hourly discrimination system (up to 6%) or shifting consumption to lower cost periods (up to 21%) do not seem sufficient.
Once the possibilities of the tariff system have been studied, the best options seem to point to the installation of electricity generation systems in industries. The consumption patterns defined in this study show the guidelines for using one system or the other.
In the current context, using diesel gensets can lead to significant savings in the short term. With the current price of diesel fuel close to 1.1 €/L (around 0.12 €/kWh), the purchase of generating sets could become profitable in less than one year, depending on the prices of the different energy sources. Gensets would be better suited to industries with high seasonality.
Implementing renewable energy could be the solution in many industries, especially in non-seasonal industries. For example, the fruit and vegetable industry analysed seems to be an excellent candidate. Its relatively constant demand throughout the year, with peaks during summer and at the central hours of the day, is adapted to energy production in photovoltaic installations. Before investing in generation, all general techniques of efficiency in electricity consumption should have been previously applied.
In addition to measures implemented by individual industries, the reduction of VAT and other regulated costs by the government should be a measure considered to maintain competitiveness until prices normalise.
If all of the above measures are not enough, the final consumer will be forced to bear part of the solution through the necessary increase in the selling price of products.
Although the study focuses on the agro-food industries, many of the proposed adaptation measures and the results shown in the sensitivity analyses could be extrapolated to all types of agricultural and livestock farms, being useful for their energy adaptation.
Author Contributions
Conceptualization, J.L.G. and F.R.M.; methodology, J.L.G. and F.R.M.; software, A.P. and R.M.B.; validation, A.P. and R.M.B.; formal analysis, F.R.M., A.P. and R.M.B.; investigation, A.P.; resources, J.L.G.; writing—original draft preparation, F.R.M.; writing—review and editing, R.M.B.; visualization, A.P.; supervision, J.L.G.; project administration, J.L.G. All authors have read and agreed to the published version of the manuscript.
Funding
This research did not receive external funding.
Data Availability Statement
Data is contained within the article.
Acknowledgments
The authors thank the participating agro-industries for their collaboration in the research.
Conflicts of Interest
The authors declare no conflict of interest.
References
- FoodDrinkEurope Annual Report. Available online: https://www.fooddrinkeurope.eu/resource/fooddrinkeurope-annual-report-2020/ (accessed on 10 January 2022).
- MAPA Informe Anual de la Industria Alimentaria Española Periodo 2020–2021 (Annual Report of the Spanish Food Industry Period 2020–2021). Available online: https://www.mapa.gob.es/es/alimentacion/temas/industria-agroalimentaria/cifras-industria/ (accessed on 21 November 2021).
- Serrano, G.J.; Alvarez, A.C. Industrial electricity prices in Spain: A discussion in the context of the European internal energy market. Energy Policy 2021, 148, 11930. [Google Scholar]
- Foroozandeh, Z.; Ramos, S.; Soares, J.; Vale, Z.; Dias, M. Single contract power optimization: A novel business model for smart buildings using intelligent energy management. Int. J. Electr. Power Energy Syst. 2022, 135, 107534. [Google Scholar] [CrossRef]
- Fernandez, M.A.; Zorita, A.L.; Garcia-Escudero, L.A.; Duque, O.; Morinigo, D.; Riesco, M.; Munoz, M. Cost optimization of electrical contracted capacity for large customers. Int. J. Electr. Power Energy Syst. 2013, 46, 123–131. [Google Scholar] [CrossRef]
- Rosado, B.; Torquato, R.; Venkatesh, B.; Gooi, H.B.; Freitas, W.; Rider, M.J. Framework for optimizing the demand contracted by large customers. Iet Gener. Transm. Distrib. 2020, 14, 635–644. [Google Scholar] [CrossRef]
- Papier, F. Managing Electricity Peak Loads in Make-To-Stock Manufacturing Lines. Prod. Oper. Manag. 2016, 25, 1709–1726. [Google Scholar] [CrossRef]
- Goosen, P.; Mathews, M.J.; Vosloo, J.C. Automated electricity bill analysis in South Africa. South Afr. J. Ind. Eng. 2017, 28, 66–77. [Google Scholar] [CrossRef] [Green Version]
- Roberts, M.B.; Bruce, A.; MacGill, L. Impact of shared battery energy storage systems on photovoltaic self-consumption and electricity bills in apartment buildings. Appl. Energy 2019, 245, 78–95. [Google Scholar] [CrossRef]
- Saad, N.M.; Abdullah, Z.; Yusof, N.Y.M.; Husin, N.M.; Mohayiddin, A.L.; Arshad, M.T.M. A Goal Programming Approach to Peninsular Of Malaysia Electricity Tariff Structure. J. Mech. Contin. Math. Sci. 2019, 215–225, Special Issue-1. [Google Scholar]
- Albatayneh, A.; Juaidi, A.; Abdallah, R.; Peña-Fernández, A.; Manzano-Agugliaro, F. Effect of the subsidised electrical energy tariff on the residential energy consumption in Jordan. Energy Rep. 2022, 8, 893–903. [Google Scholar] [CrossRef]
- Salmerón-Manzano, E.; Alcayde, A.; Manzano-Agugliaro, F. 12—Worldwide trends in energy market research. In Energy Services Fundamentals and Financing; Borge-Diez, D., Rosales-Asensio, E., Eds.; Academic Press: London, UK, 2021; pp. 277–292. [Google Scholar]
- CNMC. Circular 3/2020, de 15 de Enero, por la que se Establece la Metodología Para el Cálculo de los Peajes de Transporte y Distribución de Electricidad; (establishes the methodology for calculating electricity transmission and distribution tolls); Boletín Oficial del Estado: Madrid, Spain, 2020. [Google Scholar]
- MTERD. Real Decreto 148/2021, de 9 de Marzo, por el que se Establece la Metodología de Cálculo de los Cargos del Sistema Eléctrico; (establishes the methodology for calculating charges for the electrical system); Boletín Oficial del Estado: Madrid, Spain, 2021. [Google Scholar]
- CNMC. Resolución de 18 de Marzo de 2021, de la Comisión Nacional de los Mercados y la Competencia, por la que se Establecen los Valores de los Peajes de Acceso a las Redes de Transporte y Distribución de Electricidad de Aplicación a Partir del 1 de Junio de 2021; (establish the values of the access tolls to the electricity transmission and distribution networks applicable as of June 1, 2021); Boletín Oficial del Estado: Madrid, Spain, 2021. [Google Scholar]
- MTERD. Orden TED/371/2021, de 19 de Abril, por la que se Establecen los Precios de los Cargos del Sistema Eléctrico y de los Pagos por Capacidad que Resultan de Aplicación a Partir del 1 de Junio de 2021; (establishing the prices of the electricity system charges and payments for capacity that are applicable as of June 1, 2021); Boletín Oficial del Estado: Madrid, Spain, 2021. [Google Scholar]
- Somenergia Historico de Tarifas de Electricidad (Electricity Rates). Available online: https://www.somenergia.coop/es/tarifas-de-electricidad/historico-de-tarifas-de-electricidad/ (accessed on 15 March 2022).
- Perdigones, A.; Garcia, I.; Porras-Prieto, C.J.; Gomez-Villarino, M.T.; Baptista, F.; Garcia, J.L. Evaluation of the cost-effectiveness of grid-connected photovoltaic solar energy in wineries. Cienc. E Tec. Vitivinic. 2021, 36, 45–54. [Google Scholar] [CrossRef]
Figure 1.
Time-discriminating 6-period tariffs in mainland Spain.

Figure 2.
Evolution of the price of electricity offered to the consumer (a) energy term: €/kWh; (b) power term: €/kW yearly.
Figure 2.
Evolution of the price of electricity offered to the consumer (a) energy term: €/kWh; (b) power term: €/kW yearly.

Figure 3.
Evolution of the monthly energy consumption of each of the industries analysed.

Figure 4.
Maximum monthly power demanded in the industries analysed.

Figure 5.
Monthly energy consumption broken down into the different periods of the new tariff system.
Figure 5.
Monthly energy consumption broken down into the different periods of the new tariff system.

Figure 6.
Annual electricity bill amount under three different scenarios and prices, with optimised contracted power: former tariff system with prices as of May 2021, current tariff system with prices as of July 2021, and current tariff system with current prices as of March 2022.
Figure 6.
Annual electricity bill amount under three different scenarios and prices, with optimised contracted power: former tariff system with prices as of May 2021, current tariff system with prices as of July 2021, and current tariff system with current prices as of March 2022.

Figure 7.
Annual electricity bill amount under three different scenarios and prices, maintaining the contracted power of the former tariff system: former tariff system with prices as of May 2021, current tariff system with prices as of July 2021, and current tariff system with current prices as of March 2022.

Figure 8.
Annual electricity bill in scenarios with different consumption distribution (% in the lowest cost period, % in the intermediate period, and % in the high-cost period). For each reference scenario, the variation in the price of the energy term is analysed.
Figure 8.
Annual electricity bill in scenarios with different consumption distribution (% in the lowest cost period, % in the intermediate period, and % in the high-cost period). For each reference scenario, the variation in the price of the energy term is analysed.

Figure 9.
Amount of the annual bill of a fictitious industry with an annual consumption of 115,000 kWh, according to different consumption patterns: concentrated in the 4 seasons, in 2-month periods, and in 6-month periods.
Figure 9.
Amount of the annual bill of a fictitious industry with an annual consumption of 115,000 kWh, according to different consumption patterns: concentrated in the 4 seasons, in 2-month periods, and in 6-month periods.

Publisher’s Note: MDPI stays neutral with regard to jurisdictional claims in published maps and institutional affiliations. |
© 2022 by the authors. Licensee MDPI, Basel, Switzerland. This article is an open access article distributed under the terms and conditions of the Creative Commons Attribution (CC BY) license (https://creativecommons.org/licenses/by/4.0/).
Share and Cite
MDPI and ACS Style
García, J.L.; Perdigones, A.; Benavente, R.M.; Mazarrón, F.R. Influence of the New Energy Context on the Spanish Agri-Food Industry. Agronomy 2022, 12, 977. https://0-doi-org.brum.beds.ac.uk/10.3390/agronomy12040977
AMA Style
García JL, Perdigones A, Benavente RM, Mazarrón FR. Influence of the New Energy Context on the Spanish Agri-Food Industry. Agronomy. 2022; 12(4):977. https://0-doi-org.brum.beds.ac.uk/10.3390/agronomy12040977
Chicago/Turabian StyleGarcía, José L., Alicia Perdigones, Rosa M. Benavente, and Fernando R. Mazarrón. 2022. "Influence of the New Energy Context on the Spanish Agri-Food Industry" Agronomy 12, no. 4: 977. https://0-doi-org.brum.beds.ac.uk/10.3390/agronomy12040977
Note that from the first issue of 2016, this journal uses article numbers instead of page numbers. See further details here.