
Comparative Analysis of Canopy Cooling in Wheat under High Temperature and Drought Stress


1
Banasthali Vidyapith, Jaipur 304022, India
2
ICAR-National Institute of Abiotic Stress Management (NIASM), Malegaon Kh, Baramati 413115, India
3
Center of Plant Systems Biology and Biotechnology (CPSBB), 4000 Plovdiv, Bulgaria
*
Author to whom correspondence should be addressed.
Agronomy 2022, 12(4), 978; https://0-doi-org.brum.beds.ac.uk/10.3390/agronomy12040978
Submission received: 12 March 2022
/
Accepted: 15 April 2022
/
Published: 18 April 2022
(This article belongs to the Topic Physiological and Molecular Characterization of Crop Tolerance to Abiotic Stresses)
Abstract
:The size and the weight of wheat grains vary across the length of each spike (Triticum aestivum L.). High temperature and water scarcity often reduce the single grain weight, and this reduction also varies across the spike length. Plants tend to cope with high temperature and drought stress through inherent mechanisms such ascanopy cooling through transpiration, which can contribute to yield stability. The effect of canopy cooling on the average grain weight at different positions in spike is still unknown. In this study, we planned to assess the role of canopy temperature, yield-related traits, and spike shape in final grain weight. For two years (2017–2018 and 2018–2019), fifteen diverse genotypes released for cultivation in different environmental conditions were grown in the field. They were examined for canopy temperature, spikelets spike−1, grain number spike−1, grain yield spike−1, and grain weight of the spike’s basal, median, and distal regions. The Pearson correlation coefficient (r) was obtained for all pair-wise combinations of traits under different treatments and spike shapes. The results indicated that cooler canopy is correlated to grain weight in normal spike shape at all three positions within the spike irrespective of stress. The advantage of the cooler canopy in improving grain-filling at basal, median, and distal regions was more conspicuous in the high temperature stress conditions compared to non-stressed and drought conditions.
1. Introduction
Wheat (Triticum aestivum L.) is primarily a staple food consumed by 44% of the world’s population, including those in developing countries. Wheat is highly vulnerable to adverse effects of high temperature and drought which may intensify due to predicted climate change [1]. Depending on the characteristics of these abiotic stress events, grain-filling parameters are affected variedly. Post-anthesis drought reduces the ultimate grain mass by shortening the duration and decreasing the grain-filling rate [2]. Moderate to high temperatures tend to shorten grain-filling duration and accelerate the speed of grain-filling, but without total compensation [3,4].
Spike morphology parameters, including spike shape, are associated with yield, easier threshing, and stress tolerance [5,6]. The number of grains and the grain weight vary at different positions within the spike, i.e., basal, median, and distal. Spikelet formation starts at the middle of the spike and then advances both ways (upwards and downwards) in the spike [7]. Hence, grain weight is greater at the middle part of the spike relative to apical or bottom parts [8,9]. However, floret development within the spikelets begins from the bottom, and distal florets have relatively lower grain weight [10,11]. Thus grain-filling differs for spikelets according to their location on the spike [12]. Maintenance of lower canopy temperature during grain development, particularly under high temperature and drought stress, increases the source strength. Infrared radiation reflected by the plant canopy indicates the canopy temperature hence infrared sensors are engaged for canopy temperature measurements [13].
Wheat genotypes with higher grain yield had a cooler canopy under irrigated conditions [14]. Canopy temperature can also predict crop water requirements under water-limited conditions [15]. A significant direct correlation between the crop water status and the canopy temperature depression (CTD) exists in spring wheat under irrigated conditions [16]. Correlation between CTD and sink traits in stable and adapted genotypes may provide a genetic relationship between source and sink traits. This information could be helpful for plant breeders in selecting the genotypes with higher productivity. Sink components such as grain number spike−1 and spikelets spike−1 under abiotic stresses have been studied in detail [17,18]. Grain yield depends on the traits associated with source-sink interrelationship, and genetic diversity exists for these traits under drought and heat stress [19,20]. Many studies have reported the effect of terminal drought stress and high temperature stress on yield components, and the correlation between these traits [21,22]. A balanced enhancement in floret fertility and canopy longevity should also be prioritized [23].
The knowledge of the effect of canopy coolness on the grain yield components under high temperature and drought stress in the popular cultivars of wheat is limited as many of them have been selected based on grain yield and disease resistance. The present study was planned to investigate the advantage of the cooler canopy on the intra-spike distribution of assimilates represented by grain weight at the basal, central, and apical region of spike under non-stressed, terminal heat stress, and terminal drought stress conditions. Experiments were aimed to test the hypothesis that the advantage of cooler canopy can be realized more conspicuously in plants subjected to high temperature stress than those exposed to drought stress or well-watered plants.
2. Materials and Methods
2.1. Plant Material and Growth Conditions
A set of 15 diverse wheat genotypes were seeded at the Farm Science Center, Banasthali Vidyapith, Tonk, Rajasthan, India (26°24′ N, 75°47′ E), located in Agro-Ecological Sub Region S.No. 4.2 that includes India’s Northern Plain and Central Highlands [24]. These genotypes (Table 1) were released for cultivation either for irrigated and timely sown environments (HUW 234 and Raj 4037), restricted soil moisture environment (HD 2967, HD 2987, PBW 175, and PBW 396), or for delayed sowing (Halna, HD 2643, HPBW 01, MP 4010, Raj 3765, Raj 4079, Sunstar, and WH 730). Based on optimum weather conditions for wheat crop, timely sowing is between 15 November to 25 November in the north-western plain zones. In the present study, wheat genotypes were seeded on 24 November in 2017 and 2018 for non-stressed and drought treatments. For imposing plants to terminal high temperature stress, sowing was carried out on 15 December in both years. Early flowering genotypes were sown nine days later than late-flowering genotypes under the timely sown condition to synchronize the anthesis at the time of treatments. The experiment was laid out in a randomized complete block design (RCBD) with split plot arrangement. Each experimental genotype was seeded in triplicate on 2 m2 plot, each plot had 20 rows with row spacing of 10 cm, row length of 200 cm, and plant to plant distance of 2 cm. The seeding rate was 250 kg ha−1 for both years.
The pH, EC, and organic carbon of top 15 cm soil were 7.8, 0.76 sm−1, and 0.47%, respectively. The N, P, and K contents in the soil were 224.3, 33.06, and 362.88 kg ha−1, respectively. The micronutrients Fe, Mn, Cu, and Zn contents of soil were 4.03, 3.60, 1.31, and 2.31 ppm, respectively. Recommended quantity of urea (120 kg ha−1) and diammonium phosphate (60 kg ha−1) were applied. Urea was added in two equal splits at the sowing time and 40 days after sowing. Manual weeding was performed at 15 and 35 days after sowing to keep weeds below the economic threshold level.
The timely sown (non-stressed) and the late sown treatments had six irrigations provided through flooding. After the pre-seeding irrigation, the second and the third irrigations were provided 16 and 42 days after seeding, respectively, for all the three treatments. The timely sown (non-stressed) and late sown treatment had fourth, fifth, and sixth irrigations at 62, 96, and 123 days after seeding, respectively. In the terminal drought treatment, the stress was induced by withholding irrigation at booting stage under a temporary rainout shelter.
2.2. Environment Monitoring and Plant Measurements
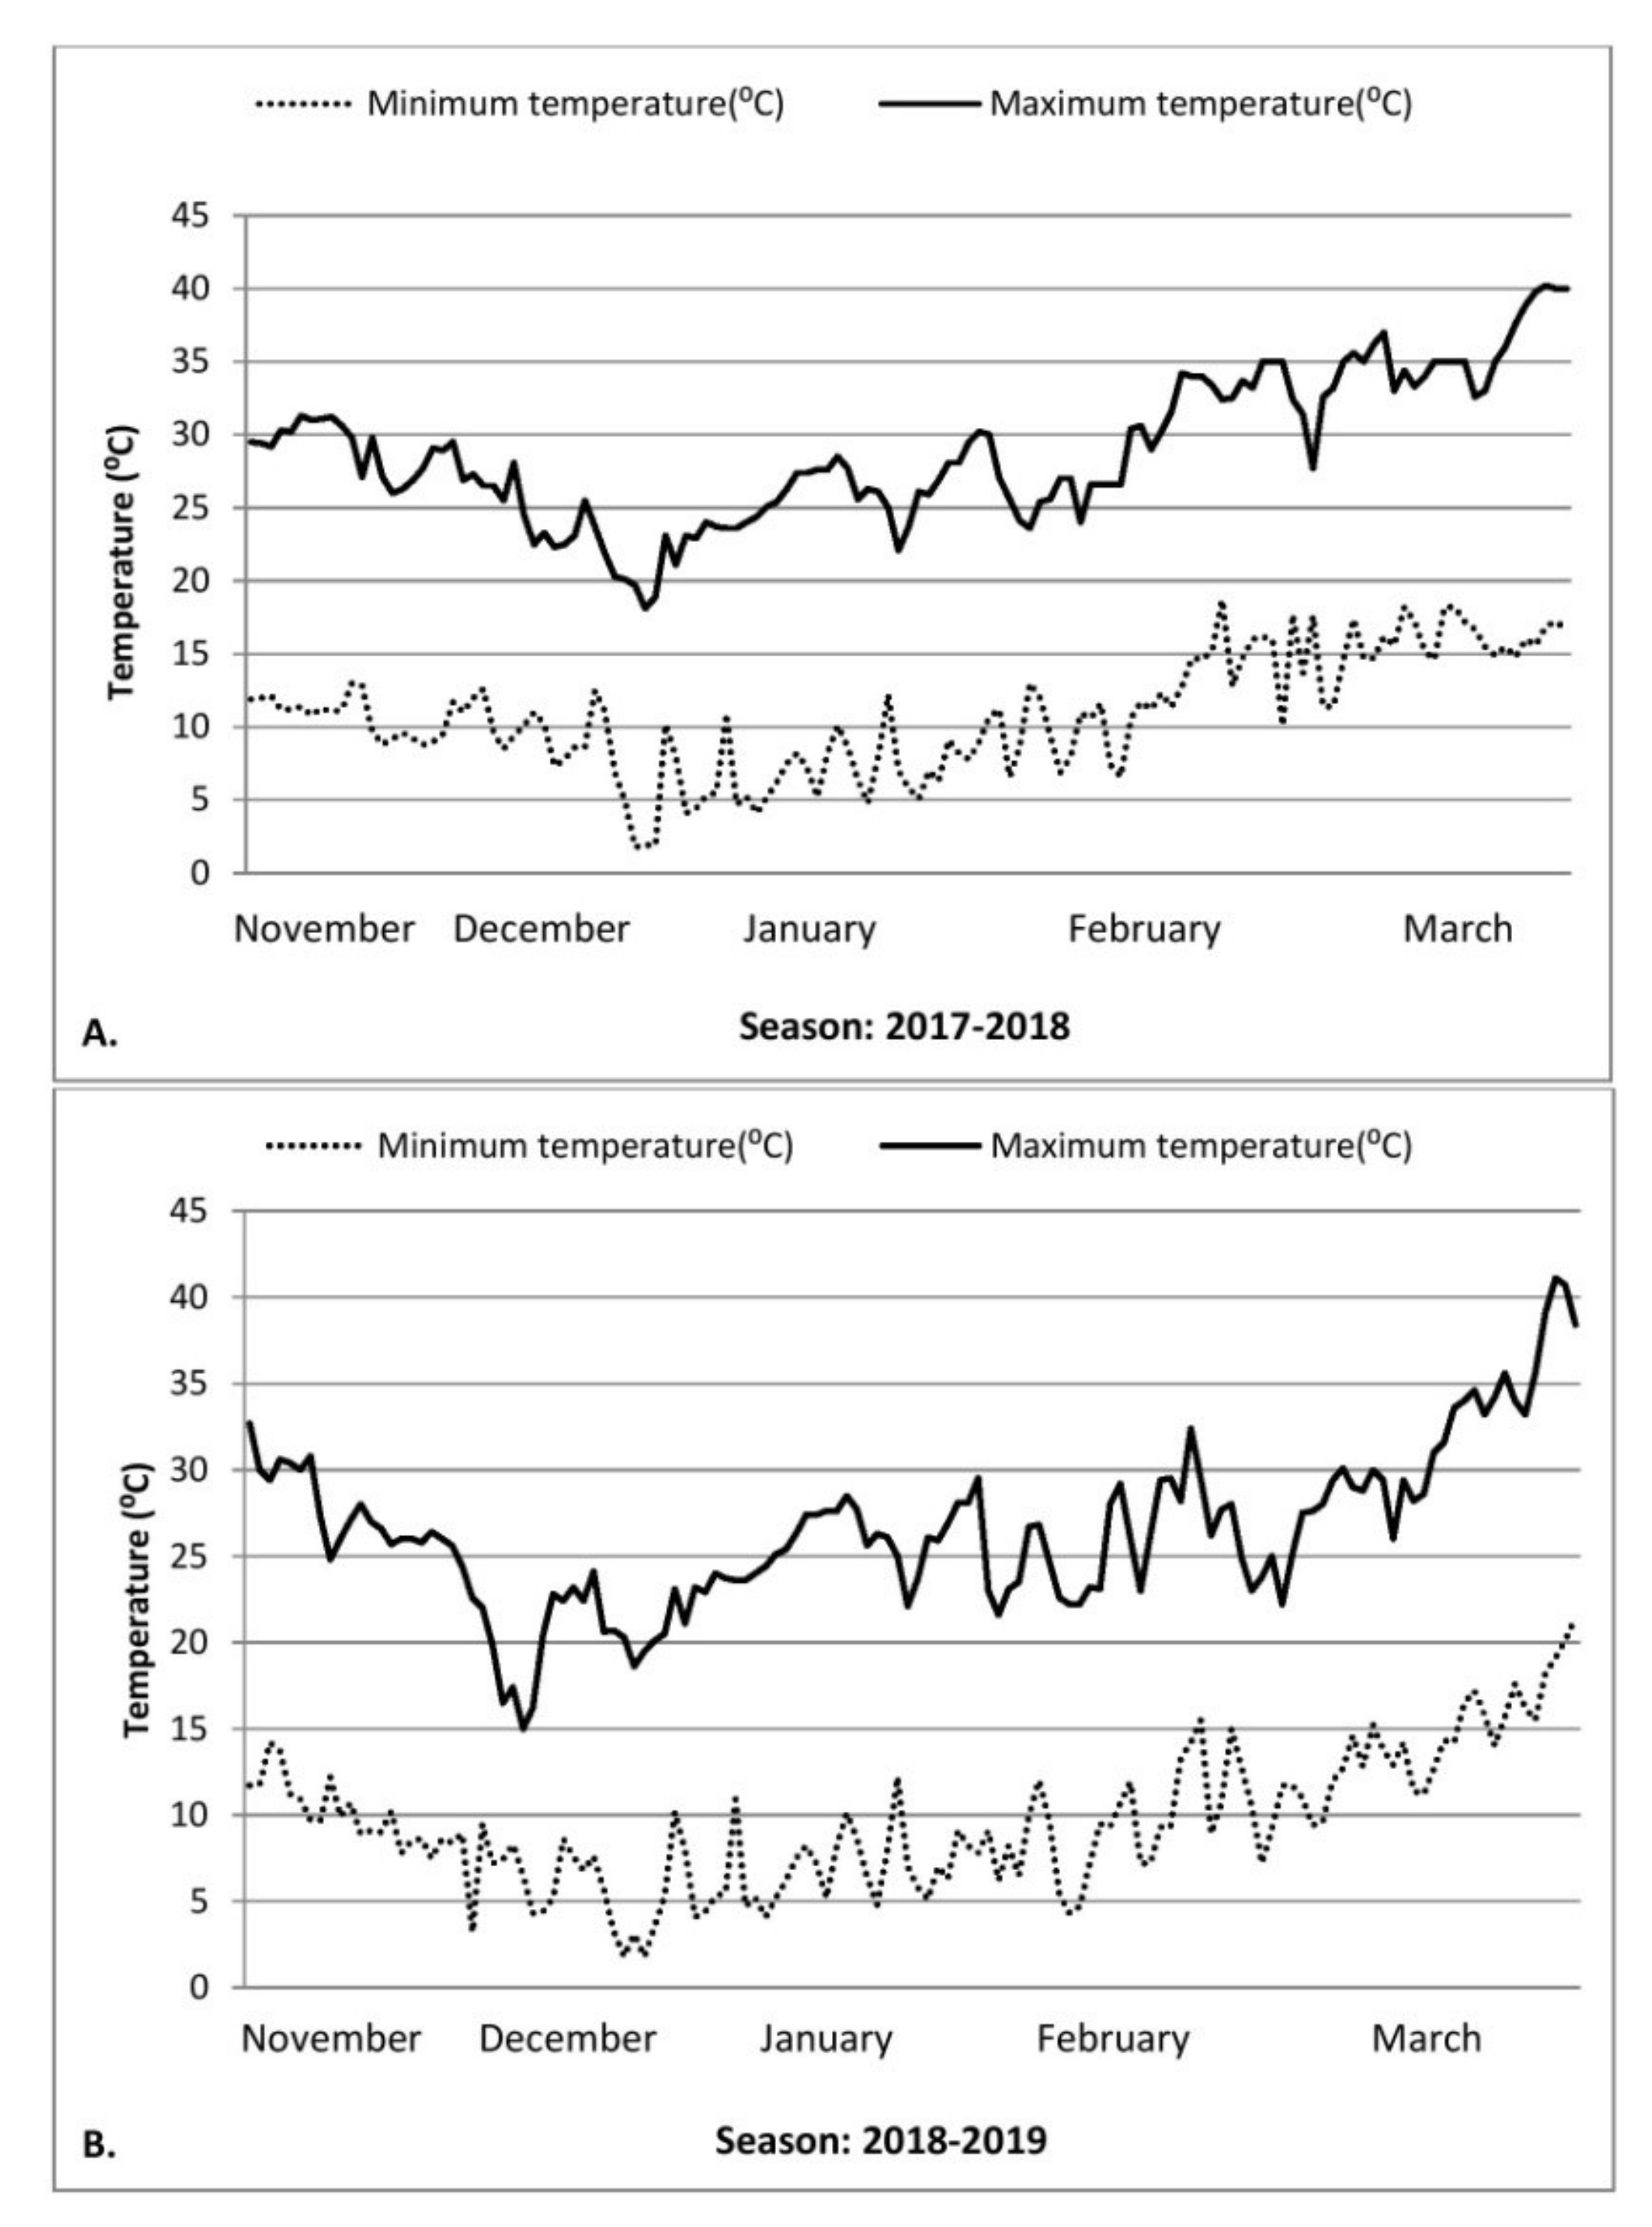
The daily temperature in the field was recorded at 8:30 a.m. and 5:30 p.m. The mean daily maximum temperature during grain development under timely sown condition was 32 °C and under late sown condition was 34 °C, averaged for two seasons (Figure 1).
At 50% heading, canopy temperature was remotely measured by a handheld infrared thermometer (model Infrared Thermometer MTX-1, HTC) between 11:00 a.m. to 1:00 p.m. when sky was clear [35]. The corresponding ambient temperatures were obtained from the weather measuring equipment (Davis Vantage PRO2) installed at adjacent field by the National Collateral Management Services Limited, Crop and Weather Intelligence Group. Canopy temperature depression for each genotype and treatment was calculated by subtracting the ambient temperature from canopy temperature (CTD = canopy temperature-ambient temperature). At heading stage, the soil moisture in timely sown (non-stressed) and late sown treatments was 35% and 39% (w/w), respectively. In contrast, the soil moisture level of drought treatment was 15% (w/w) as calculated by the gravimetric method.
Anthesis date for each genotype was recorded when 75% of the wheat spikes had visible anthers. Physiological maturity was recorded when 75% of the spikes in each plot lost the green color. At this stage, three main shoot spikes were sampled from each plot, and the number of spikelets spike−1, grains spike−1, and grain weight spike−1 were determined. Spikes were visually classified into average, spelt, and compact shapes [6]. Normal spike shape is square-headed and parallel-sided whereas compact spikes are short, thick, and club-shaped. Both normal and compact spikes have free-threshing grains and non-fragile rachis. Spelt spike is pyramidal with non-free-threshing grains and fragile rachis. Spike length of three spikes for each genotype and treatment were measured, and the spike was divided into three equal parts viz., apical, middle, and basal. Grain number and grain weight were measured for these three parts separately and the average grain weight of three parts was calculated. Further, to assess intra-spike variation in assimilating distribution, coefficient of variation (CV) was calculated for the average grain weight of apical, middle, and basal grains for each genotype across replications and treatments.
Drought susceptibility index (DSI) and heat sensitivity index (HSI) were calculated by the following formulae [36].
where Xd, Xh and Xn were average value of the parameters for the particular genotype under terminal drought stress, terminal high temperature stress, and non-stress conditions, respectively; MXd is mean value of the parameter for all the genotypes under terminal drought stress; MXh is mean value of the parameter for all the genotypes under terminal heat stress, and MXn is mean value of the parameter for all the genotypes under terminal heat stress.
2.3. Statistical Analysis
The statistical significance of the data werecalculated using R software, and “agricolae” package in R version 4.0.1 [37] was used for statistical analysis. The Duncan Multiple Range (DMRT) test was conducted at 5% probability and used as a post hoc test to separate the means where ANOVA indicated significant differences. Pearson correlations were used to determine the interrelationship between different parameters and CTD [37].
Structural equation modeling (SEM) analysis [38] was carried out with a whole set of data generated in the present experiment to assess the influence of different parameters on the grain yield performance of genotypes. Standardized values were used for the analysis with the initial assumption that yield spike−1 is a function of grains spike−1 and grain weight represented by weights of basal, middle, and apical grains. In addition, it is assumed that grains spike−1 is a function of spike length and spikelets spike−1 while spikelets spike−1 is the function of grain-filling duration and CTD.
3. Results
3.1. Effect of Drought and High Temperature
There were significant effects of treatment as well as genotype × treatment interaction on all the traits viz., grain weight spike−1, grain number spike−1, spikelets spike−1, grain-filling duration (GFD), and CTD (°C) (Table 2 and Table S1). There was no effect of year on the grain number spike−1, grain weight spike−1, and CTD. The beginning of ear emergence was 74 days, 70 days, and 73 days after seeding under non-stressed, drought, and late sown (high temperature stress) condition, respectively averaged for both years. Further, genetic variation in CTD was more conspicuous under drought and high temperature stress as compared to non-stressed conditions (Table S1).
3.2. The Influence of CTD on Grain Yield and Yield Components
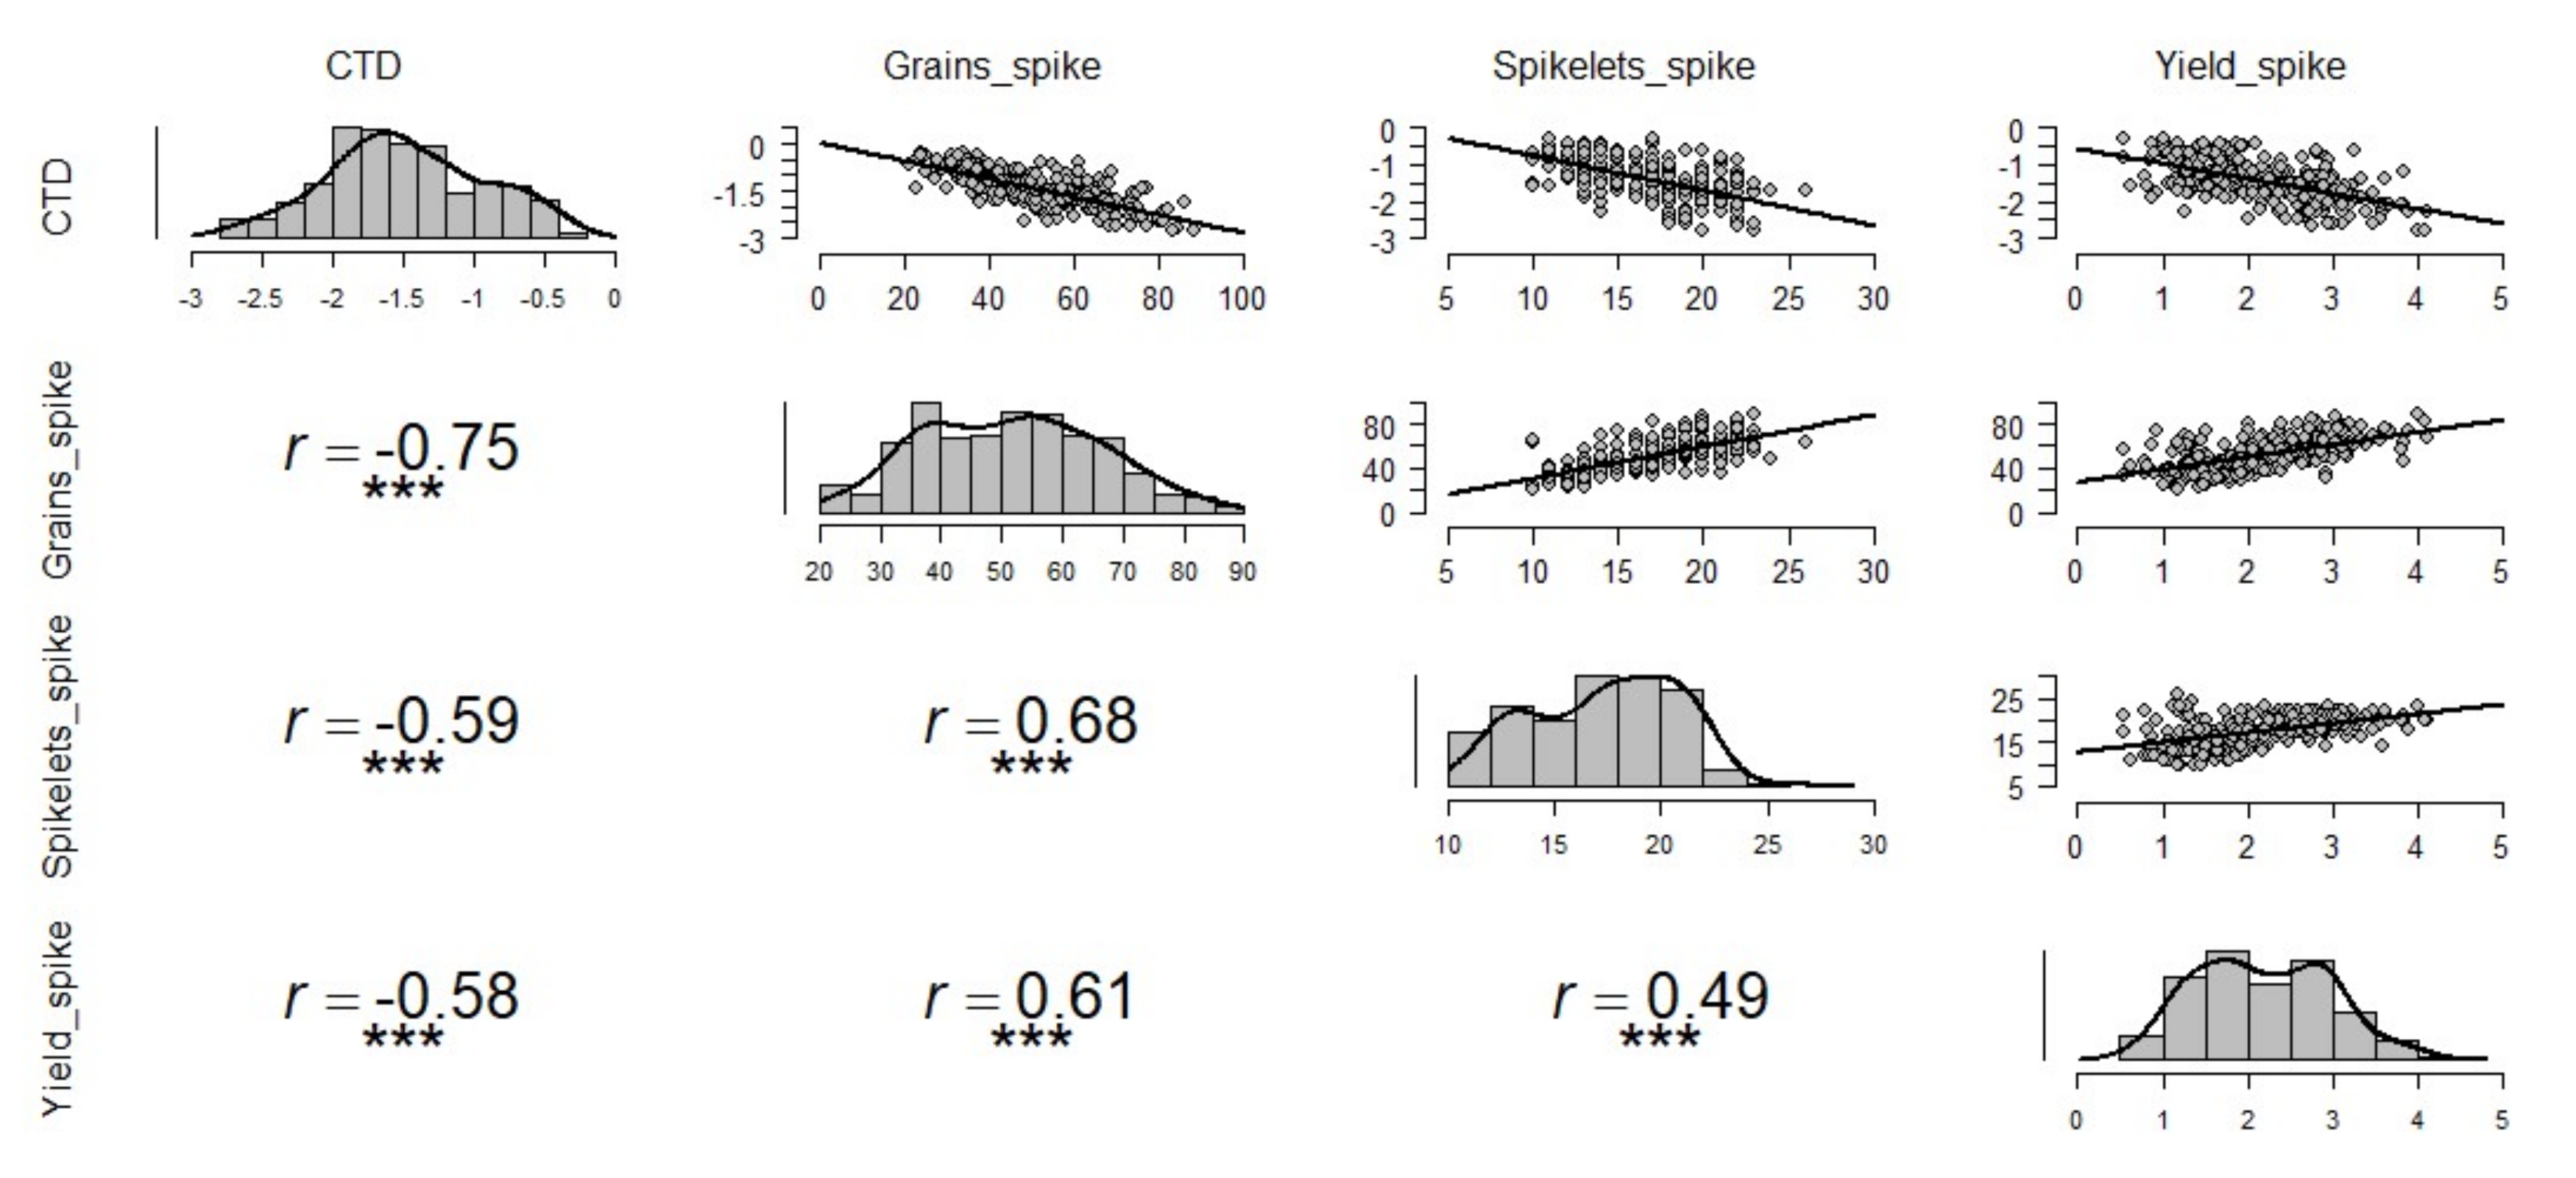
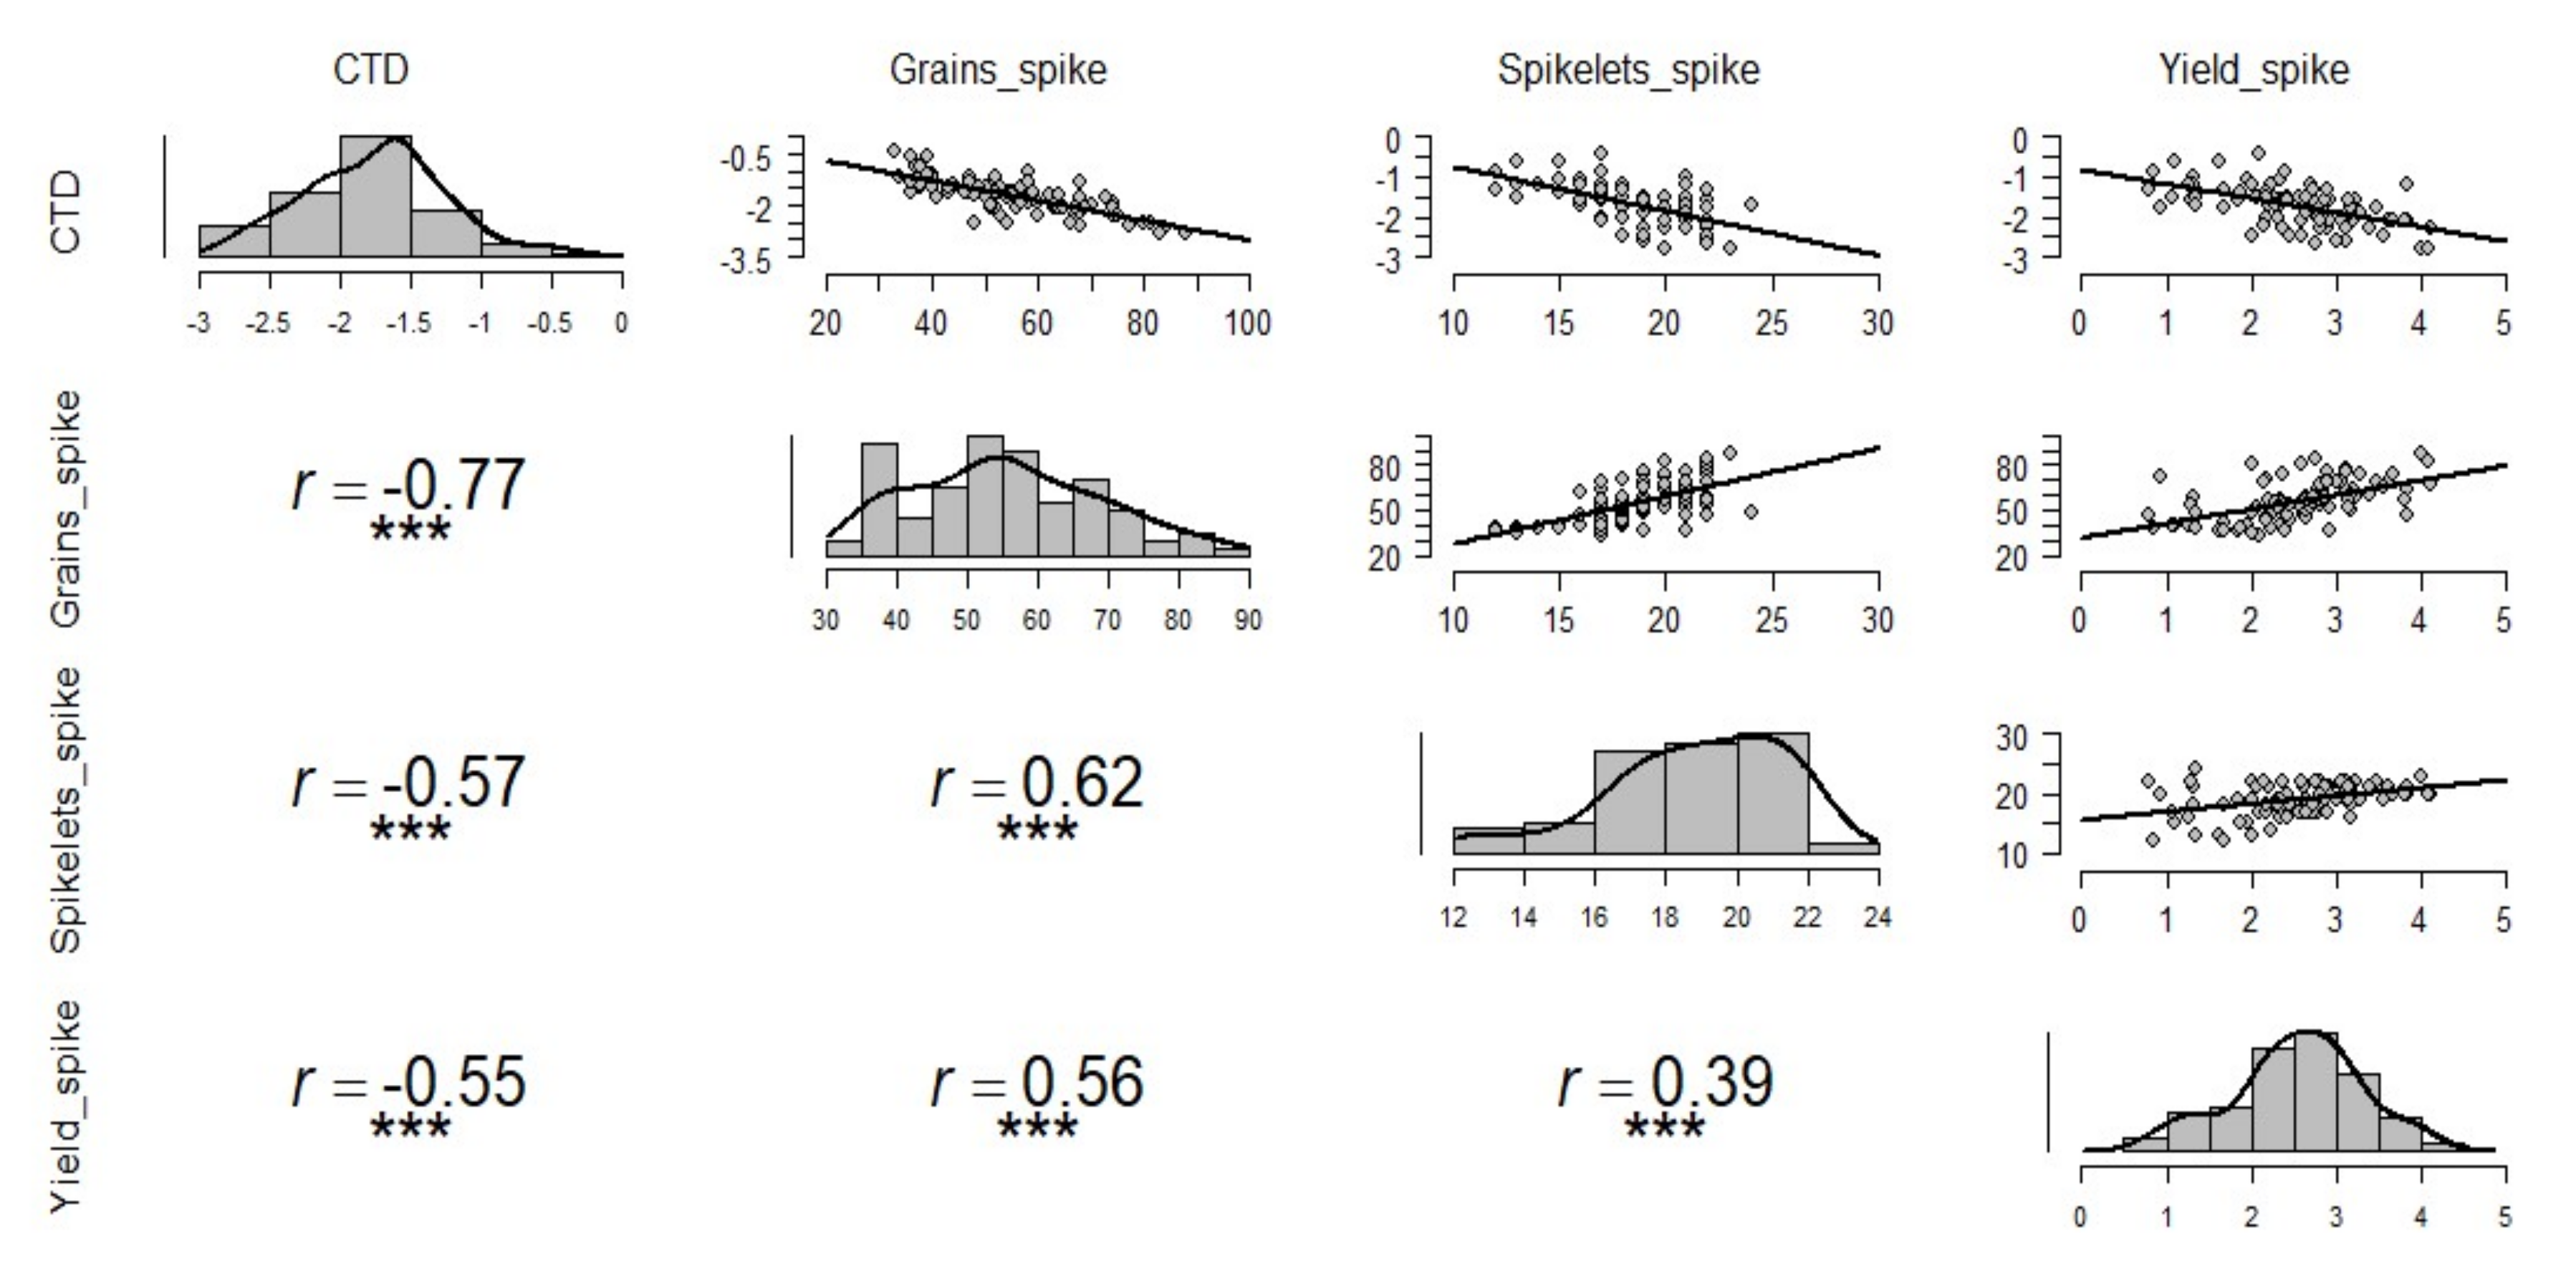
The CTD had a significantly high and negative correlation with all the spike traits indicating that cooler canopy is related to better yield. The number of spikelets, the number of grains, and grain yield per spike were highly correlated under all treatments (Figure 2). The number of grains spike−1 showed a strong correlation with CTD (r = 0.75) whereas spikelets spike−1 and yield spike−1 showed moderate correlations of r = 0.59 and r = 0.58, respectively. Besides observed correlations across all treatments, we also examined the correlations between yield components and CTD for each treatment separately. Under non-stressed condition, a similar relationship was observed among different yield components and CTD (Figure 3); under drought conditions, correlations between yield components and CTD were lower (Figure S1) than those evaluated across treatments (Figure 2), non-stressed (Figure 3), and late sown (Figure S2). Interestingly, the correlations between yield components and CTD in late sown treatment (Figure S2) were higher than those recorded in all other treatments except for the correlation between CTD and number of grains per spike in combined treatments (Figure 2), and under non-stress condition (Figure 3).
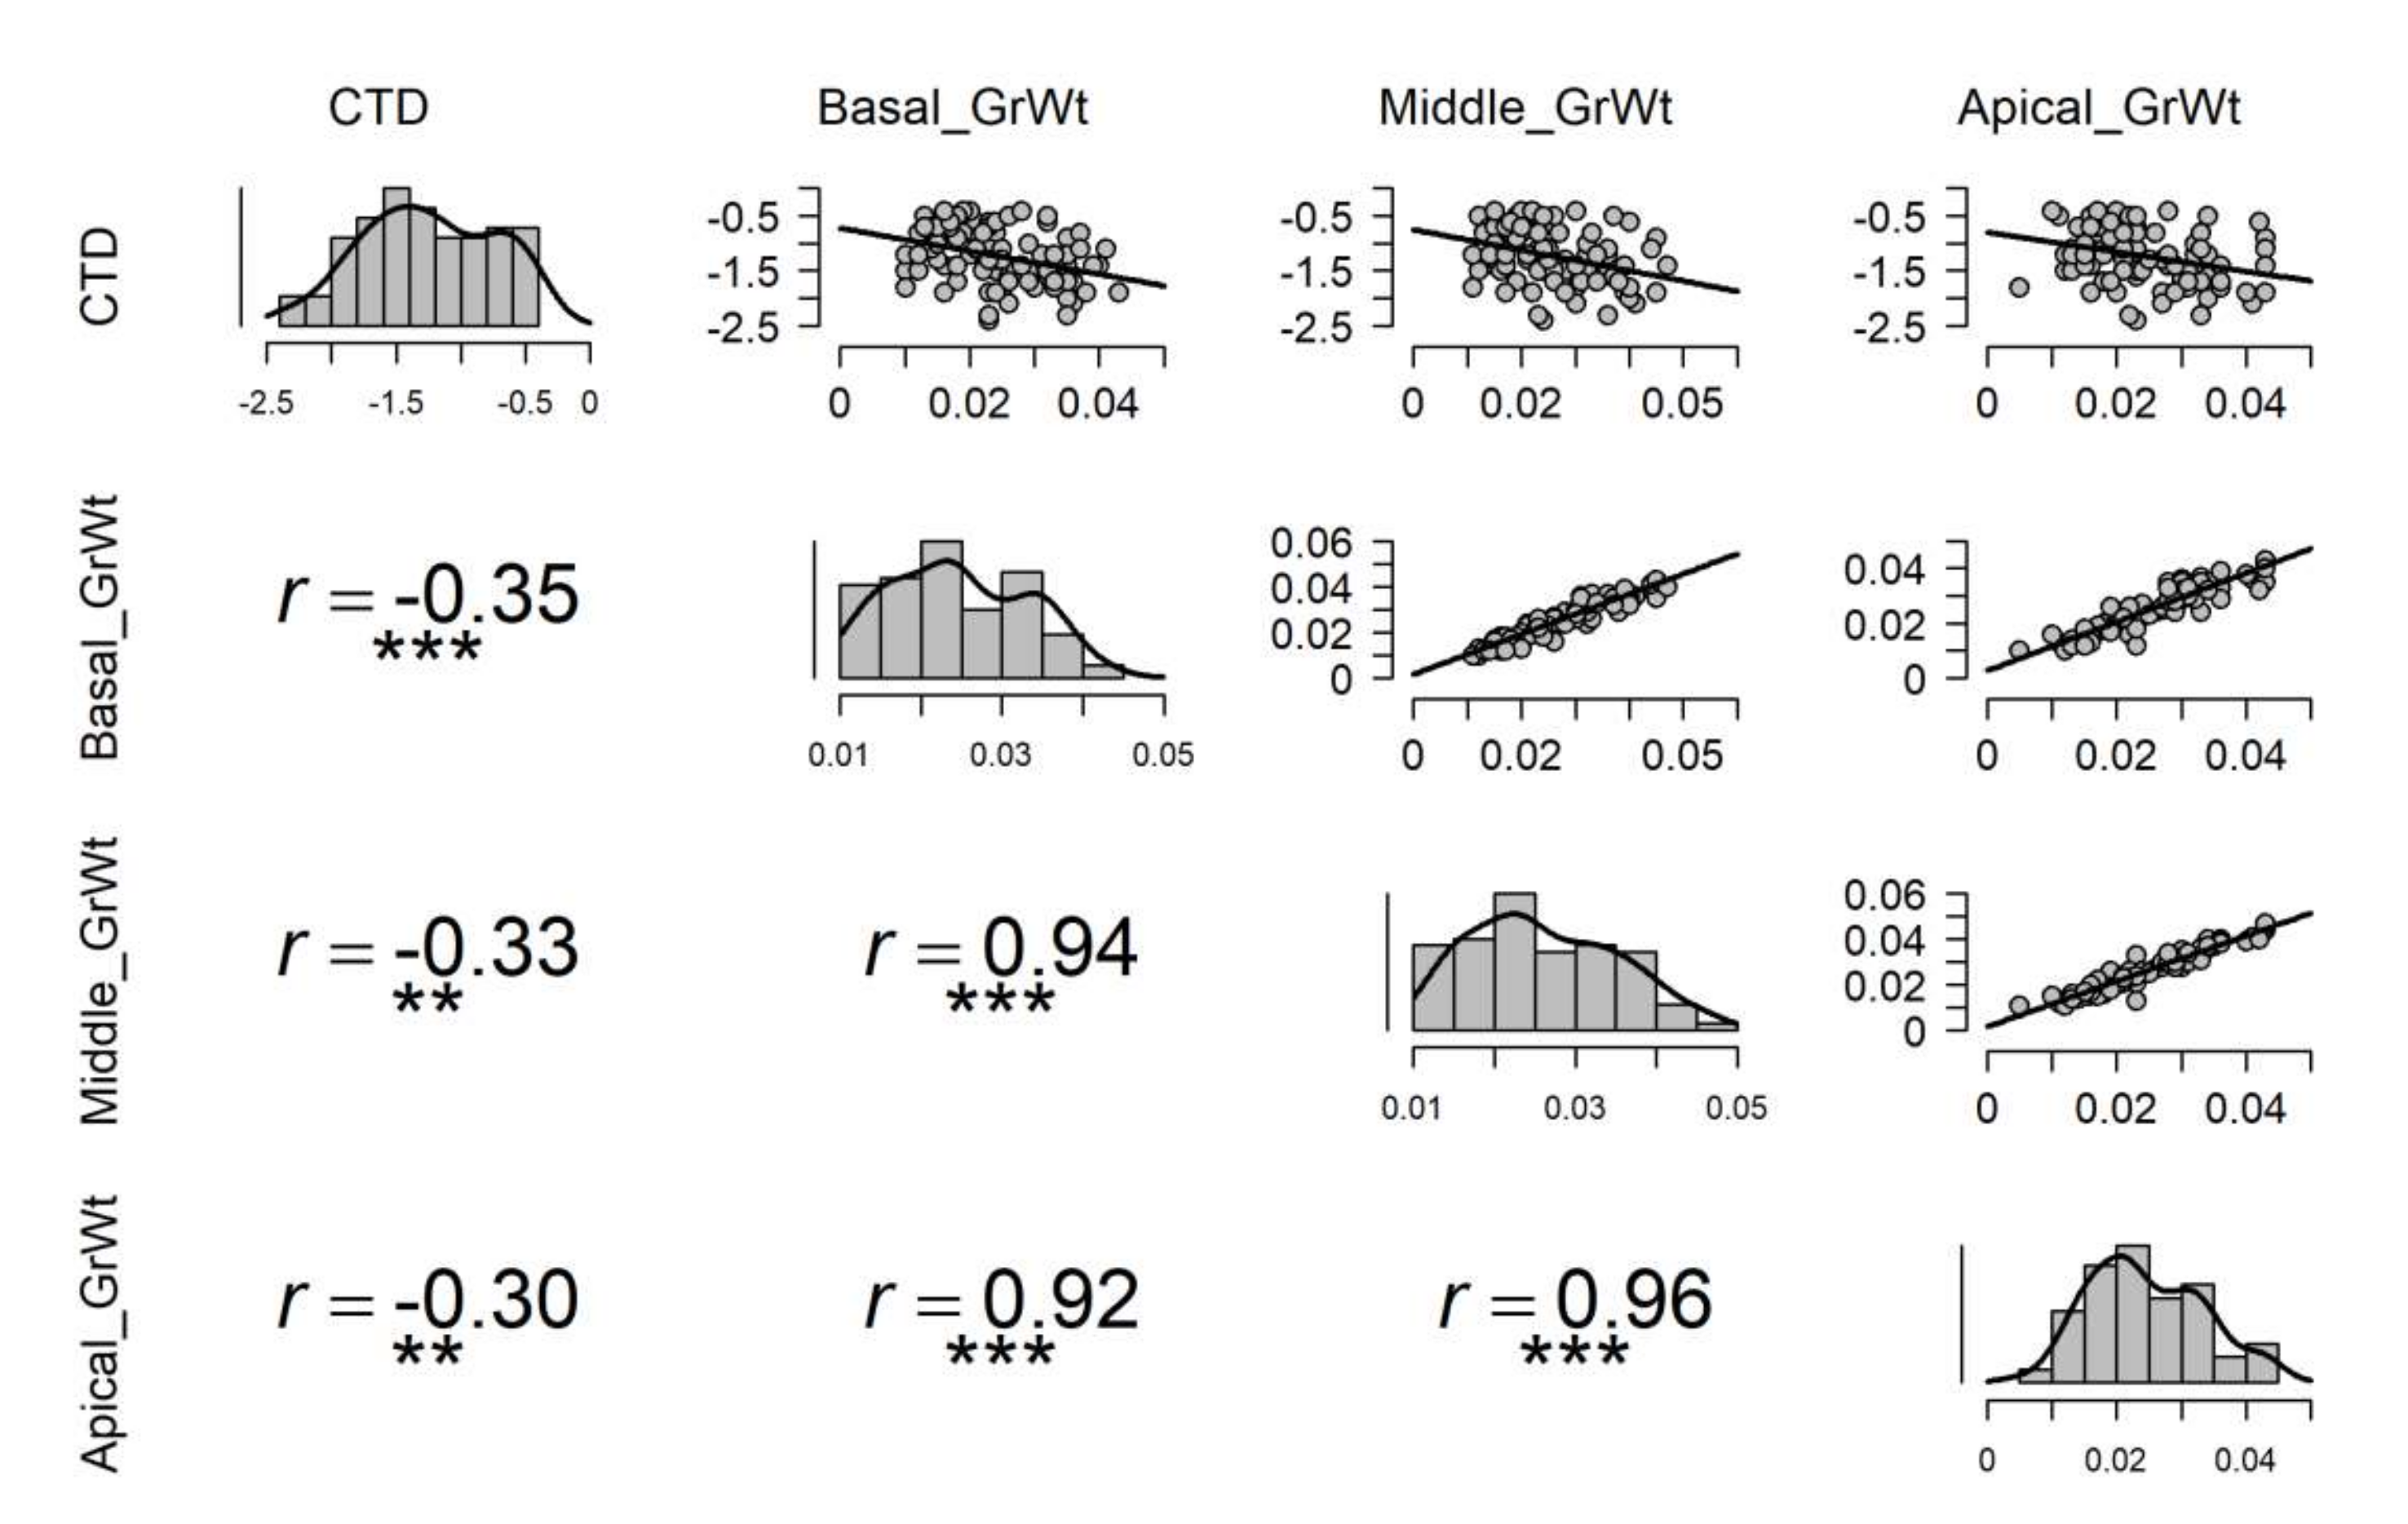
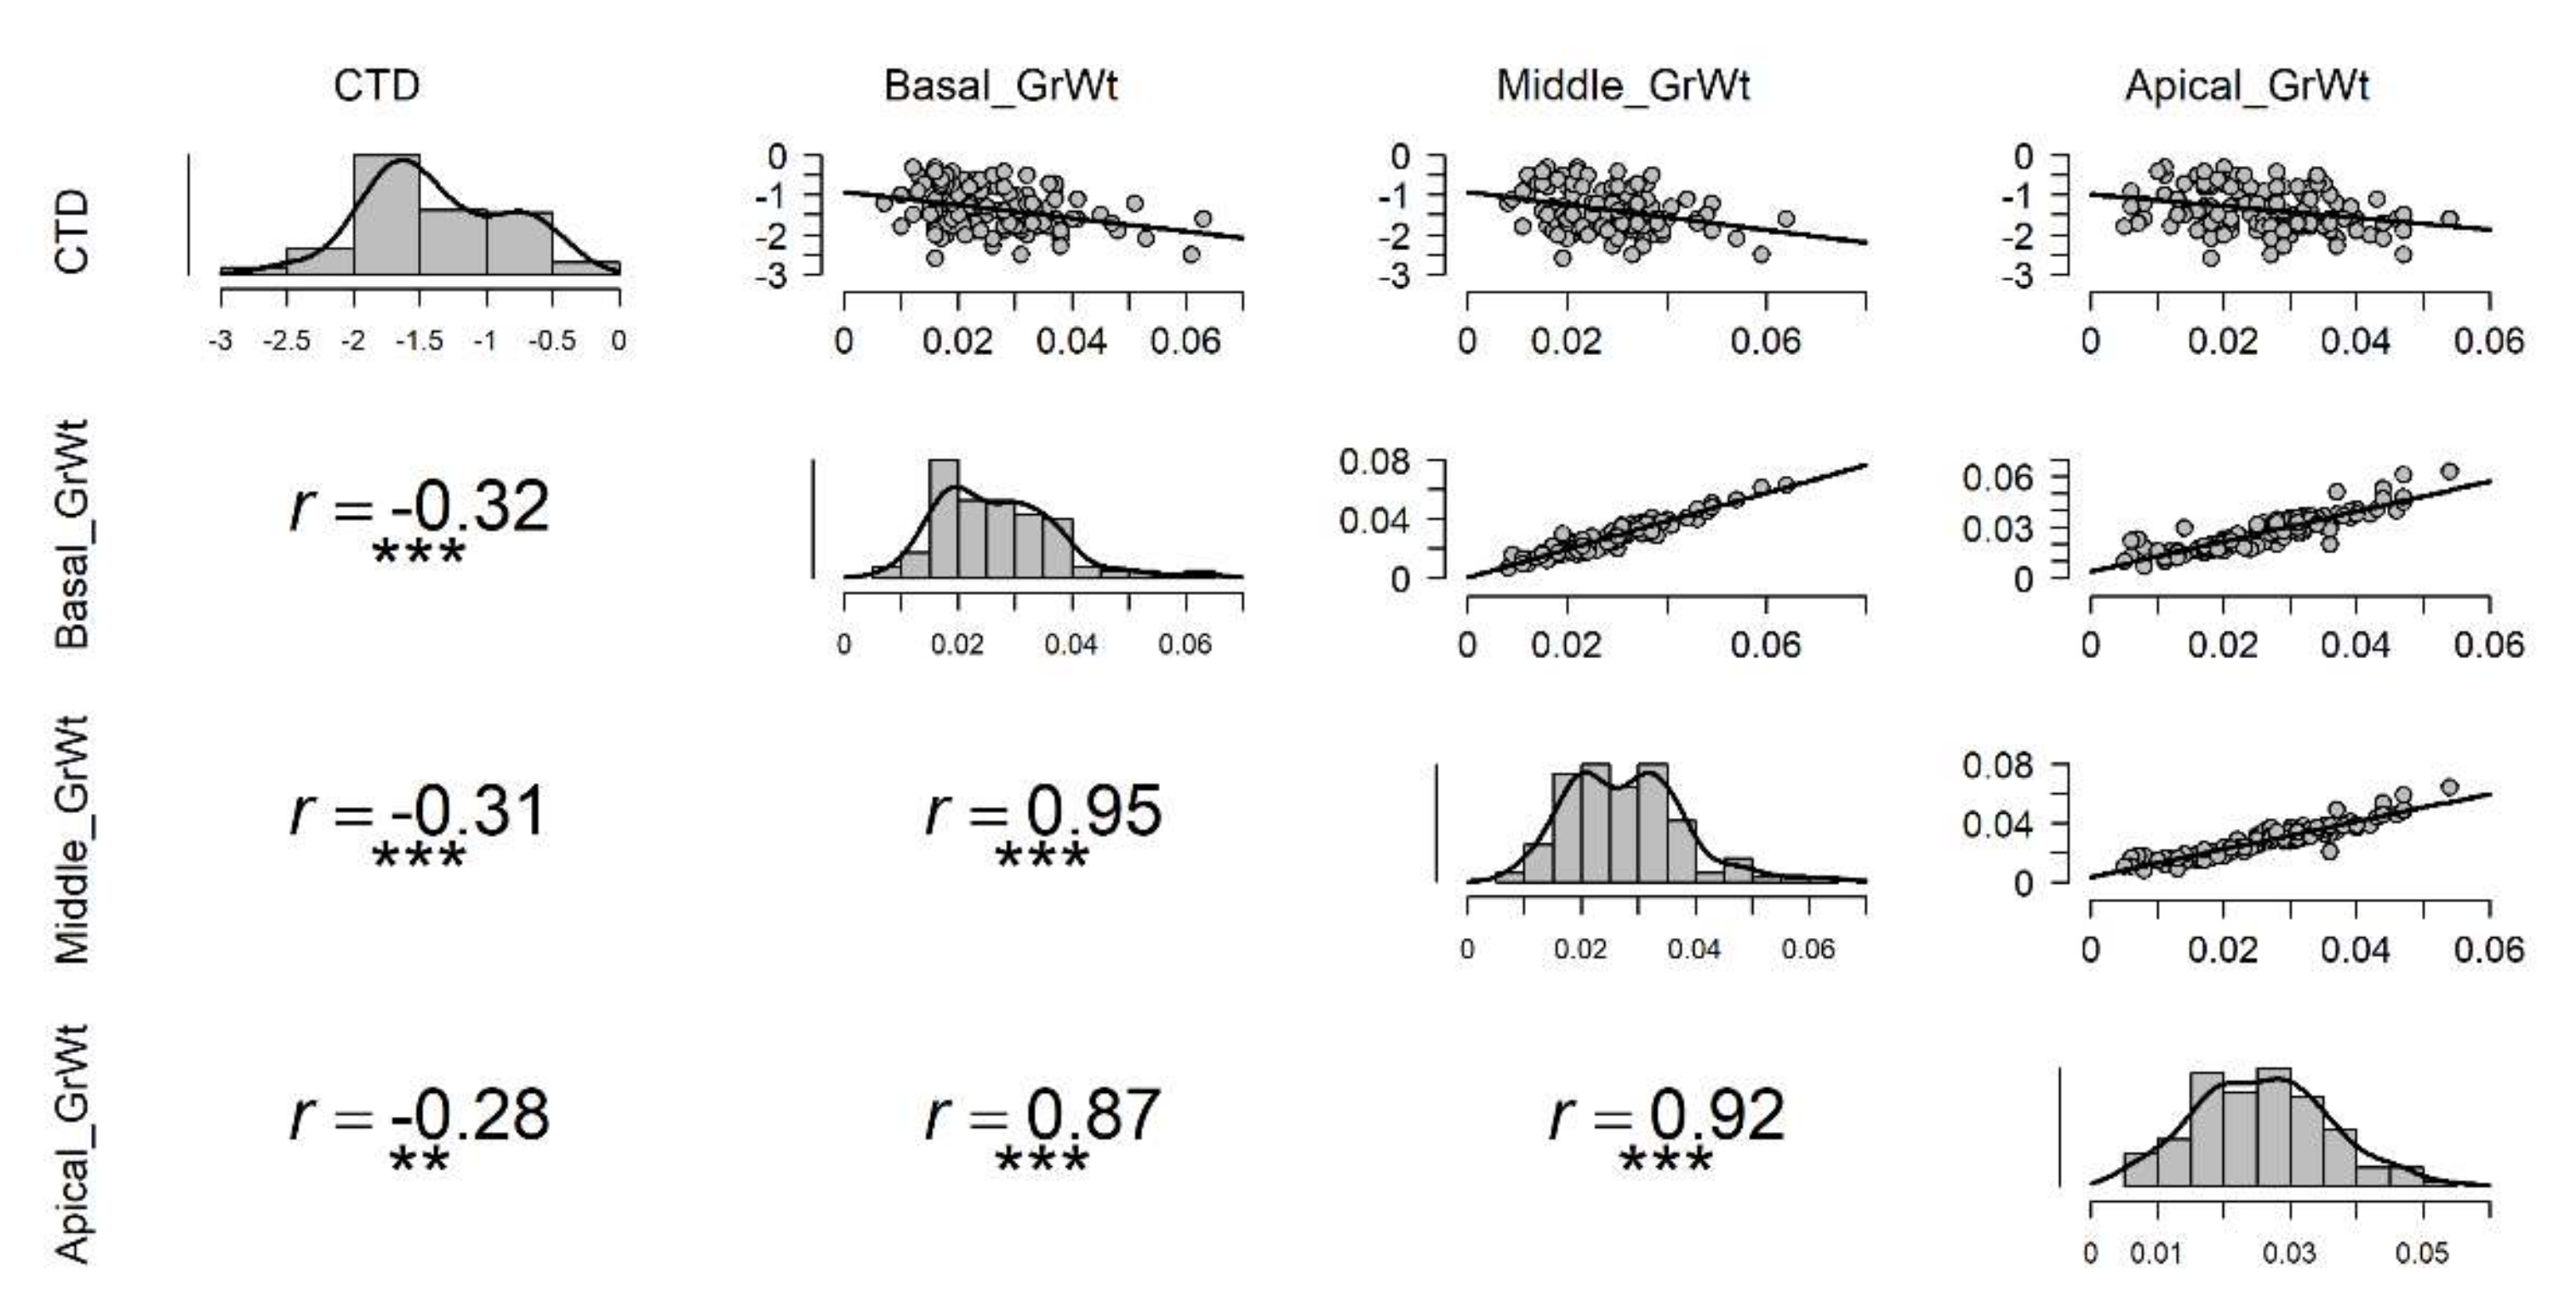
Under high temperature stress, cooler canopies were significantly correlated to the overall average grain weight of spike, and the highest correlation was with basal part average grain weight (r = −0.35), followed by middle (r = −0.33), and apical (r = −0.30) grain weight in a spike (Figure 4). Under the non-stressed condition, only the basal grain weight was significantly correlated with CTD (r = −0.18) (Figure S4). Under control or non-stressed condition, highly significant correlations were observed between the basal part of the spike with the middle and apical part atr = 0.95 and r = 0.87, respectively (Figure S4). A similar relationship was also observed between the apical and middle parts of the spike with r = 0.93 (Figure S4). Under drought conditions, no significant correlation was observed between CTD and grain weight of any part of the spike (Figure S3); however, highly significant correlations were seen among grain weights at different parts of the spike as seen in non-stressed (Figure S4) and late sown treatments (Figure 4). In late sown treatment, correlations between CTD and basal, middle, and apical part of the spike were significant with r = −0.35, r = −0.33, and r = −0.30, respectively (Figure 4).
In the normal spike shape, the association between the average grain weight of the whole spike and the canopy temperature was significant (Figure 5). Besides correlations between CTD and average grain weight, correlations among different spike parts were highly significant (Figure 5). In compact-shaped spikes, the average grain weight of the basal region of spike only was influenced by CTD (r = −0.26 at p < 0.1) while no effect of CTD was seen on the middle and apical part of the spike (Figure S5). In speltoid-shaped spikes, there was no correlation seen between average grain weights of any spike region with the canopy coolness (Figure S6). However, grain weights at different spike parts had significant correlations among them in normal, compact-, and speltoid-shaped spikes as shown in Figure 5, Figures S5 and S6, respectively.
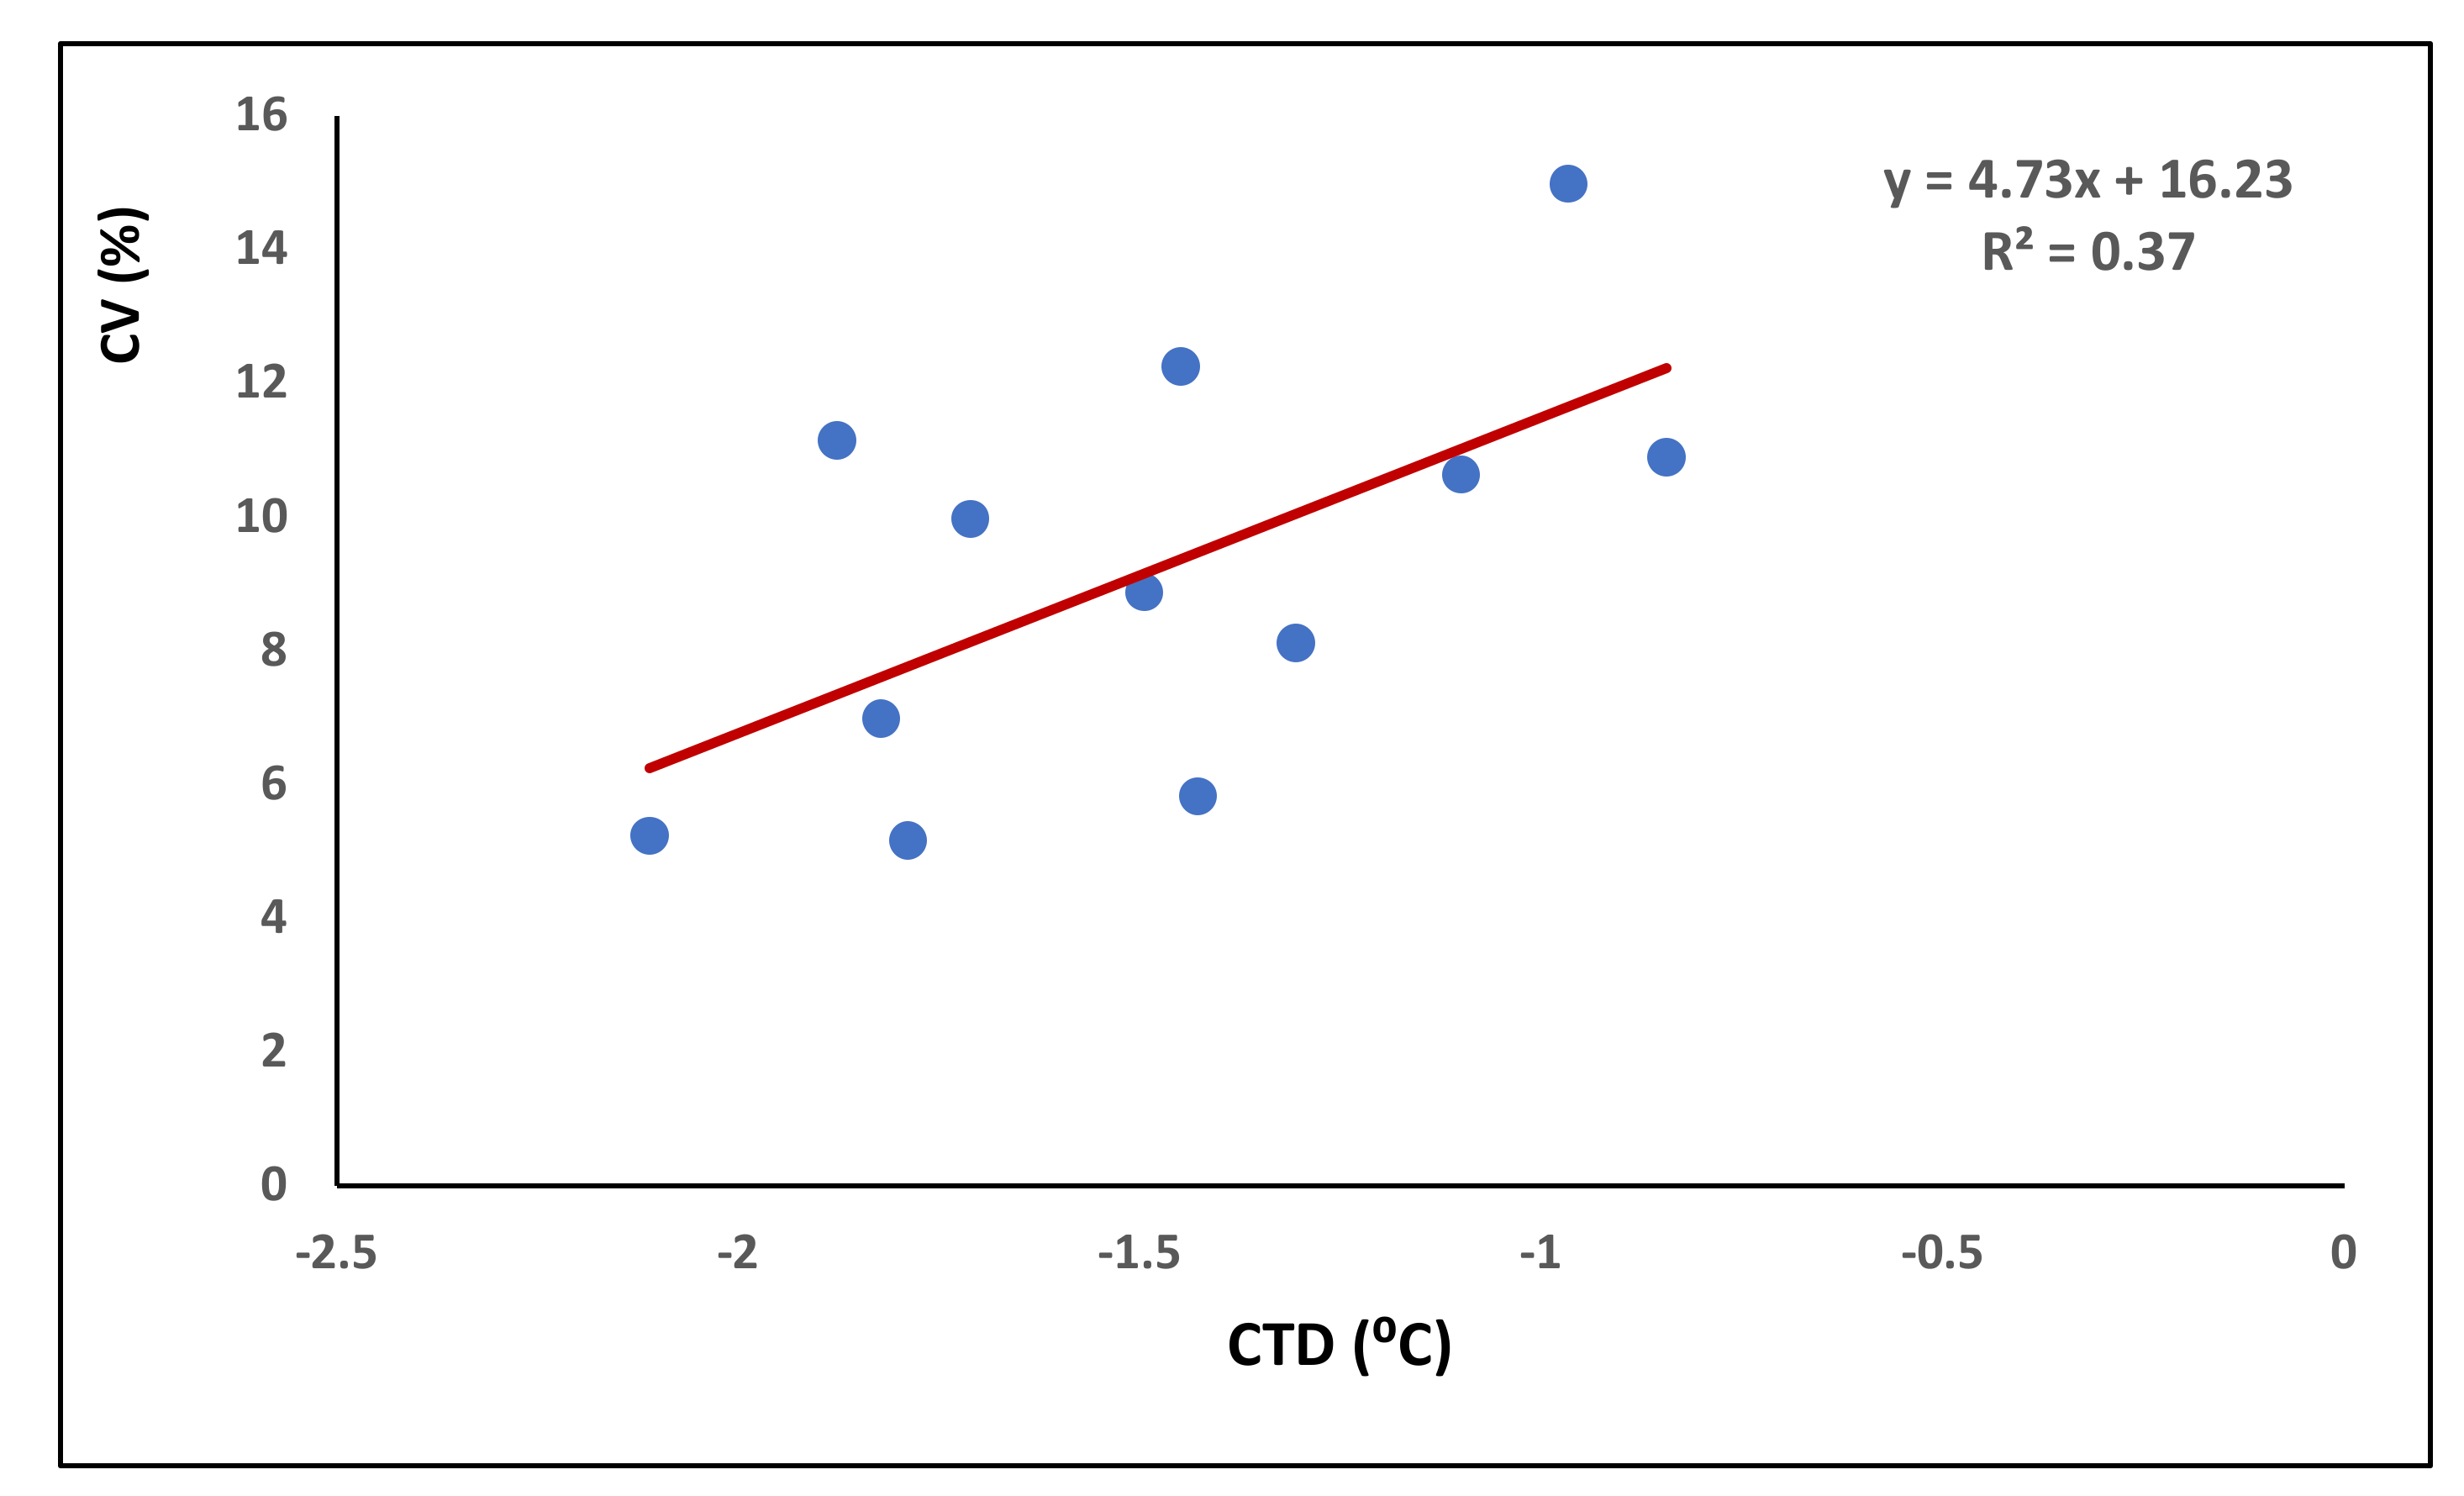
The average coefficient of variation (CV) of grain weight across the spike length calculated for each genotype across treatments and environment ranged from 5.17 to 14.99%. It was found to be associated with canopy temperature as those genotypes, which could keep their canopy cooler relative to others, and had less variation in grain weight within the spike (Figure 6). The data indicated that each degree of canopy warming could cause approximately 5% increase in variation in grain weight within the spike.
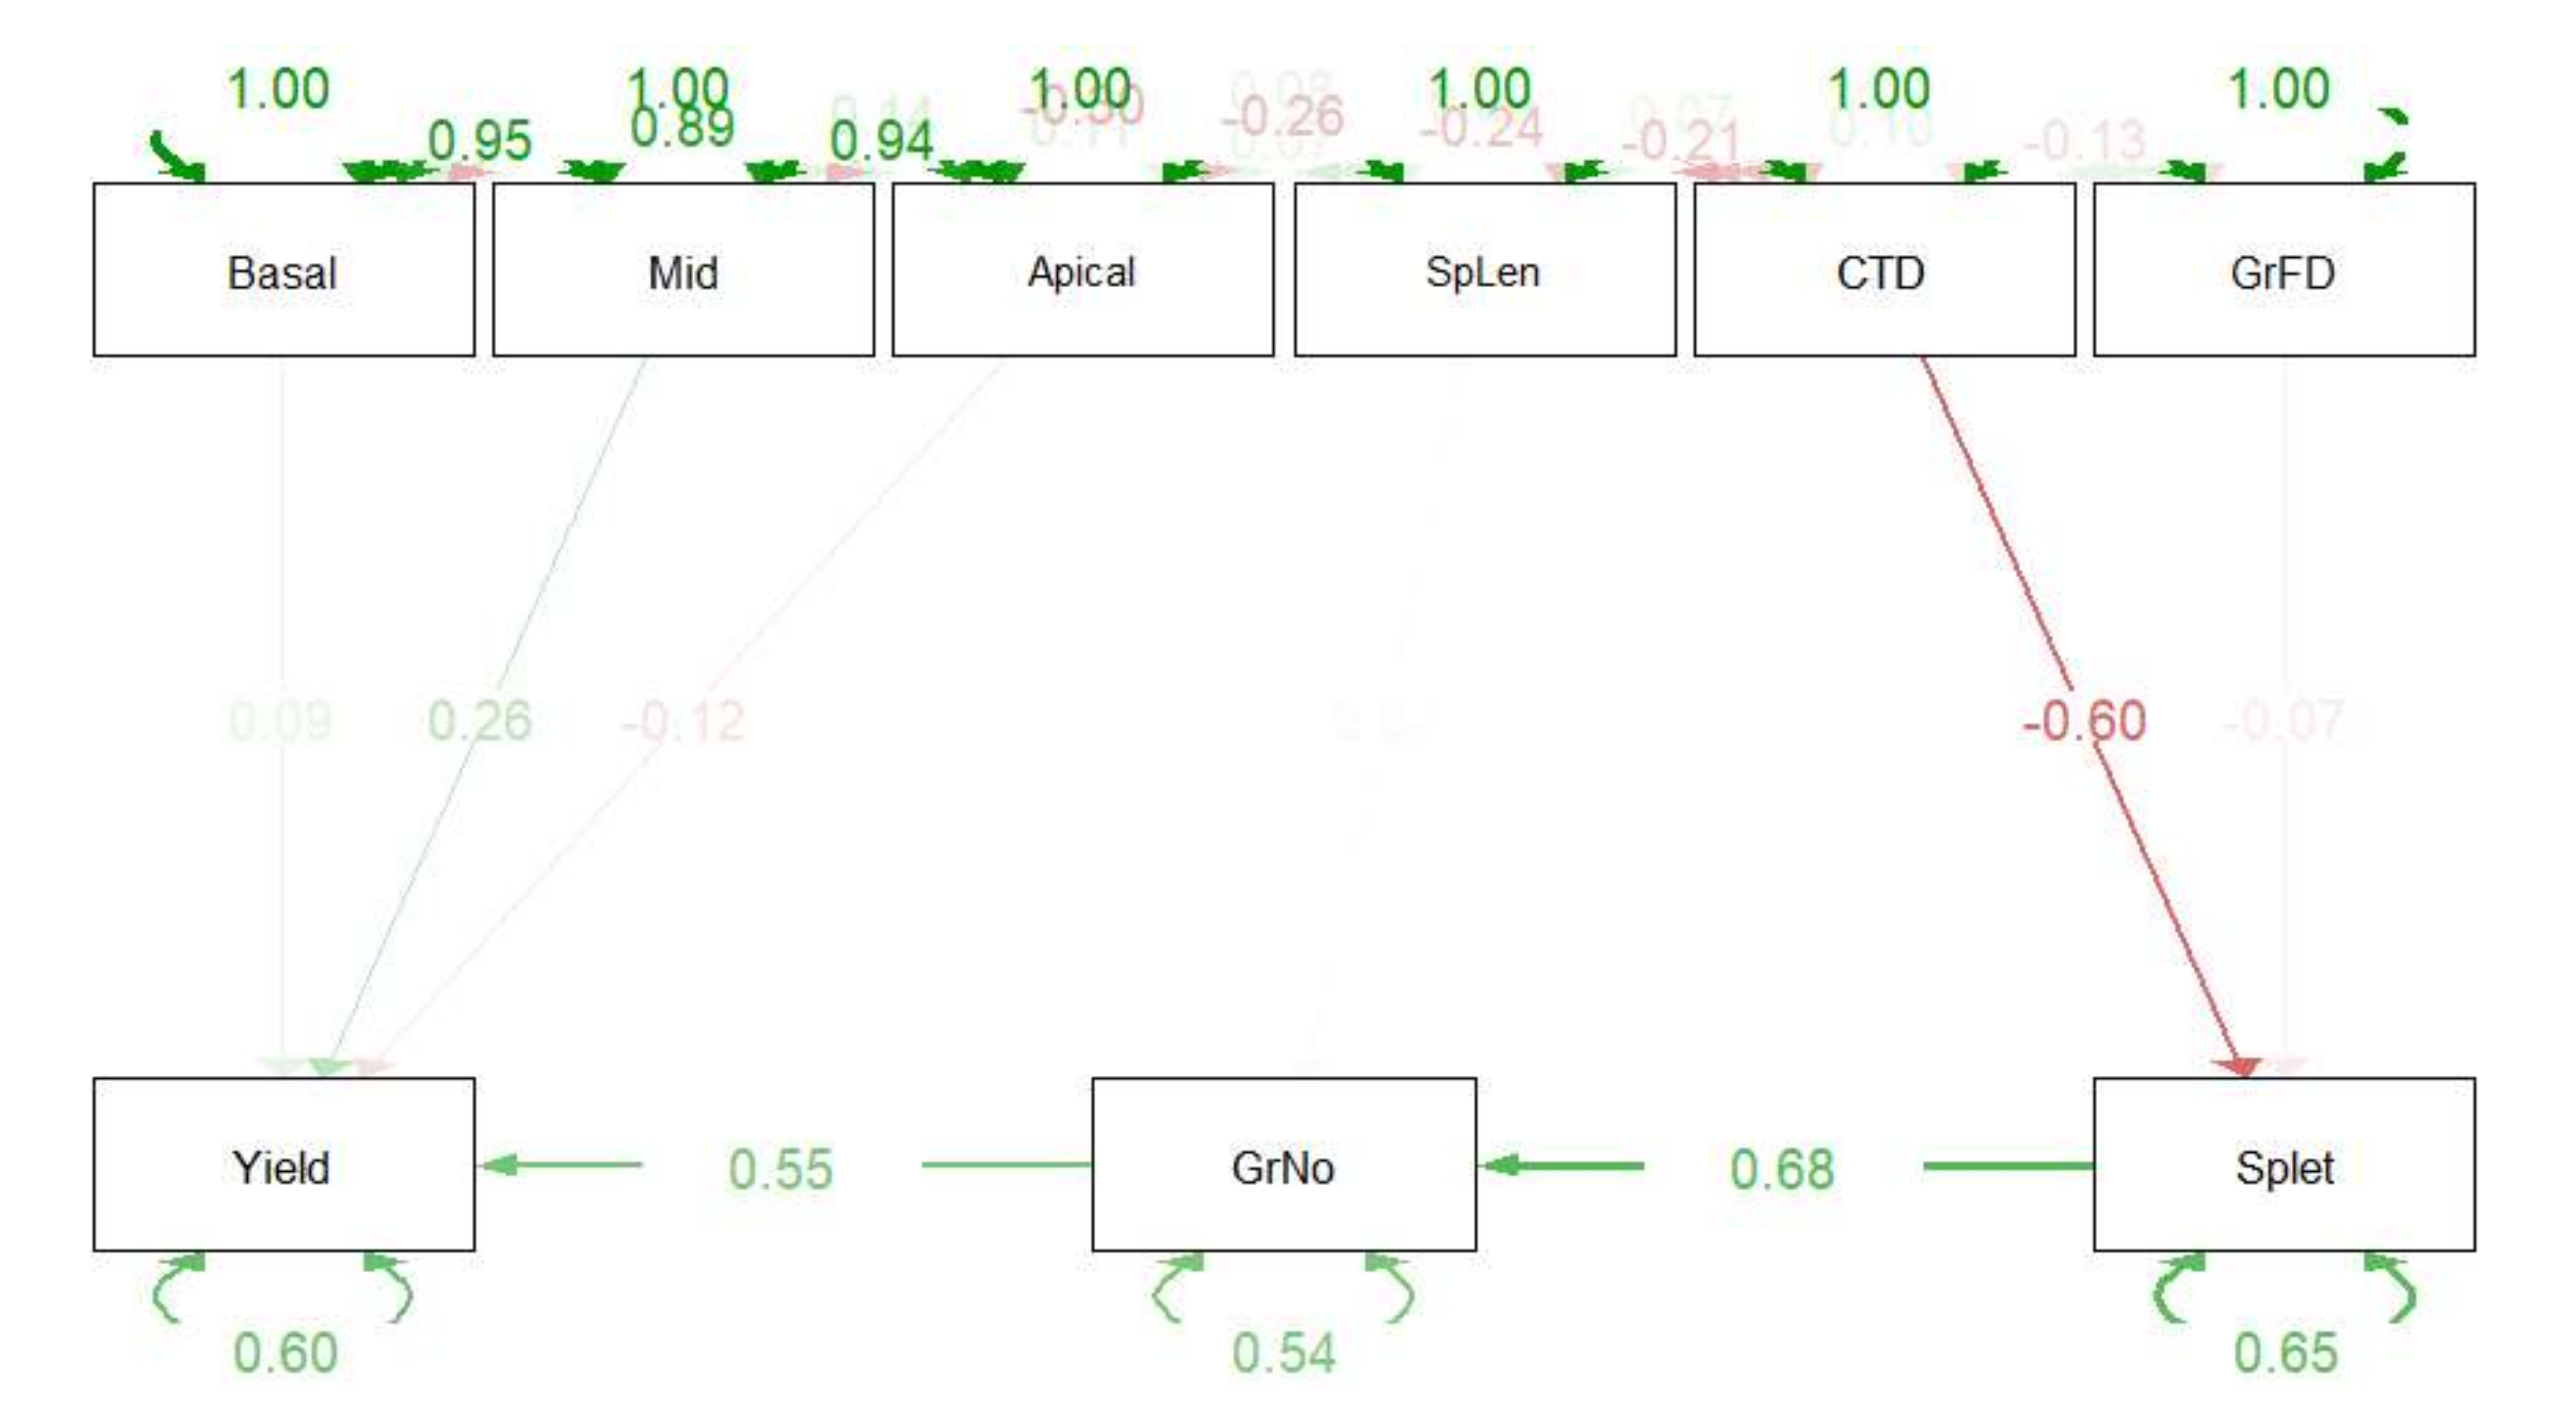
To test the hypothesis that spike length must have influenced the intra-spike distribution that was assessed, based on the equal partitioning of the apical, middle, and basal grains across the spike, we analyzed the data with a structural equation model (Figure 7). This model assumes that yield spike−1 is a function of grains spike−1, and grain weight is represented by weights of basal, middle, and apical grains. In addition, it was assumed that grains spike−1 is a function of spike length and spikelets spike−1, while spikelets per spike−1 is the function of grain-fill duration and CTD. The result clearly revealed that the role of spike length on the parameters that we studied was negligible, while CTD influenced the grain yield per spike through its influence over spikelets per spike and grain number per spike.
4. Discussion
Several studies have reported genetic differences in grain yield-related parameters in wheat [39,40,41]. Genetic and environmental effect on physiology and spike development determines the intra-spike grain weight variation. There is evidence for spikelet-to-spikelet competition for assimilates within a spike leading to the unbalanced distribution of grains per spikelet along with the spike [42,43]. Canopy temperature has been proposed as a potential selection criterion for breeding programs as it showed significant negative correlations with grain weight per spike, grain number per spike, and thousand-grain weight of wheat under terminal heat stress conditions in the field [44].
In the current study, the CTD had a high negative correlation with the number of grains and grain weight per spike under terminal drought and heat stress, which is in agreement with earlier studies [45,46,47]. A uniform intra-spike grain-filling is desirable for achieving a higher wheat yield and quality. Smaller grains are easily lost during the cleaning done by winnowing prior to milling which significantly reduces the grain yield [48,49]. The nutritional quality of grains also decreases from basal to distal spikelets [9]. The uneven intra-spike assimilate distribution within spikes of wheat is evident from reports that the lower half of the spike has approximately 44% of the total number of spikelets, which accounts for 64% of yield per spike [50]. Decreased assimilate availability by less illumination reduced average grain weight in upper half of spikelets only, whereas high temperature decreased the grain size of the whole spike [3]. An increase in assimilate availability around anthesis was able to improve the distal grain weight [12]. Transport of assimilates to grains could be the limiting factor for reaching maximum grain weight within spikes and/or spikelets [51,52]. Wardlaw [53] observed that the assimilate loading from leaves was maximum at 20–30 °C; however, there was an abrupt decline above 30 °C. Thus the effect of high temperature on biomass partitioning in wheat was indirectly related to the abnormal behavior of source and sink along with the reduced photosynthesis rate. In the present study, the coefficient of variation in grain weight across spike for each genotype averaged over all the treatments reveals that warmer canopy exhibit more tendencies towards the unequal distribution of assimilates across spikes relative to the cooler canopy. Further, the correlation of grain weight with CTD was higher at the basal and middle portion of the spike as compared to the apical region in the normal spike shape irrespective of stress. However, under high temperature stress in late sown conditions, the basal region had a comparatively higher correlation with CTD. An earlier study reported that different positions in the spike and spikelets have distinct responses to post-anthesis occurrence of high temperature in terms of grain parameters [54].
Our study indicated that such responses could be partially (R2 = 0.37) attributed to the capacity of wheat plants to keep their canopy cool. It is possible that the plant process associated with assimilate distribution is facilitated by cooler temperatures. This clearly reveals that CTD influences grain weight across the spike and that the advantage of the cooler canopy is more conspicuous under high temperature stress with optimal soil moisture relative to either well-watered or drought-stressed plants. Nonetheless, assimilate partition within the spike is determined by assimilate supply, which itself is governed by competition among the different parts of plants and also of spike [55]. Further, we also observed that the shape of the spike can also influence the advantage of the cooler canopy on the intra-spike distribution of assimilates with normal spike outperforming speltoid and compact spikes. All these factors must have contributed to variation in intra-spike assimilate distribution among the genotypes. It is speculated that any genetic variability associated with intra-spike partitioning of assimilates could represent an intriguing source of tolerance to extreme climatic events whose occurrence is likely to increase in the foreseeable future. Drought and heat-tolerant genotypes have been reported to have cooler canopies [56,57] which are in agreement with our results, such as HUW 234 with lower canopy temperature which has a drought susceptibility index of 0.14 and heat susceptibility index of 0.39 for grain yield spike−1 (Tables S2 and S3).
Based on observations and structural equation model, it is suggested that CTD influences the spikelets spike−1 which in turn determines grain number spike−1 and hence, the grain weight spike−1 with some influence of the distribution of assimilates across the spike length as indicated by apical, middle, and basal grain weight. The model clearly reveals that there was no influence of spike length on any of the parameters studied in this investigation (Figure 7). A previous study had also found that cooler canopy during anthesis was significantly associated with higher spikelets spike−1 and higher grain number spike−1 under rain-fed conditions [58]. The number of spikelets spike−1 has been positively associated with the number of florets and the number of grains spike−1 [59,60].
5. Conclusions
Cooler canopy is one of the factors that facilitate better assimilate distribution to grains in the top, middle, and bottom regions of spike, irrespective of levels of soil moisture particularly in normal-shaped spikes relative to either compact- or speltoid-shaped spikes. The advantage of a cooler canopy can be realized more conspicuously in plants under high temperature stress without soil moisture deficits, relative to either non-stressed or drought-stressed plants.
Supplementary Materials
The following supporting information can be downloaded at: https://0-www-mdpi-com.brum.beds.ac.uk/article/10.3390/agronomy12040978/s1, Figure S1: Influence of canopy temperature depression (CTD) on grain yield components under drought; Figure S2: Influence of canopy temperature depression (CTD) on grain yield components under late grown condition; Figure S3: Influence of canopy temperature depression (CTD) on grain weight at apical, middle, and basal parts of spike under drought; Figure S4: Influence of canopy temperature depression (CTD) on grain weight at apical, middle, and basal parts of spike under non-stressed condition; Figure S5: Influence of canopy temperature depression (CTD) on grain weight at apical, middle, and basal parts of spike for compact-shaped spikes; Figure S6: Influence of canopy temperature depression (CTD) on grain weight at apical, middle, and basal parts of spike for speltoid-shaped spikes; Table S1:The post hoc test for various yield-related traits of 15 wheat genotypes under the non-stressed, drought, and late sown (high temperature stress) condition, averaged for 2017–2018 and 2018–2019 growing seasons; Table S2: Heat susceptibility index of all the parameters for 15 wheat genotypes under late sown treatment for 2017–2018 and 2018–2019; Table S3: Drought susceptibility index of all the parameters for 15 wheat genotypes under terminal drought treatment for 2017–2018 and 2018–2019.
Author Contributions
Conceptualization, V.T. and J.R.; methodology, V.T. and J.R.; software, J.R.; validation, J.R.; formal analysis, V.T. and J.R.; investigation, V.T. and J.R.; resources, V.T. and J.R.; data curation, V.T. and J.R.; writing—original draft preparation, V.T.; writing—review and editing, J.R. and A.N.N.; visualization, V.T., J.R. and A.N.N.; supervision, J.R.; project administration, J.R. All authors have read and agreed to the published version of the manuscript.
Funding
This research was funded by Women Scientist scheme—A for research in basic and applied Sciences by the Department of Science and Technology, Government of India (File no.: SR/WOS-A/LS-162/2017) at the Department of Bioscience and Biotechnology, Banasthali Vidyapith.
Institutional Review Board Statement
Not applicable.
Informed Consent Statement
Not applicable.
Data Availability Statement
All the data are provided in the Supplementary Materials.
Acknowledgments
The authors acknowledge the member, ICAR-Indian Institute of Wheat & Barley Research, Karnal, for providing studied wheat germplasm. The authors are grateful to the Department of Bioscience and Biotechnology, Banasthali Vidyapith, for providing all necessary support. We would also like to acknowledge the support of EU Horizon 2020 research and innovation funded project PlantaSYST (SGA-CSA No. 739582 under FPA No. 664620) and European Regional Development Fund through the Bulgarian “Science and Education for Smart Growth” Operational Programme (project BG05M2OP001-1.003-001-C01).
Conflicts of Interest
The authors declare no conflict of interest.
References
- Grote, U.; Fasse, A.; Nguyen, T.; Erenstein, O. Food security and the dynamics of wheat and maize value chains in Africa and Asia. Front. Sustain. Food Syst. 2021, 4, 317. [Google Scholar] [CrossRef]
- Farooq, M.; Hussain, M.; Siddique, K.H.M. Drought Stress in Wheat during Flowering and Grain-filling Periods. Crit. Rev. Plant Sci. 2014, 33, 331–349. [Google Scholar] [CrossRef]
- Sofield, I.; Evans, L.; Cook, M.; Wardlaw, I. Factors Influencing the Rate and Duration of Grain Filling in Wheat. Funct. Plant Biol. 1977, 4, 785. [Google Scholar] [CrossRef]
- Stone, P.; Nicolas, M. Effect of Timing of Heat Stress during Grain Filling on Two Wheat Varieties Differing in Heat Tolerance. I. Grain Growth. Funct. Plant Biol. 1995, 22, 927. [Google Scholar] [CrossRef]
- Dorofeev, V.F.; Rudenko, M.I.; Filatenko, A.A.; Baras, J.; Segnalova, J.; Lemann, H. (Compiler) Тhе Intеrnаtionаl Сomесon List of Dеsсriрtors for thе Gеnus Тritiсum L.; VIR: Russia, Leningrad, 1984. (In Russian)
- Konopatskaia, I.; Vavilova, V.; Blinov, A.; Goncharov, N.P. Spike Morphology Genes in Wheat Species (Triticum L.). Proc. Latv. Acad. Sci. Sect. B. Nat. Exact Appl. Sci. 2016, 70, 345–355. [Google Scholar] [CrossRef] [Green Version]
- Baillot, N.; Girousse, C.; Allard, V.; Piquet-Pissaloux, A.; Le Gouis, J. Different grain-filling rates explain grain-weight differences along the wheat ear. PLoS ONE 2018, 13, e0209597. [Google Scholar] [CrossRef]
- Hughes, N.; Askew, K.; Scotson, C.P.; Williams, K.; Sauze, C.; Corke, F.; Doonan, J.H.; Nibau, C. Non-destructive, high-content analysis of wheat grain traits using X-ray micro computed tomography. Plant Methods 2017, 13, 76. [Google Scholar] [CrossRef] [Green Version]
- Calderini, D.F.; Ortiz-Monasterio, I. Grain position affects grain macronutrient and micronutrient concentrations in wheat. Crop Sci. 2003, 43, 141–151. [Google Scholar] [CrossRef]
- Liu, H.Z.; Wang, Y.H.; Wang, E.X.; Zhang, P.G.; Chen, D.P.; Liu, J.D. Genotypic and spike positional difference in grain phytase activity, phytate, inorganicphosphorus, iron, and zinc contents in wheat (Triticum aestivum L.). J. Cereal Sci. 2006, 44, 212–219. [Google Scholar] [CrossRef]
- Lizana, C.X.; Riegel, R.; Gomez, D.L.; Herrera, J.; Isla, A.; Mcqueen-Mason, J.S.; Calderini, F.D. Expansin expression is associated with grain size dynamics in wheat (Triticum aestivum L.). J. Exp. Bot. 2010, 61, 1147–1157. [Google Scholar] [CrossRef]
- Xie, Q.; Mayes, S.; Sparkes, D. Carpel size, grain filling, and morphology determine individual grain weight in wheat. J. Exp. Bot. 2015, 66, 6715–6730. [Google Scholar] [CrossRef] [Green Version]
- Reynolds, M.P.; Balota, M.; Delgado, M.I.B.; Amani, I.; Fischer, R.A. Physiological and morphological traits associated with spring wheat yield under hot, irrigated conditions. Aust. J. Plant Physiol. 1994, 21, 717–730. [Google Scholar] [CrossRef]
- Fischer, R.A.; Rees, D.; Sayre, K.D.; Lu, Z.M.; Condon, A.G.; Larque Saavedra, A. Wheat yield progress is associated with higher stomatal conductance and photosynthetic rate, and cooler canopies. Crop Sci. 1998, 38, 1467–1475. [Google Scholar] [CrossRef]
- Ninanya, J.; Ramírez, D.A.; Rinza, J.; Silva-Díaz, C.; Cervantes, M.; García, J.; Quiroz, R. Canopy Temperature as a Key Physiological Trait to Improve Yield Prediction under Water Restrictions in Potato. Agronomy 2021, 11, 1436. [Google Scholar] [CrossRef]
- Gutierrez-Rodriguez, M.; Reynolds, M.P.; Escalante-Estrada, J.A.; Rodriguez-Gonzalez, M.T. Association between canopy reflectance indices and yield and physiological traits in bread wheat under drought and well-irrigated conditions. Aust. J. Agric. Res. 2004, 55, 1139–1147. [Google Scholar] [CrossRef]
- Rajala, A.; Hakala, K.; Mäkelä, P.; Peltonen-Sainio, P. Drought Effect on Grain Number and Grain Weight at Spike and Spikelet Level in Six-Row Spring Barley. J. Agron. Crop Sci. 2010, 197, 103–112. [Google Scholar] [CrossRef]
- Rehman, H.U.; Tariq, A.; Ashraf, I.; Ahmed, M.; Muscolo, A.; Basra, S.M.A.; Reynolds, M. Evaluation of Physiological and Morphological Traits for Improving Spring Wheat Adaptation to Terminal Heat Stress. Plants 2021, 10, 455. [Google Scholar] [CrossRef]
- Chowdhury, M.K.; Hasan, M.A.; Bahadur, M.M.; Islam, M.R.; Hakim, M.A.; Iqbal, M.A.; Javed, T.; Raza, A.; Shabbir, R.; Sorour, S.; et al. Evaluation of Drought Tolerance of Some Wheat (Triticum aestivum L.) Genotypes through Phenology, Growth, and Physiological Indices. Agronomy 2021, 11, 1792. [Google Scholar] [CrossRef]
- Ullah, S.; Trethowan, R.; Bramley, H. The Physiological Basis of Improved Heat Tolerance in Selected Emmer-Derived Hexaploid Wheat Genotypes. Front. Plant Sci. 2021, 12, 739246. [Google Scholar] [CrossRef]
- Mwadzingeni, L.; Shimelis, H.; Tesfay, S.; Tsilo, T.J. Screening of Bread Wheat Genotypes for Drought Tolerance Using Phenotypic and Proline Analyses. Front. Plant Sci. 2016, 7, 1276. [Google Scholar] [CrossRef] [Green Version]
- Qaseem, M.F.; Qureshi, R.; Shaheen, H. Effects of Pre-Anthesis Drought, Heat and Their Combination on the Growth, Yield and Physiology of diverse Wheat (Triticum aestivum L.) Genotypes Varying in Sensitivity to Heat and drought stress. Sci. Rep. 2019, 9, 6955. [Google Scholar] [CrossRef] [PubMed] [Green Version]
- Lichthardt, C.; Chen, T.W.; Stahl, A.; Stutzel, H. Co-evolution of sink and source in the recent breeding history of winter wheat in Germany. Front. Plant Sci. 2020, 10, 1771. [Google Scholar] [CrossRef] [PubMed]
- Sehgal, J.L.; Mandal, D.K.; Mandal, C. Agro-Ecological Sub-Regions Map of India (1:4.4 m); National Bureau of Soil Survey and Land Use Planning, Indian Council of Agricultural Research (ICAR): Nagpur, India, 1996.
- Arora, A.; Kundu, S.; Dilbaghi, N.; Sharma, I.; Tiwari, R. Population structure and genetic diversity among Indian wheat varieties using microsatellite (SSR) markers. Aust. J. Crop Sci. 2014, 8, 1281–1289. [Google Scholar]
- Sharma, P.; Sharma, R.B. Molecular characterization of wheat germplasm for leaf and stem rust resistance genes using linked SSR markers. Can. J. Plant Breed. 2014, 2, 15–27. [Google Scholar]
- Malik, B.S.; Sethi, A.P.; Tewari, V. Cultivar development program. Ann. Wheat Newslet. 2003, 49, 51. [Google Scholar]
- Malik, R.; Tiwari, R.; Arora, A.; Kumar, P.; Sheoran, S.; Sharma, S.; Singh, R.; Tiwari, V.; Sharma, I. Genotypic characterization of elite Indian wheat genotypes using molecular markers and their pedigree analysis. Aust. J. Crop Sci. 2013, 7, 561–567. [Google Scholar] [CrossRef]
- Singh, T.; Dhaliwal, I.; Khosla, G. Breeder seed production of wheat at PAU: A way to quality seed availability. Agric. Res. J. 2020, 57, 284–296. [Google Scholar] [CrossRef]
- Agrawal, R.K. Development of Improved Varieties. Twenty Five Years of Co-Ordinated Wheat Research 1961–1986; Tandon, J.P., Sethi, A.P., Eds.; Wheat Project Directorate, IARI: New Delhi, India, 1986; pp. 34–39. [Google Scholar]
- Jain, K.B.L. Personal Communication; Indian Agricultural Research Institute: New Delhi, India, 1994. [Google Scholar]
- Ram, S.; Jain, N.; Dawar, V.; Singh, R.P.; Shoran, J. Acid-PAGE gliadin pattern of Indian wheats (Triticum aestivum L.) representing different environments and periods. Crop Sci. 2005, 45, 1256–1263. [Google Scholar] [CrossRef]
- The Australian Winter Cereals Collection Pedigree Database; Agricultural Research Centre: Tamworth, Australia, 1994.
- Kundu, S.; Singh, C.; Shoran, J.; Singh, S.S. An update on released wheat varieties and registered genetic stocks (Triticum L.). In Technical bulletin No.13; Directorate of Wheat Research: Karnal, India, 2010; p. 34. [Google Scholar]
- Pietragalla, J. Chapter 1. Canopy temperature. In Physiological Breeding II: A Field Guide to Wheat Phenotyping; Pask, A.J.D., Pietragalla, J., Mullan, D.M., Reynolds, M.P., Eds.; CIMMYT: Méx, Mexico, 2012. [Google Scholar]
- Fischer, K.S.; Maurer, R. Drought resistance in spring wheat genotypes. I. Grain yield responses. Aust. J. Agric. Res. 1978, 29, 897–912. [Google Scholar] [CrossRef]
- R team. R: A Language and Environment for Statistical Computing. R Foundation for Statistical Computing. 2013, p. 201. Available online: https://www.R-project.org/ (accessed on 3 September 2021).
- Fox, J. Structural Equation Modeling With the sem Package in R. Struct. Equ. Modeling. 2006, 13, 465–486. [Google Scholar] [CrossRef] [Green Version]
- Cooper, J.K.; Ibrahim, A.M.H.; Rudd, J.; Hays, D.; Malla, S.; Baker, J. Increasing hard winter wheat yield potential via synthetic hexaploid wheat: II. Heritability and combining ability of yield and its components. Crop Sci. 2013, 53, 67–73. [Google Scholar] [CrossRef]
- Mahpara, S.; Hussain, S.T.; Iqbal, J.; Noorka, I.R.; Salman, S. 12. Analysis of generation means for some metric plant traits in two wheat (Triticum aestivum L.) hybrids. Pure Appl. Biol. 2018, 7, 93–102. [Google Scholar] [CrossRef]
- Mahpara, S.; Rehmani, M.I.A.; Hussain, S.; Iqbal, J.; Qureshi, M.K.; Shehzad, M.A.; Dar, J.S. Heterosis for some physio-morphological plant traits in spring wheat crosses. Pure Appl. Biol. 2017, 6, 1103–1110. [Google Scholar] [CrossRef]
- Ferrante, A.; Savin, R.; Slafer, G.A. Floret development and grain setting differences between modern durum wheats under contrasting nitrogen availability. J. Exp. Bot. 2013, 64, 169–184. [Google Scholar] [CrossRef]
- Guo, Z.; Schnurbusch, T. Variation of floret fertility in hexaploid wheat revealed by tiller removal. J. Exp. Bot. 2015, 66, 5945–5958. [Google Scholar] [CrossRef] [Green Version]
- Gautam, A.; Sai Prasad, S.V.; Jajoo, A.; Ambati, D. Canopy Temperature as a Selection Parameter for Grain Yield and Its Components in Durum Wheat Under Terminal Heat Stress in Late Sown Conditions. Agric. Res. 2015, 4, 238–244. [Google Scholar] [CrossRef]
- Rutkoski, J.; Poland, J.; Mondal, S.; Autrique, E.; Pérez, L.G.; Crossa, J.; Reynolds, M.; Singh, R. Canopy Temperature and Vegetation Indices from High-Throughput Phenotyping Improve Accuracy of Pedigree and Genomic Selection for Grain Yield in Wheat. G3 Genes Genom. Genet. 2016, 6, 2799–2808. [Google Scholar] [CrossRef] [Green Version]
- Thapa, S.; Jessup, K.E.; Pradhan, G.P.; Rudd, J.C.; Liu, S.; Mahan, J.R.; Devkota, R.N.; Baker, J.A.; Xue, Q. Canopy temperature depression at grain filling correlates to winter wheat yield in the U.S. Southern High Plains. Field Crops Res. 2018, 217, 11–19. [Google Scholar] [CrossRef]
- Blum, A. Plant Breeding for Stress Environments; CRC Press: Boca Raton, FL, USA, 1988; p. 223. [Google Scholar]
- Sharma, D.L.; Anderson, W.K. Small grain screenings in wheat: Interactions of genotypes with season, site, and management practices. Aust. J. Agric. Res. 2004, 55, 797. [Google Scholar] [CrossRef]
- Nuttall, J.G.; O’Leary, G.J.; Panozzo, J.F.; Walker, C.K.; Barlow, K.M.; Fitzgerald, G. Models of grain quality in wheat—A review. Field Crops Res. 2017, 202, 136–145. [Google Scholar] [CrossRef] [Green Version]
- Philipp, N.; Weichert, H.; Bohra, U.; Weschke, W.; Schulthess, A.W.; Weber, H. Grain numberand grain yield distribution along the spike remainstable despite breeding for high yield in winter wheat. PLoS ONE 2018, 13, e0205452. [Google Scholar] [CrossRef] [PubMed] [Green Version]
- Reynolds, M.; Foulkes, M.J.; Slafer, G.A.; Berry, P.; Parry, M.A.; Snape, J.W.; Angus, W.J. Raising yield potential in wheat. J. Exp. Bot. 2009, 60, 1899–1918. [Google Scholar] [CrossRef] [PubMed] [Green Version]
- Bremner, P.; Rawson, H. The Weights of Individual Grains of the Wheat Ear in Relation to Their Growth Potential, the Supply of Assimilate and Interaction between Grains. Funct. Plant Biol. 1978, 5, 61–72. [Google Scholar] [CrossRef]
- Wardlaw, I.F. Temperature control of translocation. In Mechanism of Regulation of Plant Growth; Bielske, R.L., Ferguson, A.R., Cresswell, M.M., Eds.; Bulletin of Royal Society of New Zealand: Wellington, New Zealand, 1974; pp. 533–538. [Google Scholar]
- Tashiro, T.; Wardlaw, I.F. The Effect of High Temperature at Different Stages of Ripening on GrainSet, Grain Weight and Grain Dimensions in the Semi-dwarf Wheat “Banks”. Ann. Bot. 1990, 65, 51–61. [Google Scholar] [CrossRef]
- Guo, Z.; Chen, D.; Alqudah, A.M.; Röder, M.S.; Ganal, M.W.; Schnurbusch, T. Genome-wide association analyses of 54 traits identified multiple loci for the determination of floret fertility in wheat. New Phytol. 2017, 214, 257–270. [Google Scholar] [CrossRef] [PubMed]
- Freeman, K.W.; Raun, W.R.; Johnson, G.V.; Mullen, R.W.; Stone, M.L.; Solie, J.B. Late-season prediction of wheat grain yield and grain protein. Commun. Soil Sci. Plant Anal. 2007, 34, 1837–1852. [Google Scholar] [CrossRef]
- Khan, A.; Ahmad, M.; Shah, M.K.N. Performance of wheat genotypes for morpho-physiological traits using multivariate analysis under terminal heat stress. Pak. J. Bot. 2019, 52, 1981–1988. [Google Scholar] [CrossRef]
- Ozturk, I. Effect of Canopy Temperature at Different Growth Stage on Yield Component in Bread Wheat (Triticum aestivum L.) Genotypes under Rainfed Condition. Int. J. Innov. Approaches Agric. Res. 2020, 4, 136–146. [Google Scholar] [CrossRef]
- Parihar, R.; Agrawal, A.P.; Burman, M.; Minz, M.G. Relationship between grain yield and other yield attributing characters in wheat under terminal heat stress. J. Pharmacog. Phytochem. 2018, 7, 2114–2117. [Google Scholar]
- Zečević, V.; Knežević, D.; Bošković, J.; Mićanović, D.; Dimitrijević, B. Genetic and phenotypic variability of number of spikelets per Spike in winter wheat. Kragujev. J. Sci. 2009, 31, 85–90. [Google Scholar]
Figure 1.
Average daily minimum and maximum temperatures (°C) during 2017–2018 (A) and 2018–2019 (B) during wheat growing season at experimental site (Farm Science Center, Banasthali Vidyapith, Rajasthan, India).
Figure 1.
Average daily minimum and maximum temperatures (°C) during 2017–2018 (A) and 2018–2019 (B) during wheat growing season at experimental site (Farm Science Center, Banasthali Vidyapith, Rajasthan, India).

Figure 2.
Influence of canopy temperature depression (CTD) on grain yield components combined under all treatments. Pearson correlation coefficient is revealed by r-value, and each graph consists of 270 pairs of data points generated from experiments over two years, for three treatments and 15 genotypes; *** depicts significant differences at p-value of 0.001.

Figure 3.
Influence of canopy temperature depression (CTD) on grain yield components under non-stressed condition. Pearson correlation coefficient is revealed by r-value, and each graph consists of 135 pairs of data points generated from experiments over two years, for non-stressed treatment alone and 15 genotypes; *** depicts significant differences at p-value of 0.001.

Figure 4.
Influence of canopy temperature depression (CTD) on grain weight at the apical, middle, and basal parts of spike under late sown conditions. Pearson correlation coefficient is revealed by r-value, and each graph consists of 135 pairs of data points generated from experiments over two years, for late sown treatment aloneand 15 genotypes; *** and ** depicts significant differences at p-value of 0.001 and 0.01, respectively.

Figure 5.
Influence of canopy temperature depression (CTD) on grain weight at apical, middle, and basal parts of spike for normal-shaped spikes. Pearson correlation coefficient is revealed by r-value, and each graph consists of 135 pairs of data points generated from experiments over two years; *** and ** depicts significant differences at p-value of 0.001 and 0.01, respectively.

Figure 6.
Influence of canopy temperature depression (CTD) on the intra-spike distribution of assimilates represented by the coefficient of variation (CV) of grain weight across length of spike for each genotype averaged over all the treatments. Each dot in the figure represents an average of 18 values derived from 3 replications of 3 treatments assessed across two years.

Figure 7.
Structural equation model to illustrate the influence of different traits on yield spike−t. Directed edges indicate linear regression parameters, bidirectional edges indicate (co)variances, and residual variances are indicated with double-headed self-loops (RAM style). Abbreviations viz., CTD, GrNo, Splet, Yield, GrFD, Basal, Mid, Apical, and SpLen refer to canopy temperature depression, grains spike−¹, spikeletsspike−¹, grain yield spike−¹, grain-fill duration, basal_grain weight, middle_grain_weight, apical_grain_weight, and spikelength, respectively.


Table 1.
Pedigree, source, and spike shapes of wheat genotypes used in the experiment.
| S.No. | Genotypes | Pedigree | Source of Genotype * | Spike Shape |
|---|---|---|---|---|
| 1 | AKAW 4627 | WH-147/SUNSTAR * 6/C-80-1 [25] | PDKV, Akola | Compact |
| 2 | HALNA | HD-1982/K-816 [26] | CSUAT, Kanpur | Normal |
| 3 | HD 2643 | VEE S/HD 2407/HD 2329 [27] | IARI, New Delhi | Spelt |
| 4 | HD 2967 | ALD/COC//URES/HD2160m/HD 2278 [28] | IARI, New Delhi | Spelt |
| 5 | HD 2987 | HI1011/HD2348//MENDOS//IWP72/DL153-2 [25] | IARI, New Delhi | Normal |
| 6 | HPBW01 | T.DICOCCON, CI9309/AE.SQUARROSA (409)//MUTUS/3/2 * MUTUS [29] | PAU, Ludhiana | Normal |
| 7 | HUW 234 | HUW-12 * 2/CPAN-1666//HUW-12 [30] | BHU, Varanasi | Compact |
| 8 | MP 4010 | CAM50123-3M-Y-2M-1Y-2M-Y-2M-2Y-OM-OMR/S [25] | JNKVV Jabalpur | Spelt |
| 9 | PBW 175 | HD2160/4/JN/GAGE/JN/KAL/3/PV18/C273 [31] | PAU, Ludhiana | Normal |
| 10 | PBW 396 | CNO67/MFD//MON”S”/3/SERI [32] | PAU, Ludhiana | Spelt |
| 11 | Raj 3765 | HD-2402/VL-639; HP-1633/HP-1776 [32] | Durgapura, Jaipur | Normal |
| 12 | Raj 4037 | DL-788-2/RAJ-3717 [32] | Durgapura, Jaipur | Normal |
| 13 | Raj 4079 | UP2363/WH595 [32] | Durgapura, Jaipur | Normal |
| 14 | Sunstar | CONDOR, AUS/4/2 * WW-15/3/STEINWEDEL/YAROSLAV-EMMER//LA-PREVISION [33] | Australia | Compact |
| 15 | WH 730 | CPAN 2092/Improved Lok-1 [34] | HAU, Hisar | Normal |
* PDKV—Dr. PunjabraoDeshmkh Krishi Vidyapeeth; CSUAT—Chandra Shekhar Azad University of Agriculture and Technology; IARI—Indian Agricultural Research Institute; PAU—Punjab Agriculture University; BHU—Banaras Hindu University; JNKVV—Jawaharlal Nehru Krishi Vishwavidyalaya, HAU—Hisar Agriculture University.
Table 2.
Mean squares of analysis of variance (ANOVA) of 15 wheat genotypes grown under non-stressed, terminal drought, and late sown (terminal heat stress) during 2017–2018 and 2018–2019.
Table 2.
Mean squares of analysis of variance (ANOVA) of 15 wheat genotypes grown under non-stressed, terminal drought, and late sown (terminal heat stress) during 2017–2018 and 2018–2019.
| Source of Variation | Df | Grains Spike−1 | Yield Spike−1 (g) | Spikelets Spike−1 | GFD | CTD (°C) |
|---|---|---|---|---|---|---|
| Year | 1 | 69.51 | 0.074 | 18.148 ** | 2569.96 *** | 0.0623 |
| Treatment | 2 | 1150.36 *** | 9.6804 *** | 168.344 *** | 267.27 *** | 5.1925 *** |
| Genotype | 14 | 2395.64 *** | 4.9404 *** | 123.856 *** | 66.93 *** | 2.2761 *** |
| Year:Treatment | 2 | 96 | 0.0511 | 18.226 *** | 181.07 *** | 0.2663 |
| Year:Genotype | 14 | 28.1 | 0.0865 | 5.505 *** | 56.24 *** | 0.2592 |
| Treatment:Genotype | 28 | 329.39 *** | 1.045 *** | 18.829 *** | 8.68 * | 0.441 *** |
| Year:Treatment:Genotype | 28 | 29.1 | 0.0783 | 6.535 *** | 17.09 *** | 0.2035 |
| Residuals | 180 | 56.47 | 0.2363 | 1.685 | 5.18 | 0.1628 |
Where ***, **, and * depicts significant differences at p-value of 0.001, 0.01, and 0.05, respectively.
Publisher’s Note: MDPI stays neutral with regard to jurisdictional claims in published maps and institutional affiliations. |
© 2022 by the authors. Licensee MDPI, Basel, Switzerland. This article is an open access article distributed under the terms and conditions of the Creative Commons Attribution (CC BY) license (https://creativecommons.org/licenses/by/4.0/).
Share and Cite
MDPI and ACS Style
Thakur, V.; Rane, J.; Nankar, A.N. Comparative Analysis of Canopy Cooling in Wheat under High Temperature and Drought Stress. Agronomy 2022, 12, 978. https://0-doi-org.brum.beds.ac.uk/10.3390/agronomy12040978
AMA Style
Thakur V, Rane J, Nankar AN. Comparative Analysis of Canopy Cooling in Wheat under High Temperature and Drought Stress. Agronomy. 2022; 12(4):978. https://0-doi-org.brum.beds.ac.uk/10.3390/agronomy12040978
Chicago/Turabian StyleThakur, Vidisha, Jagadish Rane, and Amol N. Nankar. 2022. "Comparative Analysis of Canopy Cooling in Wheat under High Temperature and Drought Stress" Agronomy 12, no. 4: 978. https://0-doi-org.brum.beds.ac.uk/10.3390/agronomy12040978
Note that from the first issue of 2016, this journal uses article numbers instead of page numbers. See further details here.