
Novel Methodology for the Assessment of Organic Carbon Stocks in German Arable Soils


1
Helmholtz Centre for Environmental Research GmbH—UFZ, D-06114 Halle, Germany
2
Programme Area “Next-Generation Horticultural, Leibniz-Institute for Vegetable and Ornamental Crops Systems”, D-014979 Grossbeeren, Germany
*
Author to whom correspondence should be addressed.
Agronomy 2022, 12(5), 1231; https://0-doi-org.brum.beds.ac.uk/10.3390/agronomy12051231
Submission received: 11 April 2022
/
Revised: 12 May 2022
/
Accepted: 19 May 2022
/
Published: 21 May 2022
(This article belongs to the Topic Soil Fertility and Plant Nutrition for Sustainable Agriculture)
Abstract
:There is currently a significant focus on oil organic carbon, as interest in mitigating climate change by increasing soil carbon stocks is leading to efforts to include this within carbon farming and the trade of CO2 certificates. In addition, soil organic carbon controls many other soil functions, such as soil productivity. However, results from long-term field experiments suggest that an ever-increasing carbon content in soil, at some point, will no longer increase productivity, but will cause environmental risks, especially from excess nitrogen. In Germany, the most widely recognized soil organic matter (SOM) balance method, VDLUFA (Association of German Agricultural Investigation and Research Institutions), addresses soil management only, without a relation to the soil carbon stock. To close this gap, a methodology is developed based on results from European long-term field experiments that allows for an assessment of agricultural management both in terms of the carbon input to soil and the amount of carbon stored in soil. Due to the transformation of carbon stock into carbon flux, it is possible to apply the classification scheme of the VDLUFA balance to the carbon content of topsoils. This provides information to qualify further decisions about fostering carbon accumulation. This was demonstrated on experimental results from Bad Lauchstädt, as well as on data from the German Agricultural Soil Inventory (BZE-LW) for arable soils on a regional scale.
1. Introduction
Soil organic matter (SOM), which is usually characterized by the amount of soil organic carbon (SOC) that is stored in topsoil, is one of the most important indicators for the productivity of soils and determines the carbon storage function of soil [1]. Recently, this soil function has come into focus as a possible sink of atmospheric CO2 to mitigate climate change, which itself will have a serious impact on soil organic matter, as higher temperature are generally expected to increase the SOC decomposition rate. The first German Agricultural Soil Inventory (BZE-LW) gave a good overview of the amount of carbon stored in arable soils [2,3] and provided data contributing to better understanding differentiations of carbon stocks in relation to site conditions [4,5]. While this gave hints to the required amount of fresh organic matter (FOM) [6] and also to regional differentiation of SOC quality [7], there is still no sufficient benchmark to link agronomic quality with the amount of SOC storage.
On the other hand, soil organic matter stocks of arable soils in Germany are affected by applying established management recommendations without the use of target values of SOC or SOM. Here, the most widely recognized SOM balance method of VDLUFA (Association of German Agricultural Investigation and Research Institutions) [8] predicts the organic matter (OM) demand of crop rotations, but considers neither the management history nor soil properties (including SOC content) and environmental conditions [9]. This may be appropriate from an agronomic point of view because in the long-term and independent from soil and weather conditions, SOC decay corresponds to C input via fresh organic matter (FOM-C input). Unfortunately, the mere balancing of carbon flux and SOM decay provides no information about the SOC content. However, this is necessary for predicting the desirable amount dependent on soil texture and climate conditions, as well as for evaluating the present SOC stock in the context of social and environmental needs. Therefore, it would be convenient to find a common “currency” to evaluate a given or planned management scheme in terms of its FOM-C input in comparison to the actual SOC stock. However, SOM turnover is observable only over decades, and direct feedback from a hot summer or a mild winter to the size of the SOM stock can usually not be determined because its spatial variability is high, and year-to-year SOM changes are low compared to the total SOM storage. Changes in SOM stocks are mainly observable in long-term fertilization experiments (LTFEs) that allow for the quantification of their respective effect of FOM input on SOC stock. For a number of these LTFEs, an “optimum” amount of applied organic amendments was identified [10]. In this context, “optimum” means that in combination with an amount of mineral N fertilizer, which was related to a high N efficiency, an increase in the amount of organic amendments did not lead to a further yield increase [8,11,12]. Consequently, the prediction of the FOM input, which corresponds to the respective “optimum” SOC stock, allows the assessment of this SOC stock. Therefore, SOC stocks higher or lower than the “optimum” can be classified as OM-oversupplied or OM-undersupplied. Modeling provides a convenient tool for assessing possible management options according to their effect on SOM dynamics against the background of the climate change problem [13].
To summarize, we hypothesize that:
- SOC stocks can be expressed as the result of a carbon reproduction flux;
- Carbon reproduction flux can be related to the classification of the VDLUFA humus balance method;
- Optimum carbon reproduction flux can be predicted from soil texture and site-specific turnover activity.
Thus, our first goal is the development of simple modeling approaches to show the relation between carbon flux and SOC stock. Starting from this knowledge, we develop a methodology to transfer a FOM-C input into a C stock and vice versa. To this end, we select LTFE treatments that were characterized as optimum for the given site conditions, and we calculate the required input rates to sustain the SOC content of these treatments. Looking for a solution that closes the gap between the results of a simple FOM balance method (VDLUFA method) and mechanistic SOM turnover models, we provide a methodology that evaluates soil management in terms of FOM-C input as well as the actual SOC content. Finally, the general applicability and the plausibility of the assessment approach are checked for selected treatments at the Bad Lauchstädt experimental site and on a large scale using data from the German Agricultural Soil Inventory (BZE-LW) for arable soils [3].
2. Materials and Methods
2.1. Long-Term Fertilization Experiments (LTFEs)
We used LTFE data to derive a methodology that bridges the gap between the results of the abovementioned SOM balance method of VDLUFA and that of the mechanistic SOM turnover model. Detailed information regarding the experimental specifics and site conditions are given in the literature as indicated below in Table 1, where the metadata are given.
From the three sites (Bad Lauchstädt [14], Groß Kreutz [10], and Rothamsted [15]), time series of observed SOC values from treatments with and without farm yard manure (FYM) application were used to visualize the effect of different time scales, BAT- and calendar-based (see also Section 2.3), on the time course of SOC stock changes.
From all sites excluding Rothamstedt, treatments that received an “optimum” amount of applied organic amendments are known, as mentioned in the introduction chapter. These data were used to classify an indicator that evaluates the ratio between the current CFOM input and the corresponding SOC content.
If not given in the corresponding literature, we considered a SOC-dependent bulk density calculation [16] to transfer SOC contents in SOC stocks.
Furthermore, we used a dataset from the LTFEs at Bad Lauchstädt with a wide range of observed SOC values on one experimental site (see Section 3.3) to check the plausibility of our assessment method. The soil conditions for the Bad Lauchstädt site were described in detail by Altermann et al. [17]. Most data came from the “Static Fertilization Experiment Bad Lauchstädt” where, after more than 115 years of continuous management, soil samples were collected in 2018. Details about this LTFE can be found in [18,19,20,21]. Here, we used SOC data of the treatments with different application rates of farmyard manure (FYM) that was applied every two years to the root crops and later to maize in combination with mineral fertilizers (NPK). The FYM doses were 0 Mg ha−1 year−1 (M0), 10 Mg ha−1 year−1 (M1), and 15 Mg ha−1 year−1 (M2). Additionally, we included data from the soil sampling in 2018 of the extreme treatments of the experiment with “High Manure Doses Bad Lauchstädt” [22]. This experiment was started in 1978 and provides data about the development of SOC if FYM is applied beyond a reasonable agronomic limit. The annual FYM application rates on the bare fallow soil were 50 Mg ha−1 (M3), 100 Mg ha−1 (M4), and 200 Mg ha−1 (M5), always on a fresh-weight base.

Table 1.
LTFE metadata. Time range indicates the time until the last used soil sampling, MAP: mean annual precipitation, and MAT: mean annual temperature.
Table 1.
LTFE metadata. Time range indicates the time until the last used soil sampling, MAP: mean annual precipitation, and MAT: mean annual temperature.
| Site | Initial Year | Time Range Years | MAP mm | MAT °C | Clay M% | Silt M% | SOC Opt. M% | FYM Rate Mg ha−1 year−1 | Data Source |
|---|---|---|---|---|---|---|---|---|---|
| (1) Bad Lauchstädt (a) | 1902 | 117 | 480 | 8.8 | 21.0 | 67.8 | 2.12 | 0,10, 15 | [14,23] |
| (2) Bad Lauchstädt (b) | 1978 | 30 | 480 | 8.8 | 21.0 | 67.8 | - | 50, 100, 200 | [22] |
| (3) Berlin Dahlem | 1984 | 12 | 550 | 9.3 | 4.3 | 22.9 | 0.56 | 10 | [23] |
| (4) Dikopshof | 1904 | 92 | 635 | 9.7 | 10.0 | 74.9 | 1.27 | 12 | [23] |
| (5) Groß Kreutz | 1967 | 43 | 537 | 8.9 | 6.0 | 44.0 | 0.92 | 21 | [24] |
| (6) Jable | 1992 | 10 | 1397 | 9.7 | 16.8 | 55.5 | 1.4 | 10 | [23] |
| (7) Puch | 1983 | 12 | 922 | 7.9 | 15.0 | 33.1 | 1.06 | 10 | [23] |
| (8) Rakican | 1992 | 10 | 810 | 9.4 | 14.7 | 31.2 | 1.16 | 10 | [23] |
| (9) Rothamsted | 1852 | 156 | 712 | 9.5 | 25.0 | 62.0 | - | 35 | [15] |
| (10) Speyer | 1984 | 12 | 583 | 9.8 | 8.9 | 22.7 | 0.96 | 10 | [23] |
| (11) Thyrow | 1937 | 74 | 496 | 8.6 | 2.7 | 14.2 | 0.63 | 15 | [23] |
| (12) Wien | 1986 | 12 | 489 | 9.5 | 25.2 | 46.5 | 2.24 | 10 | [23,25] |
(a) Static experiment Bad Lauchstädt with normal FYM rates M0, M1, M2; (b) manure in high doses with high FYM rates M3, M4, M5.
2.2. First German Agricultural Soil Inventory
To check the general applicability of our methodology evaluating the C stocks of German agricultural soils, we used the data of the first German Soil Status Inventory (BZE-LW), where soil samples were collected in an 8 km × 8 km grid across Germany [6]. The corresponding dataset [3] provides a wide range of soil types with detailed soil properties. Here, average values of SOC, skeletal fraction, clay, silt, and fine silt for the topsoil (≤0.3 m) were used. Furthermore, using the coordinates of the sampling points, it was possible to include long-term averages of air temperature and rainfall provided by the German Weather Service (DWD, opendata.dwd.de (accessed on 5 April 2022)) in our analyses. Records of organic soils containing no texture data, as well as of hydromorphic sites as characterized by very high amounts of carbon and/or by an unreasonably high C to N ratio (>15) were excluded, leaving a dataset of 2036 out of 2234 records from arable soils, which represents more than 90%.
2.3. Relation between SOC Stock and C Flux into SOC
Henin and Dupuis [26] proposed a simple first-order model to describe the relation between SOC stock at time t (SOCt), the initial SOC stock (SOC0), and the annual input rate of C (I):
where kc and ki are the decay constants of and I, respectively.
Because we are interested in the development of the SOC difference between the two treatments that was caused by different inputs, the equation can be solved to
Using the theoretical background of the CANDY and CCB models, the humus-building effect of FOM-C can be expressed as C reproduction (Crep), and the impact of site conditions on SOM turnover intensity can be expressed as biologically-active time (BAT).
BAT is a measure to express the effect of the environment—temperature, moisture, and aeration—on the intensity of carbon turnover in soil. In C modeling, these environmental effects were at least considered by modifying the rate constants of the corresponding C pools; for instance, by reducing the maximum rate constant by 60% or 40% for two different days with suboptimal environmental conditions. In the BAT concept, the maximum rate constant is not reduced, but the time within the carbon turnover taking place is reduced. In the mentioned example, the two calendar days correspond to a summary with one day of biologically-active time. In both cases, the product of rate constant and time—the turnover—is equal. Here, we understand the term “BAT” as the sum of biologically-active time per calendar year. The BAT concept was frequently used applying the CANDY model (CArbon and Nitrogen DYnamics) [27]. In the context of applying the abovementioned approach (Equation (2)), we also used a simple approach to calculate BAT as dependent on soil texture and the long-term annual mean of air temperature and sum of precipitation [28].
The reproductive C () input is the proportion of FOM-C that initially is integrated into the SOM pools via microbial consumption, while the other part is released as CO2. This proportion differs according to the microbial utilization of different carbon sources. In the case of farmyard manure, we used a transfer coefficient of 0.64 according to Franko et al. [29], where the corresponding transfer coefficients of other FOM sources (e.g., manures and plant residues) are also given.
Thus, we express the time as BAT, define the input rate as the quotient of Crep and BAT, and introduce an additional parameter that must be fitted as well as the decay constant k.
Now, this simple model approach for the relationship between C flux and SOC stock can be presented as follows:
where = difference in C amount between two treatments with and without FYM in the Ap horizon [Mg ha−1], = biologically-active time [days year−1], = cumulative BAT for the corresponding number of years, = reproductive C input [kg ha−1 year−1], and and are fitting parameters.
This model approach (Equation (3)) was applied to published data from three long-term experiments, two of them in Germany—Bad Lauchstädt [14] and Groß Kreutz [10]—and one in the UK—Rothamsted [15]. The site-specific parameters can be found in Table 1. In all three cases, we used the time series of C stock differences between the particular treatment with farmyard manure application and the corresponding treatment without manure to obtain a direct response of the C stock to a known FOM-C input.
The difference approach of Equation (3) neglects the inhomogeneity of SOC, especially that a part of it may be stabilized within the soil structure. Therefore, we used the more sophisticated model algorithm of the CCB model as described by Franko and Merbach [30] to find the corresponding SOC stock as a steady state value for a given C flux. This was performed within several iteration cycles, where after each step, a new set of soil structure variables was determined using pedotransfer functions that consider soil texture and the SOC value at this step. This iteration ends if the difference between two steady state levels is negligibly small, and the final SOC value is taken as equivalent to the given C flux.
In an inverse manner, the same procedure was applied to find the C flux for a given SOC value, assuming a steady state.
2.4. VDLUFA Humus Balance
Humus-balancing methods are simple tools for the assessment of interactions between agricultural land use and soil organic matter, but approaches differ considerably with regard to their specific aim, scope, and methodical approach. The term “humus balance” covers both simple models predicting SOC change and methods that focus on optimization of soil productivity by calculating organic-fertilizer demand, without regarding SOC change [31]. The VDLUFA balance method belongs to the latter group, calculating the balance between a demand depending on the grown crops and a supply of OM from organic amendments and crops, leaving a net humus supply or demand. Detailed values are given in a practically applicable form [8].
The units of this method are so-called humus equivalents (HEQ), which were used to characterize both sides of the balance: the crop demand as well as external organic matter input. This balance is divided into five classification levels from very low (<−200 HEQ) to very high (>300 HEQ), with a normal range between −75 and +100 HEQ, and should be calculated for a cropping sequence over several years. For convenience, we derive a factor to translate the HEQ values into C flux differences using FYM as a reference (see Table 2).
3. Results and Discussion
3.1. Relation between SOC Stock and C Flux into SOM
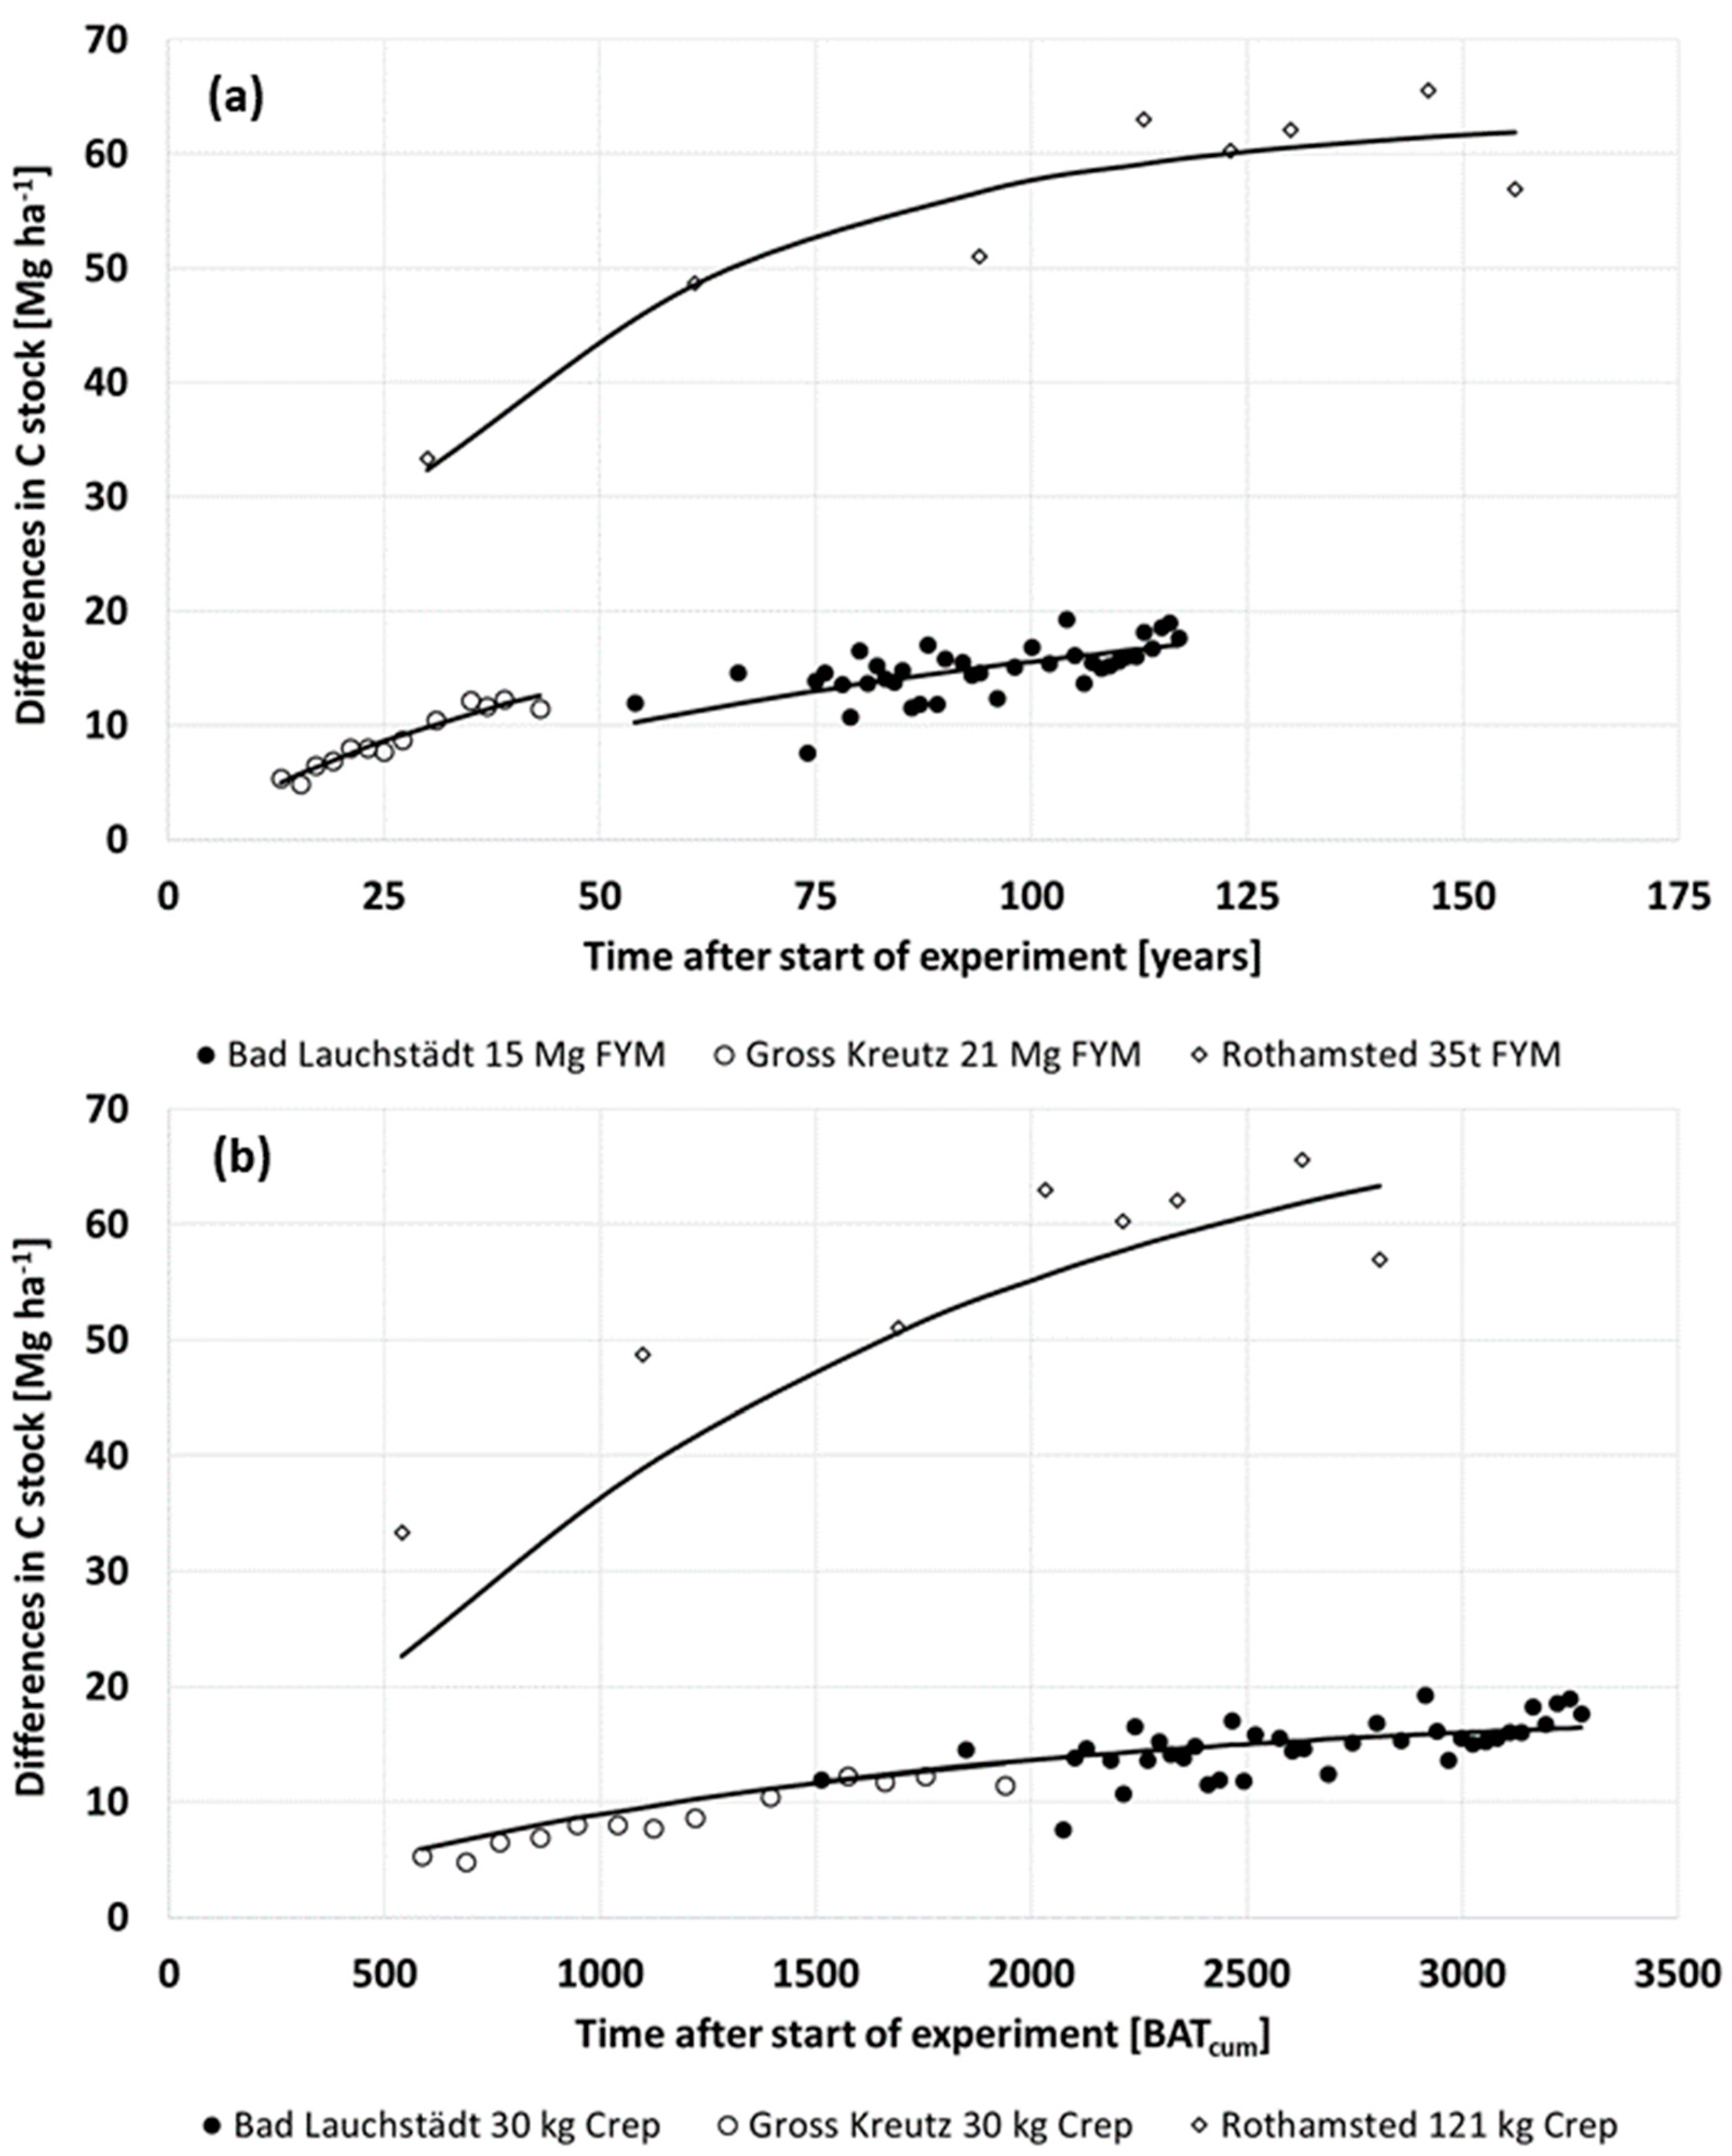
To analyze the effect of FOM input on C stock, we used a time series of C stock differences between a treatment with farmyard manure application and the corresponding treatment without manure in the three LTFE sites at Bad Lauchstädt, Gross Kreutz, and Rothamsted, as already described in Section 2.3. Figure 1a shows the conventional representation of SOC stock differences over time in years. For each site, a different dynamic is visible, leading to site-specific SOC equilibrium levels (data not shown). Obviously, the relationship between different levels of SOC stock differences does not reflect the relationship between the different FYM input levels. More convenient results gave the fitting of the approach in Figure 1b, where Equation (3) was applied on the BAT scale. Now, it is possible to describe the development of SOC stock differentiation with one model where the site-specific drivers were the time scale as cumulative BAT, and the C flux is the BAT-related Crep input.
Despite the different values of the annual FYM input rates at Gross Kreutz and Bad Lauchstädt (see Figure 1a), the BAT-related Crep input was equal at both sites (see Figure 1b, open and filled circles); thus, the observations fit together in the same function line (striving for the same SOC equilibrium level (data not shown)). The BAT-related Crep input of the Rothamsted dataset (Legend of Figure 1 (bottom)) is four times the value at Gross Kreutz and Bad Lauchstädt. Therefore, the relation between both function lines is characterized by the same factor, and is still a very good match with the observations (Figure 1 (bottom), open diamonds).
Compared to the conventional presentation of the temporal development of the C stocks vs. the time in years (Figure 1a), the corresponding figure above the cumulative biological time shows that applying the BAT scale gives new insight into the relationship between C input and C stock. Obviously, the events on the BAT scale are shifted in comparison to the conventional time scale. The first measured date of Bad Lauchstädt (after 54 years) lies on the BAT scale within the measurements of Groß Kreutz that were made approximately 30 years after the initiation of the experiment. The last observation date of Rothamsted (after 156 years) corresponds on the BAT scale to Bad Lauchstädt observations made approximately 60 years earlier.
Furthermore, the proposed representation of the C flux is very helpful for understanding both similarities between experiments. Applications of 15, 21, and 35 Mg ha−1 FYM fresh matter at Bad Lauchstädt, Groß Kreutz, and Rothamsted, respectively, correspond to BAT-related input rates of 30 kg at both Bad Lauchstädt and Groß Kreutz, whereas the Crep value at Rothamsted is 121 kg. Obviously, this can explain the development of C stock differences that are now proportional to the size of the Crep input rate. The fourfold higher Crep input of ROTH also produced fourfold higher C stock differences compared to Bad Lauchstädt and Groß Kreutz, which have the same Crep input.
3.2. Site-Specific Assessment of C Stocks and C Fluxes
For an assessment of the SOC level, it would be reasonable to use a procedure similar to the VDLUFA balance method, meaning that we can define a recommended range, as well as identify levels where the SOC level is too high or too low.
To this end, we transformed the SOC values into the corresponding C flux values and converted HEQ units into Crep values. From the parameter set of the VDLUFA balance method, we know that 104 kg FYM represents 400 HEQ. Assuming 25% dry matter and 40% Corg in DM and the CCB parameter eta = 0.64 [29], this amounts to 640 kg Crep and a factor of 1.6 kg Crep/HEQ
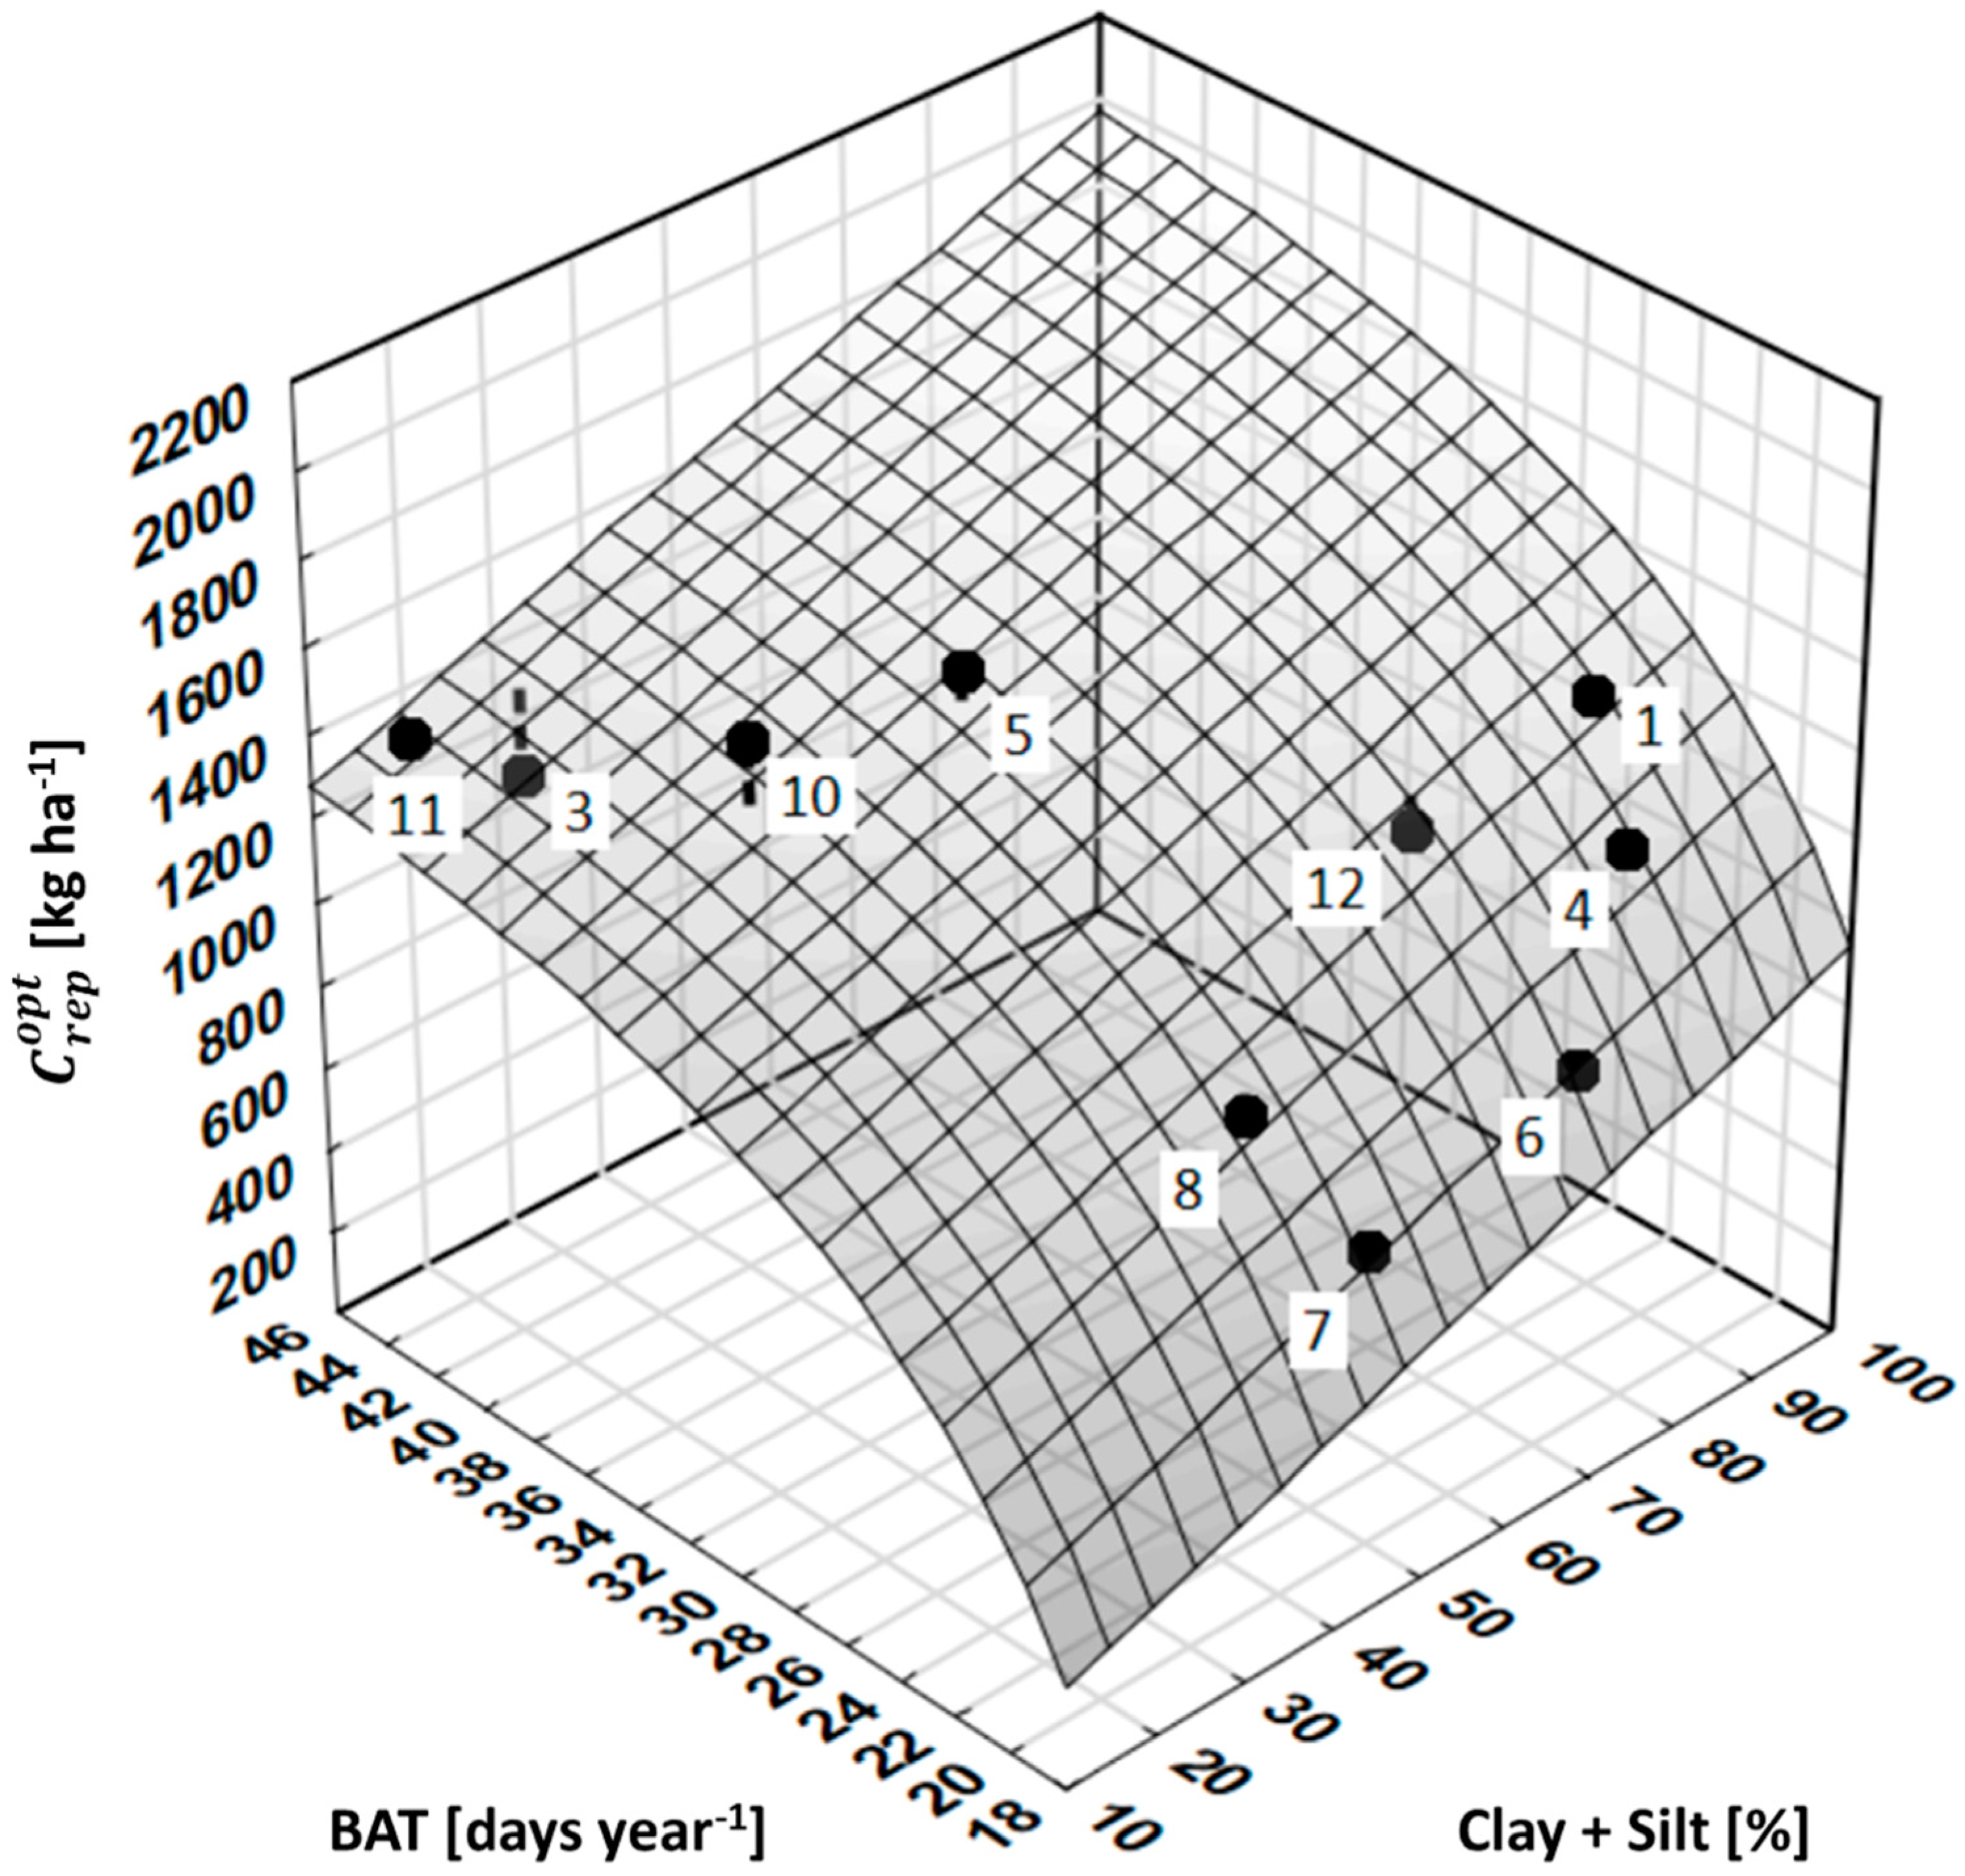
The C flux values that correspond to the experimental SOCopt values were calculated based on the site-specific data shown in Table 1 and were satisfactorily predictable from soil texture in terms of clay and silt, and BAT (Equation (4), Figure 2):
where R2 = 0.87, with standard errors of parameters in parentheses; p values < 0.005.
Similar to the VDLUFA approach, we based the assessment procedure on the difference between the actual (corresponding to the actual SOC amount) and the optimal C flux.
The resulting difference, ΔCrep, can be used to assess the SOC level in the same way as the management in the VDLUFA balance using the classification rules in Table 2.
It is one peculiarity of the VDLUFA method that it does not refer to site conditions, neither soil texture nor climate. While the ‘optimal’ SOC stock as well as the corresponding ‘optimal’ Crep flux depend on soil texture and climate, the C flux difference , which gives the difference between the present and the optimal Crep flux, is independent of site conditions. In other words, while the absolute values of Crep flux and C stock must be considered site specific depending on soil texture and climate conditions as expressed in the BAT variable, the assessment in general classes must be based on .
3.3. Assessment of a Wide Range of SOC Levels at the Bad Lauchstädt Site
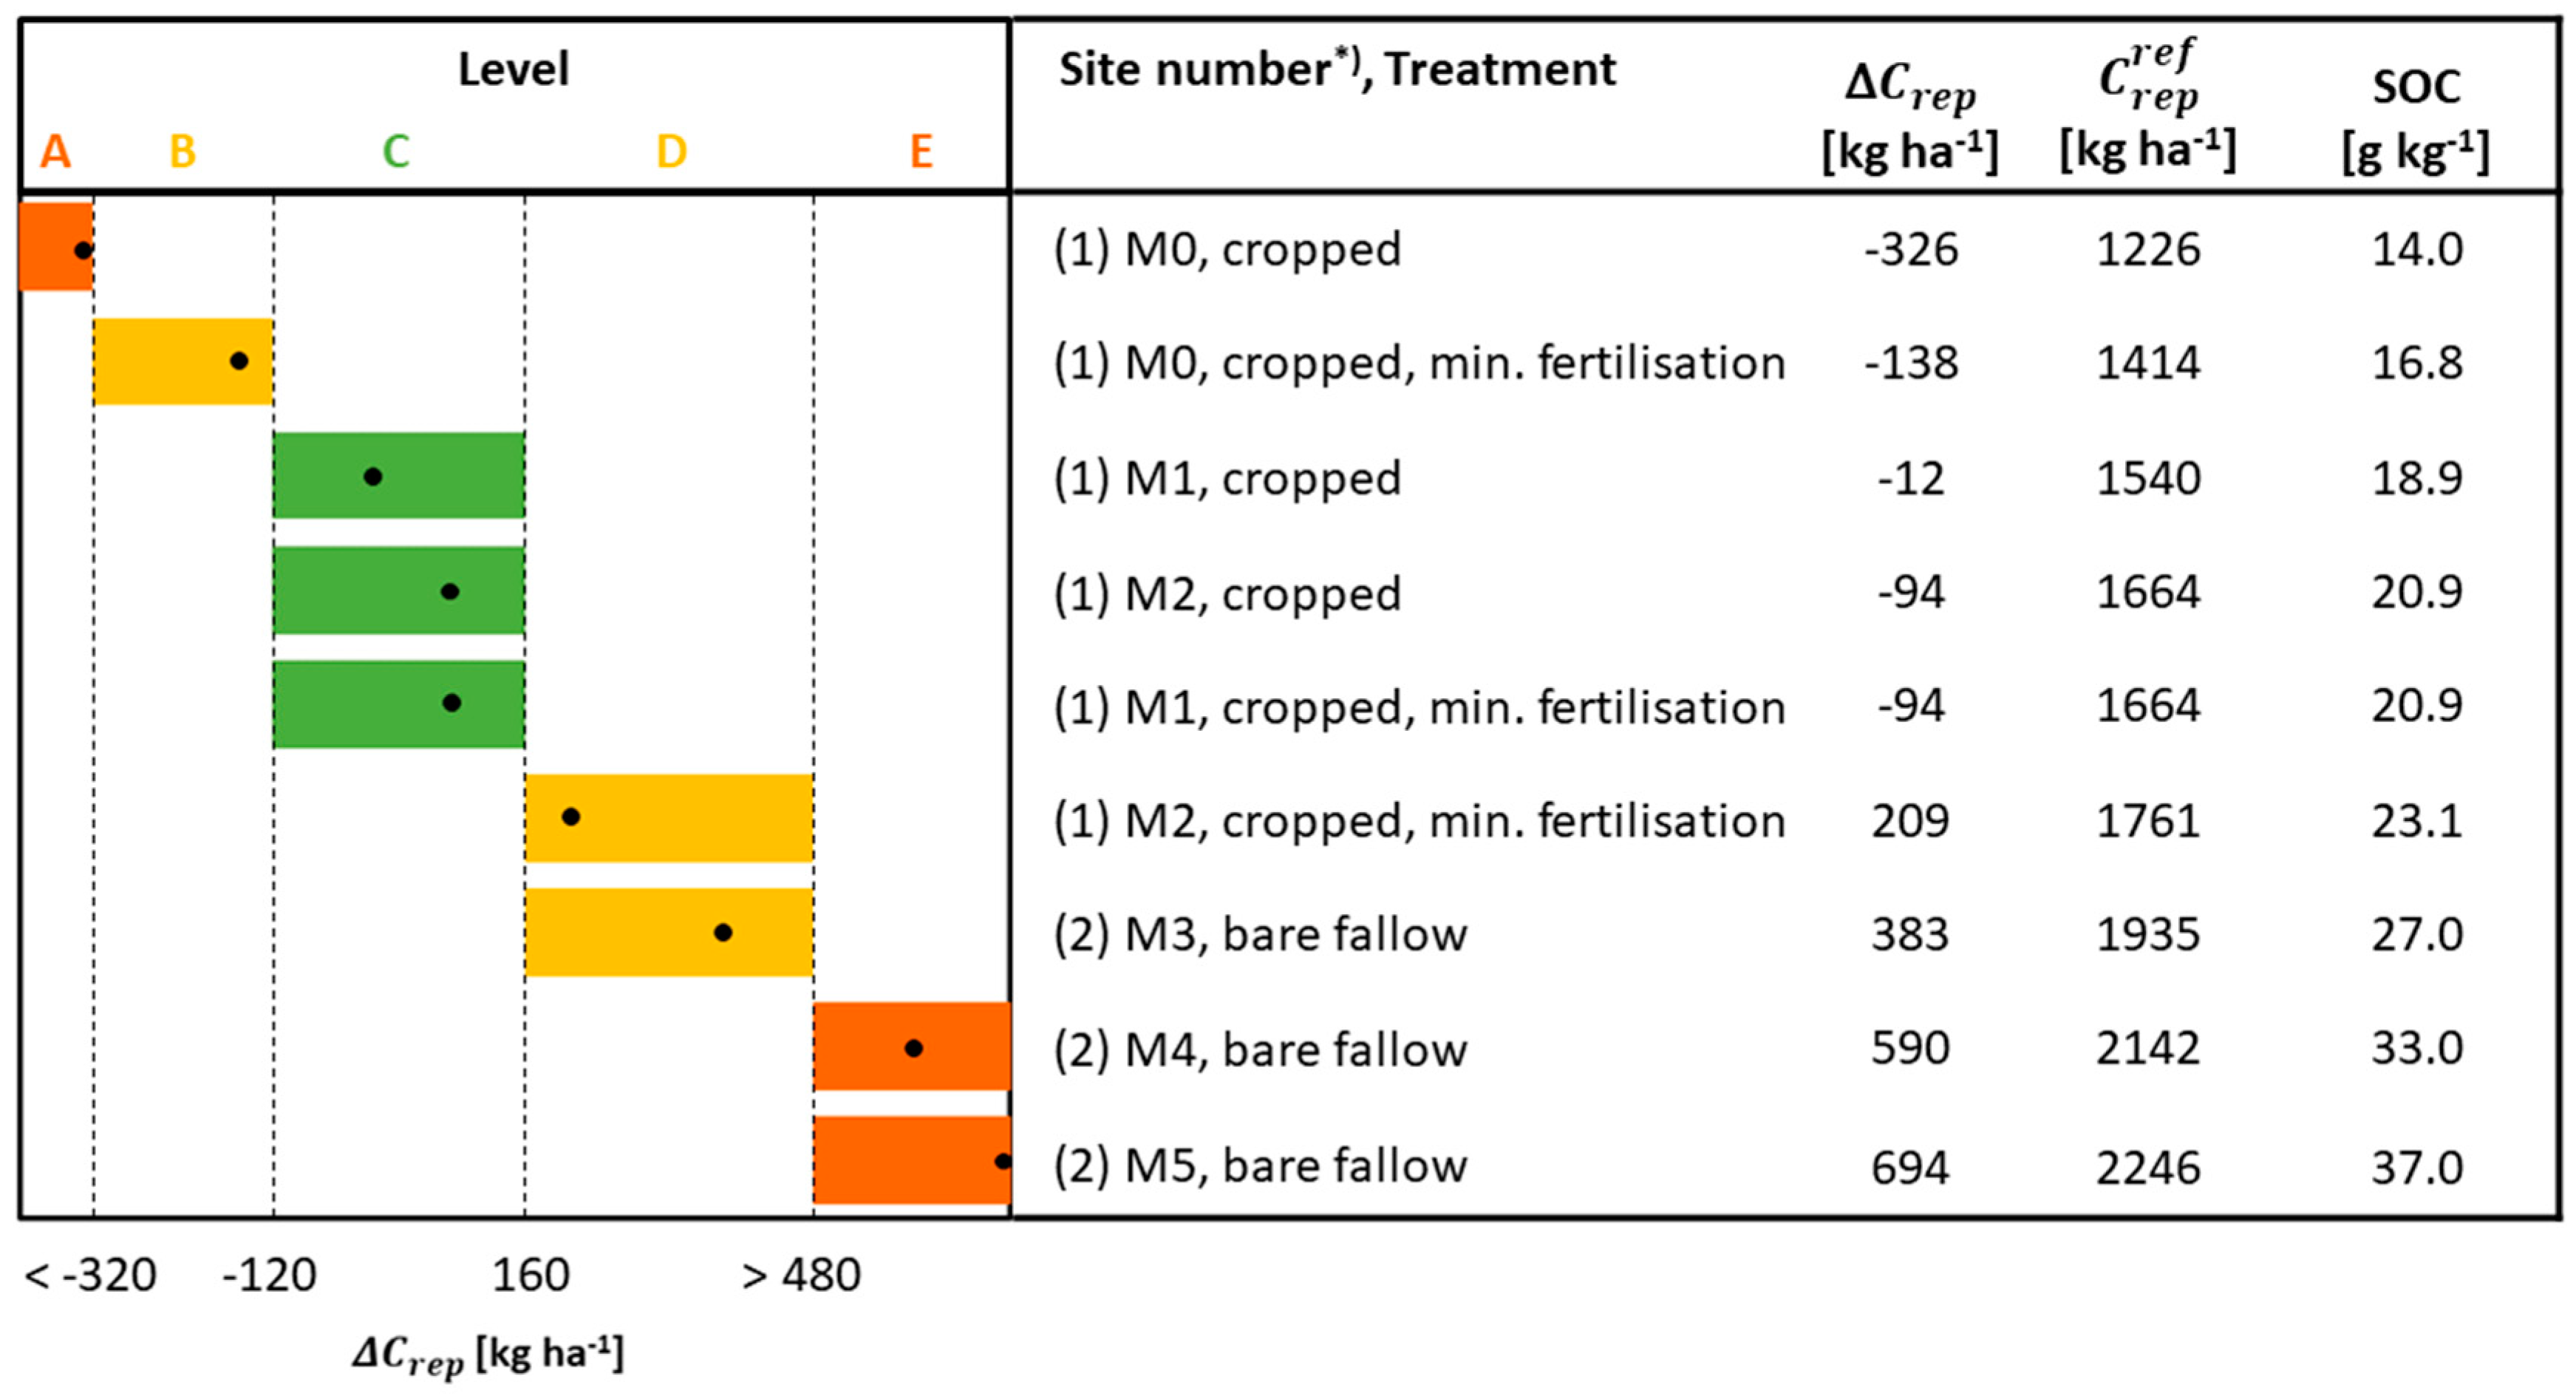
In a first step, we quantified as based on ten European LTFEs (Figure 2) and classified according to the VDLUFA method (Table 2). Here, we apply the described assessment methodology to nine different treatments of the Bad Lauchstädt LTFEs that are characterized by a wide range of FYM inputs (see Table 1). According to Equation (4), we find an optimal Crep flux of kg ha−1 for the current conditions with BAT = 28. The topsoil of the control treatment without any fertilizer input for more than 100 years (Figure 3: M0, cropped) has a SOC content that corresponds to Crep = 1226 kg ha−1, which is a difference of −326 kg ha−1 from the optimum value and thus lower than the upper limit of −320 kg ha−1 for class A, indicating that the SOM level of the unfertilized plot unsurprisingly has to be considered as “A: very low”. Similarly, we find results for the other treatments, as shown in Figure 3.
The treatment without organic amendments (M0), but with mineral fertilization was at level B (low). The organic amendments with 10 and 15 Mg ha−1 FYM (M1 and M2) led to a SOC stock on level C (normal). However, a combination of 15 Mg ha−1 FYM with mineral fertilization further increased SOC above the limit to level D (high). Unsurprisingly, all treatments with very high rates of FYM input (M3–M5) were far above level C. The 50 Mg ha−1 FYM application was still assessed as level D (high), but the highest FYM application rates with 100 (M4) and 200 (M5) Mg ha−1 FYM were clearly rated as level E (very high).
3.4. Humus Level of Arable Soils in Germany
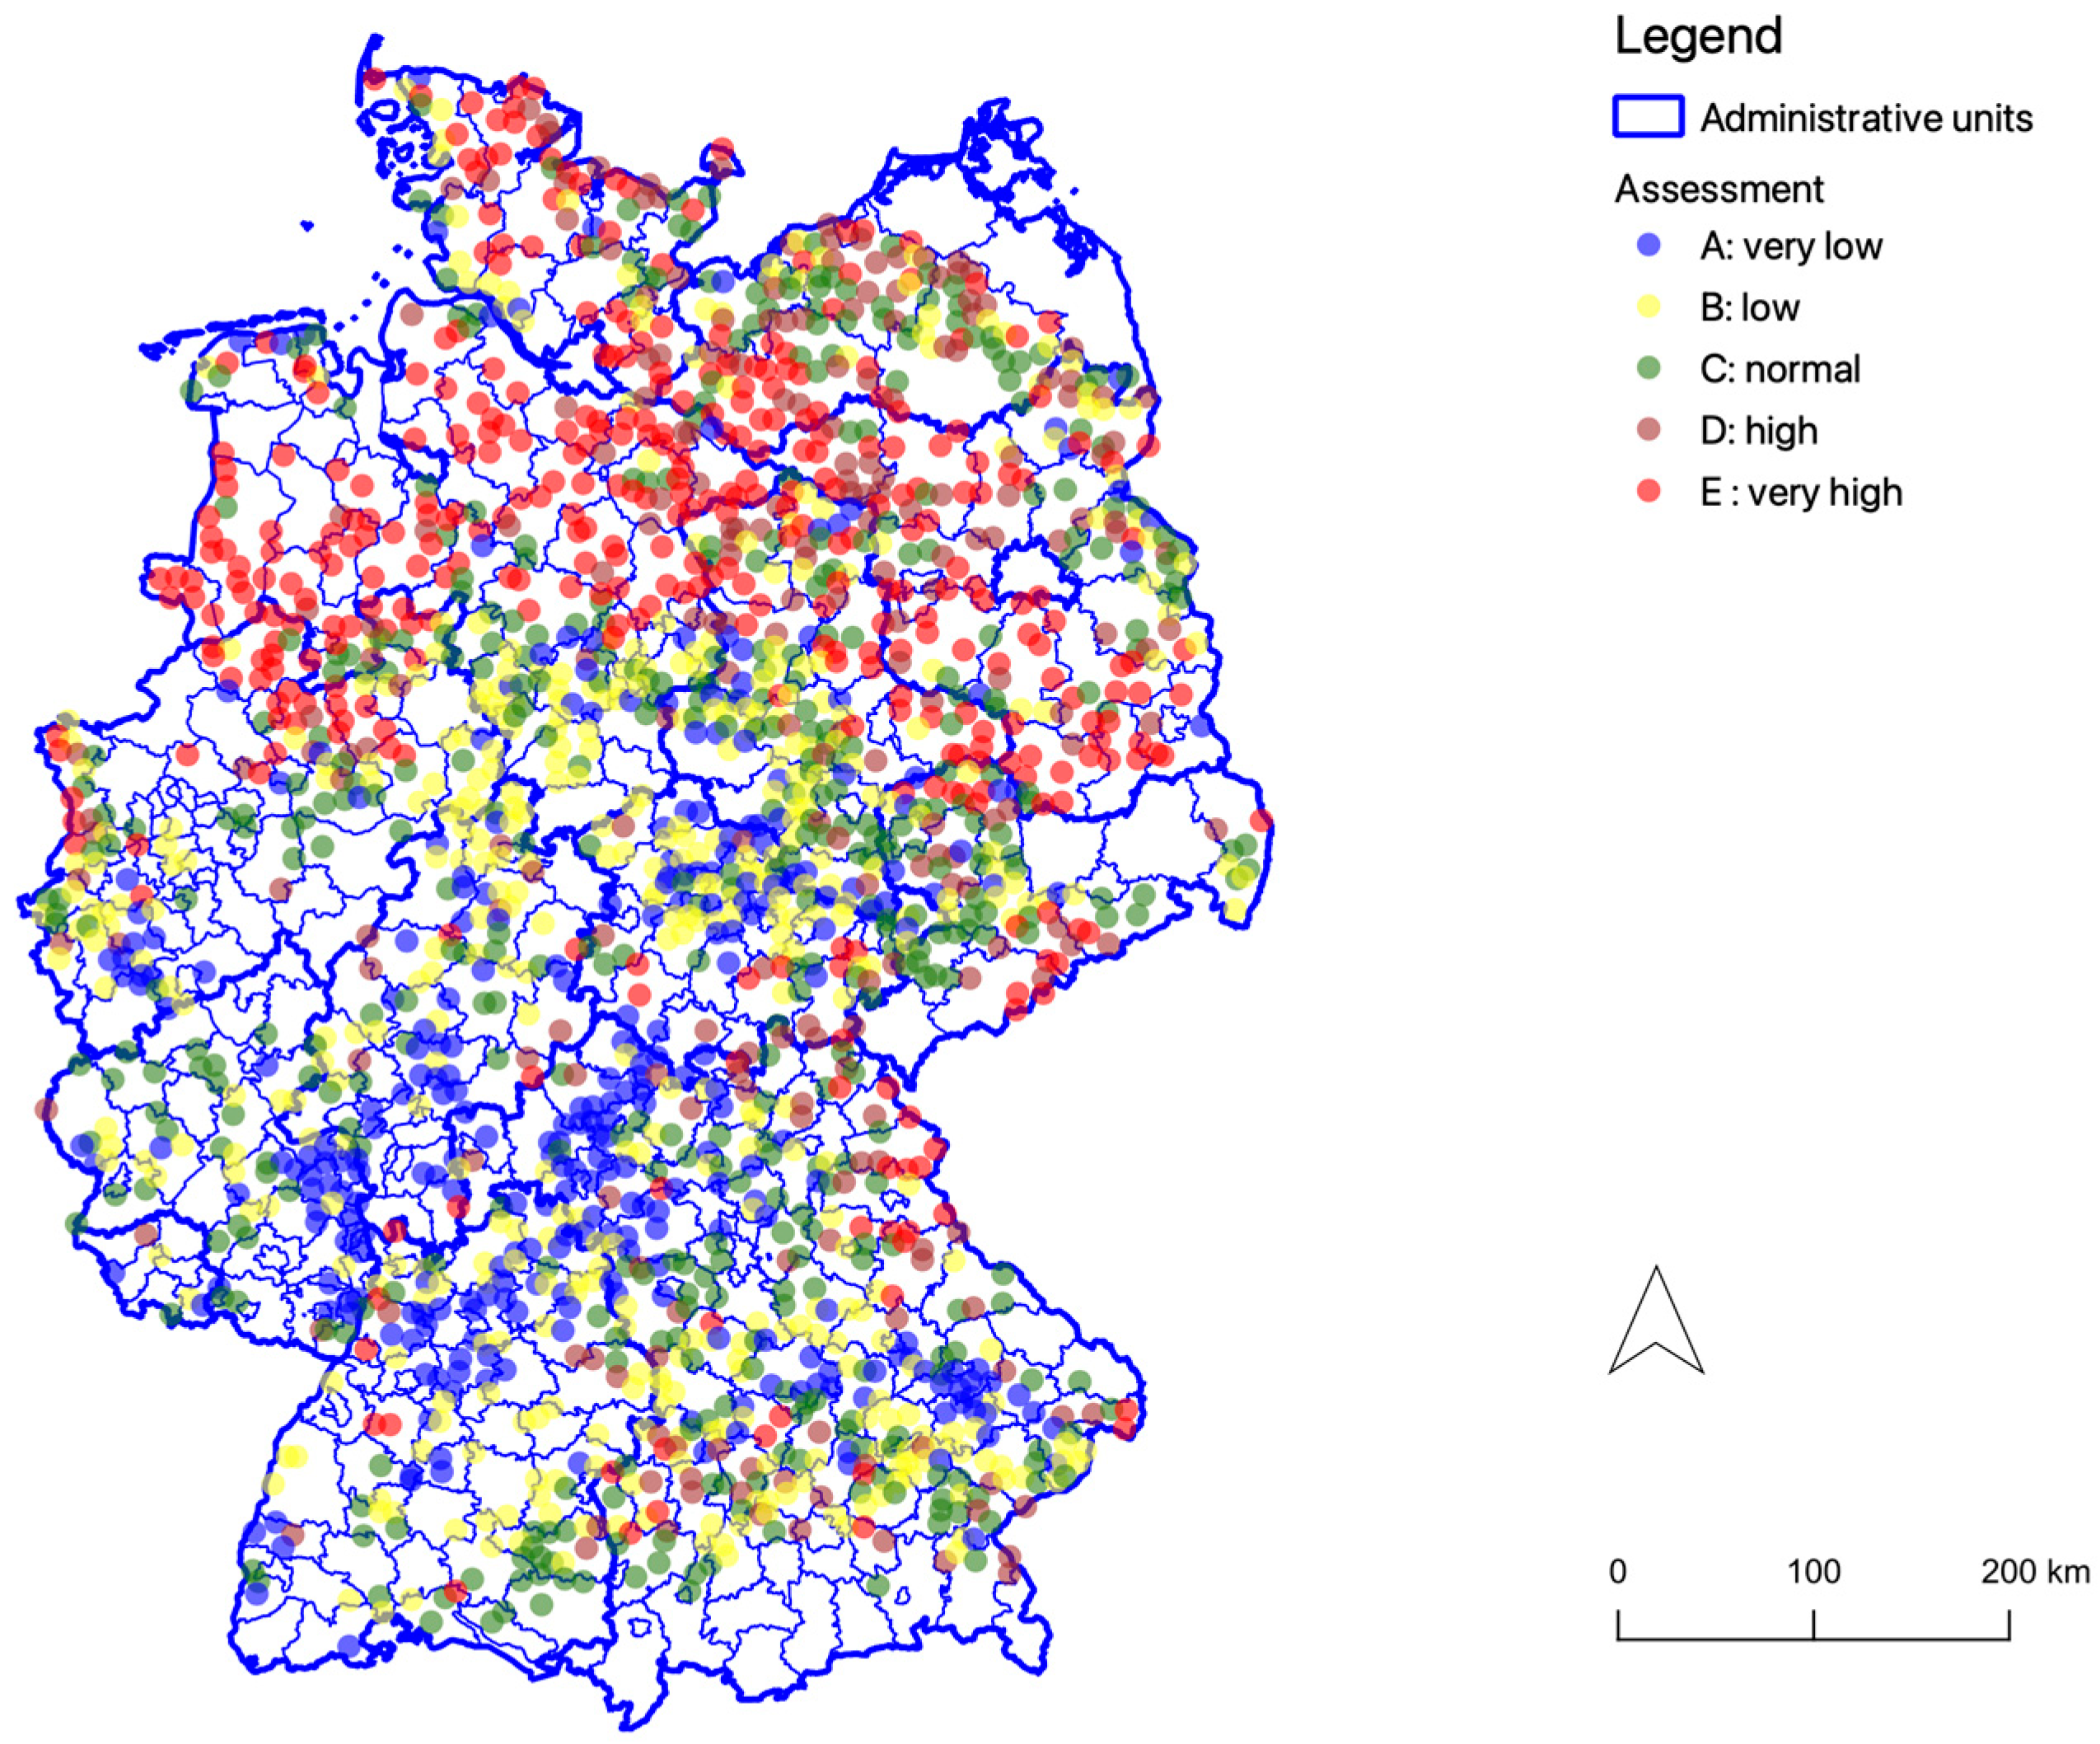
As already mentioned above, we transformed SOC values into the corresponding C flux values and converted HAQ units into Crep values. Applying the classification limits shown in Table 2 to the results of the first German soil inventory allows an assessment of the current SOC level of German soils (BZE). The resulting dataset is clearly dominated by soils with a normal or ‘optimal’ SOC level (Figure 4), but also shows considerable regional differences (Figure 5).
According to the classification scheme of the VDLUFA balance method, soils at levels A and B are expected to have potential for higher productivity under improved humus management. For soils at levels D and E, the applied organic amendments could be checked for alternative use, and soils at level E are especially suspicious for environmental problems caused by high carbon and nitrogen mineralization rates. This indicates, despite most sites being at level C (normal), that there is some room for improvements and a critical inspection of the current management, especially for the more than 450 sampling points at SOM level E (high), which are mainly located in the northern part of Germany (Figure 5). Soils at levels A and B that appear mainly in the southwestern region are good candidates for improved management to increase SOC stocks and thus contribute to climate change mitigation.
These results are based on the agronomic classification of the VDLUFA balance method and may include outliers because of the formal grid selection of BZE sampling points. Another framework to evaluate SOC stocks depending on soil and climatic properties is presented by Drexler et al. [5] and gives valuable information about the potential to change carbon storage in soil for specific site conditions, but does not consider agronomic requirements. Therefore, the combination of the methodology presented in this paper with the efforts to define quantitative targets for SOC stocks [32,33] may help to find needed solutions to increase carbon storage of arable soils, considering both agricultural and social/environmental needs [34].
Finally, we want to explicitly draw attention to the fact that our presented approach predicts the corresponding SOC stock as a steady state value for a given C flux. If this approach is applied inversely to find the C flux for a given SOC value, we must consider that this SOC value is assumed to represent steady state conditions. Especially under the conditions of practical agriculture, mainly after some management changes, and even for long-lasting LTFEs, as we have exemplarily shown for Bad Lauchstädt and Rothamstedt, this assumption is not strictly valid. However, if the real C flux from the actual management is calculated in addition to the C flux that relates to the SOC stock, more substantial assessments will be possible. Therefore, a profound evaluation of present SOC stocks in the context of social and environmental needs will also always require the assessment of C fluxes.
4. Conclusions
In their review paper, Wiesmeier et al. [35] concluded that an indicator for SOC assessment “needs to consider the two most important aspects of SOC storage which are the C input and C stabilization within the soil”. The methodology described above comes very close to this requirement, as Crep covers the flux of carbon that is used to build up new SOM and BAT is an integrator of the site-specific turnover conditions, indicating how fast SOC is decomposed and leaves SOM. The proposed relation between optimal carbon flux, climate (in terms of BAT), and soil texture has a statistical character, but is based on a selection of field experiments with soil and climate conditions that are representative of German sites.
In addition, to the known relation between the amount of added carbon and SOC accumulation, we showed that the usage of BAT as a time variable as well as the Crep input rate led to a more general explanation of SOC accumulation for different site conditions and FOM amounts, especially FYM amounts. This is the basis for transforming a given SOC content into the corresponding carbon flux value. The methodology used comes from the CCB model. In further research, it must be shown how much these results will change if alternative model approaches are applied.
The VDLUFA balance method uses HAQ units to express the results. Our approach is definitely a step in the direction of a more quantitative interpretation if these units can now be expressed in terms of Crep. This establishes a link to quantitative SOC modeling and allows the quantification of the balance elements from incubation experiments [36,37]. The application of this Crep-based scale to the dataset from Bad Lauchstädt is not a final validation, but provides reasonable results that open new prospects for a more sensible assessment of SOC stock together with soil management. These results should open new avenues to introduce components of mechanistic SOM turnover models in humus balance methods for improving SOM management in practice. Furthermore, we were able to demonstrate the practical application on a large dataset using the methodology for an assessment of the current humus state of arable soils according to the results of the first German Agricultural Soil Inventory (BZE-LW). Here, we provided the first reasonable results, but further work is required to validate our findings.
Author Contributions
Conceptualization, methodology, formal analysis, investigation, writing—original draft preparation, writing—review and editing, visualization: equally, U.F. and J.R. All authors have read and agreed to the published version of the manuscript.
Funding
This research received no external funding.
Institutional Review Board Statement
Not applicable.
Informed Consent Statement
Not applicable.
Data Availability Statement
The data presented in this study are openly available as listed in the References section.
Acknowledgments
We thank all people involved in the support of the long-term experiments in Bad Lauchstädt and the two anonymous reviewers for their helpful comments on a previous version of this paper.
Conflicts of Interest
The authors declare no conflict of interest.
References
- Vogel, H.J.; Eberhardt, E.; Franko, U.; Lang, B.; Ließ, M.; Weller, U.; Wiesmeier, M.; Wollschläger, U. Quantitative Evaluation of Soil Functions: Potential and State. Front. Environ. Sci. 2019, 7. [Google Scholar] [CrossRef]
- Poeplau, C.; Jacobs, A.; Don, A.; Vos, C.; Schneider, F.; Wittnebel, M.; Tiemeyer, B.; Heidkamp, A.; Prietz, R.; Flessa, H. Stocks of Organic Carbon in German Agricultural Soils—Key Results of the First Comprehensive Inventory. J. Plant Nutr. Soil Sci. 2020, 183, 665–681. [Google Scholar] [CrossRef]
- Poeplau, C.; Don, A.; Flessa, H. Erste Bodenzustandserhebung Landwirtschaft—Kerndatensatz; Johann Heinrich von Thünen-Institut: Braunschweig, Germany, 2020. [Google Scholar]
- Vos, C.; Don, A.; Hobley, E.U.; Prietz, R.; Heidkamp, A.; Freibauer, A. Factors Controlling the Variation in Organic Carbon Stocks in Agricultural Soils of Germany. Eur. J. Soil Sci. 2019, 70, 550–564. [Google Scholar] [CrossRef]
- Drexler, S.; Broll, G.; Flessa, H.; Don, A. Benchmarking Soil Organic Carbon to Support Agricultural Carbon Management: A German Case Study. J. Plant Nutr. Soil Sci. 2022. [Google Scholar] [CrossRef]
- Jacobs, A.; Flessa, H.; Don, A. Landwirtschaftlich genutzte Böden in Deutschland—Ergebnisse der Bodenzustandserhebung; Johann Heinrich von Thünen-Institut: Braunschweig, Germany, 2018. [Google Scholar]
- Vos, C.; Jaconi, A.; Jacobs, A.; Don, A. Hot Regions of Labile and Stable Soil Organic Carbon in Germany—Spatial Variability and Driving Factors. SOIL 2018, 4, 153–167. [Google Scholar] [CrossRef] [Green Version]
- VDLUFA Humusbilanzierung. Eine Methode Zur Analyse Und Bewertung Der Humusversorgung von Ackerland; VDLUFA-Standpunkt; VDLUFA Selbstverlag: Speyer, Germany, 2014. [Google Scholar]
- Brock, C.; Oberholzer, H.-R.; Franko, U. Soil Organic Matter Balance as a Practical Tool for Environmental Impact Assessment and Management Support in Arable Farming. Eur. J. Soil Sci. 2017, 68, 951–952. [Google Scholar] [CrossRef] [Green Version]
- Körschens, M.; Albert, E.; Baumecker, M.; Ellmer, F.; Grunert, M.; Hoffmann, S.; Kismanyoky, T.; Kubat, J.; Kunzova, E.; Marx, M.; et al. Humus and Climate Change—Results of 15 Long-Term Experiments. Arch. Agron. Soil Sci. 2014, 60, 1485–1517. [Google Scholar] [CrossRef]
- Musinguzi, P.; Ebanyat, P.; Tenywa, J.S.; Basamba, T.A.; Tenywa, M.M.; Mubiru, D.N. Critical Soil Organic Carbon Range for Optimal Crop Response to Mineral Fertiliser Nitrogen on A Ferralsol. Exp. Agric. 2016, 52, 635–653. [Google Scholar] [CrossRef]
- Patrick, M.; Tenywa, J.S.; Ebanyat, P.; Tenywa, M.M.; Mubiru, D.N.; Basamba, T.A.; Leip, A. Soil Organic Carbon Thresholds and Nitrogen Management in Tropical Agroecosystems: Concepts and Prospects. J. Sustain. Dev. 2013, 6, 31. [Google Scholar] [CrossRef]
- Riggers, C.; Poeplau, C.; Don, A.; Bamminger, C.; Höper, H.; Dechow, R. Multi-Model Ensemble Improved the Prediction of Trends in Soil Organic Carbon Stocks in German Croplands. Geoderma 2019, 345, 17–30. [Google Scholar] [CrossRef]
- Franko, U.; Diel, J.; Ruehlmann, J. Applying CCB to Predict Management Change Affected Long-term SOM Turnover of the E Xtended S Tatic F Ertilization E Xperiment in Bad Lauchstädt. Eur. J. Soil Sci. 2021. [Google Scholar] [CrossRef]
- Rothamsted Research Hoosfield Soil Organic Carbon Content. 2012. Available online: http://www.era.rothamsted.ac.uk/dataset/rhb2/01-HBSOC1852 (accessed on 3 January 2022).
- Ruehlmann, J.; Körschens, M. Calculating the Effect of Soil Organic Matter Concentration on Soil Bulk Density. Soil Sci. Soc. Am. J. 2009, 73, 876–885. [Google Scholar] [CrossRef]
- Altermann, M.; Rinklebe, J.; Merbach, I.; Körschens, M.; Langer, U.; Hofmann, B. Chernozem—Soil of the Year 2005. J. Plant Nutr. Soil Sci. 2005, 168, 725–740. [Google Scholar] [CrossRef]
- Körschens, M. (Ed.) Der Statische Düngungsversuch Bad Lauchstädt nach 90 Jahren: Einfluß der Düngung auf Boden, Pflanze und Umwelt; mit einem Verzeichnis von 240 Dauerfeldversuchen der Welt; Teubner: Stuttgart, Germany; Leipzig, Germany, 1994; ISBN 978-3-8154-3507-6. [Google Scholar]
- Körschens, M. Erträge, N-entzüge Und Humusdynamik Im Statischen Düngungsversuch Bad Lauchstädt, 18 Jahre Nach Erweiterung Der Versuchsfrage. Arch. Agron. Soil Sci. 1998, 43, 77–92. [Google Scholar] [CrossRef]
- Merbacha, I.; Körschens, M. The Static Fertilization Experiment at the Start and the End of the 20th Century. Arch. Agron. Soil Sci. 2002, 48, 413–422. [Google Scholar] [CrossRef]
- Merbach, I.; Schulz, E. Long-Term Fertilization Effects on Crop Yields, Soil Fertility and Sustainability in the Static Fertilization Experiment Bad Lauchstädt under Climatic Conditions 2001–2010. Arch. Agron. Soil Sci. 2013, 59, 1041–1057. [Google Scholar] [CrossRef]
- Franko, U.; Schulz, E. Carbon Accumulation in a Bare Fallow Chernozem Soil with High Carbon Input Rates. Eur. J. Soil Sci. 2021, 72, 265–273. [Google Scholar] [CrossRef] [Green Version]
- Beuke, K. Überprüfung der Humusbilanzierung anhand von Dauerversuchen in verschiedenen Klimaregionen Europas; Diplomarbeit, Universität Trier: Morenhoven, Germany, 2006. [Google Scholar]
- Rühlmann, J. Dauerfeldversuche in Brandenburg Und Berlin: Beiträge Für Eine Nachhaltige Landwirt-Schaftliche Bodennutzung; Schriftenreihe des Landesamtes für Verbraucherschutz, Landwirtschaft und Flurneuordnung, Reihe Landwirtschaft; Ministerium für Ländliche Entwicklung, Umwelt und Verbraucherschutz des Landes Bran-denburg (MLUV) (Hrsg.): Berlin, Germany, 2009; Volume 10. [Google Scholar]
- Spiegel, H.; Dersch, G.; Baumgarten, A.; Hösch, J. The International Organic Nitrogen Long-Term Fertilisation Experiment (IOSDV) at Vienna after 21 Years. Arch. Agron. Soil Sci. 2010, 56, 405–420. [Google Scholar] [CrossRef]
- Hénin, S.; Dupuis, N. Essai de Bilan de La Matière Organique Du Sol. Ann. Agron. 1945, 15, 17–29. [Google Scholar]
- Franko, U.; Oelschlägel, B.; Schenk, S. Simulation of Temperature-, Water- and Nitrogen Dynamics Using the Model CANDY. Ecol. Model. 1995, 81, 213–222. [Google Scholar] [CrossRef]
- Franko, U.; Oelschlägel, B. Einfluss von Klima Und Textur Auf Die Biologische Aktivität Beim Umsatz Der Organischen Bodensubstanz. Arch. Agron. Soil Sci. 1995, 39, 155–163. [Google Scholar] [CrossRef]
- Franko, U.; Kolbe, H.; Thiel, E.; Ließ, E. Multi-Site Validation of a Soil Organic Matter Model for Arable Fields Based on Generally Available Input Data. Geoderma 2011, 166, 119–134. [Google Scholar] [CrossRef]
- Franko, U.; Merbach, I. Modelling Soil Organic Matter Dynamics on a Bare Fallow Chernozem Soil in Central Germany. Geoderma 2017, 303, 93–98. [Google Scholar] [CrossRef]
- Brock, C.; Franko, U.; Oberholzer, H.; Kuka, K.; Leithold, G.; Kolbe, H.; Reinhold, J. Humus Balancing in Central Europe—Concepts, State of the Art, and Further Challenges. J. Plant Nutr. Soil Sci. 2013, 176, 3–11. [Google Scholar] [CrossRef]
- Bruni, E.; Guenet, B.; Huang, Y.; Clivot, H.; Virto, I.; Farina, R.; Kätterer, T.; Ciais, P.; Martin, M.; Chenu, C. Additional Carbon Inputs to Reach a 4 per 1000 Objective in Europe: Feasibility and Projected Impacts of Climate Change Based on Century Simulations of Long-Term Arable Experiments. Biogeosciences 2021, 18, 3981–4004. [Google Scholar] [CrossRef]
- Bruni, E.; Guenet, B.; Clivot, H.; Kätterer, T.; Martin, M.; Virto, I.; Chenu, C. Defining Quantitative Targets for Topsoil Organic Carbon Stock Increase in European Croplands: Case Studies with Exogenous Organic Matter Inputs. Front. Environ. Sci. 2022, 10. [Google Scholar] [CrossRef]
- Tiefenbacher, A.; Sandén, T.; Haslmayr, H.-P.; Miloczki, J.; Wenzel, W.; Spiegel, H. Optimizing Carbon Sequestration in Croplands: A Synthesis. Agronomy 2021, 11, 882. [Google Scholar] [CrossRef]
- Wiesmeier, M.; Hübner, R.; Dechow, R.; Maier, H.; Spörlein, P.; Geuß, U.; Hangen, E.; Reischl, A.; Schilling, B.; von Lützow, M.; et al. Estimation of past and recent carbon input by crops into agricultural soils of southeast Germany. Eur. J. Agron. 2014, 61, 10–23. [Google Scholar] [CrossRef]
- Gasser, A.A.; Diel, J.; Nielsen, K.; Mewes, P.; Engels, C.; Franko, U. A model ensemble approach to determine the humus building efficiency of organic amendments in incubation experiments. Soil Use Manag. 2021, 38, 179–190. [Google Scholar] [CrossRef]
- Gasser, S.A.A.; Nielsen, K.; Franko, U. Transfer of carbon incubation parameters to model the SOC and SON dynamics of a field trial with energy crops applying digestates as organic fertilizers. Soil Use Manag. 2022. [Google Scholar] [CrossRef]
Figure 1.
Time course of SOC stock differences between treatments with and without FYM application at three different LTFEs: (a) with a conventional timeline in years and (b) a BAT–based timeline.
Figure 1.
Time course of SOC stock differences between treatments with and without FYM application at three different LTFEs: (a) with a conventional timeline in years and (b) a BAT–based timeline.

Figure 2.
Relation between the optimal C flux and turnover activity characterized by BAT (see Section 2.3), and soil texture represented by the sum of clay and silt. Dots and their labels relate to the site numbers and the corresponding optimal SOC values as shown in Table 1. The surface plot represents Equation (4).

Figure 3.
Assessment of selected treatments of LTFEs at Bad Lauchstädt (*) (site number as given in Table 1). BAT = 28 d year−1. Levels A–E relate to the VDLUFA classification as shown in Table 2. Colored bars symbolize the class range and dots represent the actual values of the treatment.

Figure 4.
Frequency distribution of humus levels in Germany according to the VDLUFA balance method based on the actual observed SOC. Classes are A: very low, B. low, C: normal, D: high, and E: very high.
Figure 4.
Frequency distribution of humus levels in Germany according to the VDLUFA balance method based on the actual observed SOC. Classes are A: very low, B. low, C: normal, D: high, and E: very high.

Figure 5.
Geographic distribution of humus levels in Germany for the actual observed SOC according to the VDLUFA balance method. Dots represent BZE sampling points. Assessment classes are according to the VDLUFA method as shown in Table 2.
Figure 5.
Geographic distribution of humus levels in Germany for the actual observed SOC according to the VDLUFA balance method. Dots represent BZE sampling points. Assessment classes are according to the VDLUFA method as shown in Table 2.

Table 2.
VDLUFA classification and corresponding ranges of HEQ and Crep (Crep = 1.6 × HEQ).
| VDLUFA Classification | HEQ Balance | C Flux Difference |
|---|---|---|
| A: very low | <−200 | <−320 |
| B: low | −200–−75 | −320–−120 |
| C: normal | −75–100 | −120–160 |
| D: high | 100–300 | 160–480 |
| E: very high | >300 | >480 |
Publisher’s Note: MDPI stays neutral with regard to jurisdictional claims in published maps and institutional affiliations. |
© 2022 by the authors. Licensee MDPI, Basel, Switzerland. This article is an open access article distributed under the terms and conditions of the Creative Commons Attribution (CC BY) license (https://creativecommons.org/licenses/by/4.0/).
Share and Cite
MDPI and ACS Style
Franko, U.; Ruehlmann, J. Novel Methodology for the Assessment of Organic Carbon Stocks in German Arable Soils. Agronomy 2022, 12, 1231. https://0-doi-org.brum.beds.ac.uk/10.3390/agronomy12051231
AMA Style
Franko U, Ruehlmann J. Novel Methodology for the Assessment of Organic Carbon Stocks in German Arable Soils. Agronomy. 2022; 12(5):1231. https://0-doi-org.brum.beds.ac.uk/10.3390/agronomy12051231
Chicago/Turabian StyleFranko, Uwe, and Joerg Ruehlmann. 2022. "Novel Methodology for the Assessment of Organic Carbon Stocks in German Arable Soils" Agronomy 12, no. 5: 1231. https://0-doi-org.brum.beds.ac.uk/10.3390/agronomy12051231
Note that from the first issue of 2016, this journal uses article numbers instead of page numbers. See further details here.