
Cover Crops Enhance Soil Properties in Arid Agroecosystem despite Limited Irrigation


1
Entomology, Plant Pathology and Weed Science Department, New Mexico State University, Las Cruces, NM 88003, USA
2
School of Plant and Environmental Sciences, Virginia Polytechnic Institute and State University, Blacksburg, VA 24060, USA
3
Department of Applied Statistics, New Mexico State University, Las Cruces, NM 88003, USA
4
Plant and Environmental Sciences Department, New Mexico State University, Las Cruces, NM 88003, USA
*
Author to whom correspondence should be addressed.
Agronomy 2022, 12(5), 1235; https://0-doi-org.brum.beds.ac.uk/10.3390/agronomy12051235
Submission received: 18 April 2022
/
Revised: 14 May 2022
/
Accepted: 20 May 2022
/
Published: 22 May 2022
(This article belongs to the Section Soil and Plant Nutrition)
Abstract
:Cover crops (CCs) can enhance the sustainability and resiliency of agroecosystems by providing multiple ecosystem benefits, including soil quality improvement. However, in areas with limited precipitation such as the southwestern USA, cover cropping is challenging. With limited water, it may be difficult to raise cover crops for realizing ecosystem benefits. Research was conducted at two sites in New Mexico over two years to determine if CC under limited irrigation could produce enough biomass to improve soil quality. Treatments included a fallow (control) and monocultures of barley (Hordeum vulgare), Austrian winter peas (Pisum sativum subsp. arvense), mustard (Brassica rapa, var. Caliente 199), and a three-way mixture of these species, grown under three different irrigation regimes. The results indicate that the improvement in soil quality measurements by CCs grown under one supplemental irrigation were comparable to those grown under multiple irrigations. All CC treatments improved the soil dry aggregate size distribution from 2018 to 2020. At the end of the study, the MWD of dry aggregates was higher (3.26 mm) in all CC treatments than in the fallows (2.43 mm) at one site, but at the second site, mustard and mix were comparable to the fallows. Wet aggregate stability increased by 19% in the mix between 2018 and 2020 at one site. Pea plots needed about 23 kg ha−1 less N fertilizer for sweet corn production compared to the fallow treatment at one site. This suggests that CCs can be successfully grown under limited water availability in irrigated arid systems of New Mexico while still improving the soil quality.
1. Introduction
Cover crops enhance soil quality and productivity by improving biological, chemical, and physical properties including organic carbon content [1], aggregate stability, water infiltrability [2], moisture conservation, and nutrient cycling [3]. Hermawan and Bomke [4] found that aggregate stability was significantly higher in winter cover crop plots than in fallow after spring tillage. Similarly, Steele et al. [5] found that CCs increased water-stable aggregates, compared to fallow, by 35% and 41% in year one and year two, respectively. These studies suggest that CCs improve soil aggregation by increasing the mean weight diameter (MWD) of the soil particles rendering them less prone to wind erosion, especially in semi-arid regions characterized by prevalent high winds and low precipitation. In an erosion study, Kheirabadi et al. [6] demonstrated that soils with coarser aggregates exhibit lower wind erodibility than those with finer aggregates. Along with offering greater soil aggregation, some CC plant roots such as Brassica spp. also act as tillage tools [7] with deep penetrating tap roots drilling through compacted soil layers. This creates low-resistance pathways for the roots of the succeeding crops [8] Such “bio-drilling” is especially effective in no-till or reduced tillage cropping systems where compacted soils restrict crop root growth, rendering them unable to access water and nutrients from deeper subsoil layers [9].
Cover crops are also valued for their ability to scavenge and recycle nutrients, specifically N. Cover crops conserve N by storing scavenged NO3–N in their tissues as organic N. It has been demonstrated that cover crops can commonly reduce both the mass of N leached and the NO3–N concentration in the leachate by 20% to 80% [10]. However, synchronization between N release from the decomposing cover crop residue and uptake by the following cash crop is of great importance to maximize production efficiency. Otherwise, it might lead to a high post-harvest NO3–N concentration in the soil and potential losses through leaching [2] Cover crop species have a large impact on leaching, with rye (Secale cereale L.), forage radish (Raphanus sativus L.), and canola (Brassica rapa L.) having greater potential to scavenge residual soil NO3–N than legume cover crops [2] While grasses and some broadleaf CCs can sequester N, which upon decomposition will subsequently be available to the crops grown in the following season, legumes can fix atmospheric nitrogen. Legume crops can fix from 112 to 225 kg N ha−1, which, after termination, is available for spring-planted crops [11].
The use of CCs has also been found to enhance the sequestration of soil organic carbon (SOC). Cover crops not only contribute to the restoration of SOC but also help reduce the net removal of SOC by soil erosion. After a 12-year cover crop study, Olson et al. [12] found that the cover crop treatments had more SOC than those without cover crops for the same soil layer and tillage treatment. On average, SOC increased by 19.3% in the CC treatments compared to 3.5% in the non-cover crop treatments. Accumulation of high levels of organic carbon can eventually lead to improvement in soil organic matter (SOM), which is an important indicator of soil quality. According to Blanco-Canqui et al. [13] an increase in SOC can also help reduce soil compaction and bulk density.
The benefits of CCs to soil are especially needed in semi-arid regions, where precipitation is scarce and soil water availability is a major concern. Qi et al. [14] demonstrated that a cereal rye cover crop increased soil water storage when added to a maize-soybean cropping system. Nonetheless, the amount of water required to produce a cover crop stand of optimum biomass is a great concern in arid and semiarid regions. Survey data (SARE-CTIC, 2013, 2014) and leading practitioners [15] indicate that the adoption of CCs has been questioned by the producers in arid and semi-arid regions due to the limited precipitation input, especially in dryland farming systems. New Mexico, with a typical arid-semiarid climate, is characterized by pan-evaporation (142–279cm) that far exceeds annual precipitation ranging from 25cm in the southern desert to 51cm at higher elevations (source: Western Regional Climate Center).
There have been studies evaluating the water requirement of CCs in the Great Plains of the United States, both under dryland and irrigated agricultural systems [16] but limited information is available for irrigated agroecosystems in the southwestern United States. Agricultural systems in southern New Mexico rely heavily on groundwater from regional aquifers along the Rio Grande Basin for irrigation, especially during the winter months. Extensive pumping of groundwater has led to concerns regarding the sustainability of agricultural systems in the semiarid and arid regions of New Mexico [17]. The objective of our study was to obtain information on supplemental irrigation required to raise cover crops and the resultant effect of CCs produced under varying amounts of water on soil properties including dry aggregate size distribution, soil aggregate stability, biologically reactive carbon, SOM, nitrogen fertilizer requirement in subsequent cash crop; sweet corn (Zea mays L.), and sweet corn yield. Specifically, we hypothesized (1) additional irrigation water would produce more CC biomass; (2) soil aggregation indices would improve over time in cover crop plots; and (3) there would be a positive trend between CC biomass and soil properties such as aggregate stability and SOM.
2. Materials and Methods
2.1. Site Descriptions
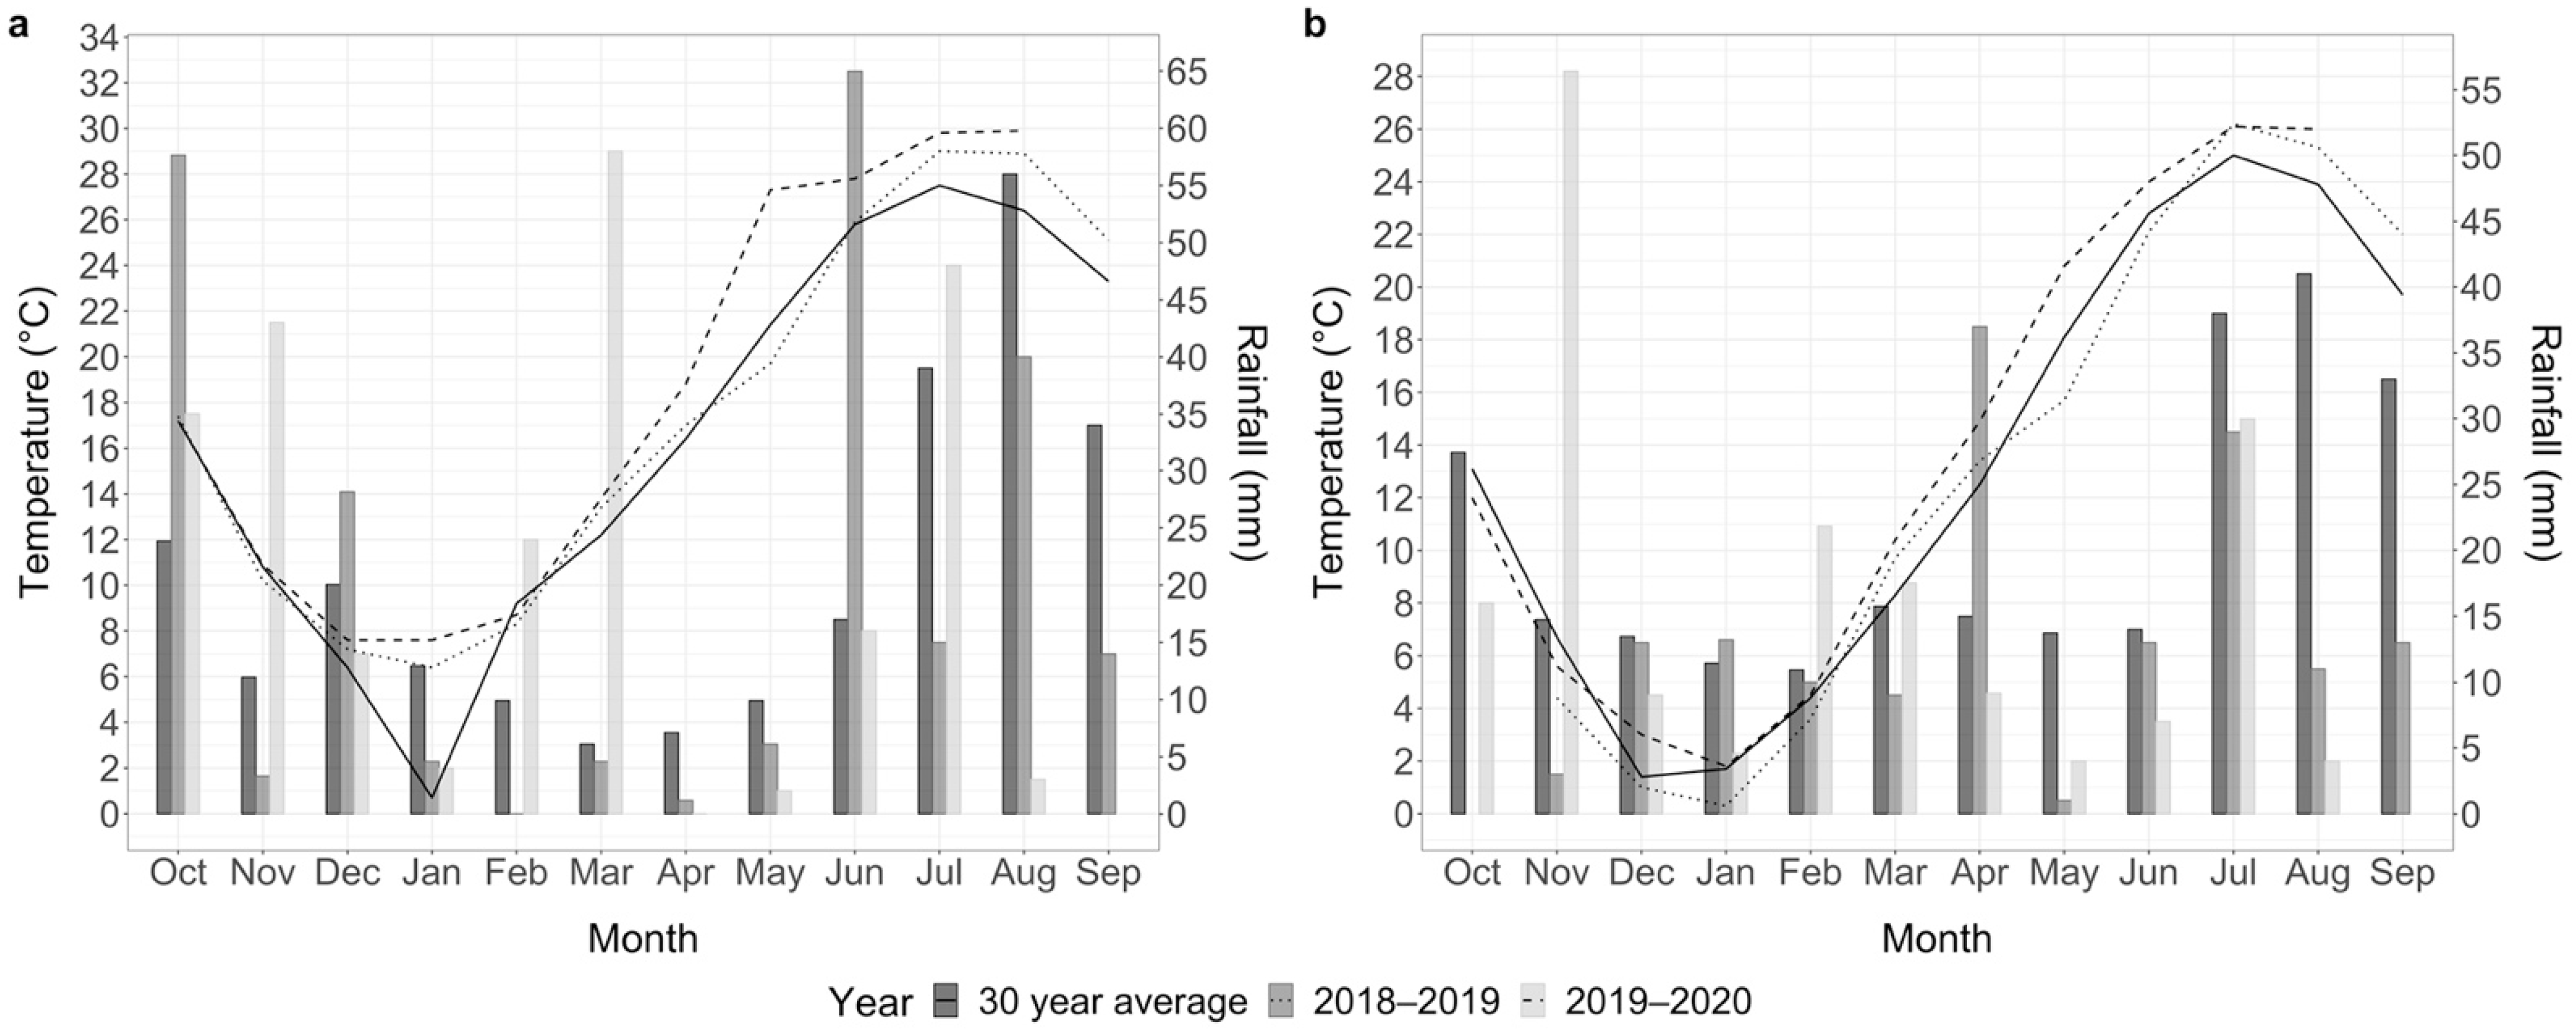
A two-year field trial (2018–2019 and 2019–2020) was conducted at two research locations in New Mexico: Los Lunas Agricultural Science Center (Los Lunas, 34.76752°, −106.75455°) in central New Mexico, and Leyendecker Plant Science Research Center (Leyendecker, 32.20299°, −106.74565°) in southern New Mexico. The average monthly air temperature and rainfall conditions for the two experiment sites during our study period are shown in Figure 1. The soil at Los Lunas is classified as Gila Loam (coarse-loamy) and Glendale Loam (fine-silty), mixed, superactive, calcareous, Thermic Typic Torrifluvents, while the soil at Leyendecker is classified as a clayey loam complex including Belen, Glendale, and Harkey clayey loam. The year before our research, Leyendecker was planted to oat (Avena sativa L.) and Los Lunas was planted to wheat (Triticum aestivum L.), both as forage crops.
2.2. Experimental Design
At each site, we used a split-plot design replicated four times. Irrigation treatment was the whole plot factor, with three levels of irrigation including approximately 7.6 cm of water applied one, two, or three times during the cover crop growing period (October-April). These were in addition to the initial irrigation for seedling establishment. Cover crop was the split plot factor with five treatment levels including three winter cover crop (CC) species, barley (Hordeum vulgare L.), Austrian winter pea (Pisum sativum), and mustard greens (Brassica juncea L., var. Caliente 199), a three-way mixture of these species, and a non-irrigated fallow plot. This gave a total of 60 plots at each site: 3 irrigation levels × 5 cover crops × 4 replications = 60 plots. Fallow treatments were not randomized within irrigation treatments because of the infeasibility of placing a dry plot within an irrigated area; rather fallow plots were systematically placed either before or after each irrigated whole plot. The plots, 3 m wide and 9 m in length, were established in the fall of 2018 and received the same treatments each year.
2.3. Cover Crop Management
Cover crops were seeded on 4 October 2018, and 3 October 2019, at Leyendecker and 30 October 2018, and 15 October 2019, at Los Lunas. Mustard, barley, pea, and mustard/barley/pea mix were seeded at rates of 13.5, 112, 90, and 5.3/33.6/90 kg ha−1 following recommendations for the arid Southwest [18]. At Leyendecker, barley and Austrian winter pea were drill-seeded at a depth of 4 cm using a John Deere 450 seed drill, while mustard greens were broadcast seeded. At Los Lunas, planting was carried out via a custom-built eight-row precision planter, fabricated in Los Lunas, NM, with all three cover crop species drill-seeded at a depth of 4 cm. No additional inputs such as herbicides or fertilizers were applied during CC growth. After the first irrigation for seed germination, irrigation was initiated based on visual observations such as cracks developing on the ground surface or by the feel method which involved digging up the soil to 3 inches deep to assess the extent of dryness. Before CC termination, biomass samples were collected as described in Agarwal et al. [19]. Cover crops were terminated in the spring with a flail mower. Termination dates were 10 May 2019, and 22 April 2020, at Leyendecker and 30 May 2019, and 6 May 2020, at Los Lunas, and were planned to maximize CC biomass, while minimizing the production of seeds from the cover crop and weeds. Because seeds matured at different times by species, we terminated via a flail mower when approximately 50% of the peas were flowering, since they were the earliest to go into the reproductive phase. Cover crops were then disked twice with an offset tandem disc to a depth of 15 cm and approximately 30% of the total residue was left on the surface following conservation tillage practices. The field was irrigated within one week of disking to facilitate the mineralization of the plant materials. The field was lightly disked 25 to 28 days after CC incorporation to eliminate pre-season weeds and Roundup Ready™ (Protector, Syngenta) sweet corn was planted as the cash crop. Sweet corn management and yield sampling are described in Agarwal et al. [19].
2.4. Soil Sampling
The first set of soil samples was collected in September 2018, before cover crop planting. Subsequent samples were taken 28 days after CC incorporation in year 1 (2019) and 25–28 days after CC incorporation in year 2 (2020). Soil samples of about 5 cm in diameter and 20 cm deep were collected using sharp-shooter shovels from three spots at 2, 4.5, and 7 m along the long axis of the plot and composited. From each plot, about 2 kg of soil was sampled, of which, approximately 450 g of soil was bagged into a quart-sized resealable plastic bag and shipped to Ward Laboratories Inc. (Kearney, NE, USA) for routine chemical analysis.
2.5. Soil Laboratory Analysis
Soil samples collected from the field plots were air-dried and analyzed for multiple soil measurements. Dry aggregate size distribution was measured on 500 g of soil using a Tyler RX-29 Ro-Tap sieve shaker (W.S. Tyler, Mentor, OH, USA). Six sieves were arranged in decreasing order of pore sizes ranging from 4 mm to 0.25 mm in diameter. The measurements assessed from the analysis were the mean weight diameter (MWD) of dry aggregates and aggregates greater than 2 mm (AGG > 2 mm) [20]. The dry aggregate size distribution is an indicator of soil susceptibility to wind erosion. The higher the MWD and AGG > 2 mm, the less erodible the soil to wind erosion [20].
The wet aggregate stability (WAS) was measured using a Cornell Rainfall Simulator [21], with 2–4 mm air-dried aggregates placed on a 2 mm sieve, and a simulated rainfall of 2.5 J applied for 300 s on the aggregates. The proportion of the soil aggregates left on the sieve after the simulated rainfall was regarded as water-stable aggregates.
Permanganate oxidizable carbon (POXC) was measured after the method developed by Weil et al. [22]. POXC is an indicator of the biologically reactive carbon (labile carbon) in the soil and was shown to be a sensitive soil health indicator to management changes in agroecosystems [23].
Soil chemical measurements assessed included the pH, soil organic matter (SOM), nitrate-nitrogen (NO3–N), potassium (K), and phosphorus (P). Nitrate-nitrogen was analyzed by the cadmium reduction procedure with a flow injection analyzer (FIA) while phosphorus was measured using Olsen’s extraction method [24], (USDA Handbook 60, p. 72 [25]). The pH was measured in a 1:1 soil to water ratio, potassium was measured in ammonium acetate extract [26], and the soil organic matter was measured using the Loss on Ignition method [27].
2.6. Statistical Analyses
Linear mixed-effects models, with irrigations nested within replicates as a random effect to account for the split-plot design and site as a fixed effect, were used to evaluate the effect of irrigation treatment on CC growth parameters. Assumptions of normality were assessed via quantile-quantile plots. Analyses were performed using the statistical computing software package R (version 4.0.2, R Core Team, 2020). The two sites were different from each other at α ≤ 0.05, and hence, were analyzed separately. Repeated measures analysis was carried out with plots as the subject to evaluate changes in soil properties in response to cover crop treatments over study years (2018–2020). A regression model was used to analyze the relationship between soil properties and the amount of biomass produced during the CC phase. When significance was detected (α ≤ 0.05), means separation was carried out using pairwise least-square means to report differences between treatments at p ≤ 0.05 with package lmerTest [28].
3. Results
3.1. Cover Crop Biomass
Irrigation treatments did not significantly affect the amount of cover crop biomass at either site. At Leyendecker in 2019, when averaged over irrigations, cover crop biomass did not differ between CC species treatment, with the average biomass being 4236 kg ha−1. Total biomass (CC biomass + weed biomass), while not different across irrigation treatments, varied between CC treatments. The highest total biomass at Leyendecker in 2019 was recorded for the three-way mix (5265 kg ha−1) followed by barley (5215 kg ha−1). In 2020 at Leyendecker, maximum CC biomass was produced by the three-way mix (7750 kg ha−1), which was comparable to that of peas (6445 kg ha−1). Total biomass in CC plots followed the same trend with the mix and pea plots having comparable biomass at 7750 kg ha−1 and 7260 kg ha−1, respectively.
At Los Lunas in 2019, barley produced the highest CC biomass (13,675 kg ha−1) while peas at 6235.5 kg ha−1, produced the least. Total biomass in the cover crop plots followed a similar trend with barley plots having the most biomass (14,692 kg ha−1). Total and cover crop biomass in 2020 at Los Lunas was generally lower than the biomass in 2019. In 2020, barley again produced the most biomass (2597 kg ha−1), which was comparable to that of the mix (2069.5 kg ha−1) while there was a steep decline in mustard biomass from 2019 (10,594 kg ha−1) to 2020 (287.9 kg ha−1).
3.2. Soil Physical Properties
3.2.1. Dry Aggregate Size Distribution
The percentage of AGG > 2 mm increased in all treatments (p < 0.0001), including the fallows, throughout the study at Leyendecker. Between 2018 and 2020, the AGG > 2 mm in the three-way-mix increased by 148%, while the pea, barley, mustard, and fallow treatments increased by 99%, 102%, 81%, and 43% respectively (Table 1). At the end of the study, all AGG > 2 mm of the CCs (mean of 61%) was higher than the fallow treatment (44%) at Leyendecker.
Similar to AGG > 2 mm, the MWD also increased in all CC treatments (p < 0.0001) with the MWD values doubling in the mix over the study years (2018–2020) while it only increased by 35% in the fallows. At the end of two years, fallows had the lowest values for MWD (mean 2.43 mm), compared to all other CC treatments (mean 3.26 mm) at Leyendecker (Figure 2a).
At Los Lunas, the percentage of AGG > 2 mm decreased initially from 2018 to 2019 in all CC treatments except for fallows. However, there was an overall increase of 24%, 17%, and 39% for barley, mix, and pea CCs respectively, when 2018 values were compared to 2020. The mustard treatment did not show any appreciable increase in AGG > 2 mm between the same time (Table 1).
The MWD, just like large aggregates, decreased from 2018 to 2019 at Los Lunas, but there was a net increase from 2018 to 2020 in all CC treatments except for mustard and fallow (Figure 2b). At 34%, peas had the highest increase in MWD over two years. Also, pea (2.00 mm) and barley (2.03 mm) had the highest MWD values at Los Lunas.
3.2.2. Wet Aggregate Stability
At both sites, the WAS generally increased from 2018 to 2019 but decreased slightly from 2019 to 2020 except in the mix and pea treatments at Leyendecker where there was a gradual increase across the years (Table 1). By the end of year 2 (2020) at Leyendecker, the mix at 69% and pea at 68% had significantly higher WAS values than the fallow treatment (60%). At Los Lunas, all CC treatments except for the mix showed significant improvement in WAS over the two trial years (Table 1).
3.3. Soil Chemical and Nutrient Properties
3.3.1. Permanganate Oxidizable Carbon
Permanganate oxidizable carbon (POXC), increased only in the mix by 10.3% from 2018 to 2020 at Leyendecker, while in mustard it increased from 2018 (418 mg kg−1) to 2019 (446.13 mg kg−1), but then decreased in 2020 (433.94 mg kg−1), resulting in no change over the study years. At Los Lunas, however, POXC increased in all CC treatments from 2018 to 2020, except for fallows, which showed an increase after the first year (2018–2019) but not at the end of the second year of cover cropping (2019–2020). There were no treatment differences at the end of the first and second years at both sites (Table 1).
3.3.2. Soil Organic Matter
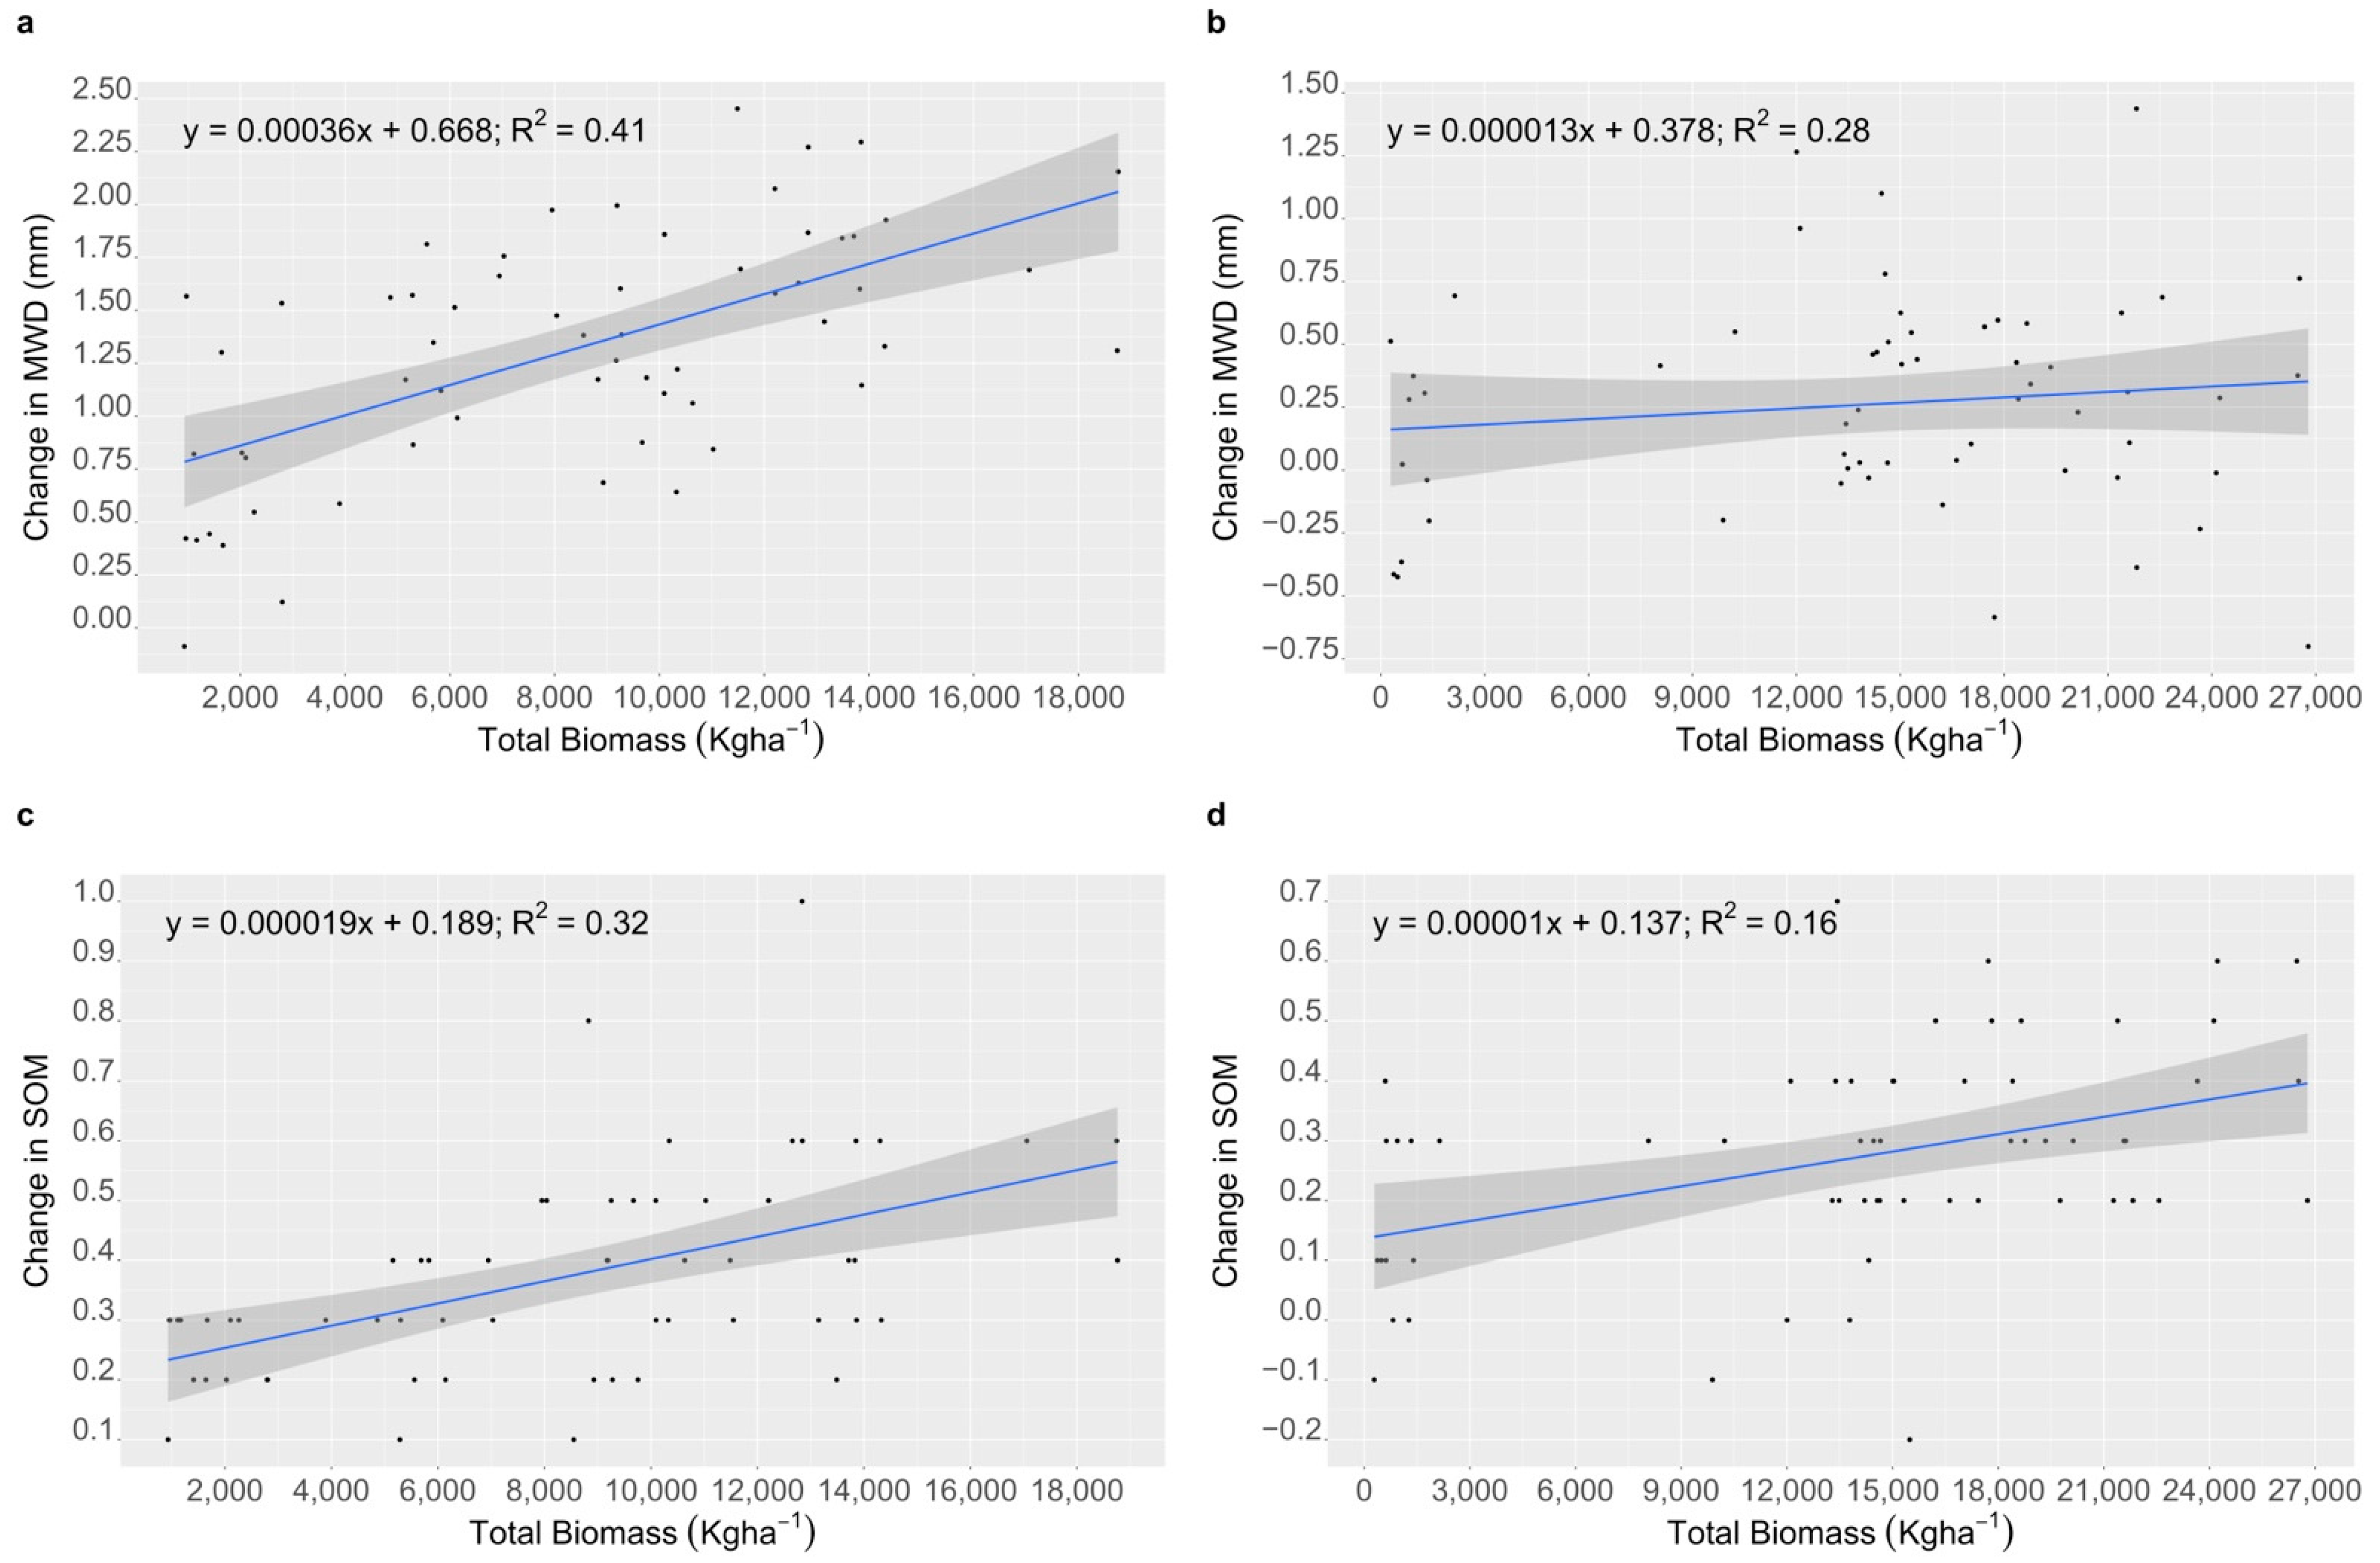
The SOM increased in all CC treatments including the fallows, after one year of cover cropping (2018–2019) at both sites (Table 1). No changes occurred between 2019 and 2020, except for fallows at Leyendecker, where the SOM decreased between 2019 (2.61%) and 2020 (2.46%). At the end of year 2 (2020), organic matter content was higher in all CC treatments (mean = 2.66%) except for barley (2.57%) over fallows (2.46%) at Leyendecker, while there were no treatment differences at Los Lunas (p = 0.304). Soil organic matter also increased linearly with an increase in the total amount of biomass produced during CC growing period at both Leyendecker (B = 0.000019, R2 = 0.32, p < 0.0001) (Figure 3c) and Los Lunas (B = 0.00001, R2 = 0.16, p = 0.0009) (Figure 3d).
3.3.3. Supplemental Nitrogen Fertilizer Added
Supplementary nitrogen fertilizer requirements for optimal sweet corn growth were calculated based on the soil test results, after the termination and incorporation of the cover crop biomass into the soil. Slight differences in nitrogen requirements between CCs existed in 2019 at Leyendecker. Barley and mustard required the most N at 256 kg N ha−1 and 258 kg N ha−1, respectively, while peas needed the least (223 kg N ha−1). In 2020, following barley and mustard, 257 kg N ha−1 and 251 N kg ha−1, were needed, respectively. Pea plots (211 N kg ha−1) required less nitrogen compared to fallows (240 kg N ha−1). At Los Lunas in 2019, nitrogen requirements following mustard (199.5 kg N ha−1), dry-fallow (197.3 kg N ha−1), and pea (190.6 kg N ha−1) were comparable to each other but less than that of the mix (218.6 kg N ha−1) and barley (245.5 kg N ha−1). However, in 2020, nitrogen requirement following CC treatments (mean 209.6 kg N ha−1) except for the mix (191.7 kg N ha−1), did not differ from fallows (213 kg N ha−1).
3.3.4. Sweet Corn Yield
Sweet corn yield at Leyendecker did not differ by treatment in either year. At Los Lunas in 2019, sweet corn yielded the most following mustard and pea [19].
4. Discussion
4.1. Irrigation Effects and Cover Crop Biomass
Contrary to our hypothesis that higher irrigation frequency will lead to more CC biomass production, irrigation did not have a significant effect on aboveground biomass production, i.e., CC biomass produced under two or three irrigations was not higher than that produced under one post-emergence irrigation for CC treatments at both sites in both years. Agarwal et al. [19] gave possible explanations for this, including the high variation in CC biomass and the possibility that the timing and amount of rainfall during our study years masked the effect of our irrigation treatments. Cover crop species was generally a determinant of biomass production, but the highest yielding species differed by year [19]. Similar to Antosh et al. [29], who demonstrated that neither mix nor monoculture consistently produced the highest biomass, in no site-year did the mix produce more biomass than the highest yielding monoculture nor did they yield less than the lowest producing monoculture. This suggests that a polyculture with an appropriate representation of different species is less prone to annual variability than any CC species grown singly as indicated by Khan and Mcvay [30]. A possible reason for the general trend in lower CC biomass production in 2020 compared to 2019, is that the cash crop, sweet corn, depleted nutrients from the soil, hindering the growth of the subsequent unfertilized cover crops.
4.2. Soil Physical Properties
Mean weight diameter, a measure of aggregate size distribution plays a major role in influencing fluxes of air, water, and solutes by regulating pore size. It is also an important determinant of soil erodibility by wind [31]. The fraction of aggregates > 2 mm and the MWD increased in all CC treatments, including the fallows at Leyendecker, and in every treatment except mustards and fallows at Los Lunas. This improvement in MWD was most likely brought about by CC biomass incorporation into the soil. However, it is important to note that incorporation of cover crops though improves residue mineralization, it can also undermine soil aggregation. The lack of MWD response to the large amount of barley biomass produced at Los Lunas in 2019 was surprising, but we do not have any data to support speculation on why MWD did not increase. Even though fallows were not planted, they produced some weed biomass from the winter rains. Also, at sweet corn harvest, only cobs were picked for yield and the plant residue was tilled back into the soil, further contributing to the increase in MWD. Our results are similar to Antosh et al. [29], who reported an increase in MWD in all CC treatments, including fallows after two years of cover cropping. Our study also showed that the increase in MWD was positively affected by total plant biomass incorporated. This agrees with Blanco-canqui et al. [32], who suggested that plant residue input during fallow months might be an important factor determining soil’s vulnerability to wind erosion. Since all CC treatments produced higher biomass than fallows, they had higher MWD values as compared to fallows in 2020. Similarly, no improvement in MWD in mustard plots at Los Lunas can also be attributed to its lower biomass production in 2020, the majority of which was weeds, owing to the poor initial crop establishment. Our study reaffirmed suggestions proposed by Blanco-canqui et al. [32] that growing CCs during otherwise fallow months can protect soil from wind erosion in semiarid regions in late winter and early spring characterized by strong winds, low precipitation, and little to no ground cover.
Cover crops have also been shown to protect soil against water erosion by intercepting and dissipating raindrop impact energy, intercepting runoff, and reducing soil aggregate detachment [33]. We evaluated water-stable aggregates in terms of the capacity of soil to resist aggregate breakdown due to rainfall [34] and demonstrated an increase in the percentage of water-stable aggregates in peas after two years of cover cropping. Haynes and Beare [35] associated leguminous crops with higher microbial biomass, increased aggregation, and wet aggregate stability than non-legumes. Previous studies have also shown that CCs such as rye and hairy vetch [36] mustard and mustard-vetch [29] oat and oat-vetch [37] and sunn hemp [13] increased water-stable aggregates by 1.2–2 times compared to no cover crop control plots.
4.3. Soil Chemical and Nutrient Properties
According to Weil et al. [22] active carbon is the labile fraction of soil organic carbon which is actively involved in nutrient cycling and is readily available as a food source for microbial processes. Active carbon or Permanganate-oxidizable carbon (POXC) has been shown to respond rapidly to changes in management practices or cropping systems compared to total soil organic carbon [38]. It is also considered a sensitive indicator of overall soil health including aggregate stability and microbial activity, exhibiting a significant linear relationship with crop biomass produced [22]. Active carbon increased in all of the treatments including the fallows at Los Lunas over two years, but only in the mix treatment at Leyendecker. Although the mean soil active carbon was higher in CC treatment plots than in the fallow, the CCs did not have a significant impact on labile carbon. Furthermore, Leyendecker soil had a higher initial active carbon content (429.63 mg kg−1 of soil) and soil organic matter content (2.23%) than Los Lunas (361.08 mg kg−1 of soil; 1.83%), due to which the carbon input by CC biomass might not have been enough to impact labile carbon. However, the rate of change in labile carbon would not only depend on CC species and biomass input but also soil type, C mineralization rates, and climatic conditions. Thus, the increase in labile carbon content at Los Lunas and not at Leyendecker from 2018 to 2020 may also be attributed to different C mineralization rates of the two soil types found at our study locations.
Since the cover crop plant residue was added back to the soil, they also provide a management option for enhancing SOM over time [39]. Based on our data, the increase in SOM was higher under higher total biomass production. In other words, an increase in SOM over two years had a positive linear relationship with total biomass produced. It mostly increased in all CC treatments from 2018 to 2020. However, no treatment differences were seen at Los Lunas and only fallows had lower SOM than all other CC treatments at Leyendecker. This could be because even though CC treatments differed in their total biomass production, the difference was not enough to significantly impact the change in SOM. Also, only sweet corn cobs were harvested for yield and the addition of sweet corn plant residue each year could have contributed to the increase in labile carbon and SOM. It is important to note that SOM changes very slowly and significant differences in management often take many years to become apparent. Benefits of cover crops to SOM depend on multiple factors including CC species, duration of cover cropping, biomass input, precipitation, and cropping systems, and might not be noticeable in the short term [40]. The sensitivity of the method used in SOM determination is often not able to capture the very small shifts in SOM within the soil over a short period.
The potential of CCs residues to add nitrogen to the soil after decomposition was determined in terms of the supplementary N-fertilizer needed for the subsequent sweet corn production, based on recommendations after soil test by Ward Laboratories, a certified soil testing lab for the arid and semi-arid regions of the southwestern US. Peas, being leguminous crops needed on an average 23 kg ha−1 less nitrogen compared to the dry-fallows, which is approximately 50 kg less urea per hectare. Other studies have reported higher levels of N fixation equivalent to 50–155 N kg ha−1 under hairy vetch [41], 258 kg N ha−1 under soybean, and 279 kg N ha−1 under sunn hemp [13] compared to dry-fallow controls. The amount of N added to the soil depends on the type of biomass, the quantity of biomass, and the time of sampling. Soil sampling for nutrient analysis was carried out four weeks after CC termination. Some residue was still left on the surface probably tying up N unaccounted for in the recommendation for the N fertilizer requirement. Legume crops, often with a C:N ratio of less than 20, decompose rapidly without causing N immobilization during the decomposition process [42]. In contrast, grasses can help scavenge nutrients and prevent them from leaching below the rooting zone. However, with their higher C:N ratio, they decompose more slowly. The high C:N ratio of plant materials can cause immobilization of nitrogen into microbial biomass, thus reducing the amount of N available for crop uptake. This may increase the N fertilizer requirement for the subsequent cash crop growth [10]. Our results suggest a possible occurrence of N immobilization in barley CC treatment, as the plots needed an average of 30 kg N ha−1 more than fallows.
5. Conclusions
This study provided an insight into the feasibility of growing CCs in arid, irrigated, water-limited agroecosystems of the southwestern USA. Contrary to our first hypothesis, there were no differences in the amount of CC biomass produced in response to increased water input. In support of our second hypothesis, all CCs improved soil dry aggregate stability, while peas enhanced wet aggregate stability at both sites. SOM increased in all plots over two years, with the greatest increase (0.5%) in peas (although this is only a modest increase). Peas also reduced the amount of N fertilizer needed for subsequent cash crop growth. The amount of cover crop biomass produced seemed to be important for most of the soil benefits rendered by CCs, supporting our third hypothesis. Both the soil physical and chemical properties though not directly affected by irrigation treatments, increased with an increase in biomass production. Even though we did not see an effect of irrigation on either CC biomass production or soil characteristics, it could be attributed to higher variability within our data. Considering the limited availability of irrigation water, concerns regarding over-pumping of groundwater for irrigation, and the adverse effects of poor-quality irrigation water on soil quality, one supplemental irrigation along with average winter precipitation might be enough to grow CCs for improving soil quality in irrigated systems of southern New Mexico, as suggested by our results. However, the performance of these cover crops may vary in coarse-textured soils and during exceptionally dry winter weather.
Author Contributions
Conceptualization, E.A.L. and O.J.I.; methodology, E.A.L., P.A. and O.J.I.; investigation, P.A. and E.A.L.; data analysis, P.A. and R.L.S.; writing—original draft, P.A.; writing—review and editing, E.A.L., R.L.S. and O.J.I.; funding acquisition, E.A.L. and O.J.I. All authors have read and agreed to the published version of the manuscript.
Funding
This research was funded by USDA NIFA, AFRI Foundational Knowledge of Agricultural Production Systems, grant number NMEL-NIFA-18-1.
Institutional Review Board Statement
Not applicable.
Acknowledgments
We would like to thank Ed Morris, Joshua Bleiweiss, David Duran, Israel Marquez, and Andres Indacochea for their extensive efforts with data collection. We also thank the farm crews at Leyendecker and Los Lunas research farms for their assistance and willingness to accommodate our needs with respect to irrigation. We thank the subject editor and the anonymous reviewers whose comments improved this manuscript.
Conflicts of Interest
The authors declare no conflict of interest. The funders had no role in the design of the study; in the collection, analyses, or interpretation of data; in the writing of the manuscript, or in the decision to publish the results.
References
- Moore, E.B.; Wiedenhoeft, M.H.; Kaspar, T.C.; Cambardella, C.A. Rye Cover Crop Effects on Soil Quality in No-Till Corn Silage-Soybean Cropping Systems. Soil Sci. Soc. Am. J. 2014, 78, 968–976. [Google Scholar] [CrossRef]
- Dabney, S.M.; Delgado, J.A.; Reeves, D.W. Using Winter Cover Crops to Improve Soil and Water Quality. Commun. Soil Sci. Plant Anal. 2001, 32, 1221–1250. [Google Scholar] [CrossRef]
- Hobbs, P.R.; Sayre, K.; Gupta, R. The Role of Conservation Agriculture in Sustainable Agriculture. Philos. Trans. Biol. Sci. 2008, 363, 543–555. [Google Scholar] [CrossRef] [PubMed]
- Hermawan, B.; Bomke, A.A. Effects of Winter Cover Crops and Successive Spring Tillage on Soil Aggregation. Soil Tillage Res. 1997, 44, 109–120. [Google Scholar] [CrossRef]
- Steele, M.K.; Coale, F.J.; Hill, R.L. Winter Annual Cover Crop Impacts on No-Till Soil Physical Properties and Organic Matter. Soil Sci. Soc. Am. J. 2012, 76, 2164–2173. [Google Scholar] [CrossRef]
- Kheirabadi, H.; Mahmoodabadi, M.; Jalali, V.; Naghavi, H. Sediment Flux, Wind Erosion and Net Erosion Influenced by Soil Bed Length, Wind Velocity and Aggregate Size Distribution. Geoderma 2018, 323, 22–30. [Google Scholar] [CrossRef]
- Chen, G.; Weil, R.R. Penetration of Cover Crop Roots through Compacted Soils. Plant Soil 2010, 331, 31–43. [Google Scholar] [CrossRef]
- Materechera, S.A.; Dexter, A.R.; Alston, A.M. Penetration of very strong soils by seedling roots of different plant species. Plant Soil 1991, 135, 31–41. [Google Scholar] [CrossRef]
- Williams, S.M.; Weil, R.R. Crop Cover Root Channels May Alleviate Soil Compaction Effects on Soybean Crop. Soil Sci. Soc. Am. J. 2010, 68, 1403. [Google Scholar] [CrossRef]
- Dabney, S.M.; Delgado, J.A.; Collins, F.; Meisinger, J.J.; Schomberg, H.H.; Liebig, M.A.; Kaspar, T.; Mitchell, J. Chapter 9 Using Cover Crops and Cropping Systems for Nitrogen Management. Adv. Nitrogen Manag. Water Qual. 2010, 230–281. [Google Scholar]
- Tobergte, D.R.; Curtis, S. Managing Cover Crops Profitably; Diane Publishing: Darby, PA, USA, 2012; Volume 53. [Google Scholar] [CrossRef]
- Olson, K.; Ebelhar, S.A.; Lang, J.M. Long-Term Effects of Cover Crops on Crop Yields, Soil Organic Carbon Stocks and Sequestration. Open J. Soil Sci. 2001, 4, 284–292. [Google Scholar] [CrossRef] [Green Version]
- Blanco-Canqui, H.; Mikha, M.M.; Presley, D.R.; Claassen, M.M. Addition of Cover Crops Enhances No-Till Potential for Improving Soil Physical Properties. Soil Sci. Soc. Am. J. 2011, 75, 1471–1482. [Google Scholar] [CrossRef]
- Qi, Z.; Helmers, M.J. Soil Water Dynamics under Winter Rye Cover Crop in Central IowaAll Rights Reserved. No Part of This Periodical May Be Reproduced or Transmitted in Any Form or by Any Means, Electronic or Mechanical, Including Photocopying, Recording, or Any Information Storage and Retrieval System, without Permission in Writing from the Publisher. Vadose Zone J. 2010, 9, 53–60. [Google Scholar] [CrossRef]
- Carlson, S.; Stockwell, R. Research Priorities for Advancing Adoption of Cover Crops in Agriculture-Intensive Regions. J. Agric. Food Syst. Community Dev. 2013, 3, 125–129. [Google Scholar] [CrossRef] [Green Version]
- Nielsen, D.C.; Lyon, D.J.; Hergert, G.W.; Higgins, R.K.; Holman, J.D. Cover Crop Biomass Production and Water Use in the Central Great Plains. Agron. J. 2015, 107, 2047–2058. [Google Scholar] [CrossRef]
- Sheng, Z. Impacts of Groundwater Pumping and Climate Variability on Groundwater Availability in the Rio Grande Basin. Ecosphere 2013, 4, 1–25. [Google Scholar] [CrossRef]
- Idowu, J.; Grover, K. Principles of Cover Cropping for Arid and Semi-Arid Farming Systems; New Mexico State University: Las Cruces, NM, USA, 2014; pp. 1–8. [Google Scholar]
- Agarwal, P.; Schutte, B.J.; Idowu, O.J.; Steiner, R.L.; Lehnhoff, E.A. Weed Suppression versus Water Use: Efficacy of Cover Crops in Water-Limited Agroecosystems. Weed Res. 2022, 62, 24–37. [Google Scholar] [CrossRef]
- Idowu, O.J.; Kircher, P. Soil Quality of Semi-Arid Conservation Reserve Program Lands in Eastern New Mexico. Arid. Land Res. Manag. 2016, 30, 153–165. [Google Scholar] [CrossRef]
- Ogden, C.B.; van Es, H.M.; Schindelbeck, R.R. Miniature Rain Simulator for Field Measurement of Soil Infiltration. Soil Sci. Soc. Am. J. 1997, 61, 1041–1043. [Google Scholar] [CrossRef]
- Weil, R.R.; Stine, M.A.; Islam, K.R.; Gruver, J.B.; Samson-liebig, S.E. Estimating Active Carbon for Soil Quality Assessment: A Simplified Method for Laboratory and Field Use Estimating Active Carbon for Soil Quality Assessment: A Simpli ® Ed Method for Laboratory and ® Eld Use. Am. J. Altern. Agric. 2003, 18, 3–17. [Google Scholar] [CrossRef]
- Gruver, J. Evaluating the Sensitivity and Linearity of a Permanganate-Oxidizable Carbon Method. Commun. Soil Sci. Plant Anal. 2015, 46, 490–510. [Google Scholar] [CrossRef]
- Olsen, S. Estimation of Available Phosphorus in Soils by Extraction with Sodium Bicarbonate; US Department of Agriculture: Washington, DC, USA, 1954. [Google Scholar]
- McGeorge, W.T. Diagnosis and Improvement of Saline and Alkaline Soils. Soil Sci. Soc. Am. J. 1954, 18, 348. [Google Scholar] [CrossRef]
- Richard, B.J. Recommended Chemical Soil Test Procedures for the North Central Region; Missouri Agricultural Experiment Station: Columbia, MO, USA, 1998. [Google Scholar]
- Schulte, E.E.; Hopkins, B.G. Estimation of Soil Organic Matter by Weight Loss-On-Ignition. Soil Org. Matter Anal. Interpret. 1996, 46, 21–31. [Google Scholar] [CrossRef]
- Kuznetsova, A.; Brockhoff, P.B.; Christensen, R.H.B. LmerTest Package: Tests in Linear Mixed Effects Models. J. Stat. Softw. 2017, 82, 1–26. [Google Scholar] [CrossRef] [Green Version]
- Antosh, E.; Idowu, J.; Schutte, B.; Lehnhoff, E. Winter Cover Crops Effects on Soil Properties and Sweet Corn Yield in Semi-Arid Irrigated Systems. Agron. J. 2020, 112, 92–106. [Google Scholar] [CrossRef]
- Khan, Q.A.; Mcvay, K.A. Productivity and Stability of Multi-Species Cover Crop Mixtures in the Northern Great Plains. Agron. J. 2019, 111, 1817–1827. [Google Scholar] [CrossRef]
- Guo, M. Soil Sampling and Methods of Analysis. J. Environ. Qual. 2009, 38, 375. [Google Scholar] [CrossRef]
- Blanco-canqui, H.; Holman, J.D.; Schlegel, A.J.; Tatarko, J.; Shaver, T.M. Replacing Fallow with Cover Crops in a Semiarid Soil: Effects on Soil Properties. Soil Sci. Soc. Am. J. 2013, 77, 1026–1034. [Google Scholar] [CrossRef] [Green Version]
- Kaspar, T.C.; Singer, J.W. The Use of Cover Crops to Manage Soil. Soil Manag. Build. Stable Base Agric. 2011, 321–337. [Google Scholar] [CrossRef]
- Legout, C.; Leguédois, S.; le Bissonnais, Y. Aggregate Breakdown Dynamics under Rainfall Compared with Aggregate Stability Measurements. Eur. J. Soil Sci. 2005, 56, 225–238. [Google Scholar] [CrossRef]
- Haynes, R.J.; Beare, M.H. Influence of Six Crop Species on Aggregate Stability and Some Labile Organic Matter Fractions. Soil Biol. Biochem. 1997, 29, 1647–1653. [Google Scholar] [CrossRef]
- Villamil, M.B.; Bollero, G.A.; Darmody, R.G.; Simmons, F.W.; Bullock, D.G. No-Till Corn/Soybean Systems Including Winter Cover Crops. Soil Sci. Soc. Am. J. 2006, 70, 1936–1944. [Google Scholar] [CrossRef]
- Ramos, M.E.; Benítez, E.; García, P.A.; Robles, A.B. Cover Crops under Different Managements vs. Frequent Tillage in Almond Orchards in Semiarid Conditions: Effects on Soil Quality. Appl. Soil Ecol. 2010, 44, 6–14. [Google Scholar] [CrossRef]
- Paustian, K.; Collins, H.P.; Paul, E.A. Management Controls on Soil Carbon. In Soil Organic Matter in Temperate Agroecosystems; CRC Press: Boca Raton, FL, USA, 1997; pp. 15–49. [Google Scholar] [CrossRef]
- Newman, Y.C.; Wright, D.W.; Mackowiak, C.; Scholberg, J.M.S.; Cherr, C.M. Benefits of Cover Crops for Soil Health. EDIS 2007, 20, 1–3. [Google Scholar] [CrossRef]
- Blanco-Canqui, H.; Shapiro, C.A.; Wortmann, C.S.; Drijber, R.A.; Mamo, M.; Shaver, T.M.; Ferguson, R.B. Soil Organic Carbon: The Value to Soil Properties. J. Soil Water Conserv. 2013, 68, 129–134. [Google Scholar] [CrossRef]
- Seo, J.; Lee, H.; Hur, I.; Kim, S.; Kim, C.; Jo, H. Use of Hairy Vetch Green Manure as Nitrogen Fertilizer for Corn Production. Korean J. Crop Sci. 2000, 45, 294–299. [Google Scholar]
- Kaleeem Abbasi, M.; Mahmood Tahir, M.; Sabir, N.; Khurshid, M.; Jammu, A. Impact of the Addition of Different Plant Residues on Nitrogen Mineralization-Immobilization Turnover and Carbon Content of a Soil Incubated under Laboratory Conditions. Solid Earth 2015, 6, 197–205. [Google Scholar] [CrossRef] [Green Version]
Figure 1.
Mean monthly air temperature and rainfall at Leyendecker (a) and Los Lunas (b), respectively, over our study duration and the 30-year averages obtained from New Mexico Climate Center′s ZiaMet Agriculture Weather Station Network (weather.nmsu.edu/ziamet/. Accessed on 23 October 2020) for respective experimental sites.

Figure 2.
Mean weight diameter (MWD) for cover crop treatments, 2018–2020 at Leyendecker (a) and Los Lunas (b) farms. Uppercase letters which are different indicate differences within treatments between years, and lowercase letters which are different indicate differences between treatments within a year at p ≤ 0.05. Means have been averaged over irrigation treatments.

Figure 3.
Change in mean weight diameter (MWD) at (a) Leyendecker and (b) Los Lunas and change in soil organic matter (SOM) at (c) Leyendecker and (d) Los Lunas from 2018 to 2020 in response to total biomass produced during cover crop growth phase.
Figure 3.
Change in mean weight diameter (MWD) at (a) Leyendecker and (b) Los Lunas and change in soil organic matter (SOM) at (c) Leyendecker and (d) Los Lunas from 2018 to 2020 in response to total biomass produced during cover crop growth phase.


Table 1.
Mean values (±SE) for large aggregates (AGG > 2 mm), wet aggregates stability (WAS), permanganate oxidizable carbon (POXC), and soil organic matter (SOM)at Leyendecker and Los Lunas sites. Means have been averaged over the irrigation treatments (n = 12 per treatment).
Table 1.
Mean values (±SE) for large aggregates (AGG > 2 mm), wet aggregates stability (WAS), permanganate oxidizable carbon (POXC), and soil organic matter (SOM)at Leyendecker and Los Lunas sites. Means have been averaged over the irrigation treatments (n = 12 per treatment).
| Cover Crop Treatments | Leyendecker | Los Lunas | ||||
|---|---|---|---|---|---|---|
| 2018 | 2019 | 2020 | 2018 | 2019 | 2020 | |
| AGG > 2 mm (%) | ||||||
| Fallow | 30 (2.2) Caba a | 37 (2.2) Bb | 43 (2.2) Ab | 29 (3.0) ABa | 25 (3.0) Ba | 30 (3.0) Aa |
| Barley | 30 (2.0) Cab | 40 (2.0) Bb | 60 (2.0) Aa | 29 (2.9) Ba | 19 (2.9) Ca | 36 (2.9) Aa |
| Mustard | 32 (2.0) Ca | 43 (2.0) Bab | 59 (2.0) Aa | 29 (2.9) Aa | 22 (2.9) Ba | 30 (2.9) Aa |
| Pea | 31 (2.0) Ca | 45 (2.0) Ba | 62 (2.0) Aa | 25 (2.9) Ba | 17 (2.9) Ca | 35 (2.9) Aa |
| Mix | 25 (2.0) Cb | 45 (2.0) Ba | 62 (2.0) Aa | 29 (2.9) Ba | 20 (2.9) Ca | 34 (2.9) Aa |
| WAS (%) | ||||||
| Fallow | 61 (2.5) Aa | 61 (2.5) Aa | 59 (2.5) Ab | 61 (1.9) Ba | 73(1.9) Aa | 70(1.9) Aa |
| Barley | 59 (2.5) Ba | 67 (2.5) Aa | 64 (2.5) ABab | 60 (1.9) Bab | 72 (1.9) Aa | 72 (1.9) Aa |
| Mustard | 59 (2.5) Ba | 68 (2.5) Aa | 65 (2.5) ABab | 59 (1.9) Bab | 71 (1.9) Aa | 68 (1.9) Aab |
| Pea | 61 (2.5) Ba | 66 (2.5) ABa | 67 (2.5) Aa | 56 (1.9) Bb | 70 (1.9) Aa | 70 (1.9) Aa |
| Mix | 58 (2.5) Ba | 68 (2.5) Aa | 69 (2.5) Aa | 62 (1.9) Ba | 73 (1.9) Aa | 64 (1.9) Bb |
| POXC (mg kg−1) | ||||||
| Fallow | 430 (7.7) Aab | 435 (7.7) Aa | 431(7.7) Aa | 353 (10.0) Ba | 438 (10.0) Aa | 457 (10.0) Aa |
| Barley | 430 (7.7) Aab | 440 (7.7) Aa | 441 (7.7) Aa | 364 (9.7) Ca | 431 (9.7) Ba | 483 (9.7) Aa |
| Mustard | 418 (7.7) Bb | 446 (7.7) Aa | 433 (7.7) ABa | 359 (9.7) Ca | 436 (9.7) Ba | 477 (9.7) Aa |
| Pea | 444 (7.7) Aa | 445 (7.7) Aa | 445 (7.7) Aa | 354 (9.7) Ca | 437 (9.7) Ba | 477 (9.7) Aa |
| Mix | 425 (7.7) Bab | 436 (7.7) ABa | 450 (7.7) Aa | 373 (9.7) Ca | 433 (9.7) Ba | 469 (9.7) Aa |
| SOM (%) | ||||||
| Fallow | 2.21 (0.07) Ca | 2.61 (0.07) Ab | 2.46 (0.07) Bb | 1.85 (0.07) Ba | 2.06 (0.07) Aa | 2.01 (0.07) Aa |
| Barley | 2.2 (0.07) Ba | 2.68 (0.07) Aab | 2.57 (0.07) Aab | 1.81 (0.06) Ba | 2.05 (0.06) Aa | 2.12 (0.06) Aa |
| Mustard | 2.3 (0.07) Ba | 2.69 (0.07) Aab | 2.61 (0.07) Aa | 1.86 (0.06) Ba | 2.05 (0.06) Aa | 2.14 (0.06) Aa |
| Pea | 2.2 (0.07) Ba | 2.78 (0.07) Aa | 2.7 (0.07) Aa | 1.81 (0.06) Ba | 2.01 (0.06) Aa | 2.1 (0.06) Aa |
| Mix | 2.25 (0.07) Ba | 2.7 (0.07) Aab | 2.68 (0.07) Aa | 1.84 (0.06) Ba | 2.13 (0.06) Aa | 2.18 (0.06) Aa |
a Uppercase letters which are different indicate differences within treatments between years, and lowercase letters which are different indicate differences between treatments within a year at p ≤ 0.05.
Publisher’s Note: MDPI stays neutral with regard to jurisdictional claims in published maps and institutional affiliations. |
© 2022 by the authors. Licensee MDPI, Basel, Switzerland. This article is an open access article distributed under the terms and conditions of the Creative Commons Attribution (CC BY) license (https://creativecommons.org/licenses/by/4.0/).
Share and Cite
MDPI and ACS Style
Agarwal, P.; Lehnhoff, E.A.; Steiner, R.L.; Idowu, O.J. Cover Crops Enhance Soil Properties in Arid Agroecosystem despite Limited Irrigation. Agronomy 2022, 12, 1235. https://0-doi-org.brum.beds.ac.uk/10.3390/agronomy12051235
AMA Style
Agarwal P, Lehnhoff EA, Steiner RL, Idowu OJ. Cover Crops Enhance Soil Properties in Arid Agroecosystem despite Limited Irrigation. Agronomy. 2022; 12(5):1235. https://0-doi-org.brum.beds.ac.uk/10.3390/agronomy12051235
Chicago/Turabian StyleAgarwal, Prashasti, Erik A. Lehnhoff, Robert L. Steiner, and Omololu John Idowu. 2022. "Cover Crops Enhance Soil Properties in Arid Agroecosystem despite Limited Irrigation" Agronomy 12, no. 5: 1235. https://0-doi-org.brum.beds.ac.uk/10.3390/agronomy12051235
Note that from the first issue of 2016, this journal uses article numbers instead of page numbers. See further details here.