Article

Effect of Irrigation and Nitrogen Fertilization Strategies on Silage Corn Grown in Semi-Arid Conditions

by
Abdelaziz Nilahyane
1,
M. Anowarul Islam
2,*,
Abdel O. Mesbah
1 and
Axel Garcia y Garcia
3
1
Agricultural Science Center, New Mexico State University, Clovis, NM 88101, USA
2
Department of Plant Sciences, University of Wyoming, Laramie, WY 82071, USA
3
Department of Agronomy and Plant Genetics, University of Minnesota, Southwest Research and Outreach Center, Lamberton, MN 56152, USA
*
Author to whom correspondence should be addressed.
Submission received: 28 August 2018 / Revised: 20 September 2018 / Accepted: 26 September 2018 / Published: 28 September 2018
(This article belongs to the Special Issue Crop Evapotranspiration)

Abstract

:
In water-scarce regions, high yield and improved water use efficiency (WUE) of crops can be obtained if water and nitrogen (N) are properly applied. While water and N have been the subject of research worldwide, studies are needed to advance our understanding on the complexity of their interaction. A field experiment was conducted at the University of Wyoming Powell Research and Extension Center in 2014 and 2015 growing seasons to determine the effect of irrigation water and N on growth, dry matter (DM) yield, and WUE of silage corn (Zea mays L.) grown under on-surface drip irrigation (ODI). The experiment was laid out as a randomized complete block design in split-plot arrangement with three replications. Irrigation was the main treatment and included 100ETc (100% crop evapotranspiration), 80ETc, and 60ETc. Nitrogen was the sub-treatment and included 0, 90, 180, 270, and 360 kg N ha−1 as urea-ammonium-nitrate solution Results showed that irrigation water, N, and application timing significantly affected growth and DM yield, especially at late vegetative and mid reproductive growth stages. At harvest (R4), no significant difference was observed between 180 kg N ha−1 and 270 kg N ha−1 on DM yield and WUE. However, significant differences of DM yield were observed between irrigation treatments, and 100ETc and 80ETc did not differ in WUE. Our findings suggest that 100ETc and 180 kg N ha−1 is the best combination for high yielding corn for silage grown in a semi-arid climate under ODI.

1. Introduction

Corn (Zea mays L.) harvested for silage is the most important feed crop worldwide. In semi-arid regions, scarcity of water supply reduces the potential of sustainable corn production [1,2]. The water and nutrients combination, especially nitrogen (N), the nutrient which is required by corn plants in the greatest amount, is a perfect combination for drastic reduction of productivity in a scenario of limiting water. The application of nutrients, e.g., N, boosts silage corn yield and provides adequate crop quality [3]. In modern farming systems, sustainable intensification calls for improved resources use efficiency while maintaining or increasing productivity and enhancing the quality of the environment, mainly due to issues associated with N [4]. Similarly, the adoption of appropriate practices to manage water, such as irrigation scheduling, is essential in order to achieve high yield while enhancing the water use efficiency (WUE) of crops [5].
In Wyoming, the 5th driest state in U.S., silage corn is typically grown under surface and pressurized irrigation systems, with the latter including overhead sprinkler and drip irrigation, which help farmers reduce the water and nutrient inputs. Drip irrigation (on-surface and sub-surface) is considered as a highly efficient technology as it allows for better timing and for more precise applications of water [6]. Drip irrigation aims to reduce water amounts and improve irrigation uniformity. Efficient irrigation systems and adequate fertilization strategies could improve nutrients and water uptake and productivity [7]. Such strategies, however, must be supported with research-based information addressing key issues that may decrease yield [8]. These include the negative effects of water stress on plant growth [9], canopy height [10], and leaf area [11]. On the other hand, N deficiency limits plant growth rates, decreases leaf areas, and reduces biomass production [12,13].
It is well known that the combined effect of water and N is complex, especially in respect to plant growth and yield. For instance, reduction in corn yield occurs when high rates of N are applied in conditions of limited water [11]. In contrast, high amounts of N fertilizer are required when corn is grown under conditions of no water stress [14]. Inappropriate use of N and water may lead to excess application and increased nitrate losses in the leachate [15] with adverse effects on the environment [16]. Furthermore, N fertilizer prices have increased exponentially over the past few decades [17]. It is, therefore, important to improve N management in an irrigated production system to optimize farm profits and minimize environmental impacts [18]. The effects of irrigation water and N on yield and WUE of corn have been studied extensively [19,20,21,22]. However, few studies have investigated the combined effect of water and N on corn for silage grown in water-scarce regions, especially under drip irrigation. In addition, there are inconsistencies in results between the amounts of water and N rates applied [23]. Silage corn requires specific management practices compared to corn grown for grain. For example, silage corn is commonly harvested before physiological maturity and therefore requires less amounts of water compared to corn grown for grain. Nitrogen management is also critical for increasing yield at early reproductive stages without affecting the nutritive value of silage corn [1]. The objectives of this study were to evaluate the combined effect of irrigation water and N on: (i) growth and dry matter (DM) yield and (ii) WUE at different growth stages of corn for silage grown in a semi-arid region.

2. Materials and Methods

2.1. Study Site

The experiment was conducted in 2014 and 2015 growing seasons at the University of Wyoming Powell Research and Extension Center located at latitude North 44°45′32′′ and longitude West 108°45′30′′ with an elevation of 1333 m a.s.l. The study area is known by its cold and dry winters, and warm and dry summers with an average rainfall of 157 mm yr−1 and an average annual temperature of 6.7 °C. The growing season averages 125 frost-free days (www.wrds.uwyo.edu) with the air temperature ranging from 0 °C to 29 °C. In 2014, the length of the growing season was 115 days compared to 95 days in 2015 (Figure 1). In 2015, high rainfall was recorded in the beginning of the growing season compared to that in 2014. The soil is characterized as clay loam soil (Garland fine-loamy, mixed, superactive, mesic Typic Haplargids) with a pH of 7.9 and an organic matter and N content of 1.67% and 0.09%, respectively [24].

2.2. Experimental Design and Crop Management

The experiment was laid out as a randomized complete block in split-plot arrangement with three replications. The treatments consisted of three irrigation levels as the main plots: 100% crop evapotranspiration (100ETc), 80ETc, and 60ETc, and five N rates as sub-plots: 0, 90, 180, 270, and 360 kg N ha−1 as a urea–ammonium-nitrate aqueous solution side-dressed four times on 17 June, 2 July, 15 July, and 22 July during 2014, and on 10 June, 25 June, 6 July, and 13 July during the 2015 growing seasons. The hybrid Pioneer ‘P8107HR’ (www.pioneer.com) was planted on 20 May and 22 May in the same experimental field in 2014 and 2015, respectively. Corn was planted on a 56-cm row spacing at a density of 90,000 plants ha−1 (www.pioneer.com), and irrigated with an on-surface drip irrigation (ODI) system. For establishment purposes, all plots were irrigated equally after planting, and the irrigation treatments were initiated after crop establishment. The irrigation water amounts for the 100ETc treatment were based on the ETc obtained as a product of the reference evapotranspiration (ET0) and the dual crop coefficient (Kc) [25]. The irrigation amounts for the other treatments were proportionally obtained from the 100ETc treatment. The daily ET0 was calculated using the FAO Penman–Monteith equation as modified by the American Society of Civil Engineers (ASCE) [26]. The irrigation was triggered once the soil moisture fell below 50% of management allowable depletion of the available water [25].

2.3. Data Collection

The daily weather data including maximum and minimum temperatures, rainfall and solar radiation were obtained from the automated weather station at the experimental site. Soil moisture was monitored every 20 cm up to 1 m depth before and after each irrigation event using a neutron probe (503DR Hydropobe®, CPN International Inc., Concord, CA, USA). Before measurements, aluminum access tubes were installed in the field using a Giddings soil probe (W2-1230, Giddings Machine Company, Inc., Windsor, CO, USA), ensuring a good contact between aluminum tubes and soil. A mass conservation approach was used to run a field water balance. The water use (ETc-wb) of silage corn obtained from neutron probe measurements was calculated using a simplification of the water balance equation:
ETc wb = I + P R D + CR ± Δ S
where ETc−wb refers to the evapotranspiration or water use of corn obtained from the water balance (mm), I refers to irrigation (mm), P is rainfall (mm), R is runoff (mm), D is drainage (mm), CR is the capillary rise (mm), and Δ S (mm) is the change in soil water content over a specific period of time. Our simplified equation neglected R, D, and CR, so Equation (1) can be simplified as:
ETc wb = I + P ± Δ S
The simplification was based on the fact that irrigation water amounts were applied via the drip system on a clay-loam soil on a near zero slop field, minimizing drainage and runoff losses. Capillary rise might have contributed to plant available water, but its quantification was beyond the scope of this research.
Growth data were collected manually for canopy height, leaf area index (LAI), and silage DM yield at five phenological stages (V4, V8, V12, VT, and R4; the Vn stage is when the collar of the nth leaf is visible, VT refers to tasseling or anthesis, and R4 refers to dough stage). The two inner rows of 2.5 m lengths in each experimental plot were harvested as plant samples. Selected plants were subject to a fresh weight and canopy height measurements before splitting them into leaves, stems, and ears. The leaf area was then measured using an LI-3100 C Area Meter (LI-COR Biosciences, Lincoln, NE, USA). All parts of each plant were then oven-dried at 60 °C for a period of 72 h for DM. Phenology (vegetative, tasseling, and reproductive stages) was also monitored three times a week based on the leaf collar appearance following the method of [27]. The onset of a given phenological stage was recorded when 50% of the plants were at the stage of interest.
The seasonal water use (WU, mm) was calculated from the water balance as described previously, while the WUE (kg m−3) and irrigation water use efficiency (IWUE, kg m−3) were calculated using the approach of [28] (Equations (3) and (4)):
WUE = Y ETc ( seasonal )
IWUE = Y I ( s e a s o n a l )
where Y is the crop yield (kg·ha−1), and I is the irrigation amount (mm).

2.4. Statistical Analysis

The growth, yield, and WUE results were analyzed using the PROC MIXED procedure of SAS statistical package [29]. The irrigation water, N rate, and growth stage were fixed terms, while the year, block, and block × irrigation were random terms. The post-hoc Least Significant Difference (LSD) test for mean separations was performed using the LSMEANS statement in SAS [29]. Data were checked for homogeneity of variances using the Bartlett test [30], and for normality of residuals, the Shapiro–Wilk test was used [31]. The square root transformation was applied for the LAI and canopy height data, and the back-transformed means for both parameters were reported. Polynomial orthogonal contrasts were used for the N rates over different growth stages.
The PROC CORR of SAS statistical package [29] was used to determine the Pearson’s coefficient of correlation (r) and to evaluate the association between the WU of corn obtained from the water balance (ETc-wb) and the Penman–Monteith equation (ETc-pm). The F-test was performed to compare the slopes and the y-intercepts for each irrigation treatment between years.

3. Results and Discussion

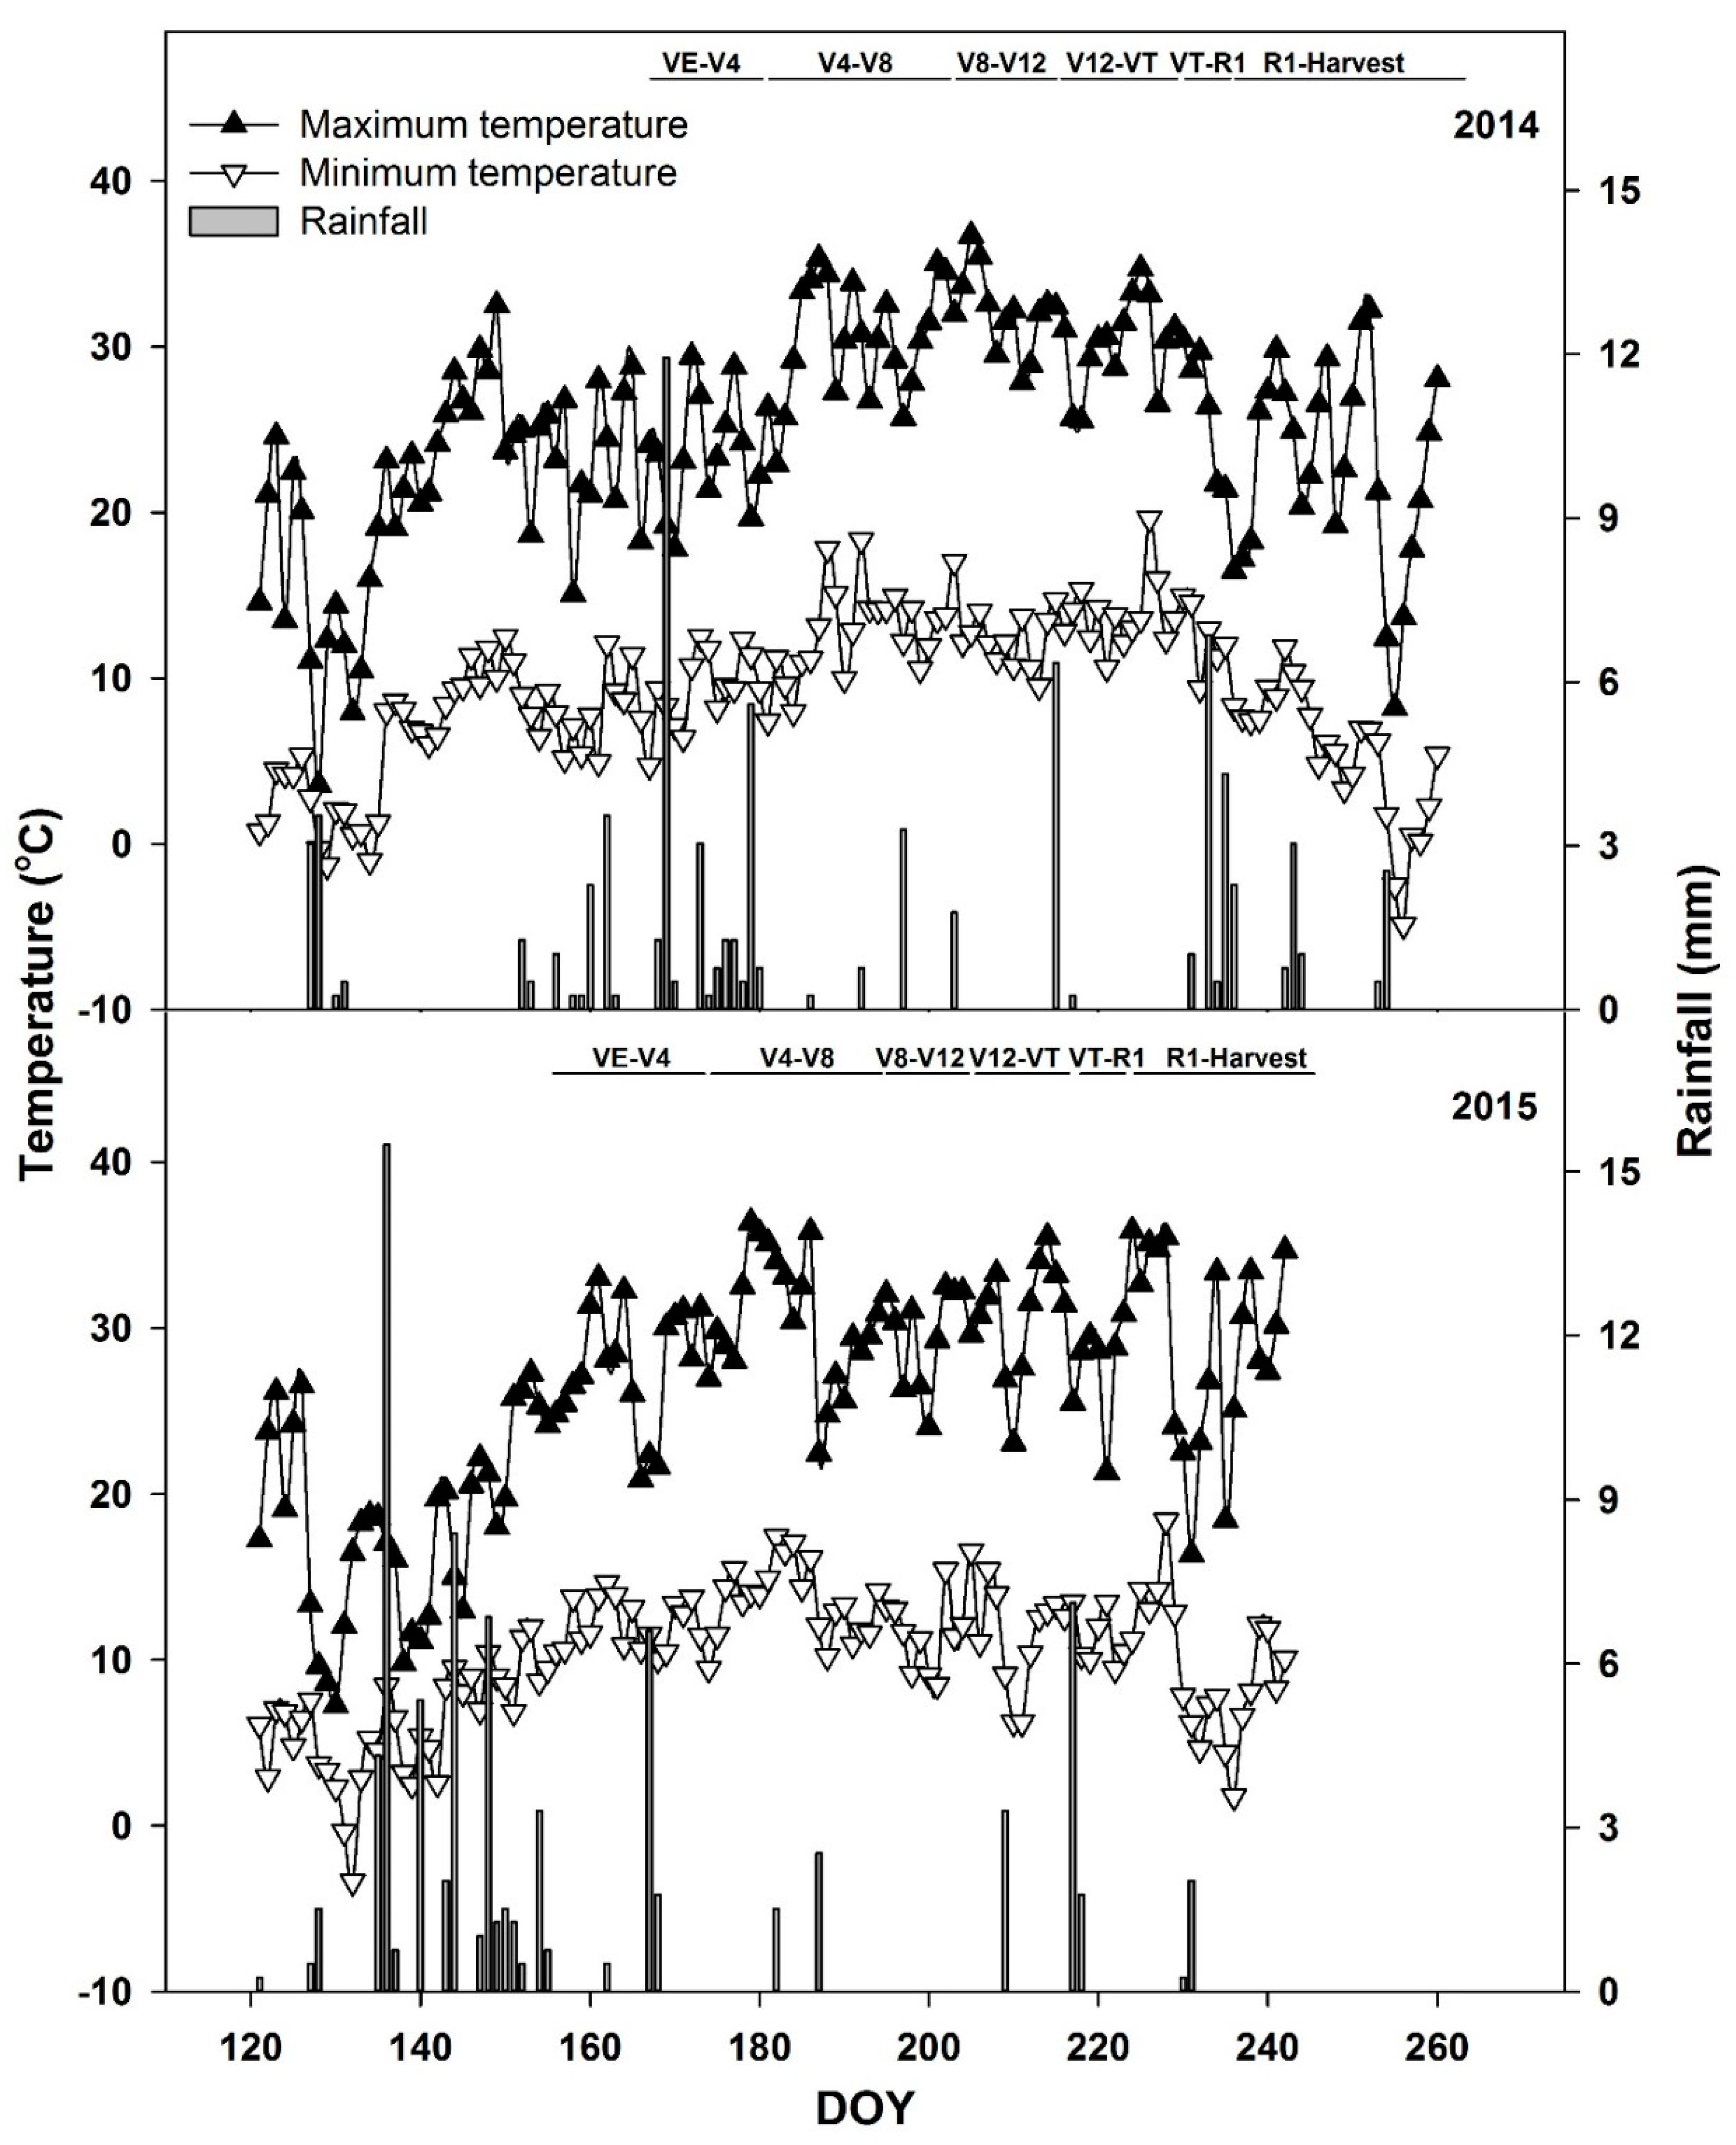
3.1. The Field Water Balance

The ETc-wb showed significant positive correlation with the ETc-pm approach (Table 1). The Pearson’s coefficient of correlation ranged from 0.81 to 0.88 in 2014 and from 0.76 to 0.79 in 2015 (Table 1). In 2014, the daily ETc-pm ranged between 4.5 and 7 mm, while the daily ETc-wb ranged between 2 and 11 mm. Conversely, the daily ETc ranged between 2.5 mm and 5.5 mm, and from 1 mm to 6 mm for the ETc-pm and ETc-wb during 2015, respectively (data not shown). Compared to the ETc-pm, the field water balance overestimated the daily crop WU of corn during warm periods of the 2014 growing season, which explains the variation on ETc-wb in 2014 for the three irrigation treatments, mostly at mid and late growing seasons (Figure 2). The total WU of silage corn was higher in 2014, mainly due to a longer growing season, compared to that in 2015 (Figure 2). The cumulative WU of silage corn from the water balance was consistently lower than the ETc-pm. As the neutron probe is considered the most accurate indirect method for measuring soil water status [6], our results suggest that the WU of silage corn tends to be overestimated with the Penman–Monteith approach, indicating the need for the development of local crop coefficients.

3.2. Canopy Height and Leaf Area Index

Irrigation water, N, and growth stage had significant effects on the canopy height and LAI (Table 2). Likewise, the linear and quadratic responses of both canopy height and LAI to N rates were significant (Table 2). Application of N affected canopy height and LAI of silage corn (Table 3). Increment of N rates (up to 180 kg N ha−1) significantly increased canopy height, while increasing the N rate to 90 kg N ha−1 significantly increased the LAI. Appropriate amount of N activates cell division, which contributes to stem elongation [32] and increases chlorophyll content resulting in high LAI [33]. The results also showed that the canopy height and LAI were significantly affected by year (p = 0.0013 and p = 0.0035 for canopy height and LAI, respectively; Table 2).
A significant two-way interaction between the irrigation and growth stage was observed for both the canopy height and LAI (Table 2). Higher canopy heights were observed at anthesis (VT) and harvest (R4) (Figure 3A). Within irrigation treatment, the canopy height was higher at 100ETc followed by 80ETc, and then 60ETc (Figure 3A), indicating that the canopy height decreased with limited water [34]. This was probably due to the effect of water stress on the division and expansion of plant cells, which eventually affected the canopy height of silage corn [35,36,37].
With the advancement of growth stage, the LAI increased and reached the maximum at V12 and VT growth stages, with significant difference among irrigation treatments (Figure 3B). The LAI dropped from 4.84, 4.30, and 3.32 m2 m−2 at VT to 2.02, 1.87, and 1.52 m2 m−2 at R4 for 100ETc, 80ETc, and 60ETc, respectively (Figure 3B). At R4, no difference for LAI was observed between 80ETc and 100ETc (Figure 3B). The decrease of LAI at a late growth stage was due to the loss of leaves because of senescence. Earlier study by [38] suggested that water remobilized from old to new leaves, leading to senescence of old leaves and decrease in LAI. Similarly, it has been reported that at late vegetative growth stages and anthesis, water stress significantly reduced the LAI of corn [11]. There were no significant three-way interactions between the irrigation water, N, and growth stage for the canopy height and LAI (Table 2) indicating independent effects of water and N at different growth stages.

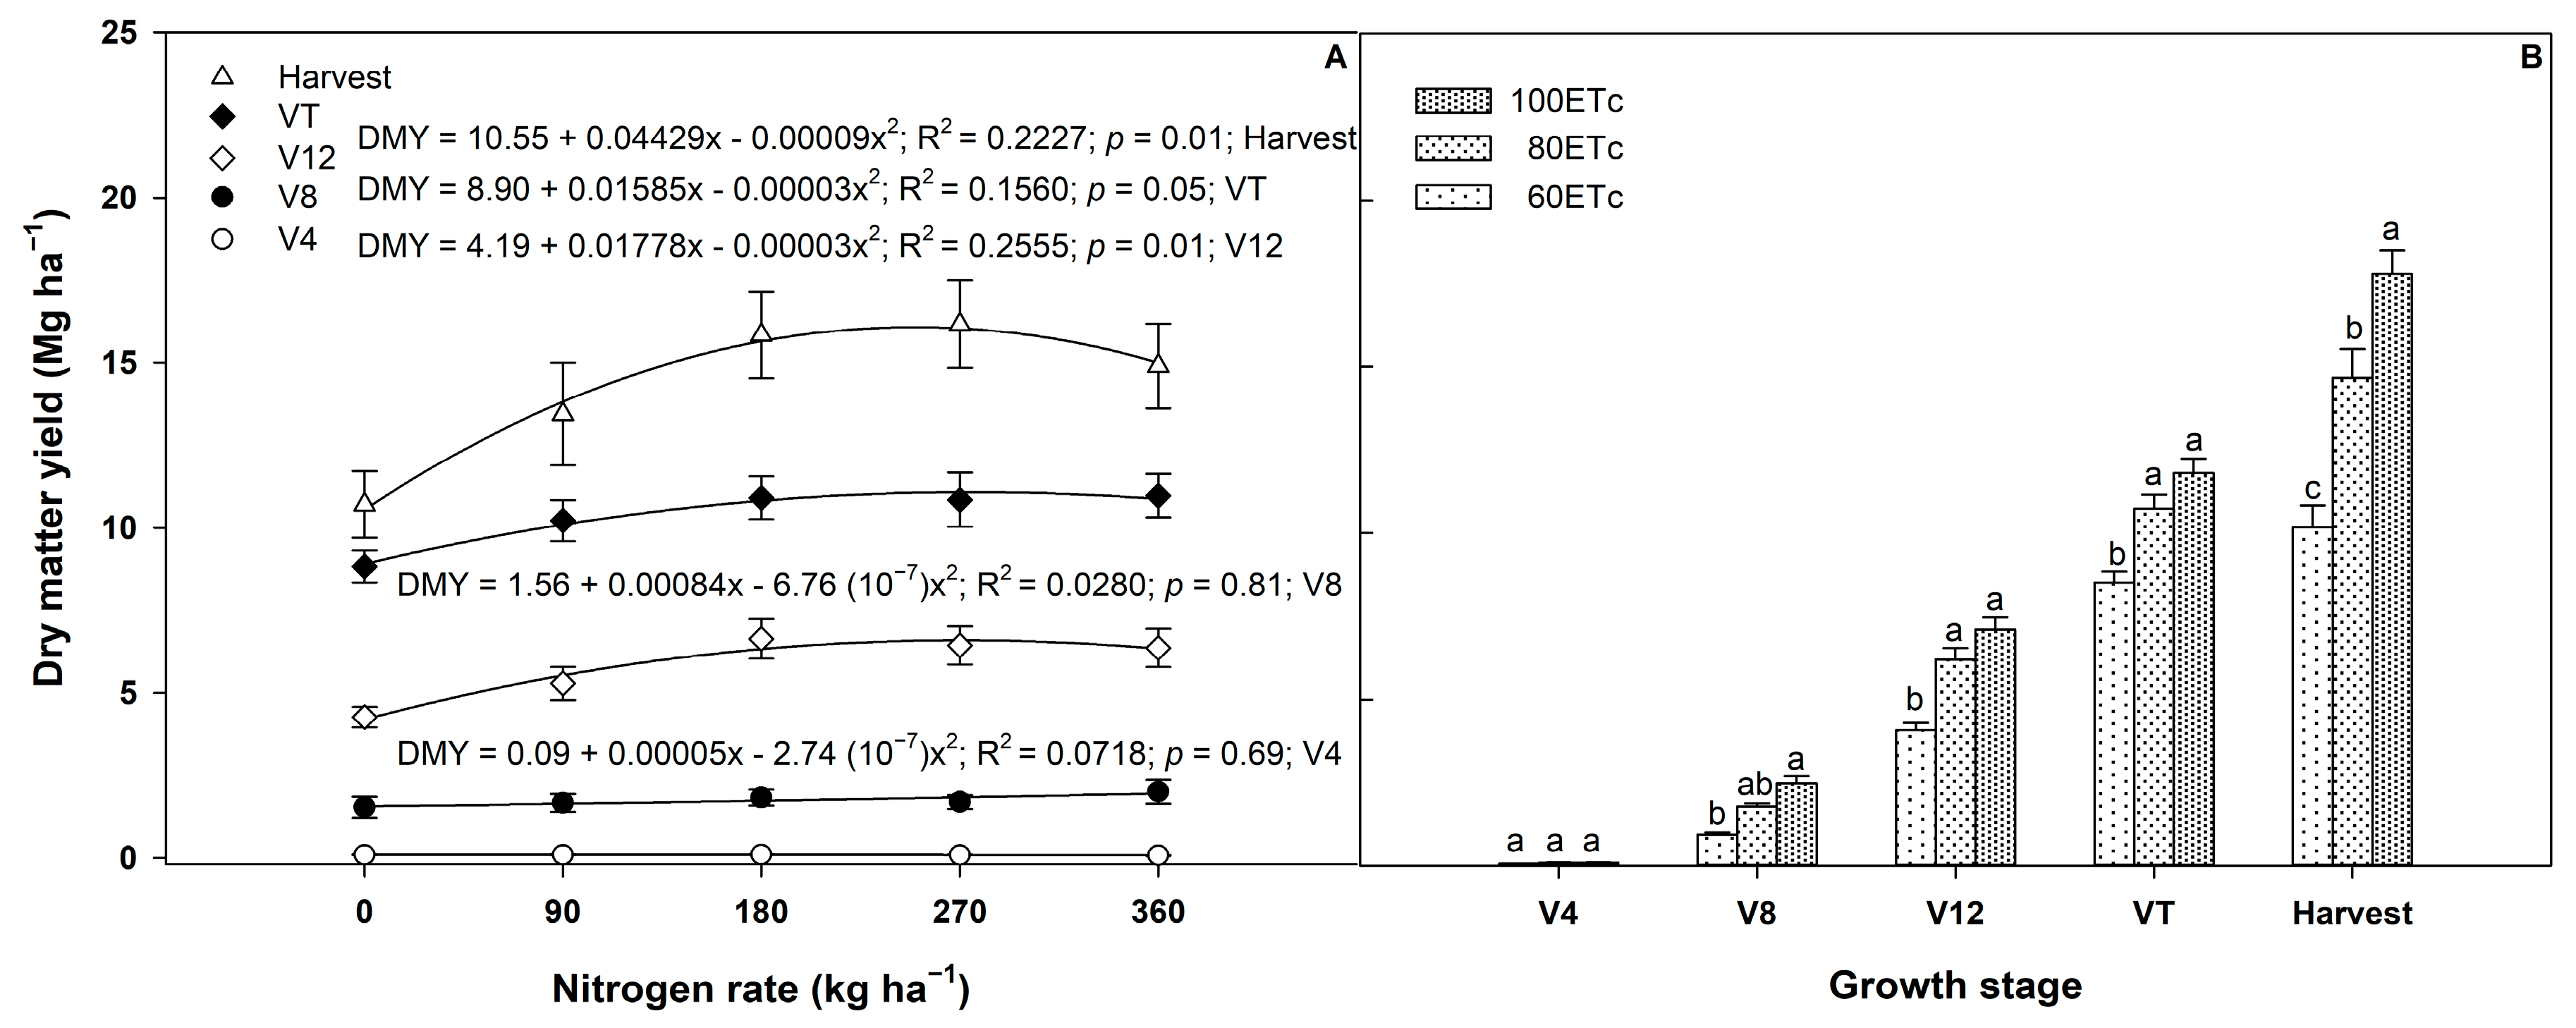
3.3. Dry Matter Yield

The DM yield responses between two years were significant (p = 0.01; Table 2). Likewise, the effects of irrigation water, N, and growth stage were significant (Table 2). The linear and quadratic orthogonal responses of DM to N were also significant (Table 2). The highest yields were obtained at 180 and 270 kg N ha–1; however, these values were low compared to the interaction effect of N with the growth stage (Table 4). This indicated the importance of depicting the interaction effects in advancing our understanding on the agronomic responses to multi-factors [39].
The two-way interactions (N × growth stage and irrigation × growth stage) on DM yield were significant (Table 2). Similarly, the linear and quadratic polynomial contrasts of the N × growth stage interactions were significant (Table 2). The quadratic DM response for N × growth stage interaction is shown in Figure 4A. High rates of change on DM were obtained at V12, VT, and R4 compared to those at early vegetative growth stages. For each unit increase of N fertilizer, the DM yield increased by 0.018, 0.016, and 0.044 Mg ha−1 at V12, VT, and R4 stages, respectively (Figure 4A). At R4 stage, the highest DM yield (16.16 Mg ha−1) was obtained at the N rate of 270 kg N ha−1 (Table 4). Significant differences in growth stage were observed between the high rates of N starting at 180 kg N ha−1 compared to those for low N rates (Table 4), suggesting that the N rate of 180 kg N ha−1 would be optimum for obtaining high yield of silage corn in the semi-arid conditions of Wyoming. In similar environmental conditions, at the N rate of 175 kg N ha−1, the maximum grain yield of corn is produced [40], while others have found that 196 kg N ha−1 should be optimum for the highest corn yield and economic return under the sprinkler irrigation system in south central Nebraska [41]. However, the N rate as high as 240 kg N ha−1 are reported to produce high DM yield and quality of fodder corn [42], which is similar to the report that can obtain high aboveground biomass of silage corn grown can be obtained at the N rate of 225 kg N ha−1 under the sprinkler irrigation system in the arid conditions of Iran [21]. The increase in DM yield of silage corn with increased N rates is reported to be associated with increase in plant height and leaf expansion, leading to increased photosynthetically active radiation [43] and accumulation of assimilates [44].
Within a growth stage, except for V4, the DM yield responses were significantly different among irrigation treatments for all growth stages (Figure 4B). At harvest (R4), differences were observed between 100ETc, 80ETc, and 60ETc treatments with the highest DM at 100ETc and the lowest DM at 60ETc (Figure 4B). At anthesis (VT) and pre-anthesis growth stages, no differences for DM were observed between 80ET and 100ETc, suggesting 80ETc could be a viable strategy to produce high yield while reducing the irrigation water amounts during the vegetative growth stages (Figure 4B). There were no three-way interactions effect of N, irrigation water, and growth stage on DM, indicating independent effects of water and N on DM at different stages (Table 2).
The response of DM yield to seasonal crop WU showed significant difference among irrigation treatments at late vegetative and reproductive stages. Less than 1 Mg ha−1 of DM was obtained when water was limited at early vegetative stages (Figure 4B). This suggested that the effect of limited water on DM is negligible during the early growth stages but significant at late vegetative and reproductive stages. These findings are in agreement with results of other studies [45,46,47]. In general, at early growth stages, young plants are less affected by water stress with little to no effect on yield. It has been reported that water stress on corn should be avoided during the period from 12 leaves to blister [48]. More specifically, if water is limited during the vegetative phase and the grain-filling periods, high yield could still be obtained if water stress is avoided at the silking stage [49]. Our results and those from others [50,51] demonstrated that the extent of DM yield loss depends on severity, timing, and duration of the water stress. Our results also indicated that water saved early in the season could be used at late vegetative and early reproductive stages when corn plants are at their maximum water requirements.

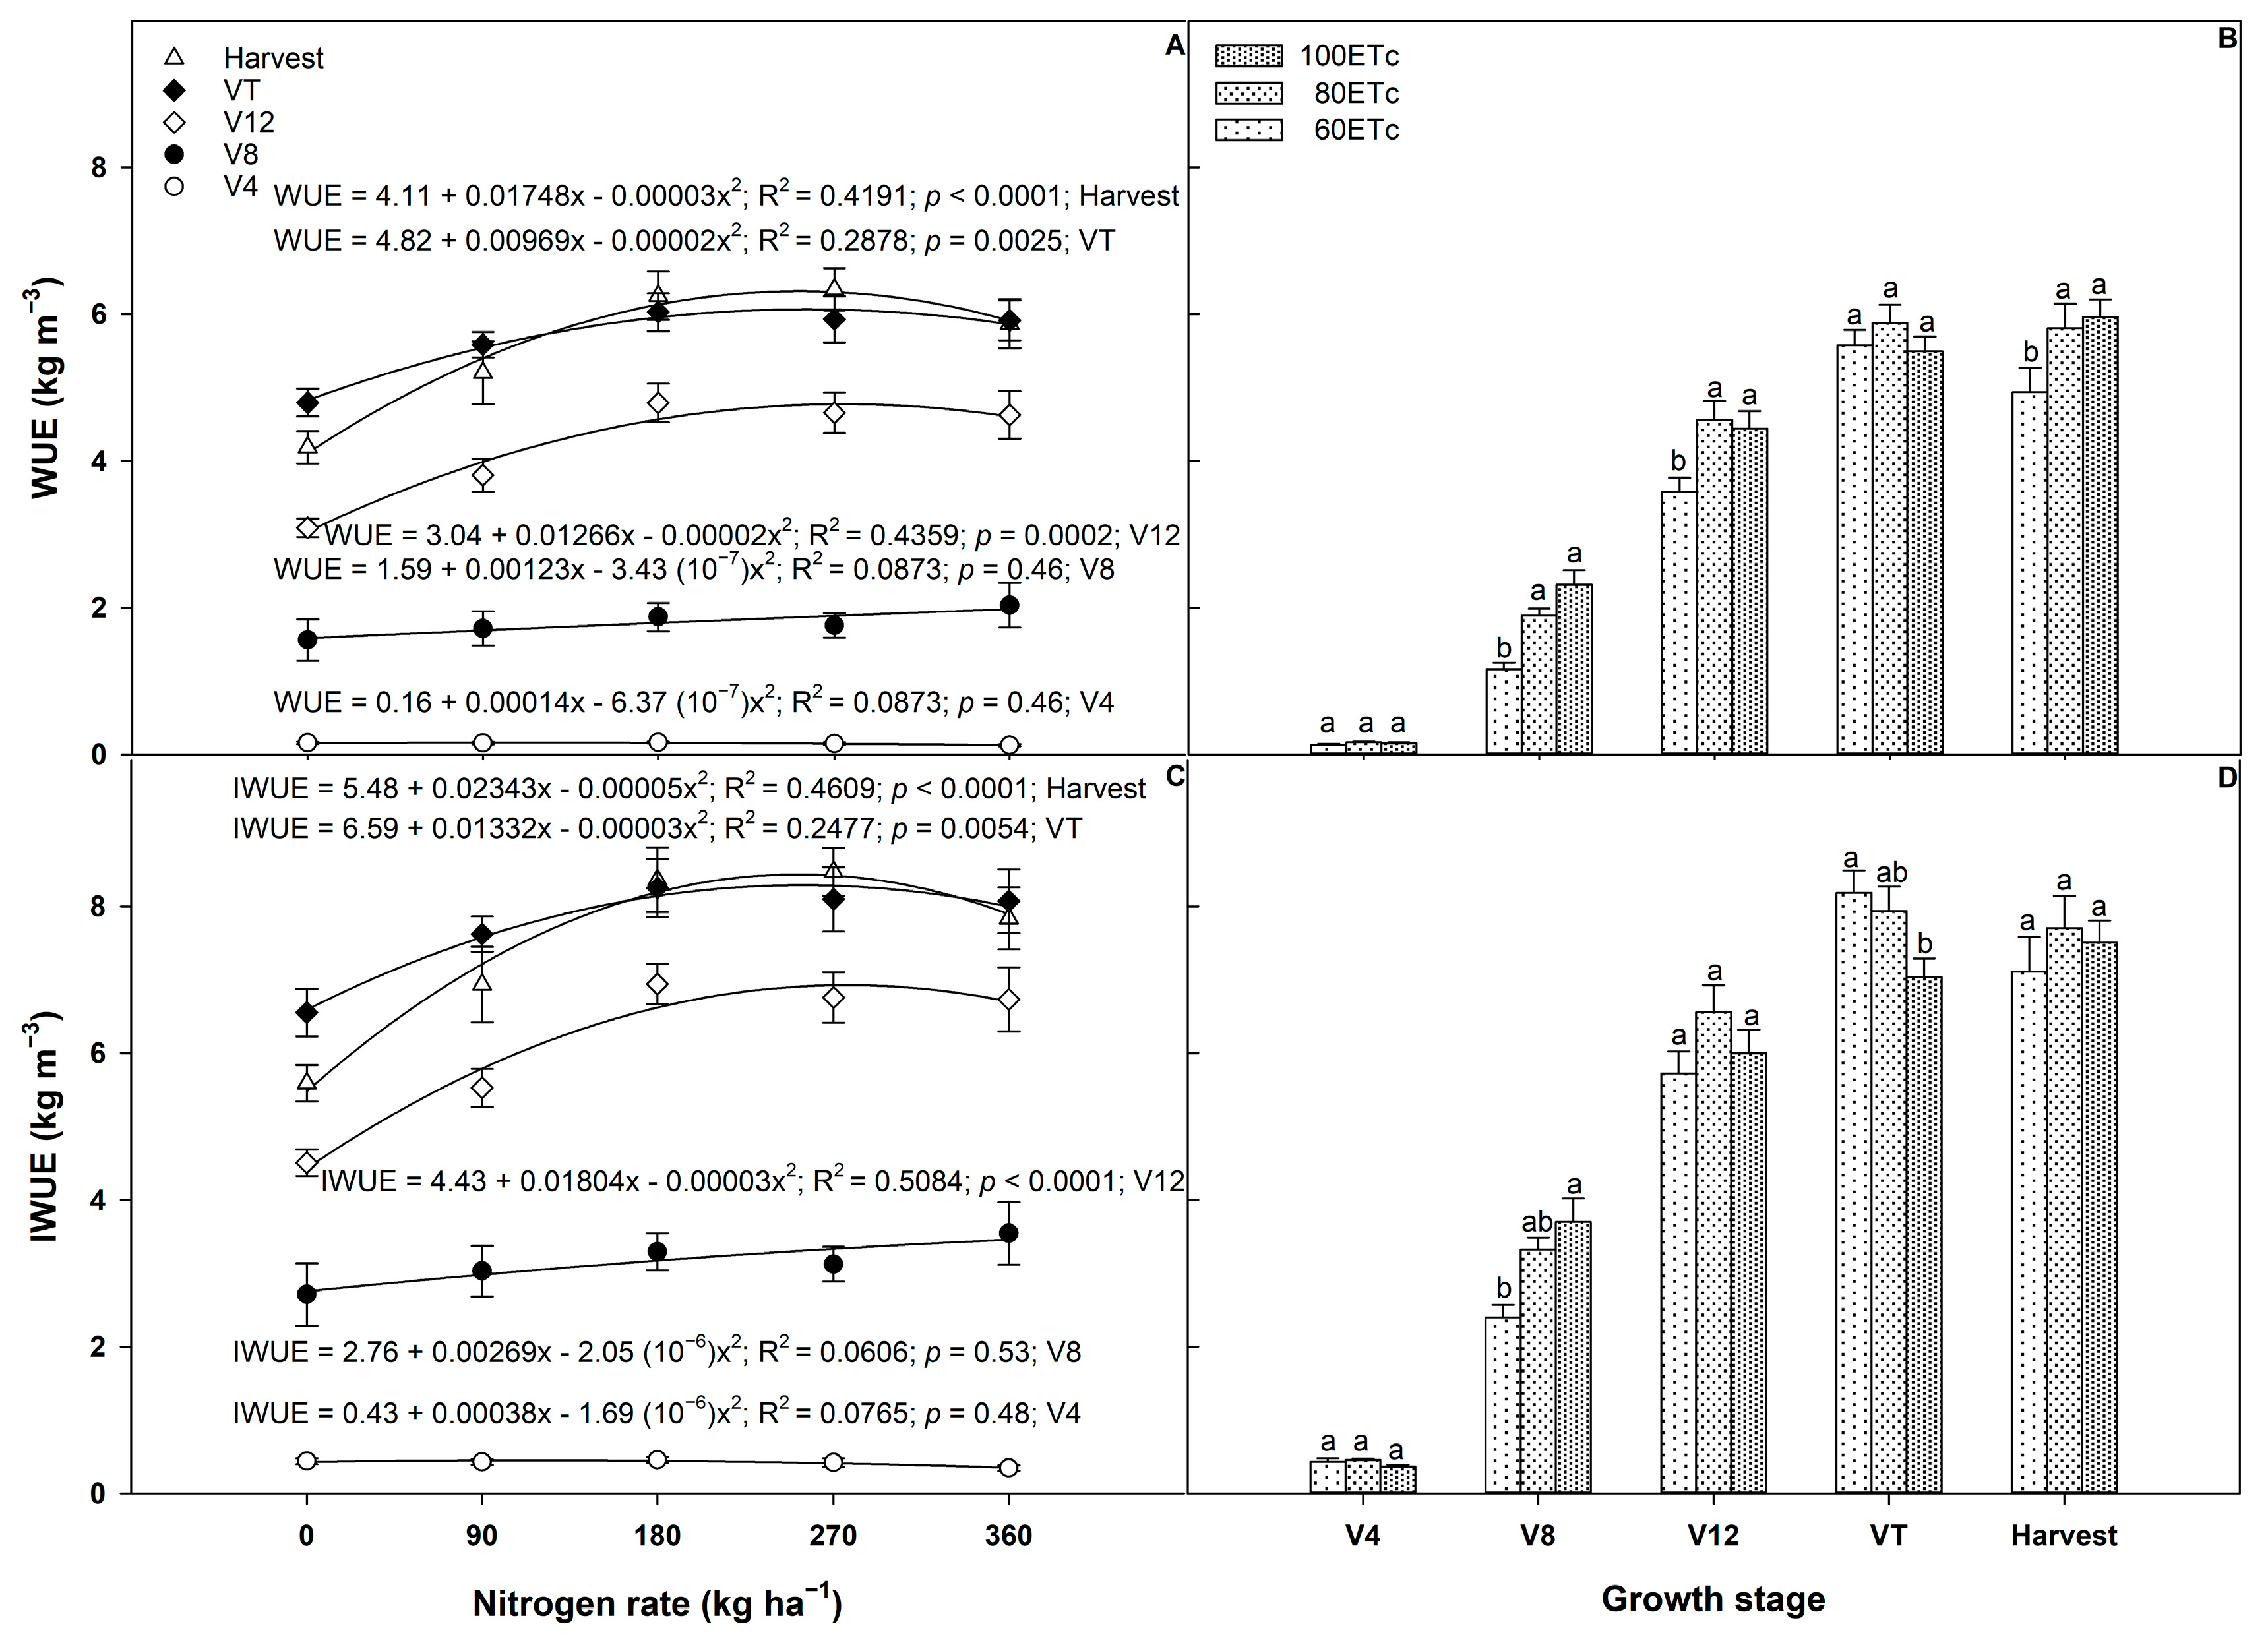
3.4. Water Use Efficiency and Irrigation Water Use Efficiency

The effects of year, N, and growth stage on WUE and IWUE were significant (Table 2). Additionally, the linear and quadratic polynomial responses of WUE and IWUE to N rates were significant (Table 2). In addition, the two-way interaction between the irrigation × growth stage and N × growth stage, and the linear and quadratic polynomial responses to N × growth stage interaction on both WUE and IWUE were significant (Table 2).
For different growth stages, the quadratic response to N rates showed increases in WUE at R4, VT, and V12 stages (Figure 5A). In general, high WUE values were observed at 180 and 270 kg N ha−1 (Table 4). The irrigation × growth stage interaction showed high WUEs at VT and R4 (Figure 5B). At R4, high but similar WUE values were observed for the 100ETc and 80ETc, while a low WUE was observed under 60ETc (Figure 5B). The IWUE showed similar pattern as WUE for both N × growth stage (Figure 5C) and irrigation × growth stage (Figure 5D) interactions. A high IWUE value was observed starting at the V12 growth stage (Figure 5C). At R4, high but similar IWUE values were observed at 180 and 270 kg N ha−1 (Table 4). Higher IWUE values were observed at VT and R4 compared to those at earlier growth stages (Figure 5D). At harvest (R4), IWUE did not differ among irrigation treatments; however, at anthesis (VT), the lowest IWUE was obtained at 100ETc (Figure 5D).
The seasonal crop WU, calculated using Equation (2), was 350 mm for full irrigation (100ETc) compared to 270 and 213 mm for 80ETc and 60ETc, respectively [52]. The WU by corn silage in the present study was less than amounts reported in literature [9,53,54]. High WUE and IWUE in the present study clearly indicate the higher efficiency of ODI compared to other irrigation methods (e.g., sprinkler and surface irrigation). Furthermore, N and irrigation strategies affected WUE and IWUE at late vegetative and mid reproductive stages. This is in agreement with previous studies. For instance, [55] reported that WUE increased with the intensity and the timing of water stress. Likewise, [9] showed that WUE increased when the crop was subject to early water stress treatments. Our results support the strategy that understanding the crop response to limited water at different growth stages may enable us to develop water-saving strategies such as deficit irrigation [56].

4. Conclusions

The study results demonstrated that N and irrigation water affected canopy height, LAI, DM yield, WUE, and IWUE of corn for silage. The combined effect of both irrigation water and N greatly affected the growth and yield of corn for silage at late vegetative to mid reproductive stages, suggesting that this period is the most critical to water stress. Overall, full irrigation (100ETc) and 180 kg·N·ha−1 provided the best combination for satisfactory growth and DM yield of corn for silage grown under ODI in the semi-arid region of Wyoming.

Author Contributions

A.N. set up the experiment, collected and analyzed data, and led the writing of the manuscript; M.A.I. supervised the overall project, guided the laboratory and field work, contributed to funding, and reviewed the manuscript; A.O.M. conceptualized the study, managed agronomic practices, provided funds, and reviewed the manuscript; A.G.G. helped in designing the project and funding management, and reviewed the manuscript.

Funding

This research received no external funding.

Acknowledgments

This project was supported by the Department of Plant Sciences and the Wyoming Agricultural Experiment Station. Thanks are given to the field and laboratory assistants of the Research and Extension Center located in Powell, Wyoming, USA.

Conflicts of Interest

The authors declare no conflicts of interest.

References

  1. Nilahyane, A.; Islam, M.A.; Mesbah, A.O.; Garcia y Garcia, A. Evaluation of silage corn yield gap: An approach for sustainable production in the semi-arid region of USA. Sustainability 2018, 10, 2523. [Google Scholar] [CrossRef]
  2. Bannayan, M.; Sanjani, S.; Alizadeh, A.; Lotfabadi, S.S.; Mohamadian, A. Association between climate indices, aridity index, and rainfed crop yield in northeast of Iran. Field Crops Res. 2011, 118, 105–114. [Google Scholar] [CrossRef]
  3. Pikul, J.L.; Hammack, L., Jr.; Riedell, W.E. Corn yield, nitrogen use, and corn rootworm infestation of rotations in the northern Corn Belt. Agron. J. 2005, 97, 854–863. [Google Scholar] [CrossRef]
  4. Hou, P.; Gao, Q.; Xie, R.; Li, S.; Meng, Q.; Kirkby, E.A.; Romheld, V.; Muller, T.; Zhang, F.; Cui, Z.; et al. Grain yields in relation to N requirement: Optimizing nitrogen management for spring maize grown in China. Field Crops Res. 2012, 129, 1–36. [Google Scholar] [CrossRef]
  5. Doorenbos, J.; Kassam, A.H. Yield Response to Water. Irrigation and Drainage Paper 33; FAO: Rome, Italy, 1979. [Google Scholar]
  6. Goorahoo, D.; Sharma, F.C.; Adhikari, D.D.; Benes, S.E. Irrigation, 6th ed.; Irrigation Association: Fairfax, VA, USA, 2011; p. 1045. [Google Scholar]
  7. Kim, K.; Clay, D.E.; Carlson, C.G.; Clay, S.A.; Trooien, T. Do synergistic relationships between nitrogen and water influence the ability of corn to use nitrogen derived from fertilizer and soil? Agron. J. 2008, 100, 551–556. [Google Scholar] [CrossRef]
  8. Mansouri-Far, C.; Sanavy, S.A.M.M.; Saberali, S.F. Maize yield response to deficit irrigation during low-sensitive growth stages and nitrogen rate under semi-arid climatic conditions. Agric. Water Manag. 2010, 97, 12–22. [Google Scholar] [CrossRef]
  9. Stone, P.J.; Wilson, D.R.; Reid, J.B.; Gillespie, R.N. Water deficit effects on sweet corn. I. Water use, radiation use efficiency, growth, and yield. Aust. J. Agric. Res. 2001, 52, 103–113. [Google Scholar] [CrossRef]
  10. Soler, C.M.T.; Hoogenboom, G.; Sentelhas, P.C.; Duarte, A.P. Impact of water stress on maize grown off-season in a subtropical environment. J. Agron. Crop Sci. 2007, 193, 247–261. [Google Scholar] [CrossRef]
  11. Pandey, R.K.; Maranville, J.W.; Admou, A. Deficit irrigation and nitrogen effects on maize in a Sahelian environment. I. Grain yield and yield components. Agric. Water Manag. 2000, 46, 1–13. [Google Scholar] [CrossRef]
  12. Echarte, L.; Rothstein, S.; Tollenaar, M. The response of leaf photosynthesis and dry matter accumulation to nitrogen supply in an older and a newer maize hybrid. Crop Sci. 2008, 48, 656–665. [Google Scholar] [CrossRef]
  13. Monneveux, P.; Zaidi, P.H.; Sanchez, C. Population density and low nitrogen affects yield-associated traits in tropical maize. Crop Sci. 2005, 45, 535–545. [Google Scholar] [CrossRef]
  14. Moser, S.B.; Feil, B.; Jampatong, S.; Stamp, P. Effects of preanthesis drought, nitrogen fertilizer rate, and variety on grain yield, yield components, and harvest index of tropical maize. Agric. Water Manag. 2006, 81, 41–58. [Google Scholar] [CrossRef]
  15. Sogbedji, J.M.; Van Es, H.M.; Yang, C.L.; Geohring, L.D.; Magdoff, F.R. Nitrate leaching and nitrogen budget as affected by maize nitrogen rate and soil type. J. Environ. Qual. 2000, 29, 1813–1820. [Google Scholar] [CrossRef]
  16. Nyfeler, D.; Huguenin-Elie, O.; Suter, M.; Frossard, E.; Connolly, J.; Lüscher, A. Strong mixture effects among four species in fertilized agricultural grassland led to persistent and consistent transgressive overyielding. J. Appl. Ecol. 2009, 46, 683–691. [Google Scholar] [CrossRef] [Green Version]
  17. Kenkel, P.; Fitzwater, B.; Causes of Fertilizer Price Volatility. Oklahoma State University. Oklahoma Cooperative Extension Service. AGEC-261. Available online: http://articles.extension.org/pages/72692/causes-of-fertilizer-price-volatility (accessed on 12 March 2015).
  18. Brown, B.B.; Hart, J.; Horneck, D.; Moore, A. Nutrient Management for Field Corn Silage and Grain in the Inland Pacific Northwest; PNW-615; Pacific Northwest Extension, University of Idaho: Moscow, IA, USA, 2010. [Google Scholar]
  19. Hu, H.; Ning, T.; Li, Z.; Han, H.; Zhang, Z.; Qin, S.; Zheng, Y. Coupling effects of urea types and subsoiling on nitrogen–water use and yield of different varieties of maize in northern China. Field Crops Res. 2013, 142, 85–94. [Google Scholar] [CrossRef]
  20. Berenguer, P.; Santiveri, F.; Boixadera, J.; Lloveras, J. Nitrogen fertilization of irrigated maize under Mediterranean conditions. Eur. J. Agron. 2009, 30, 163–171. [Google Scholar] [CrossRef]
  21. Gheysari, M.; Mirlatifi, S.M.; Bannayan, M.; Homaee, M.; Hoogenboom, G. Interaction of water and nitrogen on maize grown for silage. Agric. Water Manag. 2009, 96, 809–821. [Google Scholar] [CrossRef]
  22. Oktem, A. Effect of water shortage on yield, and protein and mineral compositions of drip-irrigated sweet corn in sustainable agricultural systems. Agric. Water Manag. 2008, 95, 1003–1010. [Google Scholar] [CrossRef]
  23. Akmal, M.; Janssens, M.J.J. Productivity and light use efficiency of perennial ryegrass with contrasting water and nitrogen supplies. Field Crop Res. 2004, 88, 143–155. [Google Scholar] [CrossRef]
  24. United States Department of Agriculture, National Resources Conservation Services. Web Soil Survey. Available online: http://websoilsurvey.sc.egov.usda.gov/App/HomePage.htm (accessed on 25 May 2017).
  25. Allen, R.G.; Pereira, L.S.; Raes, D.; Smith, M. Crop Evapotranspiration-Guidelines for Computing Crop Water Requirements, Irrigation and Drainage Paper 56; FAO: Rome, Italy, 1998. [Google Scholar]
  26. Walter, I.; Allen, R.; Elliott, R.; Jensen, M.; Itenfisu, D.; Mecham, B.; Howell, T.; Snyder, R.; Brown, P.; Echings, S.; et al. ASCE’s Standardized Reference Evapotranspiration Equation (ASCE). Watershed management. Oper. Manag. 2001, 2000, 1–11. [Google Scholar]
  27. Ritchie, S.W.; Hanway, J.J.; Benson, G.O. How a Corn Plant Develops. Spec. Rep. 48 (Revised); Iowa State University of Science and Technology, Cooperative Extension Service: Ames, IA, USA, 1993. [Google Scholar]
  28. Viets, F.G., Jr. Fertilizers and the efficient use of water. Adv. Agron. 1962, 14, 223–264. [Google Scholar]
  29. SAS Proprietary Software, version 9.4; SAS Institute Inc.: Cary, NC, USA, 2012.
  30. Bartlett, M.S. Properties of sufficiency and statistical tests. Proc. R. Soc. Lond. Ser. 1937, 160, 268–282. [Google Scholar] [CrossRef] [Green Version]
  31. Shapiro, S.S.; Wilk, M.B. An analysis of variance test for normality (complete samples). Biometrika 1965, 52, 591–611. [Google Scholar] [CrossRef]
  32. Iqbal, A.; Ayub, M.; Zaman, H.; Ahmad, R. Impact of nutrient management and legume association on agro-qualitative traits of maize forage. Pak. J. Bot. 2006, 38, 1079–1084. [Google Scholar]
  33. Hassan, S.W.; Oad, F.C.; Tunio, S.D.; Gandahi, A.W.; Siddiqui, M.H.; Oad, S.M.; Jagirani, A.W. Impact of nitrogen levels and application methods on agronomic, physiological and nutrient uptake traits of maize fodder. Pak. J. Bot. 2010, 42, 4095–4101. [Google Scholar]
  34. Stone, K.C.; Camp, C.R.; Sadler, E.J.; Evans, D.E.; Millen, J.A. Corn yield response to nitrogen fertilizer and irrigation in the southeastern coastal plain. Appl. Eng. Agric. 2010, 26, 429–438. [Google Scholar] [CrossRef]
  35. Yazar, A.; Howell, T.A.; Dusek, D.A.; Copeland, K.S. Evaluation of crop water stress index for LEPA irrigated corn. Irrig. Sci. 1999, 18, 171–180. [Google Scholar] [CrossRef]
  36. Zhang, Y.P.; He, W.Q.; Han, J. Effect of water stress on ecophysiologic properties of corn. Water Res. Eng. 1999, 10, 18–21. [Google Scholar]
  37. Song, Y.; Birch, C.; Qu, S.; Hanan, J. Maize canopy production under contrasted water regimes. Ann. Appl. Biol. 2010, 157, 111–123. [Google Scholar] [CrossRef]
  38. Warren, J.M.; Norby, R.J.; Wullschleger, S.D. Elevated CO2 enhances leaf senescence during extreme drought in a temperate forest. Tree Physiol. 2011, 31, 117–130. [Google Scholar] [CrossRef] [PubMed]
  39. Vargas, M.; Glaz, B.; Alvarado, G.; Pietragalla, J.; Morgounov, A.; Zelenskiy, Y.; Crossa, J. Analysis and interpretation of interactions in agricultural research. Agron. J. 2015, 107, 748–762. [Google Scholar] [CrossRef]
  40. Asghar, A.; Ali, A.; Asif, M.; Khaliq, T.; Abid, A.A. Growth and yield of maize (Zea mays L.) cultivars affected by NPK application in different proportion. Pak. J. Sci. 2010, 62, 211–216. [Google Scholar]
  41. Rudnick, D.R.; Irmak, S.; Ferguson, R.B.; Shaver, T.; Djaman, K.; Slater, G.; Bereuter, A.; Ward, N.; Francis, D.; Schmer, M.; et al. Economic return versus crop water productivity of maize for various nitrogen rates under full irrigation, limited irrigation, and rainfed settings in south central Nebraska. J. Irrig. Drain. Eng. 2016, 142, 04016017. [Google Scholar] [CrossRef]
  42. Ullah, M.I.; Khakwani, A.A.; Sadiq, M.; Awan, I.; Munir, M.; Ghazanfarullah. Effects of nitrogen fertilization rates on growth, quality and economic return of fodder maize (Zea mays L.). Sarhad J. Agric. 2015, 31, 45–52. [Google Scholar]
  43. Hugh, J.E.; Richard, F.D. Effect of drought stress on leaf and whole canopy radiation use efficiency and yield of maize. Agron. J. 2003, 95, 688–696. [Google Scholar]
  44. Lindquist, J.L.; Arkebauer, T.J.; Walters, D.T.; Gassman, K.G.; Dobermann, A. Maize radiation use efficiency under optimal growth conditions. Agron. J. 2005, 97, 72–78. [Google Scholar] [CrossRef]
  45. Hammad, H.M.; Ahmad, A.; Abbas, F.; Farhad, W.; Cordoba, B.C.; Hoogenboom, G. Water and nitrogen productivity of maize under semiarid environments. Crop Sci. 2015, 55, 877–888. [Google Scholar] [CrossRef]
  46. Çakir, R. Effect of water stress at different development stages on vegetative and reproductive growth of corn. Field Crops Res. 2004, 89, 1–16. [Google Scholar] [CrossRef]
  47. NeSmith, D.S.; Ritchie, J.T. Effects of soil water deficits during tassel emergence on development and yield component of maize (Zea mays). Field Crops Res. 1992, 28, 251–256. [Google Scholar] [CrossRef]
  48. Stegman, E.C.; Faltoun, M.A. Corn Yield Responses to Water Stress Management; ASAE: St. Joseph, MI, USA, 1978. [Google Scholar]
  49. Igbadun, H.E.; Tarimo, A.K.; Salim, B.A.; Mahoo, H.F. Evaluation of selected crop water production functions for an irrigated maize crop. Agric. Water Manag. 2007, 94, 1–10. [Google Scholar] [CrossRef]
  50. Farooq, M.; Wahid, A.; Kobayashi, N.; Fujita, D.; Basra, S.M.A. Plant Drought Stress: Effects, Mechanisms and Management; Sustainable Agriculture, Lichtfouse, E., Navarrete, M., Debaeke, P., Souchere, V., Alberola, C., Eds.; Springer: Dordrecht, The Netherlands, 2009; pp. 153–188. [Google Scholar]
  51. Karam, F.; Breidy, J.; Stephan, C.; Rouphael, J. Evapotranspiration, yield and water use efficiency of drip irrigated corn in the Bekaa Valley of Lebanon. Agric. Water Manag. 2003, 63, 125–137. [Google Scholar] [CrossRef]
  52. Nilahyane, A.; Islam, M.A. Different Irrigation Systems and Nitrogen Rates Improve Yield and Water Use Efficiency of Corn Silage; University of Wyoming Extension: Laramie, WY, USA, 2018. [Google Scholar]
  53. Braunworth, W.S.J.; Mack, H.J. Evaluation of irrigation scheduling methods for sweet corn. J. Am. Soc. Hortic. Sci. 1987, 112, 29–32. [Google Scholar]
  54. Petersen, K.L.; Mack, H.J.; Cuenca, R.H. Effect of tillage on the crop-water production function of sweet corn in West Oregon. Hortic. Sci. 1985, 20, 901–903. [Google Scholar]
  55. Pereira, L.S.; Paredes, P.; Sholpankulov, E.D.; Inchenkova, O.P.; Teodoro, P.R.; Horst, M.G. Irrigation scheduling strategies for cotton to cope with water scarcity in the Fergana Valley, Central Asia. Agric. Water Manag. 2009, 96, 723–735. [Google Scholar] [CrossRef]
  56. Fang, Q.X.; Ma, L.; Nielsen, D.C.; Trout, T.J.; Ahuja, L.R.; Lascano, R.J. Quantifying corn yield and water use efficiency under growth stage–based deficit irrigation conditions. Adv. Agric. Syst. Model. 2014, 5, 1–24. [Google Scholar]
Figure 1. Weather conditions in 2014 and 2015 growing seasons at Powell, WY. DOY = Day of the year. VE = Emergence. Vn = Vegetative stage. VT = Tasseling. Rn = Reproductive stage.
Agronomy 08 00208 g001
Figure 2. Cumulative crop evapotranspiration (mm) from FAO Penman–Monteith (ETc-pm) and water balance equations (ETc-wb) in 2014 and 2015.
Agronomy 08 00208 g002
Figure 3. Means of canopy height (A) and leaf area index (LAI) (B) response to irrigation water for irrigation–growth stage interaction. Within each growth stage, means followed by the same letters are not significantly different based on the LSD (0.05). The error bars indicate the standard errors. 100ETc = 100% crop evapotranspiration (ETc), 80ETc = 80% ETc, 60ETc = 60% ETc; V4 = the fourth collar leaf appears; V8 = the eighth collar leaf appears; V12 = the twelfth collar leaf appears; VT = tasseling; and Harvest = dough stage (R4).
Agronomy 08 00208 g003
Figure 4. Means of DM yield response to N fertilizer for N × growth stage interaction (A), and to irrigation water for irrigation × growth stage interaction (B). Within each growth stage, means followed by the same letters are not significantly different based on the LSD (0.05). The error bars indicate the standard errors. 100ETc = 100% ETc, 80ETc = 80% ETc, 60ETc = 60% ETc; V4 = the fourth collar leaf appears; V8 = the eighth collar leaf appears; V12 = the twelfth collar leaf appears; VT = tasseling; and Harvest = dough stage (R4).
Agronomy 08 00208 g004
Figure 5. Means of water use efficiency (WUE) response to N fertilizer for N × growth stage interaction (A), and to irrigation water for irrigation × growth stage interaction (B); means of irrigation water use efficiency (IWUE) response to N fertilizer for N × growth stage interaction (C), and to irrigation water for irrigation × growth stage interaction (D). Within each growth stage, means (B,D) followed by same letters are not significantly different based on the LSD (0.05). The error bars indicate the standard errors. 100ETc = 100% ETc (crop evapotranspiration), 80ETc = 80% ETc, 60ETc = 60% ETc; V4 = the fourth collar leaf appears; V8 = the eighth collar leaf appears; V12 = the twelfth collar leaf appears; VT = tasseling; Harvest = dough stage (R4).
Agronomy 08 00208 g005
Table 1. Pearson’s correlation coefficient (r) calculated from estimated crop evapotranspiration (ETc-pm) and measured (ETc-wb) for three irrigation treatments in the on-surface drip experiment in 2014 and 2015 growing seasons.
Irrigation Treatment20142015
rp-Value §rp-Value §
100ETc0.862<0.0010.785<0.001
80ETc0.882<0.0010.774<0.001
60ETc0.810<0.0010.7570.0011
§ Significance at the 0.05 probability level.
Table 2. Probability levels (p-values) and degree of freedom (df) of main effects, two-way, and three-way interactions for canopy height (cm), LAI (m2 m−2), dry matter (DM) yield (Mg ha−1), water use efficiency (WUE; kg m−3), and irrigation water use efficiency (IWUE; kg m−3) in the on-surface drip experiment with three irrigation treatments, five nitrogen (N) rates, and five growth stages. Nitrogen rates are partitioned into linear, quadratic, cubic and quartic orthogonal polynomial contrasts.
SourcedfCanopy HeightLAIDM YieldWUEIWUE
p-value
Year10.00130.00350.01<0.0001<0.0001
Irrigation (I)2<0.0001<0.00010.00010.090.55
Nitrogen (N)4<0.0001<0.0001<0.0001<0.0001<0.0001
Linear N1<0.0001<0.0001<0.0001<0.0001<0.0001
Quadratic N10.0004<0.0001<0.0001<0.0001<0.0001
Cubic N10.530.660.950.980.98
Quartic N10.430.360.370.200.19
Stage (S)4<0.0001<0.0001<0.0001<0.0001<0.0001
I × N80.800.930.780.920.95
Linear I × N20.160.410.450.860.98
Quadratic I × N20.820.950.300.350.39
Cubic I × N20.940.800.850.780.78
Quartic I × N20.820.720.810.830.85
S × I80.020.01<0.00010.010.003
S × N160.340.54<0.00010.00070.0029
Linear S × N40.060.07<0.0001<0.00010.0002
Quadratic S × N40.690.850.00020.010.02
Cubic S × N40.990.470.890.880.87
Quartic S × N40.950.870.980.930.93
I × N × S321.001.001.000.980.98
Linear I × S × N80.940.590.970.750.63
Quadratic I × S × N80.990.970.870.760.77
Cubic I × S × N81.000.890.990.970.97
Quartic I × S × N80.950.980.740.790.80
Block (Year)40.440.940.991.001.00
Block × I100.250.00250.0001<0.0001<0.0001
Table 3. Mean values of canopy height (cm) and LAI (m2 m−2) for the N effect in the on-surface drip experiment including three irrigation treatments, five N rates, and five growth stages.
Nitrogen (kg ha−1)Canopy Height §LAI §
0132c1.97b
90143b2.30a
180150a2.46a
270151a2.42a
360151a2.37a
§ Within a column, means followed by the same letters are not significantly different based on the LSD (0.05).
Table 4. Mean values of DM yield (Mg ha−1), WUE (kg m−3), and IWUE (kg m−3) for the N × growth stage (S) interaction in the on-surface experiment including three irrigation treatments, five N rates, and five growth stages.
Growth StageN Rates (kg ha−1)
090180270360
Dry Matter Yield §
V40.09a0.09a0.10a0.09a0.07a
V81.53a1.66a1.82a1.69a2.00a
V124.27c5.28bc6.63a6.44ab6.36ab
VT8.83b10.21a10.91a10.85a10.97a
R410.70c13.44b15.84a16.16a14.90a
Water Use Efficiency §
V40.16a0.16a0.17a0.15a0.13a
V81.56a1.72a1.88a1.76a2.04a
V123.09c3.81b4.79a4.66a4.63a
VT4.79b5.58a6.03a5.93a5.92a
R43.86c4.79b5.77a5.85a5.42ab
Irrigation Water Use Efficiency §
V40.44a0.43a0.46a0.42a0.35a
V82.71a3.03a3.30a3.12a3.55a
V124.51c5.53b6.94a6.76a6.73a
VT6.55c7.62a8.25a8.10a8.07a
R45.59c6.94b8.36a8.47a7.84ab
§ Within a row, means followed by the same letters are not significantly different based on the LSD (0.05). V4 = the fourth collar leaf appears; V8 = the eighth collar leaf appears; V12 = the twelfth collar leaf appears; VT = tasseling; and R4 = dough stage [52].

