Article

Assessing the Individual and Combined Effects of QTL for Adult Plant Stripe Rust Resistance Derived from Cappelle-Desprez

1
Department of Plant Sciences, University of the Free State, PO Box 339, Bloemfontein 9300, South Africa
2
CenGen (Pty) Ltd., 78 Fairbairn Street, Worcester 6850, South Africa
3
Department of Genetics, Stellenbosch University, Private Bag X1, Matieland 7602, South Africa
4
National Institute of Agricultural Botany, Huntingdon Road, Cambridge CB3 0LE, UK
*
Author to whom correspondence should be addressed.
Submission received: 4 February 2019 / Revised: 4 March 2019 / Accepted: 12 March 2019 / Published: 25 March 2019
(This article belongs to the Special Issue Cereal Rust Management for Improving Global Food Security)

Abstract

:
The release of commercial wheat cultivars resistant to stripe rust, caused by Puccinia striiformis f. sp. tritici (Pst), remains one of the primary objectives in many breeding programs. Previous studies of adult plant resistance derived from the winter wheat cultivar Cappelle-Desprez identified the quantitative trait loci (QTL) QYr.ufs-2A, QYr.ufs-2D, QYr.ufs-5B and QYr.ufs-6D to affect stripe rust under South African conditions. Phenotypic field assessment, fluorescence microscopy and molecular analysis were used to characterise recombinant inbred lines differing in number and combinations of these QTL. Besides the confirmation of enhanced resistance through co-occurring resistance loci, varying levels of defence, conditioned by different QTL combinations were observed. Carriers of QYr.ufs-2A or QYr.ufs-2D, accompanied by at least one other QTL, exhibited higher resistance levels than lines with a single QTL. The knowledge gained in this study will help wheat breeders to develop cultivars with more diverse combinations and potentially more durable sources of stripe rust resistance.

1. Introduction

Stripe (yellow) rust, caused by the fungus Puccinia striiformis Westend. f. sp. tritici (Pst), is a major threat to global wheat (Triticum aestivum L.) production, an industry already under pressure due to increasing demand. Fungicide applications are costly, dependent on knowledge of spray technology, and availability of associated infrastructure and products. Moreover, chemical management is often inefficient under severe stripe rust epidemics that occur late in the growing season. The use of resistant cultivars therefore represents an effective approach to reduce damage caused by Pst [1].
Resistance to Pst is largely considered as either seedling resistance, i.e., all-stage resistance (ASR), or adult plant resistance (APR), expressed at advanced growth stages [2]. ASR is generally conferred by single, major genes. Typically race-specific, ASR frequently succumbs to new Pst pathotypes (races) emerging as a result of mutation or recombination [3,4]. The wind-borne nature of Pst urediniospores further assists in the migration of races to regions where they have not occurred before [5]. The majority of more than 70 wheat stripe rust resistance genes catalogued to date [6] are categorized as ASR, most of which are ineffective against current races of Pst. More emphasis needs to be placed on race non-specific, durable APR when developing wheat cultivars [7]. According to Wang and Chen [8], 327 stripe rust resistance quantitative trait loci (QTL) have been reported in various wheat genotypes. The continuous process of identifying and introgressing multiple sources of resistance with complementary and/or additive effects into wheat cultivars is paramount for the attainment of durability. Mundt [9] mentioned that durability might be linked to gene pyramids involving APR. Although combinations of minor, slow rusting APR genes have enabled cultivars to remain resistant for many years, even when commercialized over large areas [7,10], race specificity for some wheat stripe rust APR genes has been reported [11].
Due to the importance of stripe rust in South Africa (SA), wheat breeders are constantly tasked with introducing durable resistance into new cultivars. The evaluation of new and diverse sources of resistance is an important aspect in these efforts. A source of durable stripe rust APR has been recognized in the French wheat cultivar Cappelle-Desprez [12]. In SA, high levels of resistance have been associated with Cappelle-Desprez since its first evaluation in 1998 [13,14]. Cappelle-Desprez carries the ASR genes Yr3a and Yr4a [15] on chromosomes 1B and 6B, respectively [16]. Whole chromosome analyses showed APR in Cappelle-Desprez to be imparted by Yr16 located on chromosome 2D [17], as well as the 5BS-7BS translocation [18]. Lagudah et al. [19] proposed a yet undescribed locus conveying resistance to leaf rust, caused by Puccinia triticina Eriks. in Cappelle-Desprez, after specific markers confirmed the absence of Lr34/Yr18/Pm38 previously suspected to contribute to the leaf rust APR in this cultivar [20].
Derived from Cappelle-Desprez, the breeding line Yr16DH70, which lacks ASR genes, was selected based on its APR to Pst and adaption to SA wheat growing conditions [14]. Yr16DH70 was crossed with the moderately susceptible SA wheat cultivar Palmiet, and a recombinant inbred line (RIL) mapping population (MP), consisting of 201 entries, was established [14]. Following several years of field evaluation, a major effect QTL on chromosome 2A (QYr.ufs-2A), in addition to three minor effect QTL on chromosomes 2D (QYr.ufs-2D), 5B (QYr.ufs-5B) and 6D (QYr.ufs-6D), were mapped in Yr16DH70 against Pst race 6E22A+ [14]. The contribution of QYr.ufs-2A to the phenotypic variation in Yr16DH70 amounted to 53.2% for reaction type (RT) and 47.8% for leaf area infected (LAI) [14]. Although a considerable proportion of the stripe rust resistance can be ascribed to QYr.ufs-2A, its effect can be further enhanced through combination with smaller QTL, demonstrated by its significant interactions with the three minor QTL from Yr16DH70. This locus is of particular interest, as multiple cases have been reported of stripe rust resistance QTL located within a common interval on the short arm of chromosome 2A (e.g., [21,22,23]).
QYr.ufs-2D in Cappelle-Desprez covers the centromeric region of chromosome 2D, including the locus of Yr16 [17], conferring seemingly less effective resistance under severe disease pressure. The genetic background, as well as the environmental conditions may add to the reduced penetrance of this minor QTL [14,22]. Up to 10.3% of the phenotypic variance in Yr16DH70 was ascribed to QYr.ufs-2D [14]. Cappelle-Desprez contains the 5BL-7BL and 5BS-7BS translocations, with the 5BS chromosome arm previously implicated as the main contributor of the translocation resistance effect [18]. The 5BS-7BS translocation has been retained in line Yr16DH70 and lower stripe rust scores were reported for lines containing both the minor QTL QYr.ufs-2D and QYr.ufs-5B [14]. The ASR genes Yr20 and Yr23 [24], and more recently the APR gene, Yr77 [6], have been allocated to chromosome 6D. QYr.ufs-6D on the long arm of 6D also confers a small effect towards stripe rust resistance in Yr16DH70, contributing a maximum of 7.6% of the phenotypic variation [14].
Palmiet was found to carry a minor stripe rust resistance QTL on chromosome 4B, QYr.ufs-4B [14]. However, QYr.ufs-4B was only detected with the host RT phenotypic data, explaining a maximum of 11.7% of the phenotypic variance, which was dependent on disease pressure and environmental factors.
In this study we selected RILs from the Yr16DH70 × Palmiet MP that carried different putative combinations of the stripe rust resistance QTL derived from Cappelle-Desprez. Eighteen lines were selected, with only four QTL groupings present in duplicate. Further evaluation of these lines was undertaken to improve our understanding of possible complementary effects between different APR QTL in these wheat RILs. Traditional phenotypic assessments, along with histological analysis and an estimation of fungal biomass, were employed to gain insight into host-pathogen interactions.

2. Materials and Methods

2.1. Plant and Pathogen Materials

Previous groupings of QTL carriers were based on the closest QTL markers [14]. Carriers and non-carriers of the respective QTL were identified for initial selection of F6 Palmiet × Yr16DH70 (pedigree: CappelleDesprez/Palmiet) RILs. The genotype data was reassessed prior to host-pathogen interaction studies, using the strict selection criteria of having all the markers across the Cappelle-Desprez-derived QTL intervals. The resultant F8 RILs were again genotyped to validate the previously predicted QTL (QTL areas mostly fixed) (Table S1). The requirement to identify RILs not carrying QYr.ufs-4B from Palmiet limited the number of lines that could be selected. Other exceptions were cases such as RIL 17, RIL 52 and RIL 153, that despite carrying the Cappelle-Desprez 192 bp allele for WMC177 lacked the closest marker GWM636, so were considered not to carry QYr.ufs-2A. Conversely, RIL 39 was considered a QYr.ufs-2A carrier despite exhibiting the Palmiet allele (190 bp) for WMC177. In view of the wide coverage of resistance QTL combinations appraised in this study, and for the purpose of simplicity, each QTL will be abbreviated to its chromosome location, e.g., 2A refers to a RIL carrying resistance QTL QYr.ufs-2A, and 2A+2D represents a RIL carrying the QTL combination QYr.ufs-2A and QYr.ufs-2D, etc.
Eighteen F8 RILs accompanied by the parental lines were planted in a rust screening nursery at the Pannar Redgates research facility near Greytown, KwaZulu-Natal, SA during the first week of June 2015. Entries were planted in single 1-m rows, spaced 76 cm apart, in two replications. To facilitate sufficient inoculum development within the nursery, rows of stripe rust spreader (a mixture of stripe rust susceptible entries Morocco and line JIC871) were planted perpendicular to entry rows as well as every tenth entry in the trial. Using an ultra-low volume sprayer (ULVA, Micron Group, Bromyard, England), spreader rows were inoculated at tillering (growth stages 21 to 29 [25]) with fresh Pst urediniospores of race 6E22A+ suspended in Soltrol® 130. This race, virulent to Yr2, 6, 7, 8, 17, 25 and A, and avirulent to Yr1, 3a, 4a, 4b, 5, 9, 10, 15, 27 [26], was also used in the studies by Agenbag et al. [14]. Following inoculation, several 1-m sections of spreader plants were covered with plastic sheeting overnight to provide high humidity for maximum infection. Data and/or leaf tissue were collected on 17 September 2015 (first sampling) and 1 October 2015 (second sampling), when most of the entries were between growth stages 49–51 and 65–69, respectively.

2.2. Phenotypic Analysis

Mean flag leaf disease severity and adult plant RT per line were recorded at both sampling time points. Disease severity was recorded in accordance with the modified Cobb scale [27] where the numerical value corresponds to the flag LAI (100% signifies the flag leaf blade completely covered with rust pustules). In addition, host RT was specified as resistant (R), moderately resistant (MR), moderately susceptible (MS) and susceptible (S). A coefficient of infection (CI) was calculated by multiplying LAI and constant values assigned to host RT, namely: R = 0.2, MR = 0.4, MRMS = 0.6, MS = 0.8 and S = 1.0 [28], as well as to intermediate categories RMR = 0.3 and MSS = 0.9.

2.3. Fluorescence Microscopy

Growth of Pst colonies and associated host cell necrosis (HCN) were viewed and quantified in flag leaves of RILs by means of fluorescence microscopy. During the first sampling, two fully exposed flag leaves representative of each entry were cut into 3–5 cm segments and transferred to 3:1 (v/v) ethanol:dichloromethane containing 0.15% (w/v) trichloroacetic acid. Leaves were fixed and cleared in this solution for 24 h. The Uvitex staining of fungal structures and host cell reaction were based on a modified Rohringer et al. [29] procedure. Specimens were drenched twice in 50% ethanol for 15 min, twice for 15 min in 0.05 M sodium hydroxide and washed three times with distilled water. Leaf segments were then immersed in 0.1 M Tris/HCL buffer (pH 8.5) and stained with preheated 0.1% (w/v) Uvitex 2B (Polysciences Inc, Warrington, PA, USA) [30,31] in the preceding buffer (65 °C for 5 min [32]). Samples were rinsed four times with water and saturated with 25% (v/v) aqueous glycerol for 30 min. Stained leaves were kept in 50% (v/v) glycerol with a trace lactophenol.
To compare the degree of Pst colonisation among the RILs, the length (µm) of individual fungal colonies, growing parallel to the veins within the flag leaf, was measured. Observations on 40 infection sites per line (20 on each of two flag leaf samples) were carried out for each field replicate using an Olympus AX70 microscope (Tokyo, Japan), magnifying from X4 up to X100. The WB epifluorescence cube (330–385 nm excitation filter and 420 nm barrier filter) was used to observe fluorescing fungal tissue. The autofluorescence in wheat tissue, indicative of cell death, was perceived via the WU epifluorescence cube (450–480 nm excitation filter and 515 nm barrier filter). Images of fungal structures and HCN were captured using a CC12 digital camera and AnalySIS LS Research version 2.2 software (Soft Imaging System GmbH, Münster, Germany). At the point of sampling, fully integrated colonies from the initial inoculation complicated the reliable quantification of individual colony sizes and associated HCN. Therefore, mostly smaller secondary infection points were measured. Furthermore, while Pst has a very distinctive host-invasive growth pattern, even compared to other wheat rust pathogens, the presence of other microorganisms with chitin structural components had to be distinguished from Pst.
A hypersensitivity index (HI) was calculated by dividing the length of necrosis with the colony length. An index greater than one indicates that necrosis exceeds the visible mycelia, with fungal growth possibly inhibited by a strong hypersensitive response [33]. Leaves were not collected for histology during the second sampling time as infection levels were too advanced to allow microscopic discernment of individual colonies.

2.4. Molecular Analysis

The development of fungal biomass was quantified at two time points, 14 days apart, according to a method based on relative gene expression [34]. This approach entails the expression of a target gene relative towards a reference gene. Segments of fully exposed flag leaves were submerged in RNAlaterTM (Ambion Inc, Austin, TX, USA) and stored at 4 °C. The same method was followed at the second sampling time to measure the development of rust infection over time. Leaf segments were powdered in liquid nitrogen and stored at −80 °C for subsequent analysis.
Ribonuclease free water was used for the RNA extraction and ensuing testing. The preparation requires 0.1% (v/v) dimethyldicarbonate (DMDC) added to deionised water, incubated overnight at room temperature, and autoclaved twice to inactivate the DMDC. Trizol reagent (Invitrogen™, Carlsbad, California, USA) was used in line with the manufacturer’s instructions to extract total RNA from 100 µL of flag leaf tissue [35]. The frozen tissue was partially thawed and submerged in 500 µL Trizol reagent at room temperature for 10 min before 100 µL chloroform was added. Following 5 min of incubation, samples were centrifuged at 12,000× g for 15 min at 4 °C. The cleared supernatant was transferred to 250 µL isopropanol for the precipitation of RNA. Following a 10-min incubation period, tubes were centrifuged at 12,000× g for 10 min at 4 °C. Once the RNA pellet was retrieved using a water jet pump, it was rinsed with 70% (v/v) ethanol. The air-dried RNA was then dissolved in 100 µL DMDC treated water. Due to the number of samples and limited resources, RNA of the two leaves of each line harvested at each time point was pooled, while the two sampling times and field replicates remained separate.
The RNA concentration of the samples was calculated using a Nanodrop2000 Spectrophotometer (Thermo Scientific, Waltham, Massachusetts, USA), with DMDC treated water as blank [36]. The integrity of the RNA was confirmed through electrophoresis by separating 100 ng on a 1.2% (w/v) agarose gel [37] prepared in 0.5× TAE (20 mM Tris-HCl pH 8.0, 0.5 mM EDTA, 0.28% (v/v) acetic acid) containing 0.5 μg/mL ethidium bromide. Exposed to ultraviolet light illumination (302 nm), the gel was photographed utilizing the Gel Doc XR+ System (Bio-Rad, Hercules, California, USA) and Quantity One 4.6 program. Although the RNA concentrations were very low, intact RNA bands were observed. Quantitative reverse transcription polymerase chain reaction (RT-qPCR) was carried out with a Bio-Rad C1000 thermal cycler connected to a CFX96 real-time attachment, using KAPATM SYBR® FAST Universal One-Step qRT-PCR Kit (Lasec). For assessment of Pst biomass and development, the constitutively expressed Pst β-tubulin [38] was quantified in reference to the constitutive expression of 18S ribosomal RNA (18S) in wheat over the time course for each RIL. The forward and reverse primer sequence information of 18S in wheat, validated as acceptable for Pst gene expression [39], was used for the amplification of the reference gene. The RT-qPCR primer pair for Pst β-tubulin was developed using the web-based program Primer3, laid out in Table S2.
To standardize the primers for RT-qPCR, a temperature gradient and subsequent electrophoresis was carried out to decide on annealing temperatures optimal for each primer set. A standard curve reaction was performed making use of a 1:2 dilution series. Amplification efficiency of each primer pair was determined and the resulting amplicon confirmed by separating the standard curve reactions on 1.2% (w/v) agarose gel (as described before). The primers for both 18S and Pst β-tubulin showed the most accurate amplification at 60 °C with R2 values of 0.952 and 0.986, respectively (Table S2). Once the primer sets were optimized, expression of the experimental Pst β-tubulin gene was tested. Each 10 μL RT-qPCR reaction contained 10 ng total RNA, 10 μM of both forward and reverse primer (Table S2), 5 μL KAPA Master Mix buffer, 0.2 μL KAPA Reverse Transcriptase Mix and 1.8 μL DMDC treated water. The RT-qPCR protocol entails an initial step of 42 °C for 10 min and a denaturing step of 95 °C for 3 min. The following steps were repeated 40 times for the synthesis of cDNA: an additional 10-s denaturing step at 95 °C and 30 s of specific annealing temperature for primer annealing and elongation. Upon completion of each cycle, the plate was read for quantity SYBR green bound to double stranded nucleic acid. The incorporation of a melt curve, with 0.5 °C increments every 5 s from 65–95 °C, confirmed the absence of non-specific amplicons. The plate was read again once the reaction was completed.
Using qBase+ software (version 3.1 Biogazelle, Zwijnaarde, Belgium), RT-qPCR data analysis of 20 wheat lines infected with Pst race 6E22A+ was done with every experiment consisting of two field replicates at each of the two sampling time points. The relative gene expression, expressed in the form of CNRQ (Calibrated Normalized Relative Quantity) values, and standard errors were calculated after quantification cycle (Cq) values were imported. Significant outliers were excluded for each set of four technical replicates.

2.5. Statistical Analysis

Stripe rust data for RILs and parental lines were analysed for variance (ANOVA) using the General Linear Models procedure in NCSS 2007 to account for the effects of genotypes, field replications and sampling times. Fisher’s protected least significant difference (LSD) was calculated where appropriate. Spearman’s rank correlation (rs) was used for evaluation of parameters quantified across different techniques.

3. Results

3.1. Phenotypic Analysis of Stripe Rust Field Infections

The extent of disease severity, quantitatively measured as LAI [40], was between 5 and 50% at the first sampling and 20 to 90% during the second sampling (Table 1). Distinct differences in APR responses were noted among entries carrying different QTL combinations, with host RT ranging from RMR to MSS during the first sampling, and more resistant RTs being recorded during the second sampling (R to MS).
Quantitative analysis of the combined LAI and host plant RT was carried out by calculating CI values. ANOVA pointed to highly significant differences in CI values among test RILs and across sampling times (p ≤ 0.01). However, the line-sampling time interaction proved insignificant (p = 0.16). Similar trends in CI values between the two field trial repetitions were observed (p = 0.12; Table 1).
Most RILs showed an increase in CI values from the first to the second sampling. Exceptions were seen in some of the more resistant genotypes, where CI values remained the same or marginally decreased between the two sampling dates. Since the host RT for all RILs were either the same or more resistant during the second scoring, the increased CI values were mainly attributed to an increase in LAI. The biggest increases in LAI and CI values over the 14-day interval were observed for Palmiet (4B), RIL 15 (2D), RIL 45 (5B+6D) and RIL 52, which carries none of the Yr16DH70 stripe rust resistance QTL. Relatively high LAI increases were recorded for RILs 39 (2A+2D+5B), 34 (2A+2D+6D) and 153 (2D+5B), and were mostly accompanied by R host RT ratings, resulting in lower CI values. RILs 112 (2A), 178 (2A), 15 (2D), 190 (2D), 31 (5B) and 149 (6D) remained mostly MRMS in their host RT but showed similar increases in their LAI ratings, with consequently higher CI values. This resulted in a clear distinction between the combined phenotypic parameters (i.e., CI) of the latter group, which revealed visibly higher CI values when compared with lines containing either QTL 2A or 2D in combination with at least one other resistance QTL. An unchanged CI value of 4 was observed for the resistant parent, which did not differ significantly from RIL 10, carrying the 2A+2D QTL combination (LSD = 10.36).
Lines containing only 2A (RIL 112 and 178) or 2D (RIL 15 and 190) had significantly higher CI values than the 2A+2D combination (RIL 10). Although to a lesser extent, this was also demonstrated for QTL combinations 2A+6D, 2D+5B and 2D+6D when compared with the respective single QTL carriers. Conversely, the CI values for the 5B+6D combination (RIL 45) were either higher or differed insignificantly from the lines carrying the single QTL (RIL 31 carrying 5B and RIL 149 carrying 6D).

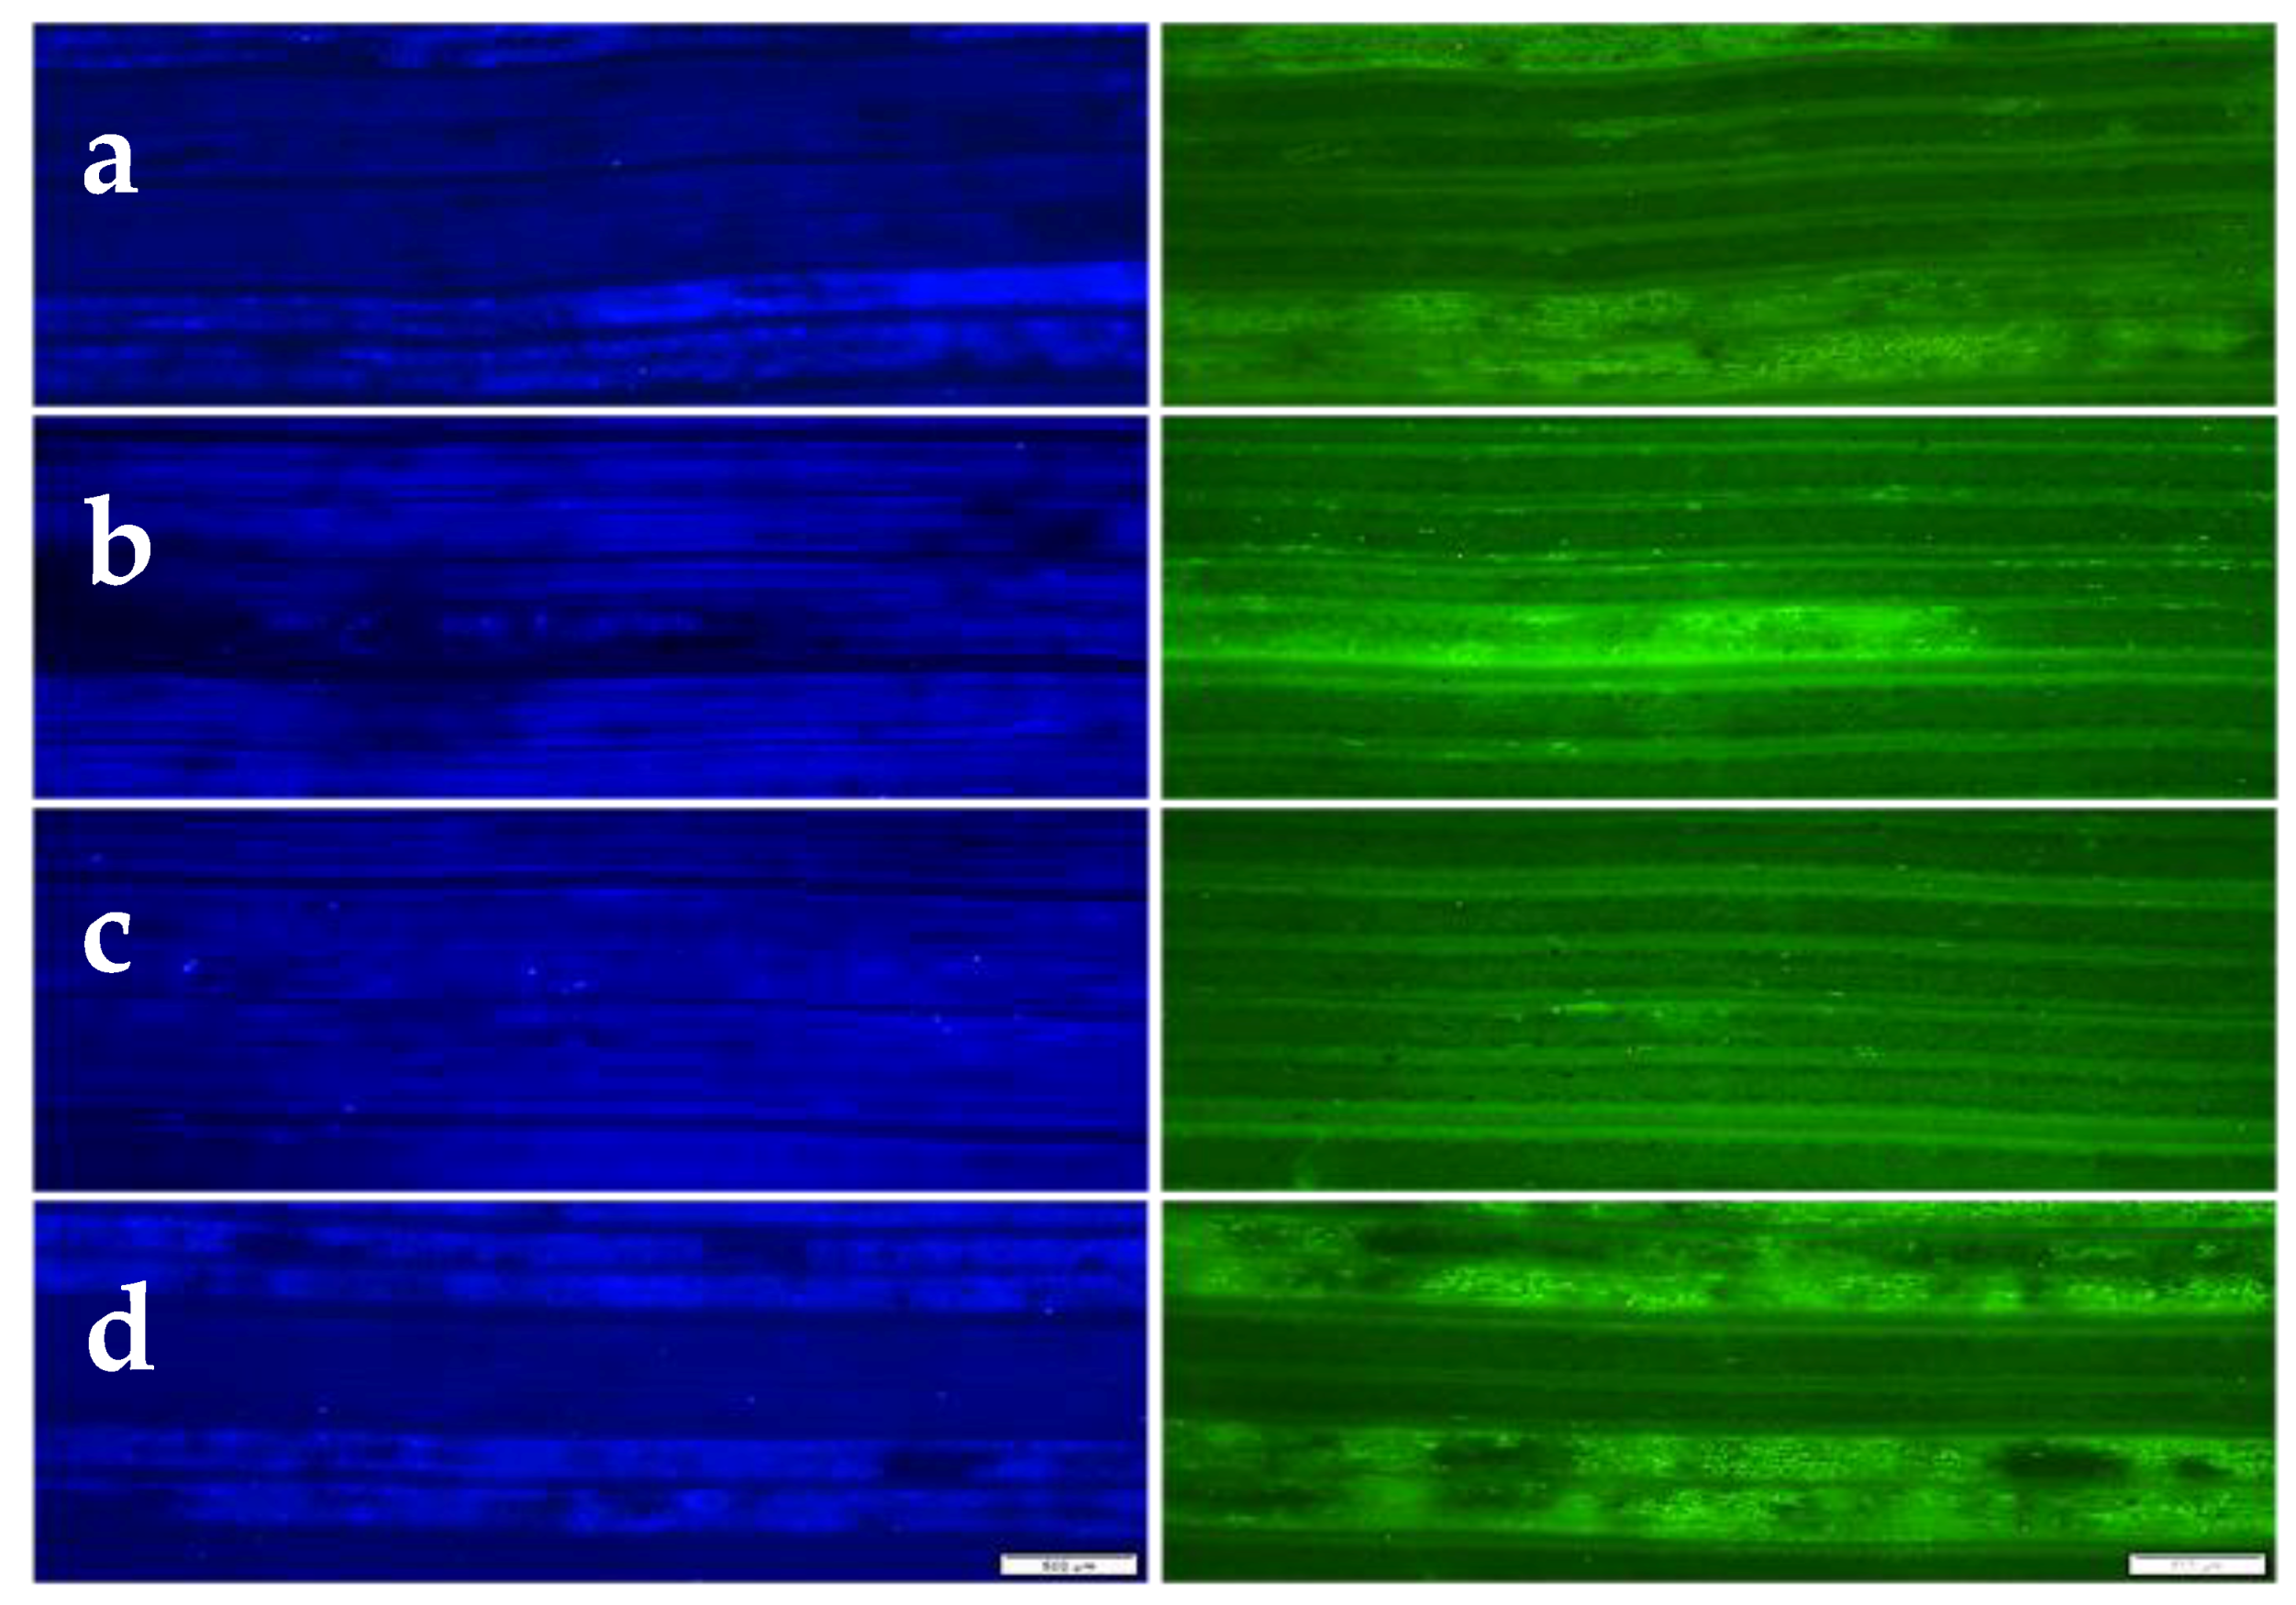
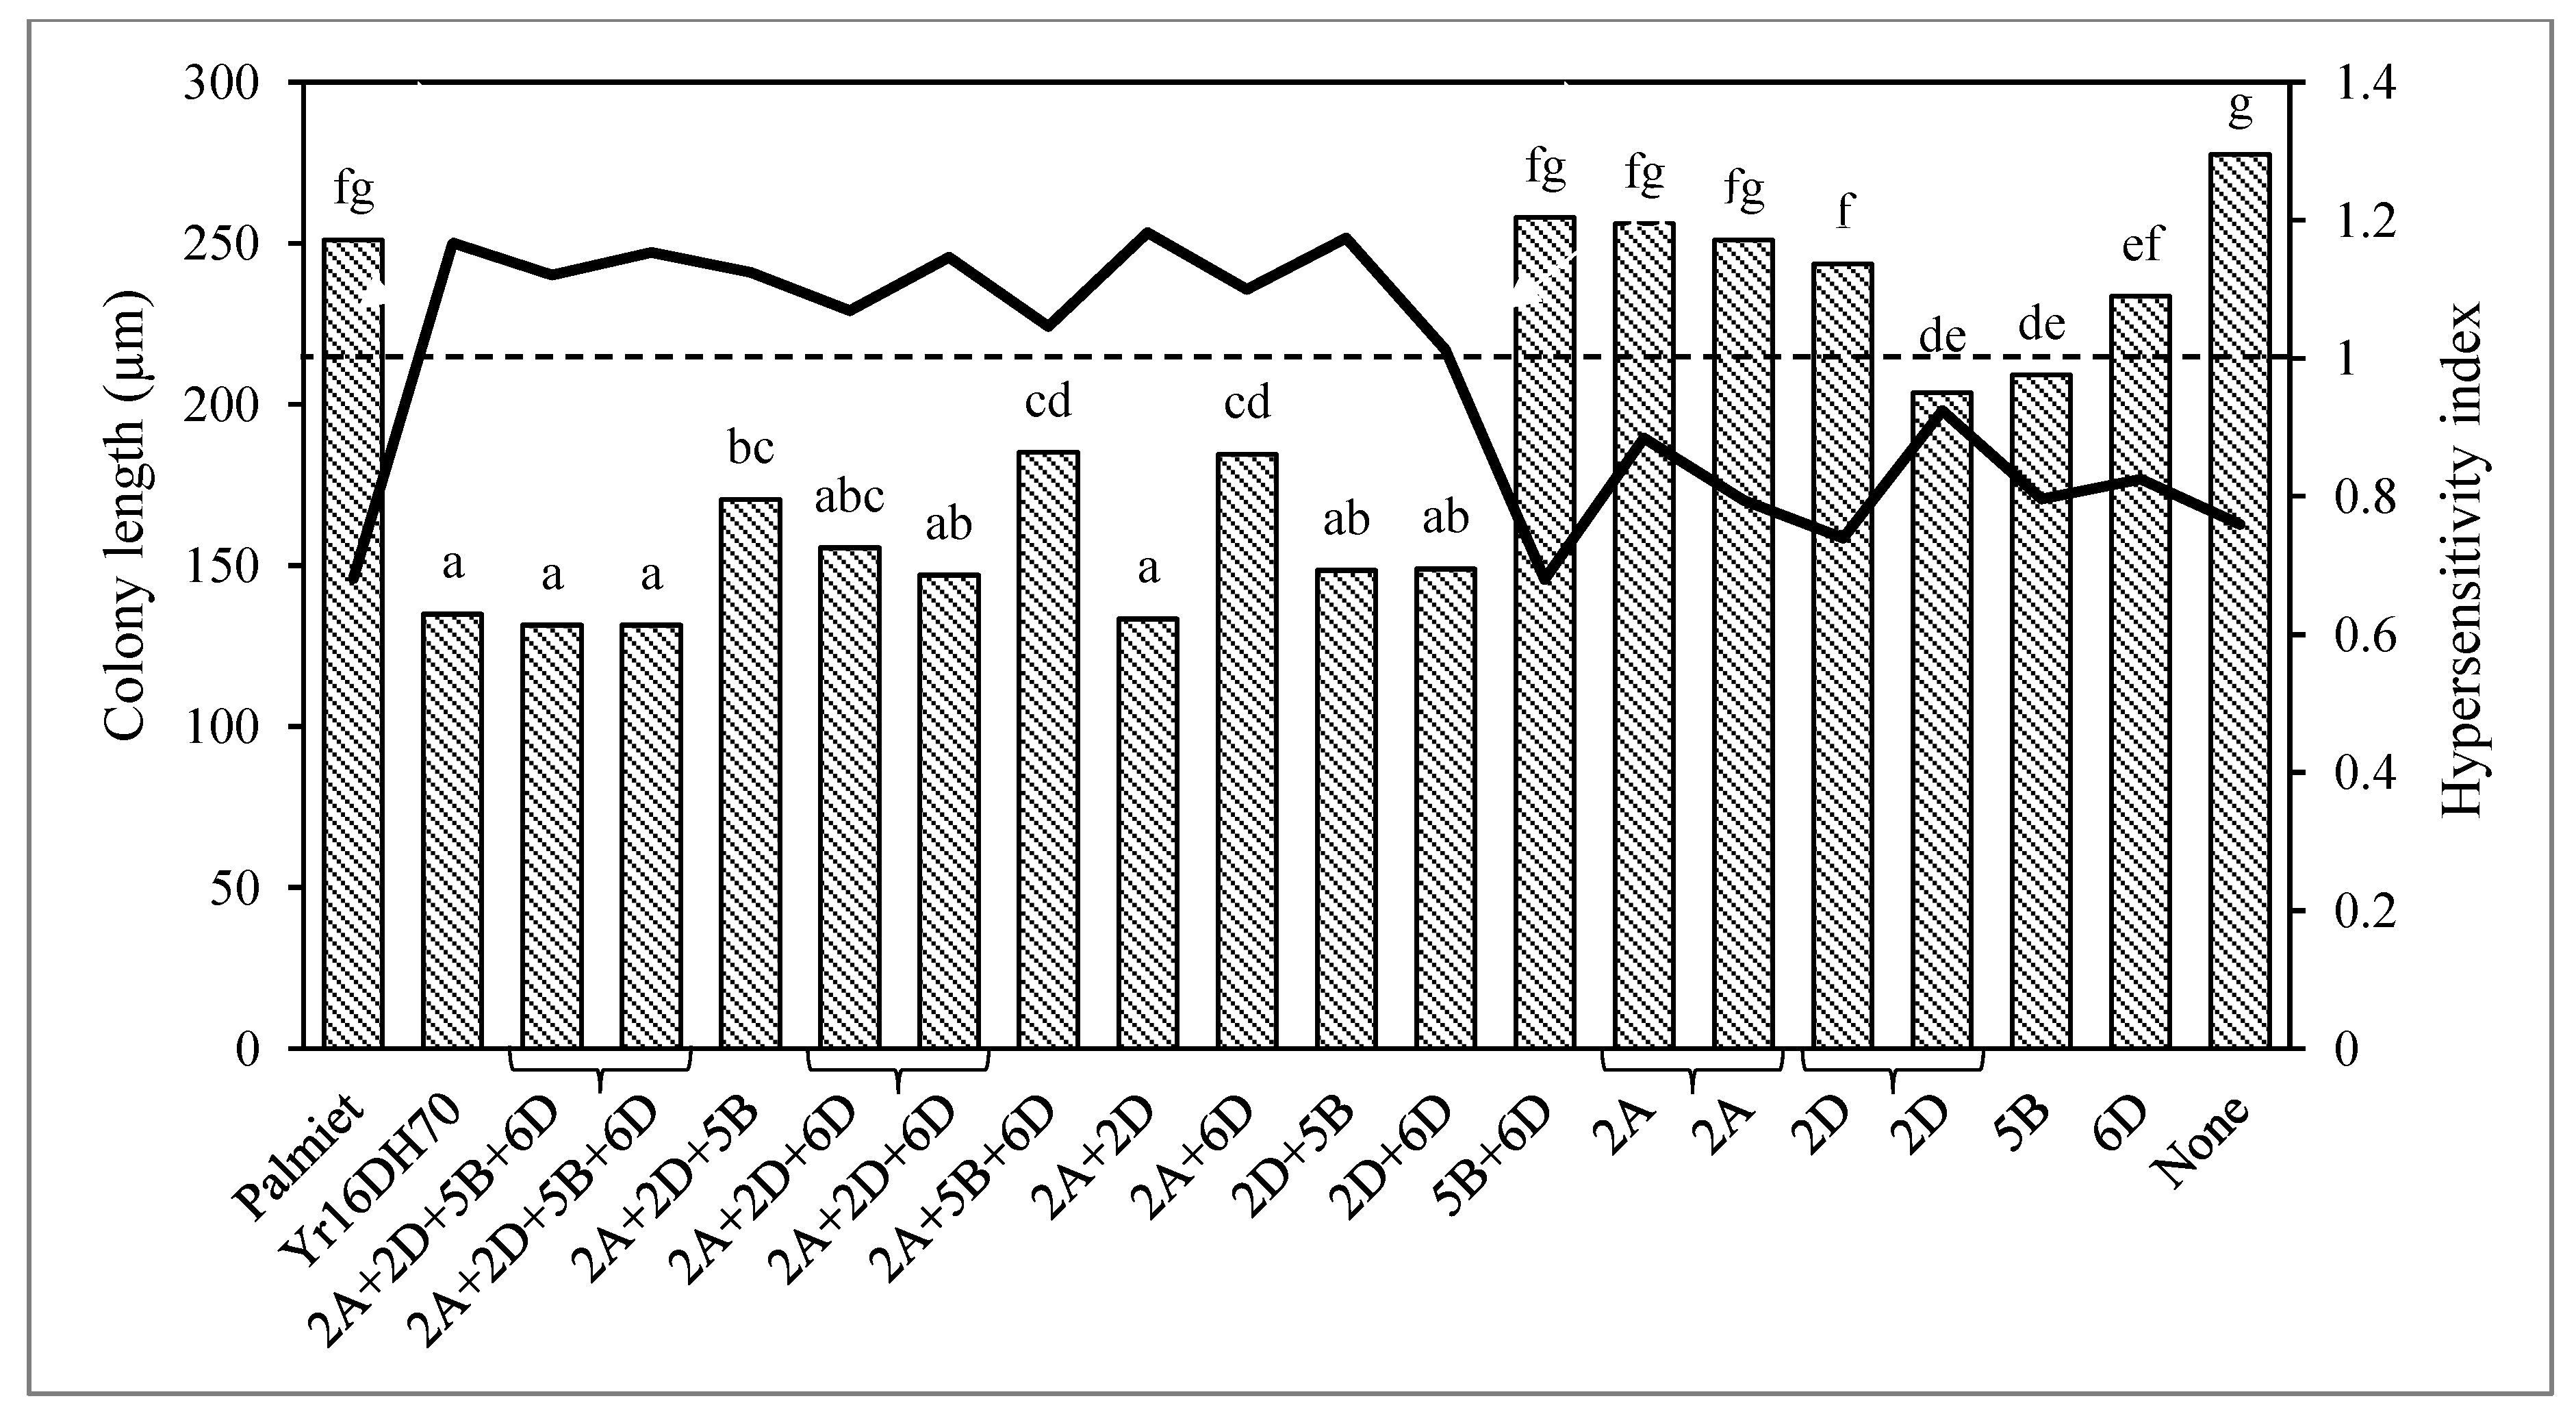
3.2. Microscopy of Puccinia striiformis f. sp. tritici Development and Host Cell Necrosis

The Uvitex 2B fluorochrome, which binds to chitin in fungal cell walls, allowed for the detection of fungal infection structures in wheat flag leaves. Haustorial mother cells (HMC) and networks of infection hyphae fluoresced bright blue (Figure 1, left panel), and HCN associated with fungal colonies light green (Figure 1, right panel). Individual necrotic cells were often associated with Pst colony areas that did not result in larger necrotic areas. In these cases, the measurement of the HCN was taken between the most distant necrotic cells associated with the colony.
Distinct variation in the extent of fungal colony growth and HCN was noted among RILs in different QTL groups (Figure 2). ANOVA results indicated highly significant differences in colony lengths and HI values (length of HCN/colony length) between lines (p ≤ 0.01), with less significant variation in HCN (p = 0.061). As insignificant colony length variation was observed between field replications (p = 0.057), averages of the two replications are given in Figure 2. Fungal colony lengths in Palmiet (4B) were almost double that of the resistant parent Yr16DH70 (averages of 251 and 135 µm, respectively), while the reverse was seen for HI values. All RILs containing QTL 2A or 2D in combination with at least one other QTL, showed small colony lengths (≤185 µm) plus HI values > 1 (HCN extends beyond colony). Small colonies (≤135 µm) were repeatedly measured for the resistant parent, and for RILs in the 2A+2D+5B+6D and 2A+2D QTL groups. RILs containing a QTL combination without 2A or 2D (i.e., 5B+6D), only one or no QTL, had HI values < 1. These RILs also exhibited little variation in colony lengths (averages ranging from 203 to 277 µm). A high negative correlation between HI and colony length (rs = −0.92) indicated an increase in HCN with resistance.

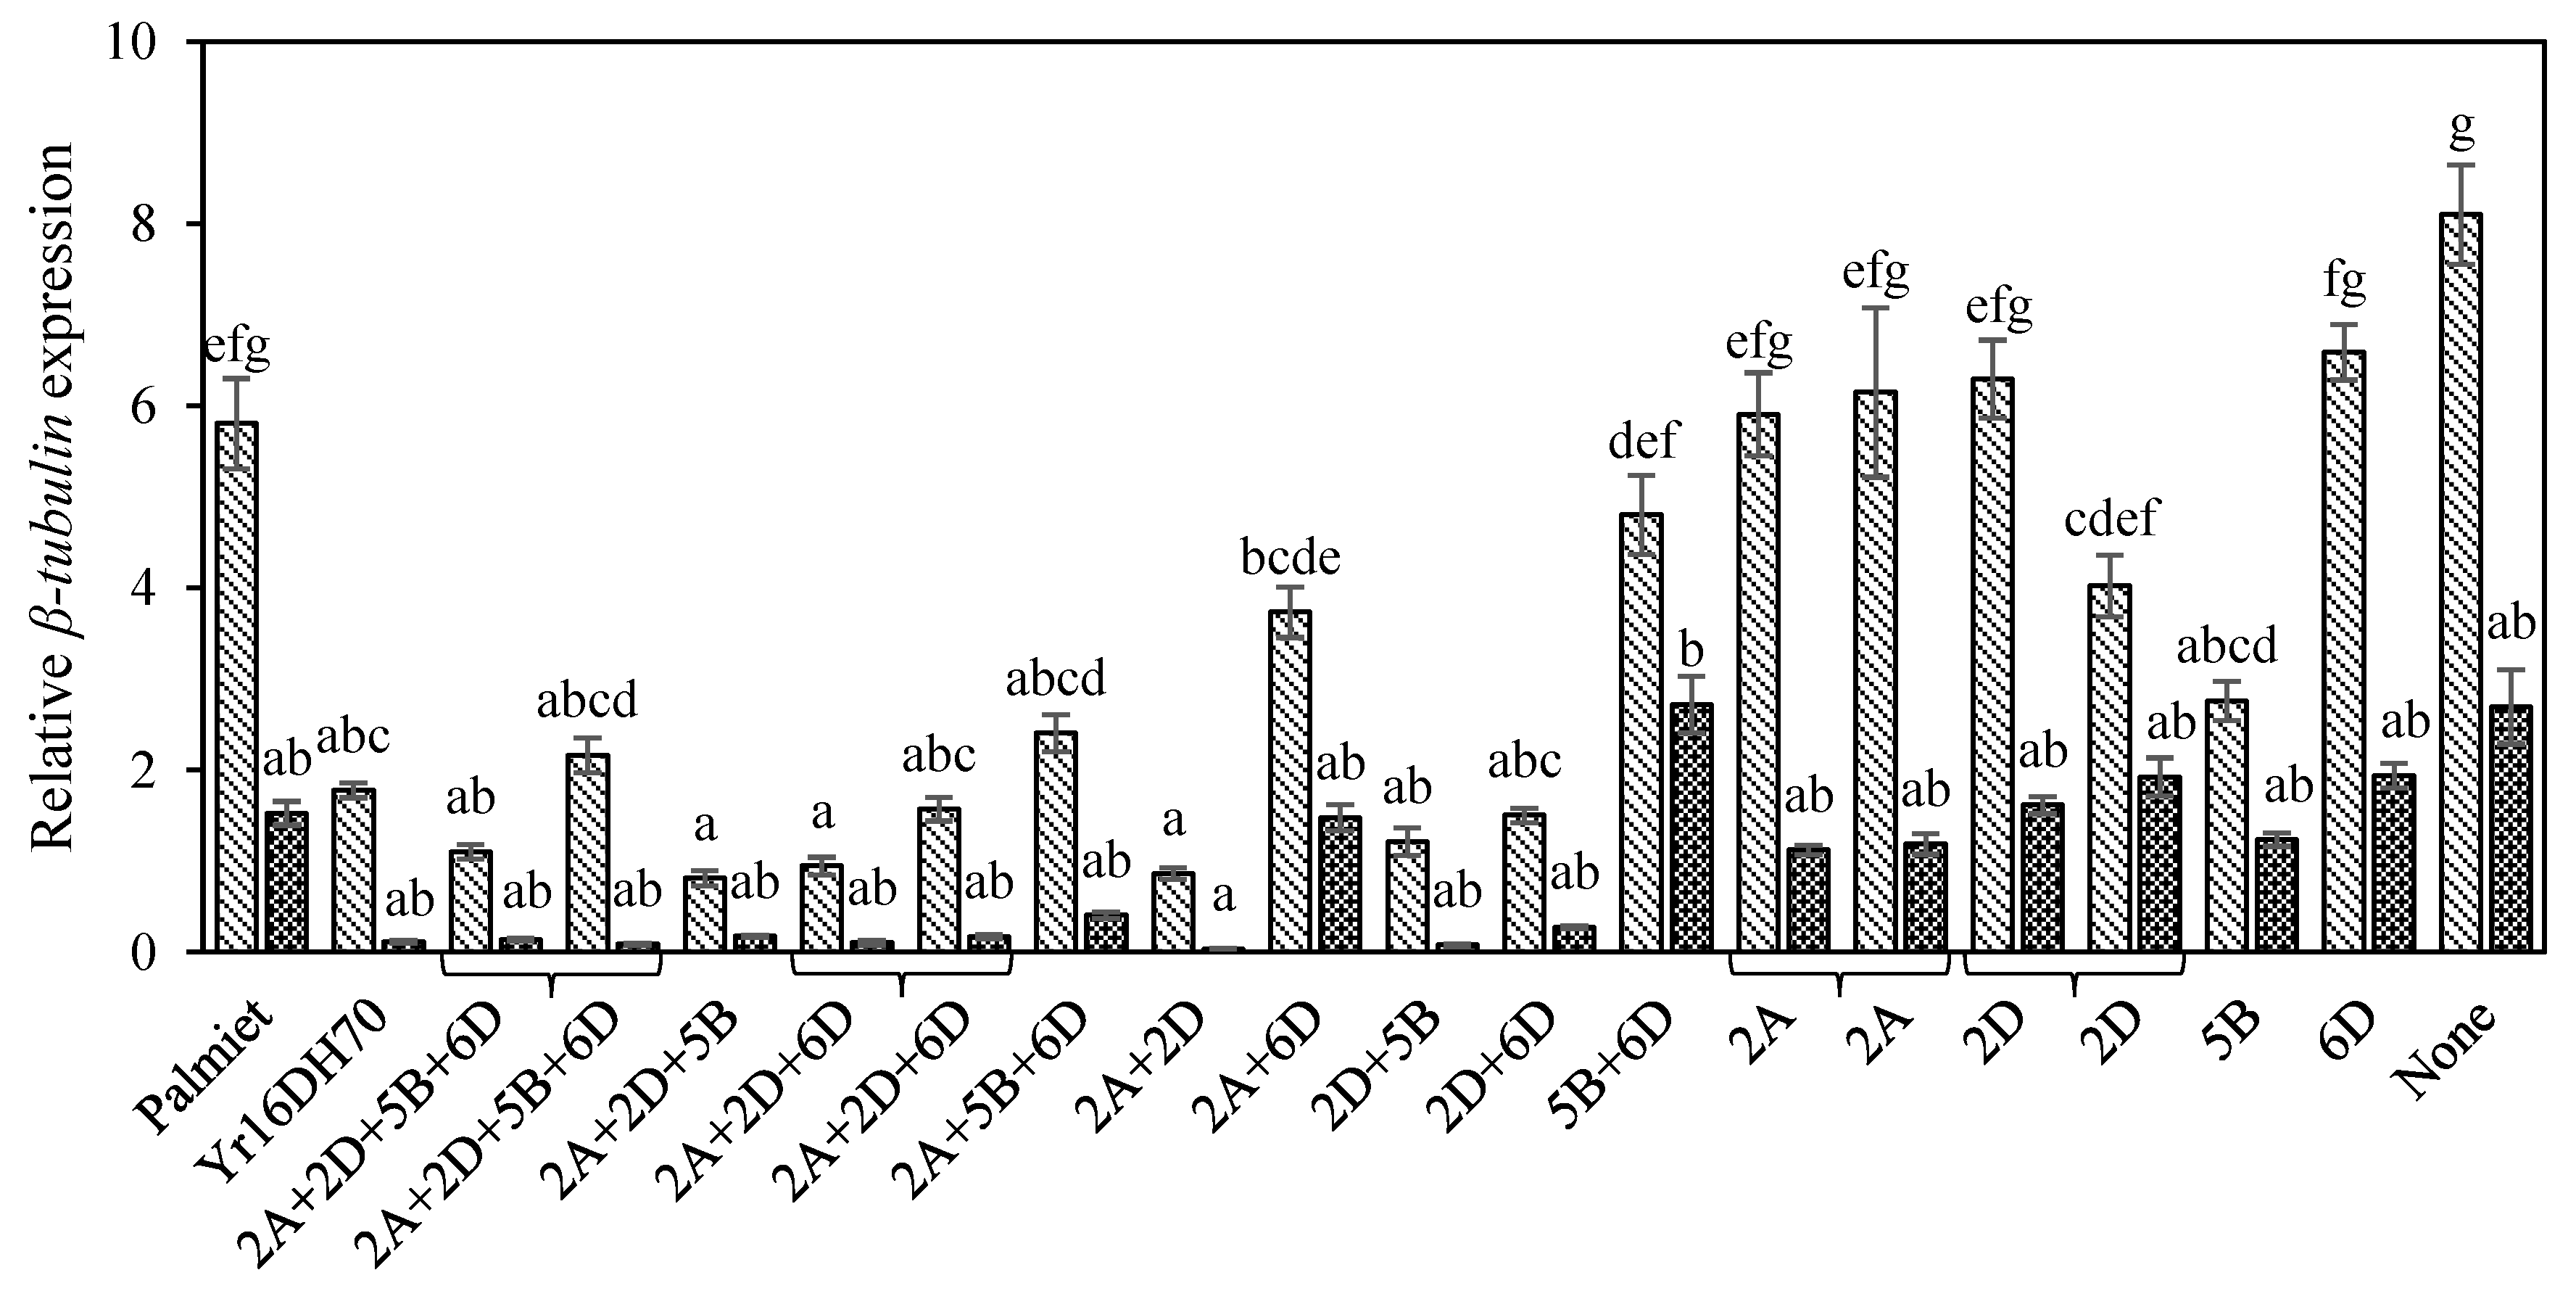
3.3. Molecular Estimation of Fungal Biomass

RT-qPCR enabled the rapid quantification of accumulated Pst fungal biomass in host plants. A single peak during melt curve analysis, along with one ±80 bp amplicon on the agarose gel, confirmed the specific amplification of a single product. ANOVA showed significant differences in relative Pst β-tubulin expression across lines (p = 0.003), as well as across the 14-day time period of sampling (p ≤ 0.01), with no significant interaction between lines and sampling times (p = 0.735). Significant coefficients of correlation occurred between Pst β-tubulin expression data and phenotypic parameters used to measure resistance. During the first sampling, Pst colony length data correlated with CI (rs = 0.87) and relative Pst β-tubulin expression (rs = 0.93). Correlation between CI and Pst β-tubulin expression was calculated at rs = 0.89 and rs = 0.86 for the first and second sampling data sets, respectively.
In one of the field replicates, some of the RILs revealed extreme levels of relative Pst β-tubulin expression, with significant standard errors during the first sampling. These included RILs carrying the single QTL 2A (RIL 112 and 178), 2D (RIL 15 and 190), 6D (RIL 149) and RIL 52 with no resistance QTL. There was, however, insignificant statistical variation between field replications (p = 0.503). The majority of RILs exhibited a decrease in relative Pst β-tubulin expression from the first to the second sampling, except for two entries containing the single resistance QTL 2D and 6D, where a slight increase was observed (Figure 3). Apart from one replicate of the 2A+6D combination, very little Pst β-tubulin expression was detected in RILs carrying either 2A or 2D in combination with other QTL. The Pst β-tubulin levels were typically low in these RILs in the first sampling, and barely detectable in the second sampling.

4. Discussion

Durable rust resistance is typically characterised by a slow rusting phenotype, rather than a complete prevention of infection [10]. However, depending on the environment, unaccompanied slow rusting genes often provide insufficient APR in the field. The success of resistance can, however, be greatly enhanced to the point of near-immunity by combining several small effect genes, with and without slow rusting phenotypes [41].
Through segregating mapping populations, minor QTL can be detected and studied in the absence of major genes [3]. Periyannan et al. [42] commented that it is important to recognise the most effective combinations of rust resistance genes, providing additive effects. Enhanced leaf rust resistance was expressed when Lr34 was combined with other resistance genes [43,44], with evident interactive effects when combined with either Lr13 or Lr37 [33]. Similarly, Sr2 is known to additively increase the level of stem rust resistance mediated by minor resistance genes [45], which has led to the stacking of many different “Sr2-complexes” [1,40]. Despite the many reports proposing gene combinations as a resistance breeding strategy, few studies have actually investigated complementary effects of gene combinations at the histological level. In an analysis of stripe rust histopathology in the spring, wheat cultivar Kariega, Maree et al. [46] have shown that colony length, number of haustorial mother cells and HI all verified high levels of resistance in lines with three resistance QTL. Although most lines with two QTL showed acceptable levels of resistance, the stripe rust phenotype seemed to be influenced by the particular QTL combination [46].
The observations from this study confirmed, in general, the findings of Agenbag et al. [14] that an increase in stripe rust resistance was conferred by increasing the number of QTL retained from Cappelle-Desprez. This supports the assumption that resistance based on several genes and/or QTL will significantly reduce disease levels. While alone 2A and 2D were relatively ineffective at reducing colony length, together they conferred higher levels of stripe rust resistance, demonstrating an additive response. Alone 2A, 2D, 5B and 6D did not confer a high HI (i.e., HCN did not extend beyond a colony), while combinations of 2 or more QTL showed increased HCN. This would indicate a distinct interaction between these QTL, which results in an altered host reaction towards Pst.
However, not all QTL combinations or variables measured provided clear evidence of resistance enhancement. In contrast to the interactions between 2A and 2D for example, 5B and 6D appeared to have a negative epistatic interaction, with 5B being slightly more effective alone than in the 5B+6D combination line. Furthermore, colony lengths in RILs with 2D+5B or 2D+6D could not be statistically separated from those in RILs with 2A+2D+6D or 2A+2D+5B+6D, i.e., containing additional QTL. Similar trends were observed in field ratings, with the exception of RILs containing all four QTL being more resistant later in the season than a line lacking only 5B. These observations suggest a complex interaction between the QTL derived from Cappelle-Desprez. While 2A+2D appear adequate to confer the stripe rust resistance levels seen in line Yr16DH70, the effect of their combination with 5B and 6D remains unclear.
The 5B and 6D QTL thus represent two regions needing further study and improved definition to ensure QTL prediction [14]. The need to delimit QTL intervals to smaller regions is further attested by the diverse responses documented across parameters for RIL 15 and RIL 190, both predicted to carry the 2D QTL. RIL 190 may have also retained 5B, as one (GWM371) of the three markers spanning the 5B QTL had the Yr16DH70-alleles (186 bp). The diverse reactions seen for RIL 112 and RIL 178 (both carrying a single QTL, i.e., 2A), might be the result of environmental effects, as no other QTL markers were detected for either RIL. Similarly, slight variations were seen for RIL 20 and RIL 148 (2A+2D+5B+6D), as well as RIL 34 and RIL 142 (2A+2D+6D). The development of near-isogenic lines in the same susceptible background has already commenced to address some of these issues.
Although field trials reflect authentic conditions experienced by commercial cultivars, they presented challenges in the present study. Though replications did not differ significantly (p ≥ 0.05), variation was noted between replicates of the same RIL, most likely due to environmental variation within the layout of the field experimental area. Difficulties were experienced with the fluorescence microscopy, e.g., the staining process was complicated by the harder physical structure of leaf material grown under field conditions, such that little success was achieved when attempting a rapid staining method [32]. The extreme measurements of relative Pst β-tubulin expression detected during the first sampling, which resulted in substantial standard errors, points to uneven rust distribution within a large field nursery despite experimental design and inoculation efforts to create a uniform rust epidemic. Notwithstanding these challenges, valuable data in terms of phenotypes conferred by different QTL combinations were obtained. Diminished Pst symptoms and fungal biomass were observed at the second sampling. This most likely resulted from a 4.2 °C increase in maximum temperatures recorded in the field trial between September and October 2015 [47].
In conclusion, while multiple stripe rust resistance QTL resulted in less stripe rust compared to the single resistance components, there were distinct and different interactions between QTL combinations that resulted in different resistance phenotypes. The 2A+2D QTL combination, which contributed the most to phenotypic variance and resulted in the best response to stripe rust infection, can assist breeders aiming at the deployment of effective and diverse stripe rust resistance profiles. These two QTL are considered good candidates to combine with stripe rust resistance sources with an expectancy of durability. The choice of resistance loci for gene pyramids should include consideration of the interaction between resistance genes that would not only enhance resistance, but also prolong their effectiveness. Future studies, consisting of more lines representative of the QTL groups and permitting assessment over more than one season, will provide an indication of the stability of resistance responses of different QTL combinations.

Supplementary Materials

The following are available online at https://0-www-mdpi-com.brum.beds.ac.uk/2073-4395/9/3/154/s1, Table S1: Predicted Puccinia striiformis f. sp. tritici race 6E22A+ adult plant resistance quantitative trait loci (QTL) retained by selected Palmiet × Yr16DH70 F8 recombinant inbred lines (RILs), scanned for all DNA markers across each QTL interval, Table S2: Nucleotide sequence, annealing temperature and amplification efficiency for primer pairs used during quantitative reverse transcription polymerase chain reaction (RT-qPCR).

Author Contributions

Conceptualization, R.P., L.A.B. and Z.A.P.; validation, G.J.M., R.P., C.M.B. and Z.A.P.; formal analysis, G.J.M. and R.P.; investigation, G.J.M., R.P. and H.D.C.; resources, R.P. and H.D.C.; data curation, R.P. and L.A.B.; writing—original draft preparation, G.J.M. and Z.A.P.; writing—review and editing, G.J.M., R.P., L.A.B., W.H.P.B. and Z.A.P.; visualization, G.J.M., R.P., L.A.B., C.M.B., W.H.P.B. and Z.A.P.; supervision, R.P., H.D.C. and Z.A.P.; project administration, G.J.M., R.P. and Z.A.P.; funding acquisition, R.P.

Funding

This research was funded by the BBSRC special initiative SARID (Sustainable Agricultural Research for International Development), grant number BB/F004125/1.

Acknowledgments

Pannar Seed (Pty) Ltd. is thanked for assistance with field trials at Greytown, South Africa.

Conflicts of Interest

The authors declare no conflict of interest. The funders had no role in the design of the study; in the collection, analyses, or interpretation of data; in the writing of the manuscript, or in the decision to publish the results.

References

  1. Ellis, J.G.; Lagudah, E.S.; Spielmeyer, W.; Dodds, P.N. The past, present and future of breeding rust resistant wheat. Front. Plant Sci. 2014, 5, 641. [Google Scholar] [CrossRef] [PubMed]
  2. Lagudah, E.S. Molecular genetics of race non-specific rust resistance in wheat. Euphytica 2011, 179, 81–91. [Google Scholar] [CrossRef]
  3. Boyd, L.A. Can Robigus defeat an old enemy?—Yellow rust of wheat. J. Agric. Sci. 2005, 143, 233–343. [Google Scholar] [CrossRef]
  4. Ali, S.; Rodriguez-Algaba1, J.; Thach, T.; Sørensen, C.K.; Hansen, J.G.; Lassen, P.; Nazari, K.; Hodson, D.P.; Justesen, A.F.; Hovmøller, M.S. Yellow rust epidemics worldwide were caused by pathogen races from divergent genetic lineages. Front. Plant Sci. 2017, 8, 1057. [Google Scholar] [CrossRef]
  5. Ali, S.; Gladieux, P.; Leconte, M.; Gautier, A.; Justesen, A.F.; Hovmøller, M.S.; Enjalbert, J.; De Vallavieille-Pope, C. Origin, migration routes and worldwide population genetic structure of the wheat yellow rust pathogen Puccinia striiformis f. sp. tritici. PLoS Pathog. 2014, 10, e1003903. [Google Scholar] [CrossRef]
  6. McIntosh, R.A.; Dubcovsky, J.; Rogers, W.J.; Morris, C.; Xia, X.C. Catalogue of Gene symbols for wheat: 2017 Supplement. 2017. Available online: https://shigen.nig.ac.jp/wheat/komugi/genes/macgene/supplement2017.pdf (accessed on 7 December 2018).
  7. Chen, X.M. Review article: High-temperature adult-plant resistance, key for sustainable control of stripe rust. AJPS 2013, 4, 608–627. [Google Scholar] [CrossRef]
  8. Wang, M.; Chen, X. Stripe Rust Resistance. In Stripe Rust; Chen, X., Kang, Z., Eds.; Springer: Dordrecht, The Netherlands, 2017; Available online: https://0-doi-org.brum.beds.ac.uk/10.1007/978-94-024-1111-9_5 (accessed on 10 January 2019).
  9. Mundt, C.C. Pyramiding for resistance durability: Theory and Practice. Phytopathology 2018, 108, 792–802. [Google Scholar] [CrossRef]
  10. Singh, R.P.; Huerta-Espino, J.; William, H.M. Genetics and breeding for durable resistance to leaf and stripe rusts in wheat. Turk. J. Agric. For. 2005, 29, 121–127. [Google Scholar]
  11. Sørensen, C.K.; Hovmøller, M.S.; Leconte, M.; Dedryver, F.; de Vallavieille-Pope, C. New races of Puccinia striiformis found in Europe reveal race specificity of long-term effective adult plant resistance in wheat. Phytopathology 2014, 104, 1042–1051. [Google Scholar] [CrossRef]
  12. Jagger, I.J.; Newell, C.; Berry, S.T.; MacCormack, R.; Boyd, L.A. The genetic characterisation of stripe rust resistance in the German wheat cultivar Alcedo. Theor. Appl. Genet. 2011, 122, 723–733. [Google Scholar] [CrossRef]
  13. Boshoff, W.H.P.; Pretorius, Z.A.; Van Niekerk, B.D. Resistance in South African and foreign wheat cultivars to pathotypes 6E16A- and 6E22A- of Puccinia striiformis f. sp. tritici. S. Afr. J. Plant Soil 2002, 19, 27–36. [Google Scholar] [CrossRef]
  14. Agenbag, G.M.; Pretorius, Z.A.; Boyd, L.A.; Bender, C.M.; Prins, R. Identification of adult plant resistance to stripe rust in the wheat cultivar Cappelle-Desprez. Theor. Appl. Genet. 2012, 125, 109–120. [Google Scholar] [CrossRef] [PubMed]
  15. De Vallavieille-Pope, C.; Picard-Formery, H.; Radulovic, S.; Johnson, R. Specific resistance factors to yellow rust in seedlings of some French wheat varieties and races of Puccinia striiformis Westend in France. Agronomie 1990, 2, 103–113. [Google Scholar] [CrossRef]
  16. Chen, X.M.; Jones, S.S.; Line, R.F. Chromosomal location of genes for resistance to Puccinia striiformis in seven wheat cultivars with resistance genes at the Yr3 and Yr4 loci. Phytopathology 1996, 86, 1228–1233. [Google Scholar] [CrossRef]
  17. Worland, A.J.; Law, C.N. Genetic analysis of chromosome 2D of wheat. Z. Pflanzenzüchtung 1986, 96, 331–345. [Google Scholar]
  18. Law, C.N.; Worland, A.J. The control of adult-plant resistance to yellow rust by the translocated chromosome 5BS-7BS of bread wheat. Plant Breed. 1997, 116, 59–63. [Google Scholar] [CrossRef]
  19. Lagudah, E.S.; Krattinger, S.G.; Herrera-Foessel, S.; Singh, R.P.; Huerta-Espino, J.; Spielmeyer, W.; Brown-Guedira, G.; Selter, L.L.; Keller, B. Gene-specific markers for the wheat gene Lr34/Yr18/Pm38 which confers resistance to multiple fungal pathogens. Theor. Appl. Genet. 2009, 119, 889–898. [Google Scholar] [CrossRef] [PubMed]
  20. McIntosh, R.A. Close genetic linkage of genes conferring adult plant resistance to leaf rust and stripe rust in wheat. Plant Pathol. 1992, 41, 523–527. [Google Scholar] [CrossRef]
  21. Mallard, S.; Gaudet, D.; Aldeia, A.; Abelard, C.; Besnard, A.L.; Sourdille, P.; Dedryver, F. Genetic analysis of durable resistance to yellow rust in bread wheat. Theor. Appl. Genet. 2005, 110, 1401–1409. [Google Scholar] [CrossRef] [PubMed]
  22. Boukhatem, N.; Baret, P.V.; Mingeot, D.; Jacquemin, J.M. Quantitative trait loci for resistance against yellow rust in two wheat derived recombinant inbred line populations. Theor. Appl. Genet. 2002, 104, 111–118. [Google Scholar] [CrossRef] [PubMed]
  23. Hao, Y.; Chen, Z.; Wang, Y.; Bland, D.; Buck, J.; Brown-Guedira, G.; Johnson, J. Characterization of a major QTL for adult plant resistance to stripe rust in US soft red winter wheat. Theor. Appl. Genet. 2011, 123, 1401–1411. [Google Scholar] [CrossRef] [PubMed]
  24. Chen, X.M.; Jones, S.S.; Line, R.F. Chromosomal location of genes for stripe rust resistance in spring wheat cultivars Compair, Fielder, Lee, and Lemhi and interactions of aneuploid wheats with races of Puccinia striiformis. Phytopathology 1995, 85, 375–381. [Google Scholar] [CrossRef]
  25. Zadoks, J.C.; Chang, T.T.; Konzak, C.F. A decimal code for the growth stages of cereals. Weed Res. 1974, 14, 415–421. [Google Scholar] [CrossRef]
  26. Visser, B.; Herselman, L.; Pretorius, Z.A. Microsatellite characterisation of South African Puccinia striiformis races. S. Afr. J. Plant Soil 2016, 33, 161–166. [Google Scholar] [CrossRef]
  27. Peterson, R.F.; Champbell, A.B.; Hannah, A.E. A diagrammatic scale for estimating rust intensity of leaves and stem of cereals. Can. J. Res. 1948, 26c, 496–500. [Google Scholar] [CrossRef]
  28. Stubbs, R.W.; Prescott, J.M.; Saari, E.E.; Dubin, H.J. Cereal Disease Methodology Manual; Centro Internacional de Mejoramiento de Maίz yTrigo (CIMMYT): Texcoco, Mexico, 1986; Available online: https://repository.cimmyt.org/handle/10883/3997 (accessed on 7 December 2018).
  29. Rohringer, R.; Kim, W.K.; Samborsky, D.J.; Howes, N.K. Calcofluor: An optical brightener for fluorescence microscopy of fungal plant parasites in leaves. Phytopathology 1977, 67, 808–810. [Google Scholar] [CrossRef]
  30. Niks, R.E.; Dekens, R.G. Histological studies on the infection of triticale, wheat and rye by Puccinia recondita f. sp. tritici and P. recondita f. sp. recondita. Euphytica 1987, 36, 275–285. [Google Scholar] [CrossRef]
  31. Moldenhauer, J.; Moerschbacher, B.M.; Van der Westhuizen, A.J. Histological investigation of stripe rust (Puccinia striiformis f. sp. tritici) development in resistant and susceptible wheat cultivars. Plant Pathol. 2006, 55, 469–474. [Google Scholar] [CrossRef]
  32. Dugyala, S.; Borowicz, P.; Acevedo, M. Rapid protocol for visualization of rust fungi structures using fluorochrome Uvitex 2B. Plant Methods 2015, 11, 54. [Google Scholar] [CrossRef]
  33. Kloppers, F.J.; Pretorius, Z.A. Effects of combinations amongst genes Lr13, Lr34 and Lr37 on components of resistance in wheat to leaf rust. Plant Pathol. 1997, 46, 737–750. [Google Scholar] [CrossRef]
  34. Coram, T.E.; Settles, M.L.; Chen, X.M. Transcriptome analysis of high-temperature adult-plant resistance conditioned by Yr39 during the wheat—Puccinia striiformis f. sp. tritici interaction. Mol. Plant Pathol. 2008, 9, 479–493. [Google Scholar] [CrossRef]
  35. Chomczynski, P.; Sacchi, N. Single-step method of RNA isolation by acid guanidinium thiocyanate-phenol-chloroform extraction. Anal. Biochem. 1987, 162, 156–159. [Google Scholar] [CrossRef]
  36. Sambrook, J.; Russell, D.W. Molecular Cloning: A Laboratory Manual, 3rd ed.; Cold Spring Harbor Laboratory Press: New York, NY, USA, 2000; pp. A8.19–A8.21; 7.31–7.34. [Google Scholar]
  37. Sambrook, J.; Fritsch, E.F.; Maniatis, T. Molecular Cloning: A Laboratory Manual, 2nd ed.; Cold Spring Harbor Laboratory Press: New York, NY, USA, 1989. [Google Scholar]
  38. Ling, P.; Wang, M.N.; Chen, X.M.; Campbell, K.G. Construction and characterization of a full-length cDNA library for the wheat stripe rust pathogen (Puccinia striiformis f. sp. tritici). BMC Genom. 2007, 8, 145. [Google Scholar] [CrossRef] [PubMed]
  39. Scholtz, J.J.; Visser, B. Reference gene selection for qPCR gene expression analysis of rust-infected wheat. Physiol. Mol. Plant Pathol. 2013, 81, 22–25. [Google Scholar] [CrossRef]
  40. McIntosh, R.A.; Wellings, C.R.; Park, R.F. Wheat Rusts: An Atlas of Resistance Genes; CSIRO: Canberra, Australia, 1995; 200p. [Google Scholar]
  41. Singh, R.P.; Herrera-Foessel, S.; Huerta-Espino, J.; Singh, S.; Bhavani, S.; Lan, C.; Basnet, B.R. Progress towards genetics and breeding for minor genes based resistance to Ug99 and other rusts in CIMMYT high-yielding spring wheat. J. Integr. Agric. 2014, 13, 255–261. [Google Scholar] [CrossRef]
  42. Periyannan, S.; Milne, R.J.; Figueroa, M.; Lagudah, E.S.; Dodds, P.N. An overview of genetic rust resistance: From broad to specific mechanisms. PLoS Pathog. 2017, 13, e1006380. [Google Scholar] [CrossRef]
  43. Germán, S.; Kolmer, J.A. Effect of gene Lr34 in the enhancement of resistance to leaf rust of wheat. Theor. Appl. Genet. 1992, 84, 97–105. [Google Scholar] [CrossRef]
  44. Kolmer, J.A. Enhanced leaf rust resistance in wheat conditioned by resistance gene pairs with Lr13. Euphytica 1992, 61, 123–130. [Google Scholar] [CrossRef]
  45. Knott, D.R. The inheritance of resistance to stem rust races 56 and 15B-1L (Can.) in the wheat varieties Hope and H-44. Can. J. Genet. Cytol. 1968, 10, 311–320. [Google Scholar] [CrossRef]
  46. Maree, G.J.; Prins, R.; Bender, C.M.; Boshoff, W.H.P.; Negussie, T.G.; Pretorius, Z.A. Phenotyping Kariega × Avocet S doubled haploid lines containing individual and combined adult plant stripe rust resistance loci. Plant Pathol. 2019. [Google Scholar] [CrossRef]
  47. Kloppers, F.J.; (Pannar Seed [Pty] Ltd., Greytown, KwaZulu-Natal, South Africa). Personal Communication, 2015.
Figure 1. Microscopic images of flag leave segments from the first sampling, showing fluoresced Puccinia striiformis f. sp. tritici race 6E22A+ colonies (left panel) and associated host cell necrosis (right panel) in parents (a) Palmiet and (b) Yr16DH70, and recombinant inbred lines containing resistance quantitative trait loci on chromosome(s) (c) 2A+2D and (d) none. Scale bars represent 500 µm.
Agronomy 09 00154 g001
Figure 2. Average Puccinia striiformis f. sp. tritici race 6E22A+ colony lengths (pattern bars) and hypersensitivity indexes (HI; solid line) of recombinant inbred wheat lines with different combinations of the stripe rust resistance quantitative trait loci (QTL) 2A = QYr.ufs-2A, 2D = QYr.ufs-2D, 5B = QYr.ufs-5B and 6D = QYr.ufs-6D. Lines with HI values above the dotted line represent QTL combinations associated with host cell necrosis. Brackets indicate lines with matching predicted QTL profiles. Least significant differences (LSD) among lines for colony length and HI were calculated as 32.2 and 0.24, respectively, i.e., means with the same letter do not differ significantly from each other (p ≤ 0.01).
Agronomy 09 00154 g002
Figure 3. Relative expression of β-tubulin by Puccinia striiformis f. sp. tritici race 6E22A+ in the wheat parents and recombinant inbred lines containing different combinations of stripe rust resistance quantitative trait loci (QTL) 2A = QYr.ufs-2A, 2D = QYr.ufs-2D, 5B = QYr.ufs-5B and 6D = QYr.ufs-6D. Mean expression in two field replications was measured at two sampling times. Brackets indicate lines with matching predicted QTL profiles. Error bars represent standard errors. Least significant differences (LSD) among lines for relative β-tubulin expression were calculated as 2.68, i.e., means with the same letter do not differ significantly from each other (p ≤ 0.01).
Agronomy 09 00154 g003
Table 1. Leaf area infected (LAI), host reaction type (RT) and coefficient of infection (CI) of F8 Palmiet × Yr16DH70 recombinant inbred lines (RILs), including the parents Palmiet and Yr16DH70, after infection with Puccinia striiformis f. sp. tritici race 6E22A+.
Parent/RILQTL 1First SamplingSecond Sampling
LAI 2 (%)RT 3 RangeMean CI 2LAI 2 (%)RT 3 RangeMean CI 2
RangeMeanRangeMean
Palmiet4B3030 efghMRMS18 cde7070 efMRMS42 ij
Yr16DH702A+2D+5B+6D1010 aMR4 a2020 aR4 a
202A+2D+5B+6D (4)20–2522.5 bcdeMRMS13.5 abcd20–3025 abR-RMR6 a
1482A+2D+5B+6D (4)10–2015 abcMR-MRMS8 abc20–3025 abRMR7.5 a
392A+2D+5B (3)10–1512.5 abMRMS7.5 ab30–4035 bcR-MR10 abc
342A+2D+6D (3)15–2017.5 abcdMRMS10.5 abc50–6055 dR-MRMS21 def
1422A+2D+6D (3)15–2017.5 abcdMRMS10.5 abc25–3027.5 abRMR8.25 ab
332A+5B+6D (3)20–3025 cdefMRMS15 bcd4040 cRMR-MRMS18 bcde
102A+2D (2)5–1510 a RMR-MR3.75 a25–3027.5 abR-RMR6.75 a
1442A+6D (2)25–3027.5 defgMRMS16.5 bcd4040 cMR-MRMS20 cdef
1532D+5B (2)20–2522.5 bcdeMRMS13.5 abcd50–7060 deR12 abcd
172D+6D (2)15–2017.5 abcdMRMS10.5 abc30–3532.5 bcRMR9.75 abc
455B+6D (2)30–4035 fghMRMS21 de60–7065 deMRMS39 hi
1122A (1)4040 hiMRMS-MS28 ef40–7055 dMRMS-MS40 hi
1782A (1)35–4037.5 ghiMRMS22.5 de6060 deMR-MRMS30 fgh
152D (1)30–5040 hiMS-MSS34.5 f80–9085 gMRMS51 jk
1902D (1)20–3025 cdefMRMS15 bcd50–6055 dMR-MRMS28 efg
315B (1)30–4035 fghiMRMS21 de50–6055 dMRMS33 ghi
1496D (1)4040 hiMRMS-MS28 ef50–6055 dMRMS33 ghi
52None (0)40–5045 iMRMS-MSS34.5 f70–9080 fgMRMS-MS57 k
1 QTL = Quantitative trait loci where 4B = QYr.ufs-4B (from Palmiet), 2A = QYr.ufs-2A, 2D = QYr.ufs-2D, 5B = QYr.ufs-5B and 6D = QYr.ufs-6D (from Yr16DH70); Number of putative QTL carried by each RIL in parentheses. 2 LAI or CI values followed by a different letter differ significantly according to LSD (p ≤ 0.01). LSD between entries = 10.137 (LAI), and 10.358 (CI). Range indicates variation in response over two field replications. 3 R = resistant, MR = moderately resistant, MS = moderately susceptible, S = susceptible.

