Review

High-Throughput Field-Phenotyping Tools for Plant Breeding and Precision Agriculture

1
Department of Plant Breeding, Swedish University of Agricultural Sciences (SLU), SE-230 53 Alnarp, Sweden
2
Department of Biology, Lund University, SE-223 62 Lund, Sweden
3
IBM Global Business Services Sweden, SE-164 92 Stockholm, Sweden
4
Department of Plant Protection Biology, SLU, SE-230 53 Alnarp, Sweden
*
Author to whom correspondence should be addressed.
Submission received: 14 April 2019 / Revised: 7 May 2019 / Accepted: 16 May 2019 / Published: 22 May 2019
(This article belongs to the Section Crop Breeding and Genetics)

Abstract

:
High-throughput field phenotyping has garnered major attention in recent years leading to the development of several new protocols for recording various plant traits of interest. Phenotyping of plants for breeding and for precision agriculture have different requirements due to different sizes of the plots and fields, differing purposes and the urgency of the action required after phenotyping. While in plant breeding phenotyping is done on several thousand small plots mainly to evaluate them for various traits, in plant cultivation, phenotyping is done in large fields to detect the occurrence of plant stresses and weeds at an early stage. The aim of this review is to highlight how various high-throughput phenotyping methods are used for plant breeding and farming and the key differences in the applications of such methods. Thus, various techniques for plant phenotyping are presented together with applications of these techniques for breeding and cultivation. Several examples from the literature using these techniques are summarized and the key technical aspects are highlighted.

1. Introduction

The human population is expected to reach 9.7 billion by 2050, thus meeting food demand for the growing population will require an increase in crop production between 25% and 70% above the current levels by 2050 [1]. The greatest challenge for agriculture is the changing climate caused by increasing greenhouse gas emissions leading to extreme temperatures and adverse weather conditions [1,2]. The extent of the impact of global warming varies with geographical regions, which requires targeted solutions for different agro-ecological regions of the world. Farmers from low-income countries are especially vulnerable to the changing climate due to limited access to resources and less efficient cultivation practices [2]. Hence, to increase the crop production while reducing the impact of agriculture on the environment will require sustainable intensification of agriculture by adopting modern techniques for plant breeding, cultivation and management of crops [3]. Pivotal to meet this goal is the development of resilient cultivars with high yield potential in the target population of environments as well as providing new solutions for automated monitoring systems to determine plant health. In both cases, high-throughput field-phenotyping tools are needed.
Marker-assisted selection (MAS) has tremendously benefited plant breeding and accelerated the development of cultivars with desired characteristics [4,5]. MAS relies on the development of primarily DNA-based markers that are in linkage disequilibrium with the underlying gene(s) for the trait of interest. Trait evaluation is thus necessary to develop DNA markers and is conventionally done manually by the breeders. For germplasm evaluation, field trials are conducted at multiple locations to account for the environmental impact on the trait of interest. Thereafter, DNA markers are identified by genotyping the material followed by biometric analysis. Methods for identification of markers and marker-assisted selection are linkage analysis and genome wide association study (GWAS). While linkage analysis and GWAS has been implemented for identifying markers for several traits in various crops [6], genomic selection (GS) is a relatively new technique which is becoming increasingly popular [7]. In recent years, developments in next generation sequencing technology led to the generation of large sets of genotypic data and identification of novel genetic variants that are useful for developing markers for breeding [8]. Gene expression analysis can be integrated with linkage analysis and GWAS to identify potential candidate genes in a locus identified with linkage analysis or GWAS. Such integration was performed earlier for example in Arabidopsis to identify candidate genes for root morphology [9]. Additionally, protein-based markers can also be used in plant breeding for selection of superior genotypes. Mass spectrometry is a commonly used technique for detecting highly induced proteins in a sample. With constant improvements in detection sensitivity of the mass spectrometry equipment, it has become feasible to detect peptides from the corresponding proteins with higher accuracy. Advancements in mass spectrometry technology facilitated identifying protein-based markers for plant breeding [10,11]. To better understand the impact of environment and management on plant cultivation it can be necessary to generate “-omics” data also in field conditions and establish “-omics”-based profiles or biomarkers [12].
Plant phenotyping is still the bottleneck as the development of techniques for the precise and accurate recording of important agronomical traits and crop monitoring are lagging behind [13,14]. Further advances in phenotyping techniques are therefore required for improving the selection efficiency of the breeding programs, accelerating genetic gains and for automated monitoring of plant health status to reduce qualitative and quantitative losses during crop production. Cost efficiency must be considered for the phenotyping techniques to be accepted by both breeders and farmers. The costs are mainly context-dependent; however, in general the labor costs are the major fraction of the total costs for phenotyping [15]. Sustainable intensification in agriculture allows reaching maximum yield potential by bred cultivars and more precise crop management to minimize the use of fertilizers, pesticides and irrigation [16]. In conventional agriculture, crops get fertilizers and pesticides for controlling pathogens or pests at defined intervals to achieve higher yields. Although this strategy allows reaching the expected yields, it also has a significant impact on the environment. The overuse of fertilizers leads to leaching of chemicals in the soil ultimately polluting the water streams affecting the aquatic life [17]. Overuse of pesticides also can result in evolution of pathogen strains resistant to pesticides [18]. The current drive to reduce pesticide use is coupled with the withdrawal of many synthetic pesticides (in Europe through EU directive 2009/128/EC) and calls for new methods. Here, the possible adoption and integration of plant phenotyping into an integrated pest management (IPM) approach can help meet the demand from producers, consumers and the society. Hence, significant efforts are being made to develop tools for precision application of agro-chemicals to obtain high yields while reducing the environmental impact [3]. Factors that can be optimized for improved yield are fertilizer and pesticide control, plant density, weed control, disease control and irrigation. Among these, reducing fertilizer usage through optimizing nitrogen levels throughout the season with variable N-rate technology is by far most popular. In potato, such optimization can reduce up to 25% of fertilizer usage benefiting both farmers and the environment [19]. Such optimization is possible through the use of advanced sensors integrated in the sowing and fertilizer spraying equipment in the field. Additionally, regular monitoring of the crop by precision farming can improve the yields while reducing the environmental impact.
Plant breeding and farming have varying needs for high-throughput field phenotyping, which will be compared and discussed in this review. Upcoming applications with the potential to dramatically improve sustainable intensification of agriculture are also summarized.

2. High-Throughput Field-Phenotyping (HTPP) Techniques

Plant breeding and farming have different phenotyping requirements. While the main goal of phenotyping in plant breeding is to identify plants with improved traits, phenotyping is currently mainly done for monitoring crops for fertilizer requirement and weed detection in crop cultivation. Future detection of pathogens and pests holds great promise to revolutionize precision agriculture [20]. The method of phenotyping may also differ based on the crop, trait, developmental stages and the resources available. Development of phenotyping tools and methods for both proximal and remote sensing accelerates screening and selection of germplasm. HTPP can enable screening of larger number of samples with higher accuracy and reduced costs, thereby improving the selection intensity and accuracy [21]. HTPP can also enable evaluation of traits that are otherwise invisible to the naked eye or are correlated with the trait of interest [22]. This broadens the genetic variation in the breeding material as germplasm with such traits could then be retained in the breeding programs.

2.1. Satellite Imaging

Satellite imaging is readily available with multispectral spatial resolution ranging from 1.24 m WorldView-4) to 260 m (CBERS-2). The major limitations with satellite imaging are the weather conditions, frequency of imaging, resolution, costs for imaging and the time it takes from image acquisition to access. Data from medium resolution satellites Sentinel 2 and Landsat 8 are freely available while the data from the high-resolution satellite is available commercially. As plant breeding trials usually consist of small sized plots, higher resolution satellite images are necessary. Tattaris et al. [23] evaluated satellite imaging for germplasm evaluation in a wheat breeding trial using Digital Globe WorldView-2 satellite with a multispectral spatial resolution of 1.84 m ground sample distance (GSD) and concluded that a plot size of 8.4 m at 2.4 m is big enough at that resolution, while a smaller plot size of 2 m at 0.8 m could not be analyzed. WorldView-3 is one of the most advanced satellites deployed and currently in service. It has a panchromatic nadir spatial sensor resolution of 0.31 m GSD and multispectral resolution of 1.24 m. Plant breeding programs often evaluate thousands of genotypes in small plots of approximately one square meter in size in early cycles of selection. Such plots are not possible to evaluate even with the most advanced satellite sensors currently available such as WorldView-3. Thus, for plant breeding trials, satellite imaging is useful for evaluation of moderate to large sized trial plots while for smaller plots, remote sensing with unmanned aerial vehicles (UAVs) and proximal phenotyping are viable alternatives. As yield trials are done at later generations of selections and are often performed with larger plot sizes of several meters in width and length, satellite imaging could be a viable alternative for evaluating yield trials in plant breeding. Such yield trials are often replicated at several locations to study genotype by environment interactions. Satellite imaging could be especially valuable for such trials as these locations are often spread out across the country making it more laborious to perform proximal or drone-based measurements. Thus, considering the continuous reduction in costs for satellite imaging, greater demands for satellite imaging in plant breeding can be expected to be in evaluation of multi-location yield trials.
For applications in precision agriculture, the key requirements of satellite imaging are the presence of the required bands for measuring plant health and the revisit frequency. Applications of satellite imaging for precision agriculture has been reviewed earlier [24,25]. Primary applications include overall observation for physical damage of crops due to abiotic and biotic stresses, variable rate fertilization, crop development and irrigation. Often, in precision agriculture, satellite imaging results are integrated with weather predictions to develop prediction models for disease outbreaks. One of the key requirements is a higher frequency of satellite revisits to the same location as most of the relevant decisions to be made on the farms are time sensitive. A delayed decision for example in requirement for watering or fertilization can lead to loss of economic yield. Satellite revisit frequencies can range anywhere from 1 to 7 days depending on the satellite [24] and thus for application of satellite imaging in precision agriculture, important decisions need to be made in selecting a satellite with revisit frequency, available spectral bands and imaging resolution. Nonetheless, cloud cover can interfere with imaging. Variation even locally can be large between cloud-free days as nicely shown by [26] and some regions such as northern Europe have a relatively high degree of cloud cover during the growth seasons. To this end, UAVs have an advantage over satellite imaging.

2.2. UAVs

UAVs are broadly classified into four groups, namely parachutes, blimps, rotocopters and fixed wing systems [27]. Rotocopters are generally flown at an altitude between 10 and 200 m, thus providing a significantly higher spatial resolution and a lower ground sampling distance compared to satellites that are at an altitude of approximately 700 km. The final spatial resolution of the orthomosaic depends on sensor dimensions, camera focal length and distance from the ground object. UAVs have been tested extensively for applications in plant breeding for evaluating various traits in different crops.
Fixed wing gliders have also been tested for plant breeding trials. A fixed wing glider mounted with a multispectral camera was flown at an altitude of 150 m to evaluate low nitrogen stress variation in bred-wheat germplasm [28]. A fixed wing glider with a camera with red, green and blue (RGB) bands was used at an altitude of 150 m to estimate the height of sugarcane plants [29]. Fixed wing glider and motorized parachute were tested for phenotyping of small wheat breeding plots [30].
Tattaris et al. [23] used an octocopter mounted with multispectral and thermal sensors to evaluate spring wheat trials for yield and biomass at an altitude between 30 and 100 m. Xu et al. [31] used an octocopter with an RGB camera to evaluate cotton trials at 15 m flight height. A hexacopter with a thermal camera was used to evaluate drought tolerance in black poplar with flights at 25 m altitude [32]. A rotocopter 3DR Solo (3D Robotics Inc., Berkeley, CA, USA) with a multispectral camera was used at an altitude between 20 and 30 m to evaluate wheat trials with an aim to estimate vegetation indices with deep learning [33]. An octocopter with an RGB camera was flown at an altitude of 50 m to digitally count maize plants [34]. A hexacopter with an RGB camera was used to estimate the height of wheat plants from an altitude of 50 and 75m and high correlations were obtained with height measurements done manual and by LiDAR [35]. The grain yield of maize plants was estimated with vegetation index maps and 3D crop surface models using a hexacopter with an RGB camera from 50 m altitude [36]. An octocopter with an RGB camera was used at an altitude of 50 m to estimate biomass and height of barley plants [37]. A pheno-copter with RGB, near-infrared and a thermal camera was used to study ground cover in sorghum, canopy temperature in sugarcane and crop lodging in wheat [38]. Overall, these research results highlight the immense potential of UAVs in plant breeding applications and with continuous reduction in UAV costs and development of protocols for imaging and analysis, UAV-based selection of superior breeding lines and clones will accelerate germplasm enhancement of crops and may increase related genetic gains.
Orthomosaics generated by imaging by UAVs can have large inaccuracies due to various factors such as lens distortion, GSD, overlap of the acquired images during flight and the equipment used for estimating camera positions during image acquisitions. Large errors in x, y and z planes can occur if proper rectification of error is not performed while building orthomosaics. Therefore, estimation and reducing error in orthomosaics is necessary to perform quantitative analysis or even identification of the objects in the image. Failing to rectify such errors can lead to large inaccuracies in quantifications. Errors can be controlled by reducing the GSD; i.e., using a high-resolution camera or flying at the lowest possible altitude, thereby, improving resolution of the obtained orthophoto. Another effective way to reduce error is to use ground control points (GCPs) which are the checkpoints or locations in the orthophoto with known position coordinates. GCPs can drastically increase the absolute accuracy of the orthophoto to 2–5 cm both horizontally and vertically. For example, Khan et al. [33] by flying at a lower altitude (20 m) obtained lower GSD and further incorporated GCPs to produce accurate orthophotos; whereas Xu et al. [31] used a Lumix DMC-G6 camera with a 16 megapixel sensor at an altitude of 15 m to reduce GSD. However, information was not provided on whether GCPs were also used for further rectification. Quality of the orthomosaics and horizontal and vertical accuracies are essential for research. It is thus recommended to include such estimates in scientific publications to allow readers to objectively evaluate the significance of the obtained results and for comparisons with other studies. In the case study EnBlightMe! described below, orthomosaics had to be abandoned for disease detection with computer vision due to the loss in resolution and single images were instead used.

2.3. Proximal Phenotyping

Phenotyping of plants done with ground-based vehicles and sensors is categorized as proximal phenotyping. Sensors can be handheld or mounted on phenotyping platforms such as vehicles, stationary towers and cable suspensions [39]. Handheld sensors are commonly used for estimating plant chlorophyll fluorescence, canopy temperature, nitrogen content, leaf area and plant height. Handheld infrared thermometer was used to estimate drought tolerance in maize [40]. Handheld spectroradiometers were used to identify yellow rust, Septoria tritici blotch, nitrogen use efficiency and several morphological and physiological traits in wheat [41,42,43,44]. Handheld chlorophyll meters and chlorophyll fluorescence meter were used for estimating plant health, photosynthesis, plant nitrogen status and yield plus its components in several crops [40,44,45,46,47,48].
Several mobile platforms are being developed and tested for applications in plant breeding and are commonly used for estimating plant biomass, leaf area index, counting plants, plant height, early vigor and plant maturity. Mobile platforms can be maneuvered manually or can be motorized for motion. Manually steered platforms are more affordable and easier to build. Phenocart was developed with a bicycle wheel and a metal frame and mounted with an infrared thermometer, multispectral sensor, RGB camera and a global navigation satellite system (GNSS) positioning receiver [49]. It was tested in a field trial with wheat breeding lines for evaluation of the correlation of grain yield with canopy temperature and plant health. A proximal sensing cart (PSC) was custom built on two bicycles and a metal frame carrying three infrared thermometers, two digital cameras, a GPS receiver for positioning and two data loggers [50]. PSC was used in breeding nurseries of wheat, barley, camelina and cotton. In another study, a modified version of PSC was developed containing an infrared thermometer, ultrasonic transducer, multispectral reflectance sensor, GPS receiver, altitude heading and reference system, RGB cameras, data logger and weather station [51]. It was demonstrated for evaluating drought tolerance in cotton germplasm. Further modification of PSC was done to evaluate up to four rows at a time and was tested in soybean and wheat field trials [52].
Mobile motorized platforms have also been developed allowing greater convenience with mobility in the field. Phenomobile with a hydraulic drive system carries three LiDAR sensors, four RGB stereo cameras, hyperspectral camera, infrared thermometer, a light source mounted on a height adjustable boom and a real-time kinematic (RTK) GPS with 2 cm accuracy for position accuracy [39]. Phenomobile was successfully used in a wheat breeding trial for estimating canopy height, counting spikes in wheat canopies, canopy temperature and plant stress [39]. PhenoTrac 4 is a tractor modified to carry three active spectral sensors, a passive hyperspectral sensor and RTK-GPS to positioning. PhenoTrac 4 was evaluated in wheat and barley breeding nurseries for estimating plant nitrogen uptake, grain yield and plant dry weight [53,54,55]. A plant phenotyping system was developed on a high-clearance tractor mounted with sonar proximity sensor for measuring canopy height, infrared thermometer for canopy temperature, a multispectral sensor for plant health, a GPS receiver and data loggers [56]. Four sets of sensors were used to evaluate four rows of cotton plants at the same time. In another study, a similar high-clearance tractor was used to mount a LiDAR scanner and an RTK-GPS for building 3D models of cotton plants. From the obtained data, canopy height, canopy area and plant volume were estimated [57]. In yet another study, a phenotyping vehicle called “GPhenoVision” was developed using a high-clearance tractor, and mounted with a stereo RGB camera, thermal camera, hyperspectral camera and an RTK-GPS [58]. It was tested in a cotton breeding trial to estimate canopy growth and development. A cable suspended field-phenotyping platform was also developed with a maximum sensor height of 6 m from the ground covering 1 ha rectangular field [59].
In the breeding trials, it is often necessary to evaluate plants for multiple traits such as morphology, phenology, adaptation to abiotic stresses, host resistance to pathogens and pests, and overall health. Hence, it is beneficial in a phenotyping platform to have the possibility to evaluate multiple traits in parallel. This approach reduces costs, saves time and reduces possible errors caused by multiple rounds of phenotyping done by different people on the same plots. Low-cost phenotyping handheld sensors are useful for evaluation of a few hundred plots. However, for a large breeding nursery, it is less feasible to use handheld sensors due to the time and labor required and the errors associated with temporal variation in measurements. The advantages of a mobile platform over the handheld sensor are the ability to evaluate multiple traits and multiple rows in parallel, thus reducing costs and time. Manually maneuvered platforms are affordable and are relatively easy to build. The motorized platforms have the additional benefits of reducing the labor of pushing the vehicle, possibilities to carry more sensors and weight and an onboard energy source for including external lights. The motorized platforms are however expensive and require technical knowhow to build and operate.

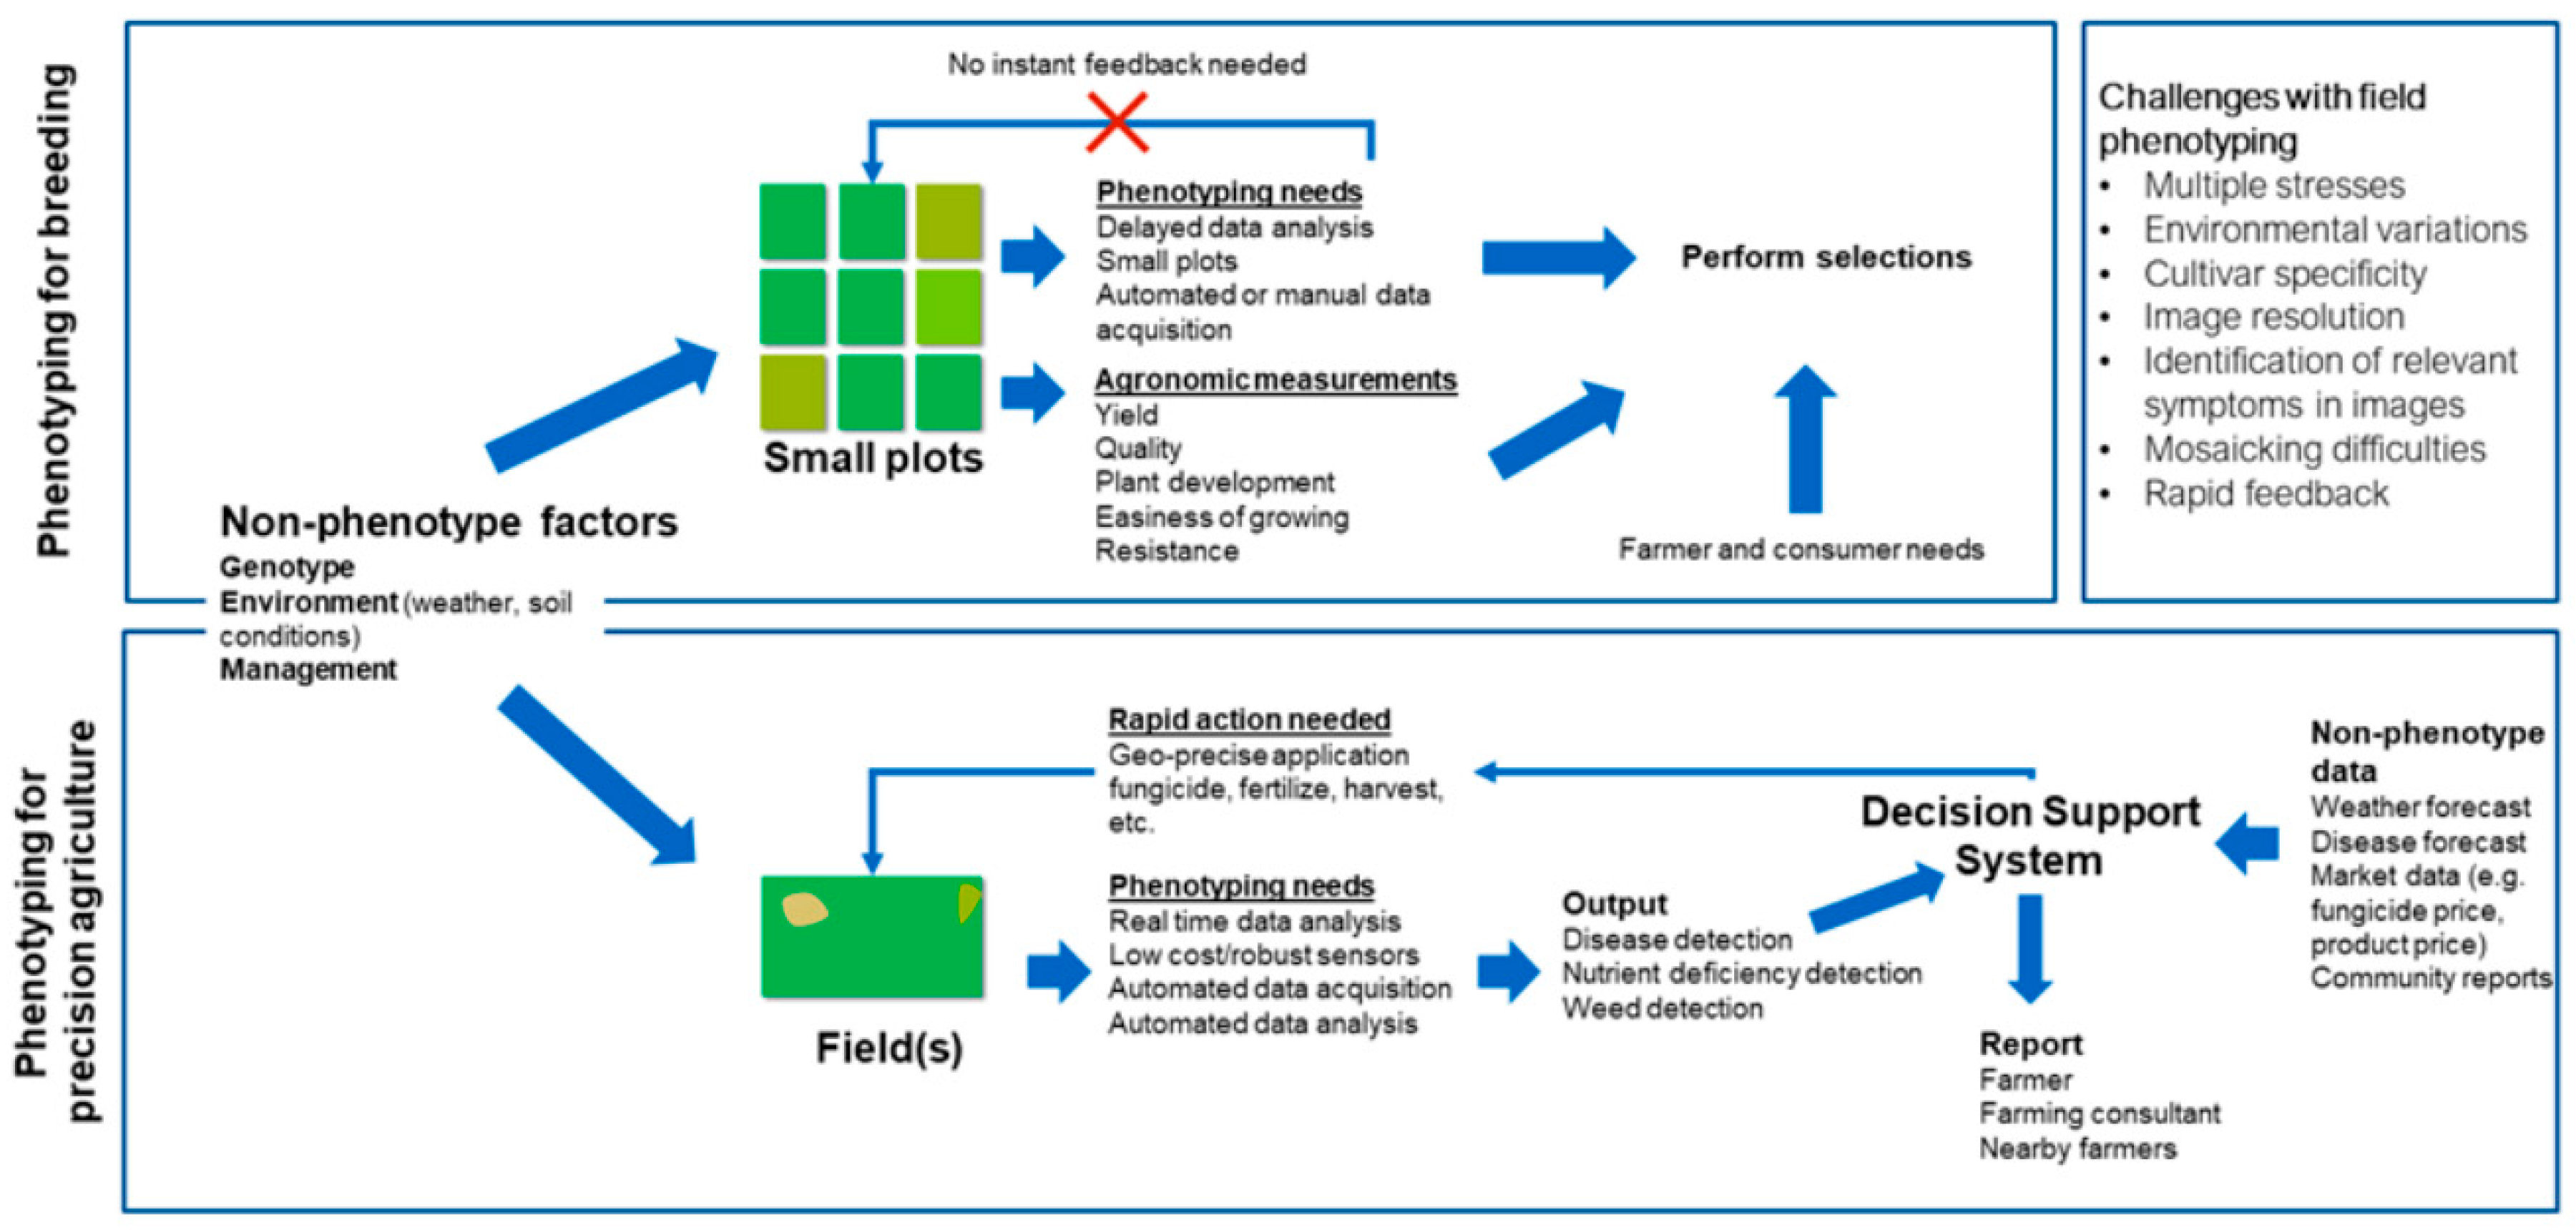
3. High-Throughput Phenotyping for Plant Breeding

The main goal of plant breeding is to develop new cultivars that perform better than those grown in the target population of environments. This increase in performance achieved in a given time through artificial selection, is called genetic gain [60]. The narrow sense heritability (h2) or the ratio between additive genetic (σ2A) and phenotypic (σ2P) variances, selection intensity (i.e., the proportion of individuals selected and advanced to the next generation), parental control of males and females (c), and time determine genetic gains (ΔG) as per the following plant breeding equation:
ΔG = (Κ c σ2A)/(Y σP)
where Κ is the selection differential in standard deviation units and Y is the number of years required per cycle. Plant breeding maximizes ΔG by managing the components of this equation, thus suggesting that the smaller the selection differential, the lower response to it. Likewise, the degree of success to change the population genotypic structure through altering its gene frequency depends on precise phenotyping and selection. In this regard, the maximum selection efficiency will be when genotypes are rightly screened for further selection that increases the frequency of favorable alleles. Field trials in plant breeding are mainly comprised of small plots in the range of 1 to 10 m in length for evaluation of thousands of breeding lines and clones for various agronomic traits (Figure 1). Replicated trials are often conducted at multi-environment trials to take into spatial (among sites) and temporal (between years or seasons) variation, as well as to account the genotype × environment × resource and crop management interaction [61]. This approach facilitates evaluation of genotypes (breeding lines, clones or populations and cultivars) in diverse environments (weather, soil, or abiotic stress related to salinity and watering) and under different management practices and input use (fertilizers, pesticides and tillage) [62]. Thus, major challenges for field phenotyping in plant breeding are measuring thousands of plots at multiple environments while considering the resources available, time required for the measurements, quality of the acquired data and data analysis. In this aspect, high-throughput phenotyping provides possibilities for increasing selection intensity, improving selection accuracy and improving the decision support system [21].
With wrong phenotyping, plant breeding becomes inefficient and sometimes worthless because any screening of genotypes will be as efficient as its protocol allows, and any bias –as per its magnitude – may significantly affect genetic gains. It is noteworthy to understand that selection is most effective at early breeding cycles when the frequency of favorable alleles in the target population is low. Any imprecise phenotyping protocols, especially in small or finite breeding populations, will lower genetic gains because of the very low frequency of favorable alleles. HTPP data can be integrated with the genotypic data to further improve genetic gain. Rutkoski et al. [22] integrated HTPP and genotypic data for building genomic prediction models to predict grain yield in wheat. HTPP data used in their study was obtained with a UAV mounted with thermal and multispectral cameras. Canopy temperature and the vegetation indices RNDVI and GNDVI were estimated from the obtained data and were used as secondary traits in the genomic prediction model. The results showed that the secondary traits increased the genomic prediction accuracies for grain yield in wheat between 56 and 70%. Crain et al. [63] evaluated genomic prediction models by integrating NDVI and canopy temperature data with genotypic data. HTPP data was collected with Phenocart and proximal phenotyping. They obtained accuracy gains of 7%, thus indicating that the HTPP traits have additive effects. Their results indicate that collecting multiple phenotypic traits in breeding programs is beneficial for improving accuracy of genomic prediction. Juliana et al. [64] evaluated efficiencies for predicting grain yield in wheat by genomic selection and HTPP and concluded that integrating genomic selection and HTPP allows screening of large populations thereby increasing selection intensity. They identified four benefits of such an integrated approach, namely minimizing replications, scaling up selections both for large nurseries and early generations and increasing selection accuracies therein. Brown et al. [65] proposed that plant traits can be phenotyped throughout the developmental stages under multiple environments followed by genotyping to identify causal genes underlying the traits of interest. Machine learning methods can also assist in precision phenotyping and thereby can improve genetic gain [60,61,62,63,64,65,66,67]. Several machine learning algorithms have been tested for HTPP data and were summarized earlier [66].

4. Phenotyping for Precision Agriculture

The needs for plant phenotyping for precision agriculture are somewhat different compared to that for plant breeding and hence requires different approaches and solutions. Phenotyping is still focused on maximizing stable yields and securing crop quality [3]. The aim should also be to minimize the risks for abiotic and biotic stresses during crop production by monitoring the health status of the crop in a non-destructive way as sentinels of the field and its surroundings. Phenotyping in precision agriculture is used to improve management practices, which contrasts with plant breeding where it aids in the selection of relevant genotypes [13]. Efficient monitoring by phenotyping in precision agriculture should ultimately also reduce the need for pesticide use (see Section 5). To protect the crop in the field, the key factors that can be addressed by field phenotyping are irrigation, fertilization and pest management. It is important to compare different monitoring methods for plant health assessment, severity and documentation. For example, infection by beet cysts nematode (BCN) in sugar beet in outdoor conditions measured by visible imaging, thermography and spectrometry showed strengths and weaknesses of all three methods [68]. Visible imaging was the earliest stress indicator, since canopy coverage was a good cue for nematode resistance, whereas spectrometry and thermography identified the stress when the canopy reached full coverage. This highlights the importance of identifying suitable measuring parameters for imposed stress. Still, using only visible image analysis might be dangerous, as Joalland et al. [68] rightly conclude, since it might not be specific enough for nematode damage because canopy area reduction can be caused by many other types of stresses. Here, additional information from near-infrared bands can be useful to distinguish diseases and assess severity. This highlights the challenge of the field as a place of multiple stresses [12]. In a related study by Joalland et al. [69], the spectral information derived from a handheld and an UAV-borne sensor differed, even if both methods could distinguish between nematode susceptible and tolerant cultivars. The partial lack of consistency in correlation between the detection methods was explained by differences between sensors and how the measurements were carried out including the calibration procedure. One major difference was that the ground sample resolution differed between the methods where the handheld device covered a few points for each treatment whereas the UAV-borne sensor averaged the information from thousands of pixels. In practice, UAVs would be more effective for precision agriculture since it can monitor larger areas with less work-input. Several additional traits useful to determine nematode resistance such as canopy height, spectrally inferred chlorophyll content, and canopy temperature were identified. This shows the importance of choosing the right sensors and carrier vehicles to monitor plans in precision agriculture, calling for user-tailored pipelines for the specific problem [13,70], since the successful combination of sensors and carriers is likely to be stress-specific. These studies also highlighted the clear influence on detection depending on plant developmental stage, cultivar and disease pressure. Not least cultivar dependence will be a challenge for uniformed phenotyping criteria for stress in the field, since thresholds for detection, spectral indices and wavelengths etc. to be used will be cultivar-specific [69].
Image analysis can be done either based on spectral imaging or pattern recognition by computer vision, which will again influence the choice of vehicle and resolution needed. Combinations of reflectance data and machine learning worked well for plant-disease detection, but needs to be further explored under field conditions. However, there are several examples of mining machine learning to spectral reflectance data of plant-disease symptoms in the laboratory. One early example is the use of Support Vector Machines (SVM) to classify reflectance values the level of leafminer infection in leaves [71]. Computer vision also needs further explorations in field settings, but have great prospects for identification, classification and diagnosis of disease for example through the use of handheld smartphones [72].
So far, proper benchmarking of detection thresholds of plant disease between spectral imaging and computer vision is missing and should be tested especially in field settings. For stress factors causing homogenous and consistent symptoms, which are easily identified by manual inspection across cultivars and even species, computer vision will be possibly less dependent on cultivar intrinsic characteristics compared to changes in spectral composition. Again, this needs to be further tested. Sa et al. [73] showed the possibilities of combining the two by feeding a deep neural network with multispectral images. They showed that the best weed detection predictions came from the spectra used for NDVI calculation.
In phenotyping by imaging, image retrieval needs to be linked to geographical information to tailor the actions needed in the field. Detection also needs to be done early, for example, symptoms at an early stage or in isolated parts of a field. Furthermore, analysis needs to be fast (within days) to prevent losses. Ultimately, a suggestion of the type of stress and even agent causing the disease should be given. Decision support systems (DSS) including phenotype data for example in a cloud-based smart management systems for precision agriculture should be linked to weather data to be able to predict the urgency of the action needed as well as to economic data so that the farmer is able to weigh in the prevention cost and possible crop yield and quality effects of different measurements against each other (Figure 1 and Figure 2). This calls for automatic weighting of different types of input data leading up to a suggested action for the farmer. Furthermore, data collected from satellite imaging as well as regional and national digital plant health maps could be used for preparing digital soil maps of arable land [26].

4.1. Optimizing Fertilization

Soil nutrient levels such as those for nitrogen are not uniform [74]. Applying a uniform rate of fertilizer to these fields is therefore inefficient and can both have a negative impact on the environment and lower the quality and yield of the crop. Traditionally, soil samples are analyzed to estimate the soil nitrogen content. Using this information, fertilization is applied at a variable rate to save resources and reduce nitrogen leakage [75]. A more crop-centric approach is to perform plant phenotyping by optical sensors, to determine where in the field the nutrient content is low, and distribute fertilizers according to this information [28]. This can have a large positive yield effect. For example, the lack of iron could account for up to 20% yield loss in soybean. In this regard, Naik et al. [76] showed that it is possible to detect the deficiency of iron in soybean at up to 100% accuracy using several machine learning approaches. An end-to-end app was developed in which a user could take a picture of a soybean plant, for analysis of iron deficiency. Still, the challenge is to be able to phenotypically separate different types of nutrient differences and possibly even worse nutrient deficiency and certain disease as well as combinations thereof. This would call for combination of different spectral wavelengths and vegetation indices to make this distinction [20].

4.2. Detecting Diseases and Pests

Automated, early detection of diseases in the field would be an immensely valuable warning system for farmers and take crop protection to a new level. It would reduce crop losses and decrease the need for pesticide use. Furthermore, it would simplify the application of integrated pest management (IPM) where disease monitoring is one of the six key principles. At present, manually searching fields for disease symptoms is the only option. This is time-consuming, subjective and in developed countries lead to proactive spraying of fungicides since additional applications are cheap in comparison to the risk of crop loss. Early detection is a challenge since plant-pathogen interactions initially cannot be detected by RGB cameras. However, in controlled environments, pre-symptomatic detection has been done by hyper spectral imaging, e.g., in Cercospora beticola infection in sugar beet. Pioneering work was done by [77] by mounting a spectrograph (460–900 nm) on spray-boom height to Puccinia striiformis (yellow rust) in wheat and showed that four selected wavebands could distinguish disease at a level of 4 to 5% infection with 96% accuracy. Ultimately, the goal should be to be able to predict disease before it is visual to the naked eye. To firmly link non-visible symptoms to spectral changes in the field, would however require either manipulation by, for example, artificial inoculation of pathogens or molecular quantification through quantitative Polymerase Chain Reaction (PCR) of pathogen biomass for biotic stresses or expression of transcript, protein or metabolite markers for abiotic stresses. Virus infection could be a viable disease where infection could be distinguished earlier than by manual inspection, e.g., it has been shown that near-infrared and shortwave infrared is much more effective than visible wavelengths in detecting Potato virus Y (PVY) in potato [78].
To apply machine learning for disease recognition, classified datasets are extremely valuable but still rare in field settings probably because of the labor-intensiveness in retrieving accurate and high-resolved field-phenotyping data in enough quantities to be able to train a model. An extensive dataset containing 54,000 images from 12 plant species and 26 different disease species was generated by Mohanty et al. [72], who demonstrated the feasibility of training a neural network to correctly classify the plant-disease combination with up to 99% accuracy. However, when tested in the field, the accuracy dropped to 31%, which is still over ten-fold better than what one would expect for distinguishing between 38 different disease-crop combinations by chance alone. This result clearly demonstrates that the technology works in optimal conditions for image acquisition in the laboratory for specific applications such as differentiating between diseases quickly. However, no study has so far successfully demonstrated late blight detection under field conditions with a high-throughput system mounted on a UAV efficient enough for disease prevention during cultivation. Changes in ambient light intensity outdoors or light angle, among others, as well as the multi-stress environment the field represents are confounding factors. A task for future research will be to determine the affect and contribution of the confounding effects field conditions present. Using RGB imaging (80 m), Sugiura et al. [79] developed a processing protocol based on the identification of the change of pixel color between observation times to evaluate late blight severity. They found the method to be more objective than human disease scoring and thus useful for pre-breeding, but still could not detect late blight early enough (<2% infection) for it to be useful for farmers. A recent study compared spectral changes between ground-based imagery and high-resolution UAVs and managed to come down to identification at an infection level of 2.5–5% using UAV with 4-5 cm spatial resolution [80]. Surprisingly, this detection level compared to the 0.1 to 0.2 cm resolution, which raises the concern that it is not the resolution but rather the detection of spectral changes that is the limiting factor. Changes during disease progression were primarily seen as changes in the red-edge region, which is also associated with canopy and leaf structural traits, and thus might act as confounding factors to late blight detection since other stresses as well as senescence also can alter these traits.
Still, spectral imaging could have potential in large-scale objective and more time-resolved screening of plant lines for resistance breeding. It remains to be tested whether computer vision compared to spectral changes can provide earlier detection of diseases manifested in early symptoms visual to the human eye such as the symptoms of potato late blight.

4.3. Detecting Weeds

Weeds have the highest yield loss potential compared to pests and pathogens [81]. Currently, the most used method for combating yield loss due to weeds is by spraying herbicides. However, several species of weeds have developed herbicide resistance due to the overuse of herbicides [82]. In addition to herbicide resistance, it is wasteful to blanket spray an entire field with herbicides when only a small portion of the field is affected. Gonzalez-Andujar et al. [83] detected weeds in a rice paddy with accuracy between 0.88 and 0.94. Peña et al. [84] achieved up to 91% accuracy in detecting weeds in sunflower fields using a UAV, but it was highly dependent on the type of camera, the flight altitude and the time in the season. Blue River Technologies (Sunnyvale, CA, USA) commercialized this idea and designed a tractor that detects and selectively sprays weeds in real time.

4.4. Decision Support Systems

The future of precision agriculture depends on the precise and quick analysis of phenotypic data. DSS could combine the output of the analysis of phenotypical data for stress recognition, together with environmental data such as the weather, market data and possible information regarding disease reported from nearby farmers to optimize the yield and/or the profit for the farmer. However, so far, the use of DSS based on phenotypical data are not widespread. Even though the possibilities of combining several sources of data to optimize the yield are tremendous; acquiring, classifying and modelling this data into useful and reliable decision suggestions still require extensive research driven by both academia and industry. Apart from that, farmer’s acceptance and uptake of DSS is still low [85]. A change in mentality towards these systems is required, and there are several factors limiting the usage of DSS by farmers. The core factors for the potential acceptance of DSS by farmers are performance, ease of use, if they are recommended by peers or advisors, trust in DSS, cost, habit and relevance. Several characteristics of the farmer and its farm influence the factors mentioned above, including the age of the farmer, the size and type of its farm, and if the farmer had IT education. Development of new DSS should focus on optimizing the core factors. Even though some 350 DSS were reported by [85], very few DSS have been developed focusing on (automated) phenotyping. With a focus on small-scale farmers in developing countries, an open access mobile application based on deep machine learning to detect foliar symptoms of diseases in cassava using machine learning has been developed and tested in Tanzania [86,87]. Lately, recognition of the emerging insect pest fall armyworm was included showing the ability to adapt these app platforms relatively quickly to new plant diseases. Naik et al. [76] developed a phenotyping framework for the determination of soybean stress due to iron deficiency chlorosis (IDC). The workflow presented should be applicable to a high-throughput phenotyping platform, such as an UAV. Hallau et al. [88] presented a smartphone application that was able to detect and distinguish several leaf diseases, including Cercospora leaf spot, beet rust and bacterial blight in sugar beet using pictures taken by a smartphone. The machine learning algorithm had an accuracy of differentiating between these diseases of 82%, which was better than the accuracy of experts in this topic. In the next section, a case study is presented with a similar goal as of the research described above; i.e., detecting a plant disease using images taken by a smartphone or a camera mounted on a drone.

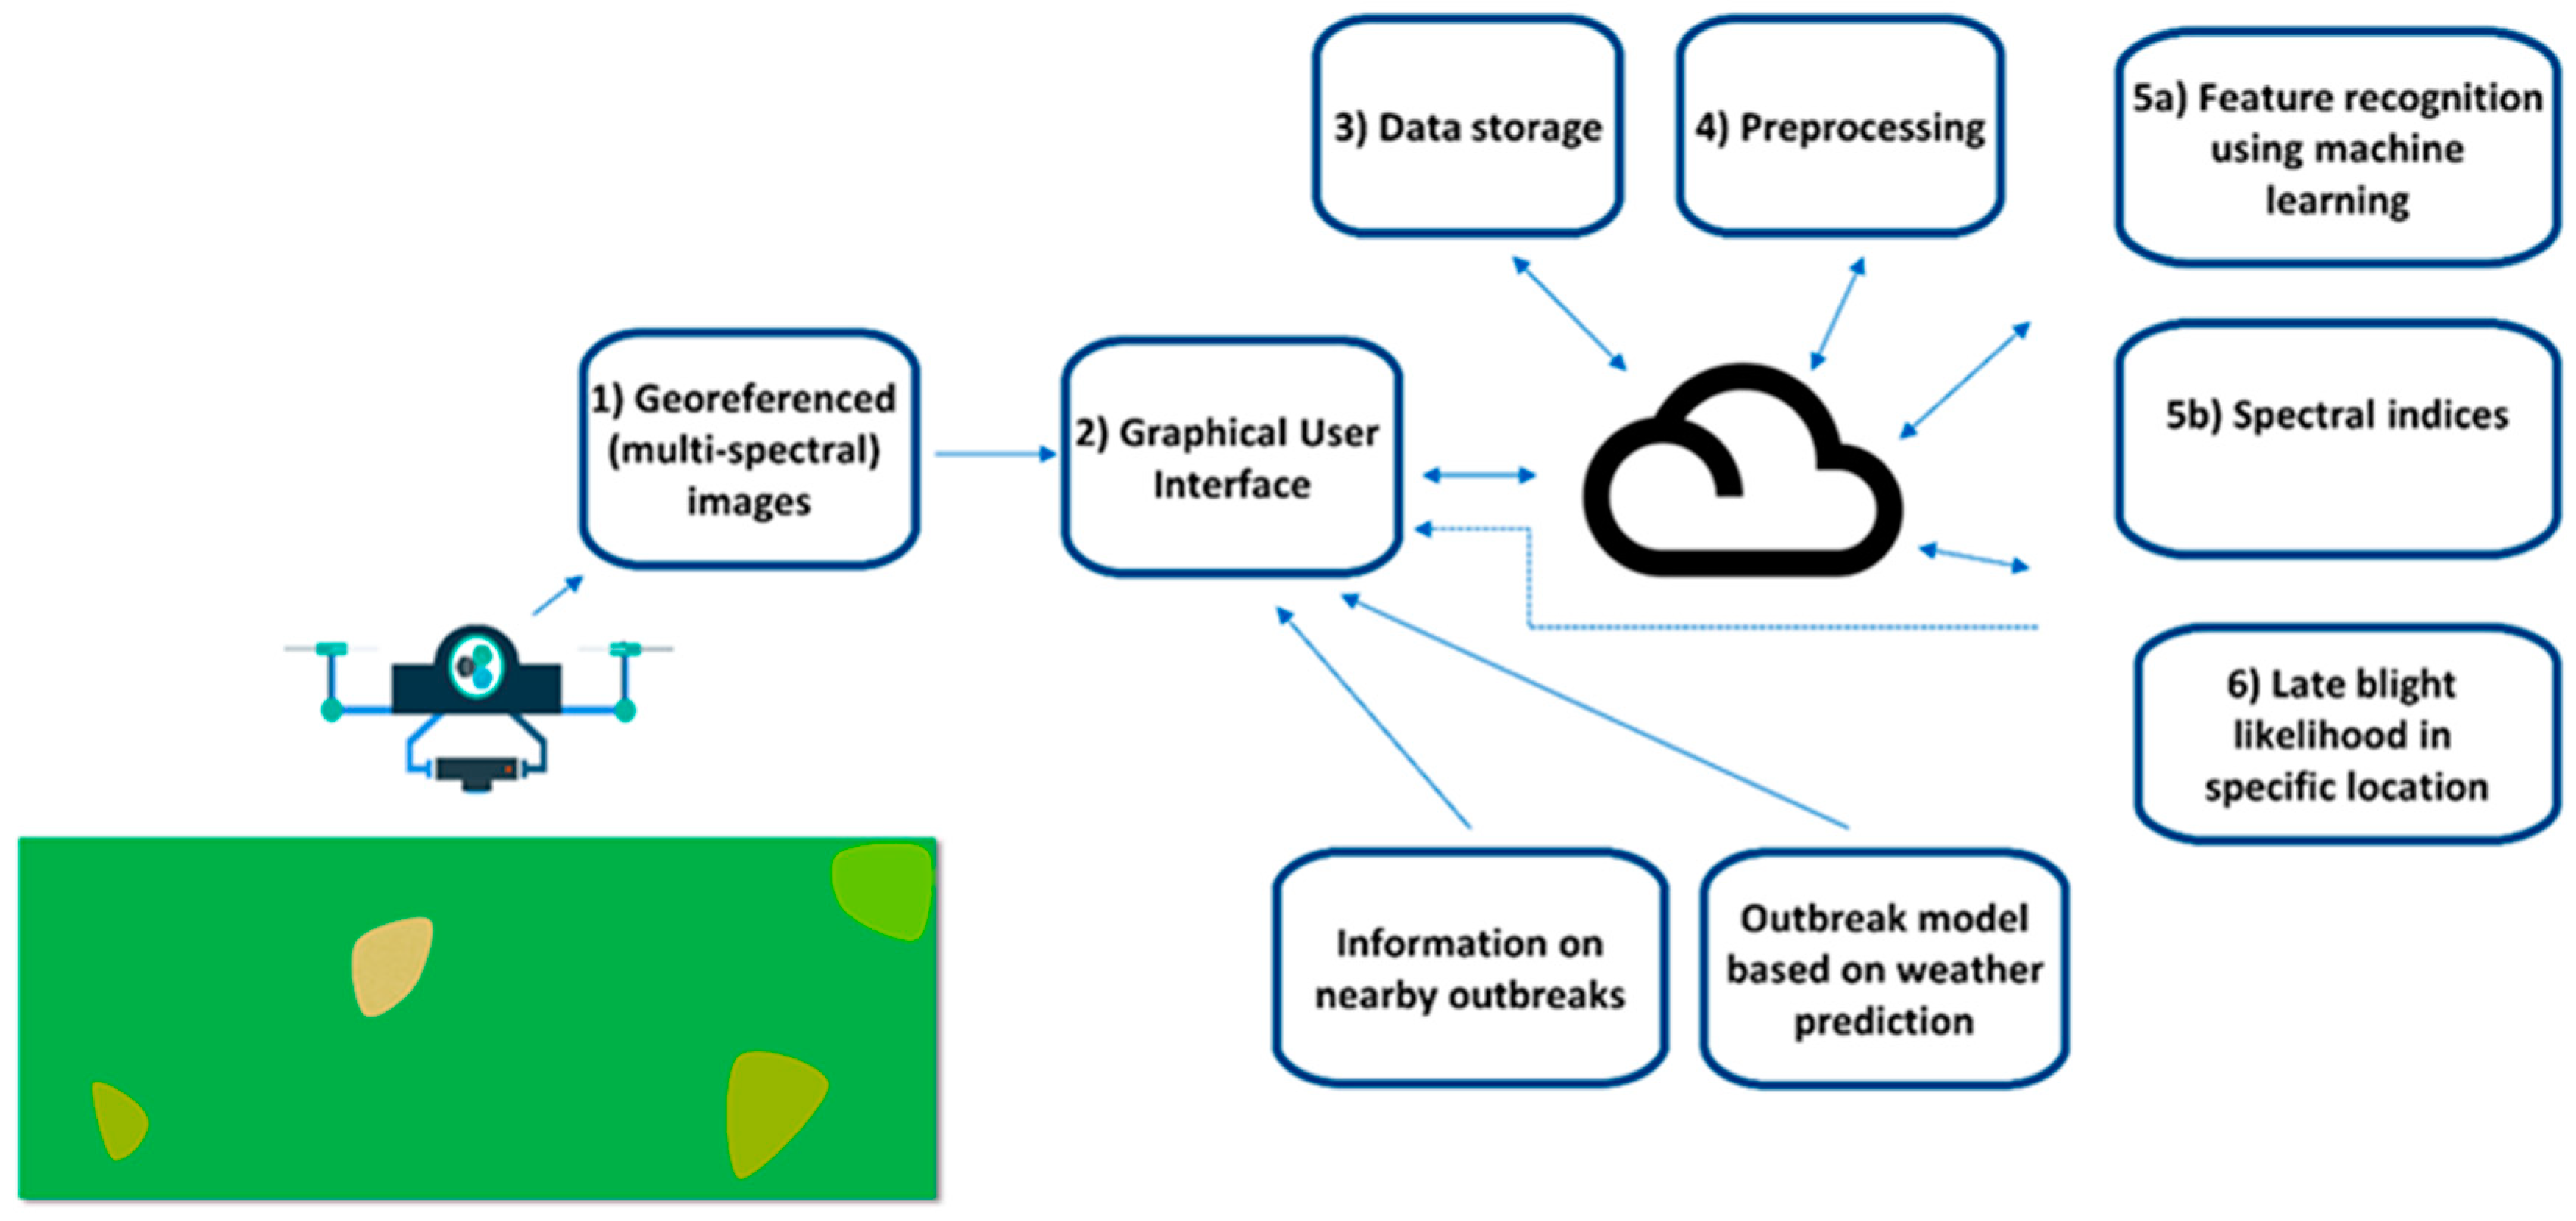
5. Case Study–Developing a DSS App to Combat Potato Late Blight

Potatoes are one of the world’s most important crops. About 400 million metric tons are produced annually whereof more than half is from the developing world [89]. Potatoes are also affected by several pathogens and pests. As an example, only about 1% of the cultivated land in Sweden is used for potato production, while around 20% of all fungicides are used for potato farming in Sweden [90]. This is mostly due to potato late blight, a disease caused by the oomycete Phytophthora infestans, which infects leaves, stems and tubers, and is visible with the naked eye as brown spots during its necrotrophic stage. The risk of an outbreak is related to the humidity and temperature in the growing season [91], and several models to predict the likelihood of a blight outbreak and accompanying DSSs are available and in use [92]. The main two approaches of tuber yield loss prevention due to late blight is pre-emptive spraying of fungicides for conventional farmers and manual identification and physical removal of the infected plant for organic farmers. Frequent fungicide spraying is both expensive and has a negative impact on the environment as its distribution by tractors leaves an extensive carbon footprint and it can affect the beneficial non-target organism. Manual identification and removal of infected plants is labor-intensive and error prone.
The EnBlightMe project was started with an aim to early detect late blight spots on potato plants with UAVs [93]. The process from idea to prototype followed the IBM Design Thinking procedure, which has a high focus on the users of the solution and their specific needs [94]. In practice, the project began with a daylong workshop with different stakeholders representing farmers, extension service, plant biologists and app developers in a set of activities, all resulting in a written down and visualized the result of thoughts, needs and challenges. This workshop formed the base on which development decisions were made throughout the project.
Several hundred images taken by a handheld RGB camera and an UAV-mounted RGB camera were classified according to the presence or absence of late blight. Machine learning methods for automatic detection and classification of possible late blight presence in the images were developed (Figure 2). As a showcase for the use of decision support systems in agriculture, the algorithm was packaged into an iOS app. It involved analyzing the user provided photographs, which were then preprocessed and analyzed by the trained model. The model would then display the likelihood of the picture(s) being infected by late blight. The app also includes a geographical information system (GIS) database of known blight outbreaks, and a prediction model of the likelihood of blight outbreaks using a forecast model using weather data. It was thus shown that it is possible to make a prototype app, incorporating multiple data-sources into a user-friendly application. However, complete automation of detection would require collection and classification of large amounts of data from different fields and from different drones and camera systems, and the feasibility of this needs to be researched further. In addition, iterative detection, suggestions and outcome of those suggestions should be analyzed to further optimize the machine learning algorithms and DSS coupled in this system to prevent yield loss and optimize fungicide use.
The role of phenotyping data in a DSS such as EnBlightMe is foremost dependent on the earliness of detection it can provide. The possible gains of phenotyping also must be weighed against the costs, since equipped UAVs still are comparatively expensive and image acquisition laborious. Presently, the threshold level of late blight detection is too high for timely, appropriate action to be taken. Possibly a detection level between 2.5 and 5% of affected leaf area as reported by Franceschini et al. [80] could be enough for organic farmers who only can delay late blight infections by physical removal of infected plants. This, however, remains to be tested in practice. Still, if phenotyping of multiple stresses becomes possible including other diseases, drought and nutrient deficiency can be worked into the system UAVs can give the additional benefit needed to make it a viable option in precision agriculture. At a national or regional level phenotyping-based satellite imaging could become a role in disease prediction for DSS.

6. Outlook

Field phenotyping for plant breeding has gained increased popularity in the recent years. Several published studies clearly indicate the benefits of field phenotyping for performing selections. As summarized in this review, sensors on various platforms from satellites to handheld devices were found to be effective for high-throughput phenotyping under various scenarios. There are however several challenges remaining to be solved in application of these technologies in breeding programs. A key challenge is to establish a common set of guidelines and standards for protocol optimization and reporting for a given technique. Accurate records and reporting of experimental parameters are required for reproducibility. Minimum Information About a Plant Phenotyping Experiment (MIAPPE) is a set of guidelines with a list of attributes to describe a phenotyping experiment [95]. MIAPPE considers a wide range of attributes for samples, experiment, environment and the results. Providing such data should help in proper interpretation and reproducibility. MIAPPE attributes can be further updated to also include the requirements for UAV-based experiments. Such data standardization efforts would be extremely valuable for reproducibility of UAV-based results. For precision agriculture standards for descriptions and reporting will be different and rather efforts to set individual likelihoods and thresholds for depending on the stress and disease and interacting crop genotype are needed. Here, the large challenge in interpreting phenotype data from multi-stress data should be addressed in more depth. Furthermore, in DSSs phenotype data is likely to be only one of many weighted input data.
Highly accurate orthomosaics are required if the goal is to study various plant growth parameters with UAVs. GCPs are commonly used to increase accuracy of the orthomosaics. It however takes a significant effort to map GCPs and collect location coordinates. Alternate technologies such as RTK and post-processed kinematic (PPK) are increasingly becoming popular for UAV mapping. RTK and PPK enable accurate orthomosaic generation without the need for GCPs thereby saving time and costs. However, both RTK and PPK requires special equipment and setup. The company DJI (www.dji.com) has recently released a drone with RTK (DJI Phantom 4 RTK) to enable precise mapping. More RTK-drones are expected by other providers in the near future. Compared to RTK, although the equipment required for PPK is relatively cheaper, it requires some post-processing of data for correction of imaging coordinates. Considering the cheaper cost at an equally good accuracy, PPK is expected to be widely adopted in the breeding and farming community for both proximal and remote sensing.
For precision agriculture the grand challenges lie in identification of cheap, robust, easy-to-use, rapid and automated phenotyping methods that can feed into DSS. A key-steps for researchers in this work is to try to establish suitable combinations of sensors, vehicles and analysis techniques, which in many cases will be specific to the disease and even intrinsic to the pathogen-crop interaction monitored. In addition, the field environment will provide challenges in sometimes rapidly varying light conditions, wind and temperature, as well as combinations of multiple stresses. Despite all these challenges, automated and systematic stress detection by field-phenotyping holds great promise to accelerate IPM where on-farm live monitoring of stress and disease are key factors to reduce the reliance on pesticides.

7. Conclusions

Plant phenotyping is still the bottleneck for breeding and farming as various challenges exist for their practical applications. Examples of the applications of these techniques are referred to in this article. However, we have identified several shortcomings in application of these techniques in breeding and farming. The key challenges are generation and reporting of accurate phenotyping data for proper interpretation of the obtained results and reproducibility. In precision agriculture, additional challenges are automated and rapid, even real-time, analyses, which are necessary for timely and appropriate intervention in fields or greenhouses. As new and improved sensors are developed continuously, another key challenge is to develop phenotyping systems that could be easily upgraded with the new sensors. Satellite imaging will continue to be used in precision agriculture. As new satellites are regularly launched, satellites with high-resolution and lower GSD will benefit the plant breeding and farming sectors.

Author Contributions

A.C., E.A. and R.O. conceived, planned and wrote the first draft of the review. Late blight case study was performed by J.v.H., H.B., O.B. and E.A. All authors contributed to the writing and reviewed the final draft.

Funding

This research was funded from Lantmännen Research Foundation (#2018F001), Nordic Council of Ministers (PPP #6P2), NordForsk (#84597), Vinnova (#2016-04386), SLF region grant, SLU Grogrund (#slu.ltv.2019.1.1.1-155) and Swedish Research Council (#2018-05179; #2017-05621).

Acknowledgments

We thank Peter Antkowiak, Mats Persson, Erland Liljeroth, Mats Söderström and Kristin Piikki for their valuable suggestions to the EnBlightMe project.

Conflicts of Interest

The authors declare no conflict of interest.

References

  1. Hunter, M.C.; Smith, R.G.; Schipanski, M.E.; Atwood, L.W.; Mortensen, D.A. Agriculture in 2050: Recalibrating Targets for Sustainable Intensification. Bioscience 2017, 67, 386–391. [Google Scholar] [CrossRef] [Green Version]
  2. Altieri, M.A.; Nicholls, C.I. The adaptation and mitigation potential of traditional agriculture in a changing climate. Clim. Chang. 2013, 140, 33–45. [Google Scholar] [CrossRef]
  3. Chawade, A.; Armoniene, R.; Berg, G.; Brazauskas, G.; Frostgard, G.; Geleta, M.; Gorash, A.; Henriksson, T.; Himanen, K.; Ingver, A.; et al. A transnational and holistic breeding approach is needed for sustainable wheat production in the Baltic Sea region. Physiol. Plant. 2018, 164, 442–451. [Google Scholar] [CrossRef] [PubMed] [Green Version]
  4. Collard, B.C.Y.; Mackill, D.J. Marker-assisted selection: An approach for precision plant breeding in the twenty-first century. Philos. Trans. R. Soc. B Boil. Sci. 2008, 363, 557–572. [Google Scholar] [CrossRef]
  5. Ghaffary, S.M.T.; Chawade, A.; Singh, P.K. Practical breeding strategies to improve resistance to Septoria tritici blotch of wheat. Euphytica 2018, 214, 122. [Google Scholar] [CrossRef]
  6. Bazakos, C.; Hanemian, M.; Trontin, C.; Jiménez-Gómez, J.M.; Loudet, O. New Strategies and Tools in Quantitative Genetics: How to Go from the Phenotype to the Genotype. Annu. Rev. Plant Biol. 2017, 68, 435–455. [Google Scholar] [CrossRef] [PubMed] [Green Version]
  7. Desta, Z.A.; Ortiz, R. Genomic selection: Genome-wide prediction in plant improvement. Trends Plant Sci. 2014, 19, 592–601. [Google Scholar] [CrossRef]
  8. Martin, L.B.B.; Fei, Z.; Giovannoni, J.J.; Rose, J.K.C. Catalyzing plant science research with RNA-seq. Front. Plant Sci. 2013, 4, 66. [Google Scholar] [CrossRef] [PubMed] [Green Version]
  9. Meijón, M.; Satbhai, S.B.; Tsuchimatsu, T.; Busch, W. Genome-wide association study using cellular traits identifies a new regulator of root development in Arabidopsis. Nat. Genet. 2013, 46, 77–81. [Google Scholar] [CrossRef]
  10. Chawade, A.; Alexandersson, E.; Bengtsson, T.; Andreasson, E.; Levander, F. Targeted proteomics approach for precision plant breeding. J. Proteome Res. 2016, 15, 638–646. [Google Scholar] [CrossRef]
  11. Acharjee, A.; Chibon, P.-Y.; Kloosterman, B.; America, T.; Renaut, J.; Maliepaard, C.; Visser, R.G.F. Genetical genomics of quality related traits in potato tubers using proteomics. BMC Plant Biol. 2018, 18, 20. [Google Scholar] [CrossRef]
  12. Alexandersson, E.; Jacobson, D.; Vivier, M.; Weckwerth, W.; Andreasson, E. Field-omics—Understanding large-scale molecular data from field crops. Front. Plant Sci. 2014, 5, 286. [Google Scholar] [CrossRef] [PubMed]
  13. Mahlein, A.K. Plant Disease Detection by Imaging Sensors—Parallels and Specific Demands for Precision Agriculture and Plant Phenotyping. Plant Dis. 2016, 100, 241–251. [Google Scholar] [CrossRef]
  14. Minervini, M.; Scharr, H.; Tsaftaris, S.A. Image Analysis: The New Bottleneck in Plant Phenotyping [Applications Corner]. IEEE Signal Process. Mag. 2015, 32, 126–131. [Google Scholar] [CrossRef] [Green Version]
  15. Reynolds, D.; Baret, F.; Welcker, C.; Bostrom, A.; Ball, J.; Cellini, F.; Lorence, A.; Chawade, A.; Khafif, M.; Noshita, K.; et al. What is cost-efficient phenotyping? Optimizing costs for different scenarios. Plant Sci. 2019, 282, 14–22. [Google Scholar] [CrossRef] [PubMed]
  16. Pretty, J.N. The sustainable intensification of agriculture. Nat. Resour. Forum 1997, 21, 247–256. [Google Scholar] [CrossRef]
  17. Elmgren, R.; Larsson, U. Nitrogen and the Baltic Sea: Managing nitrogen in relation to phosphorus. Sci. World J. 2001, 1, 371–377. [Google Scholar] [CrossRef] [PubMed]
  18. Heick, T.M.; Justesen, A.F.; Jørgensen, L.N. Resistance of wheat pathogen Zymoseptoria tritici to DMI and QoI fungicides in the Nordic-Baltic region—A status. Eur. J. Plant Pathol. 2017, 149, 669–682. [Google Scholar] [CrossRef]
  19. Kempenaar, C.; Been, T.; Booij, J.; van Evert, F.; Michielsen, J.-M.; Kocks, C. Advances in Variable Rate Technology Application in Potato in The Netherlands. Potato Res. 2018, 60, 295–305. [Google Scholar] [CrossRef] [PubMed]
  20. Mahlein, A.K.; Steiner, U.; Dehne, H.W.; Oerke, E.C. Spectral signatures of sugar beet leaves for the detection and differentiation of diseases. Precis. Agric. 2010, 11, 413–431. [Google Scholar] [CrossRef]
  21. Araus, J.L.; Kefauver, S.C.; Zaman-Allah, M.; Olsen, M.S.; Cairns, J.E. Translating High-Throughput Phenotyping into Genetic Gain. Trends Plant Sci. 2018, 23, 451–466. [Google Scholar] [CrossRef] [PubMed] [Green Version]
  22. Rutkoski, J.; Poland, J.; Mondal, S.; Autrique, E.; Pérez, L.G.; Crossa, J.; Reynolds, M.; Singh, R. Canopy Temperature and Vegetation Indices from High-Throughput Phenotyping Improve Accuracy of Pedigree and Genomic Selection for Grain Yield in Wheat. G3 Genes Genomes Genet. 2016, 6, 2799–2808. [Google Scholar] [CrossRef] [PubMed] [Green Version]
  23. Tattaris, M.; Reynolds, M.P.; Chapman, S.C. A Direct Comparison of Remote Sensing Approaches for High-Throughput Phenotyping in Plant Breeding. Front. Plant Sci. 2016, 7, 1131. [Google Scholar] [CrossRef]
  24. Yang, C. High resolution satellite imaging sensors for precision agriculture. Front. Agric. Sci. Eng. 2018, 5, 393–405. [Google Scholar] [CrossRef]
  25. Seelan, S.K.; Laguette, S.; Casady, G.M.; Seielstad, G.A. Remote sensing applications for precision agriculture: A learning community approach. Remote Sens. Environ. 2003, 88, 157–169. [Google Scholar] [CrossRef]
  26. Piikki, K.; Söderström, M. Digital soil mapping of arable land in Sweden—Validation of performance at multiple scales. Geoderma 2017. [Google Scholar] [CrossRef]
  27. Sankaran, S.; Khot, L.R.; Espinoza, C.Z.; Jarolmasjed, S.; Sathuvalli, V.R.; Vandemark, G.J.; Miklas, P.N.; Carter, A.H.; Pumphrey, M.O.; Knowles, N.R.; et al. Low-altitude, high-resolution aerial imaging systems for row and field crop phenotyping: A review. Eur. J. Agron. 2015, 70, 112–123. [Google Scholar] [CrossRef]
  28. Zaman-Allah, M.; Vergara, O.; Araus, J.L.; Tarekegne, A.; Magorokosho, C.; Zarco-Tejada, P.J.; Hornero, A.; Albà, A.H.; Das, B.; Craufurd, P.; et al. Unmanned aerial platform-based multi-spectral imaging for field phenotyping of maize. Plant Methods 2015, 11, 35. [Google Scholar] [CrossRef]
  29. De Souza, C.H.W.; Lamparelli, R.A.C.; Rocha, J.V.; Magalhães, P.S.G. Height estimation of sugarcane using an unmanned aerial system (UAS) based on structure from motion (SfM) point clouds. Int. J. Remote Sens. 2017, 38, 2218–2230. [Google Scholar] [CrossRef]
  30. Lelong, C.; Burger, P.; Jubelin, G.; Roux, B.; Labbé, S.; Baret, F. Assessment of Unmanned Aerial Vehicles Imagery for Quantitative Monitoring of Wheat Crop in Small Plots. Sensors 2008, 8, 3557–3585. [Google Scholar] [CrossRef]
  31. Xu, R.; Li, C.; Paterson, A.H.; Jiang, Y.; Sun, S.; Robertson, J.S. Aerial Images and Convolutional Neural Network for Cotton Bloom Detection. Front. Plant Sci. 2018, 8, 2235. [Google Scholar] [CrossRef] [Green Version]
  32. Ludovisi, R.; Tauro, F.; Salvati, R.; Khoury, S.; Mugnozza Scarascia, G.; Harfouche, A. UAV-Based Thermal Imaging for High-Throughput Field Phenotyping of Black Poplar Response to Drought. Front. Plant Sci. 2017, 8, 1681. [Google Scholar] [CrossRef] [PubMed]
  33. Khan, Z.; Rahimi-Eichi, V.; Haefele, S.; Garnett, T.; Miklavcic, S.J. Estimation of vegetation indices for high-throughput phenotyping of wheat using aerial imaging. Plant Methods 2018, 14, 20. [Google Scholar] [CrossRef]
  34. Gnädinger, F.; Schmidhalter, U. Digital Counts of Maize Plants by Unmanned Aerial Vehicles (UAVs). Remote Sens. 2017, 9, 544. [Google Scholar] [CrossRef]
  35. Madec, S.; Baret, F.; de Solan, B.; Thomas, S.; Dutartre, D.; Jezequel, S.; Hemmerlé, M.; Colombeau, G.; Comar, A. High-Throughput Phenotyping of Plant Height: Comparing Unmanned Aerial Vehicles and Ground LiDAR Estimates. Front. Plant Sci. 2017, 8, 2002. [Google Scholar] [CrossRef] [PubMed]
  36. Geipel, J.; Link, J.; Claupein, W. Combined Spectral and Spatial Modeling of Corn Yield Based on Aerial Images and Crop Surface Models Acquired with an Unmanned Aircraft System. Remote Sens. 2014, 6, 10335–10355. [Google Scholar] [CrossRef] [Green Version]
  37. Bendig, J.; Yu, K.; Aasen, H.; Bolten, A.; Bennertz, S.; Broscheit, J.; Gnyp, M.L.; Bareth, G. Combining UAV-based plant height from crop surface models, visible, and near infrared vegetation indices for biomass monitoring in barley. Int. J. Appl. Earth Obs. Geoinform. 2015, 39, 79–87. [Google Scholar] [CrossRef]
  38. Chapman, S.; Merz, T.; Chan, A.; Jackway, P.; Hrabar, S.; Dreccer, M.; Holland, E.; Zheng, B.; Ling, T.; Jimenez-Berni, J. Pheno-Copter: A Low-Altitude, Autonomous Remote-Sensing Robotic Helicopter for High-Throughput Field-Based Phenotyping. Agronomy 2014, 4, 279–301. [Google Scholar] [CrossRef] [Green Version]
  39. Deery, D.; Jimenez-Berni, J.; Jones, H.; Sirault, X.; Furbank, R. Proximal Remote Sensing Buggies and Potential Applications for Field-Based Phenotyping. Agronomy 2014, 4, 349–379. [Google Scholar] [CrossRef] [Green Version]
  40. Keener, M.E.; Kircher, P.L. The use of canopy temperature as an indicator of drought stress in humid regions. Agric. Meteorol. 1983, 28, 339–349. [Google Scholar] [CrossRef]
  41. Koc, A.; Henriksson, T.; Chawade, A. Specalyzer—An interactive online tool to analyze spectral reflectance measurements. PeerJ 2018, 6, e5031. [Google Scholar] [CrossRef] [PubMed]
  42. Garriga, M.; Romero-Bravo, S.; Estrada, F.; Escobar, A.; Matus, I.A.; del Pozo, A.; Astudillo, C.A.; Lobos, G.A. Assessing Wheat Traits by Spectral Reflectance: Do We Really Need to Focus on Predicted Trait-Values or Directly Identify the Elite Genotypes Group? Front. Plant Sci. 2017, 8, 280. [Google Scholar] [CrossRef] [Green Version]
  43. Huang, W.; Lamb, D.W.; Niu, Z.; Zhang, Y.; Liu, L.; Wang, J. Identification of yellow rust in wheat using in-situ spectral reflectance measurements and airborne hyperspectral imaging. Precis. Agric. 2007, 8, 187–197. [Google Scholar] [CrossRef]
  44. Odilbekov, F.; Armoniene, R.; Henriksson, T.; Chawade, A. Proximal Phenotyping and Machine Learning Methods to Identify Septoria Tritici Blotch Disease Symptoms in Wheat. Front. Plant Sci. 2018, 9, 685. [Google Scholar] [CrossRef] [PubMed]
  45. Debaeke, P.; Rouet, P.; Justes, E. Relationship Between the Normalized SPAD Index and the Nitrogen Nutrition Index: Application to Durum Wheat. J. Plant Nutr. 2006, 29, 75–92. [Google Scholar] [CrossRef]
  46. Yang, H.; Yang, J.; Lv, Y.; He, J. SPAD Values and Nitrogen Nutrition Index for the Evaluation of Rice Nitrogen Status. Plant Prod. Sci. 2015, 17, 81–92. [Google Scholar] [CrossRef]
  47. Andrianto, H.; Suhardi; Faizal, A. Measurement of chlorophyll content to determine nutrition deficiency in plants: A systematic literature review. In Proceedings of the 2017 International Conference on Information Technology Systems and Innovation (ICITSI), Bandung, Indonesia, 23–24 October 2017; pp. 392–397. [Google Scholar]
  48. Chawade, A.; Linden, P.; Brautigam, M.; Jonsson, R.; Jonsson, A.; Moritz, T.; Olsson, O. Development of a model system to identify differences in spring and winter oat. PLoS ONE 2012, 7, e29792. [Google Scholar] [CrossRef] [PubMed]
  49. Crain, J.L.; Wei, Y.; Barker, J.; Thompson, S.M.; Alderman, P.D.; Reynolds, M.; Zhang, N.; Poland, J. Development and Deployment of a Portable Field Phenotyping Platform. Crop Sci. 2016, 56, 965–975. [Google Scholar] [CrossRef]
  50. White, J.W.; Conley, M.M. A Flexible, Low-Cost Cart for Proximal Sensing. Crop Sci. 2013, 53, 1646–1649. [Google Scholar] [CrossRef] [Green Version]
  51. Thompson, A.L.; Thorp, K.R.; Conley, M.; Andrade-Sanchez, P.; Heun, J.T.; Dyer, J.M.; White, J.W. Deploying a Proximal Sensing Cart to Identify Drought-Adaptive Traits in Upland Cotton for High-Throughput Phenotyping. Front. Plant Sci. 2018, 9, 507. [Google Scholar] [CrossRef] [PubMed]
  52. Bai, G.; Ge, Y.; Hussain, W.; Baenziger, P.S.; Graef, G. A multi-sensor system for high throughput field phenotyping in soybean and wheat breeding. Comput. Electron. Agric. 2016, 128, 181–192. [Google Scholar] [CrossRef] [Green Version]
  53. Barmeier, G.; Schmidhalter, U. High-Throughput Field Phenotyping of Leaves, Leaf Sheaths, Culms and Ears of Spring Barley Cultivars at Anthesis and Dough Ripeness. Front. Plant Sci. 2017, 8, 1920. [Google Scholar] [CrossRef]
  54. Rischbeck, P.; Elsayed, S.; Mistele, B.; Barmeier, G.; Heil, K.; Schmidhalter, U. Data fusion of spectral, thermal and canopy height parameters for improved yield prediction of drought stressed spring barley. Eur. J. Agron. 2016, 78, 44–59. [Google Scholar] [CrossRef]
  55. Barmeier, G.; Schmidhalter, U. High-Throughput Phenotyping of Wheat and Barley Plants Grown in Single or Few Rows in Small Plots Using Active and Passive Spectral Proximal Sensing. Sensors 2016, 16, 1860. [Google Scholar] [CrossRef]
  56. Andrade-Sanchez, P.; Gore, M.A.; Heun, J.T.; Thorp, K.R.; Carmo-Silva, A.E.; French, A.N.; Salvucci, M.E.; White, J.W. Development and evaluation of a field-based high-throughput phenotyping platform. Funct. Plant Biol. 2014, 41, 68–79. [Google Scholar] [CrossRef] [Green Version]
  57. Sun, S.; Li, C.; Paterson, A.H.; Jiang, Y.; Xu, R.; Robertson, J.S.; Snider, J.L.; Chee, P.W. In-field High Throughput Phenotyping and Cotton Plant Growth Analysis Using LiDAR. Front. Plant Sci. 2018, 9, 16. [Google Scholar] [CrossRef] [PubMed]
  58. Jiang, Y.; Li, C.; Robertson, J.S.; Sun, S.; Xu, R.; Paterson, A.H. Gphenovision: A Ground Mobile System with Multi-modal Imaging for Field-Based High Throughput Phenotyping of Cotton. Sci. Rep. 2018, 8, 1213. [Google Scholar] [CrossRef] [PubMed]
  59. Kirchgessner, N.; Liebisch, F.; Yu, K.; Pfeifer, J.; Friedli, M.; Hund, A.; Walter, A. The ETH field phenotyping platform FIP: A cable-suspended multi-sensor system. Funct. Plant Boil. 2017, 44, 154–168. [Google Scholar] [CrossRef]
  60. Xu, Y.; Li, P.; Zou, C.; Lu, Y.; Xie, C.; Zhang, X.; Prasanna, B.M.; Olsen, M.S. Enhancing genetic gain in the era of molecular breeding. J. Exp. Bot. 2017, 68, 2641–2666. [Google Scholar] [CrossRef]
  61. Hatfield, J.L.; Walthall, C.L. Meeting Global Food Needs: Realizing the Potential via Genetics × Environment × Management Interactions. Agron. J. 2015, 107, 1215–1226. [Google Scholar] [CrossRef]
  62. Hunt, E.R.; Daughtry, C.S.T. What good are unmanned aircraft systems for agricultural remote sensing and precision agriculture? Int. J. Remote Sens. 2017, 39, 5345–5376. [Google Scholar] [CrossRef] [Green Version]
  63. Crain, J.; Mondal, S.; Rutkoski, J.; Singh, R.P.; Poland, J. Combining High-Throughput Phenotyping and Genomic Information to Increase Prediction and Selection Accuracy in Wheat Breeding. Plant Genome 2018, 11. [Google Scholar] [CrossRef]
  64. Juliana, P.; Montesinos-López, O.A.; Crossa, J.; Mondal, S.; González Pérez, L.; Poland, J.; Huerta-Espino, J.; Crespo-Herrera, L.; Govindan, V.; Dreisigacker, S.; et al. Integrating genomic-enabled prediction and high-throughput phenotyping in breeding for climate-resilient bread wheat. Theor. Appl. Genet. 2018, 132, 177–194. [Google Scholar] [CrossRef] [PubMed] [Green Version]
  65. Brown, T.B.; Cheng, R.; Sirault, X.R.R.; Rungrat, T.; Murray, K.D.; Trtilek, M.; Furbank, R.T.; Badger, M.; Pogson, B.J.; Borevitz, J.O. TraitCapture: Genomic and environment modelling of plant phenomic data. Curr. Opin. Plant Biol. 2014, 18, 73–79. [Google Scholar] [CrossRef] [PubMed]
  66. Singh, A.; Ganapathysubramanian, B.; Singh, A.K.; Sarkar, S. Machine Learning for High-Throughput Stress Phenotyping in Plants. Trends Plant Sci. 2016, 21, 110–124. [Google Scholar] [CrossRef] [Green Version]
  67. Shakoor, N.; Lee, S.; Mockler, T.C. High throughput phenotyping to accelerate crop breeding and monitoring of diseases in the field. Curr. Opin. Plant Biol. 2017, 38, 184–192. [Google Scholar] [CrossRef]
  68. Joalland, S.; Screpanti, C.; Liebisch, F.; Varella, H.V.; Gaume, A.; Walter, A. Comparison of visible imaging, thermography and spectrometry methods to evaluate the effect of Heterodera schachtii inoculation on sugar beets. Plant Methods 2017, 13, 73. [Google Scholar] [CrossRef]
  69. Joalland, S.; Screpanti, C.; Varella, H.; Reuther, M.; Schwind, M.; Lang, C.; Walter, A.; Liebisch, F. Aerial and Ground Based Sensing of Tolerance to Beet Cyst Nematode in Sugar Beet. Remote Sens. 2018, 10, 787. [Google Scholar] [CrossRef]
  70. Kuska, M.T.; Mahlein, A.K. Aiming at decision making in plant disease protection and phenotyping by the use of optical sensors. Eur. J. Plant Pathol. 2018, 152, 987–992. [Google Scholar] [CrossRef]
  71. Wu, D.; Ma, C. The Support Vector Machine (SVM) Based Near-Infrared Spectrum Recognition of Leaves Infected by the Leafminers. In Proceedings of the First International Conference on Innovative Computing, Information and Control, Volume I (ICICIC’06), Beijing, China, 30 August–1 September 2006; pp. 448–451. [Google Scholar]
  72. Mohanty, S.P.; Hughes, D.P.; Salathé, M. Using Deep Learning for Image-Based Plant Disease Detection. Front. Plant Sci. 2016, 7, 1419. [Google Scholar] [CrossRef] [Green Version]
  73. Sa, I.; Popović, M.; Khanna, R.; Chen, Z.; Lottes, P.; Liebisch, F.; Nieto, J.; Stachniss, C.; Walter, A.; Siegwart, R. WeedMap: A Large-Scale Semantic Weed Mapping Framework Using Aerial Multispectral Imaging and Deep Neural Network for Precision Farming. Remote Sens. 2018, 10, 1423. [Google Scholar] [CrossRef]
  74. Sawyer, J.E. Concepts of Variable Rate Technology with Considerations for Fertilizer Application. J. Prod. Agric. 1994, 7, 195–201. [Google Scholar] [CrossRef]
  75. Reyes, J.F.; Esquivel, W.; Cifuentes, D.; Ortega, R. Field testing of an automatic control system for variable rate fertilizer application. Comput. Electron. Agric. 2015, 113, 260–265. [Google Scholar] [CrossRef]
  76. Naik, H.S.; Zhang, J.; Lofquist, A.; Assefa, T.; Sarkar, S.; Ackerman, D.; Singh, A.; Singh, A.K.; Ganapathysubramanian, B. A real-time phenotyping framework using machine learning for plant stress severity rating in soybean. Plant Methods 2017, 13, 23. [Google Scholar] [CrossRef]
  77. Bravo, C.; Moshou, D.; West, J.; McCartney, A.; Ramon, H. Early Disease Detection in Wheat Fields using Spectral Reflectance. Biosyst. Eng. 2003, 84, 137–145. [Google Scholar] [CrossRef]
  78. Griffel, L.M.; Delparte, D.; Edwards, J. Using Support Vector Machines classification to differentiate spectral signatures of potato plants infected with Potato Virus Y. Comput. Electron. Agric. 2018, 153, 318–324. [Google Scholar] [CrossRef]
  79. Sugiura, R.; Tsuda, S.; Tamiya, S.; Itoh, A.; Nishiwaki, K.; Murakami, N.; Shibuya, Y.; Hirafuji, M.; Nuske, S. Field phenotyping system for the assessment of potato late blight resistance using RGB imagery from an unmanned aerial vehicle. Biosystems Engineering 2016, 148, 1–10. [Google Scholar] [CrossRef]
  80. Franceschini, M.H.D.; Bartholomeus, H.; van Apeldoorn, D.F.; Suomalainen, J.; Kooistra, L. Feasibility of Unmanned Aerial Vehicle Optical Imagery for Early Detection and Severity Assessment of Late Blight in Potato. Remote Sens. 2019, 11, 224. [Google Scholar] [CrossRef]
  81. Oerke, E.C.; Dehne, H.W. Safeguarding production—Losses in major crops and the role of crop protection. Crop Prot. 2004, 23, 275–285. [Google Scholar] [CrossRef]
  82. Harker, K.N.; O’Donovan, J.T. Recent Weed Control, Weed Management, and Integrated Weed Management. Weed Technol. 2017, 27, 1–11. [Google Scholar] [CrossRef]
  83. Gonzalez-Andujar, J.L.; Huang, H.; Deng, J.; Lan, Y.; Yang, A.; Deng, X.; Zhang, L. A fully convolutional network for weed mapping of unmanned aerial vehicle (UAV) imagery. PLoS ONE 2018, 13, e0196302. [Google Scholar] [CrossRef]
  84. Peña, J.; Torres-Sánchez, J.; Serrano-Pérez, A.; de Castro, A.; López-Granados, F. Quantifying Efficacy and Limits of Unmanned Aerial Vehicle (UAV) Technology for Weed Seedling Detection as Affected by Sensor Resolution. Sensors 2015, 15, 5609–5626. [Google Scholar] [CrossRef] [PubMed] [Green Version]
  85. Rose, D.C.; Sutherland, W.J.; Parker, C.; Lobley, M.; Winter, M.; Morris, C.; Twining, S.; Ffoulkes, C.; Amano, T.; Dicks, L.V. Decision support tools for agriculture: Towards effective design and delivery. Agric. Syst. 2016, 149, 165–174. [Google Scholar] [CrossRef] [Green Version]
  86. Johannes, A.; Picon, A.; Alvarez-Gila, A.; Echazarra, J.; Rodriguez-Vaamonde, S.; Navajas, A.D.; Ortiz-Barredo, A. Automatic plant disease diagnosis using mobile capture devices, applied on a wheat use case. Comput. Electron. Agric. 2017, 138, 200–209. [Google Scholar] [CrossRef]
  87. Ramcharan, A.; Baranowski, K.; McCloskey, P.; Ahmed, B.; Legg, J.; Hughes, D.P. Deep Learning for Image-Based Cassava Disease Detection. Front. Plant Sci. 2017, 8, 1852. [Google Scholar] [CrossRef]
  88. Hallau, L.; Neumann, M.; Klatt, B.; Kleinhenz, B.; Klein, T.; Kuhn, C.; Röhrig, M.; Bauckhage, C.; Kersting, K.; Mahlein, A.K.; et al. Automated identification of sugar beet diseases using smartphones. Plant Pathol. 2018, 67, 399–410. [Google Scholar] [CrossRef]
  89. Devaux, A.; Kromann, P.; Ortiz, O. Potatoes for sustainable global food security. Potato Res. 2014, 57, 185–199. [Google Scholar] [CrossRef]
  90. Eriksson, D.; Carlson-Nilsson, U.; Ortíz, R.; Andreasson, E. Overview and Breeding Strategies of Table Potato Production in Sweden and the Fennoscandian Region. Potato Res. 2016, 59, 279–294. [Google Scholar] [CrossRef] [Green Version]
  91. Gijzen, M.; Lehsten, V.; Wiik, L.; Hannukkala, A.; Andreasson, E.; Chen, D.; Ou, T.; Liljeroth, E.; Lankinen, Å.; Grenville-Briggs, L. Earlier occurrence and increased explanatory power of climate for the first incidence of potato late blight caused by Phytophthora infestans in Fennoscandia. PLoS ONE 2017, 12, e0177580. [Google Scholar] [CrossRef]
  92. Fry, W.E. Evaluation of Potato Late Blight Forecasts Modified to Incorporate Host Resistance and Fungicide Weathering. Phytopathology 1983, 73, 1054–1059. [Google Scholar] [CrossRef]
  93. Alexandersson, E.; Antkowiak, P.; Holmberg, M.; Piikki, K.; Söderström, M.; Liljeroth, E. The possibilities and challenges of UAV-borne remote sensing for detection of potato late blight in the field. In Abstract Book for the Plant Biology Europe Conference in Copenhagen; Department of Plant and Environmental Sciences, University of Copenhagen: Copenhagen, Denmark, 2018; p. 10. ISBN 978-87-996274-1-7. [Google Scholar]
  94. Brown, B. The Total Economic Impact™ of IBM’s Design Thinking Practice; Forrester Consulting: Massachusetts, MA, USA, 2018; pp. 1–45. [Google Scholar]
  95. Ćwiek-Kupczyńska, H.; Altmann, T.; Arend, D.; Arnaud, E.; Chen, D.; Cornut, G.; Fiorani, F.; Frohmberg, W.; Junker, A.; Klukas, C.; et al. Measures for interoperability of phenotypic data: Minimum information requirements and formatting. Plant Methods 2016, 12, 44. [Google Scholar] [CrossRef] [PubMed]
Figure 1. An overview of differences in the phenotyping needs and subsequent actions needed for plant breeding and precision agriculture.
Agronomy 09 00258 g001
Figure 2. Schematic components of an app to detect early outbreaks of diseases in the field, which through cloud-computing integrates high-throughput phenotyping, storage, analysis by, for example, machine learning, meteorological and economic data. Numbers indicate the procession of the required workflow.
Agronomy 09 00258 g002

