Paramylon Treatment Improves Quality Profile and Drought Resistance in Solanum lycopersicum L. cv. Micro-Tom


1
Istituto di Biofisica, Consiglio Nazionale delle Ricerche (CNR), Via Moruzzi 1, 56124 Pisa, Italy
2
Istituto Scienza e Tecnologie dell’Informazione, CNR, Via Moruzzi 1, 56124 Pisa, Italy
*
Author to whom correspondence should be addressed.
Agronomy 2019, 9(7), 394; https://0-doi-org.brum.beds.ac.uk/10.3390/agronomy9070394
Submission received: 15 May 2019
/
Revised: 9 July 2019
/
Accepted: 14 July 2019
/
Published: 17 July 2019
(This article belongs to the Special Issue Toward a Sustainable Agriculture Through Plant Biostimulants: From Experimental Data to Practical Applications)
Abstract
:Tomatoes, the most cultivated vegetables worldwide, require large amounts of water and are adversely affected by water stress. Solanum lycopersicum L., cv. Micro-Tom was used to assess the effects of β-(1,3)-glucan (paramylon) purified from the microalga Euglena gracilis on drought resistance and fruit quality profile. Plants were grown in an aeroponic system under three cultivation conditions: optimal water regimen, water scarcity regimen, and water scarcity regimen coupled with a root treatment with paramylon. Eco–physiological, physicochemical and quality parameters were monitored and compared throughout the lifecycle of the plants. Drought stress caused only a transient effect on the eco–physiological parameters of paramylon-treated plants, whereas physicochemical and biochemical parameters underwent significant variations. In particular, the fruits of paramylon-treated plants reached the first ripening stage two weeks before untreated plants grown under the optimal water regime, while the fruits of stressed untreated plants did not ripe beyond category II. Moreover, antioxidant compounds (carotenoids, phenolic acid, and vitamins) of fruits from treated plants underwent a two-fold increase with respect to untreated plants, as well as soluble carbohydrates (glucose, fructose, and sucrose). These results show that paramylon increases plant resistance to drought and highly improves the quality profile of the fruits with respect to untreated plants grown under drought stress.
Keywords:
Biostimulants; Euglena gracilis; algal polysaccharide; β-glucan; water stress; tomato; aeroponics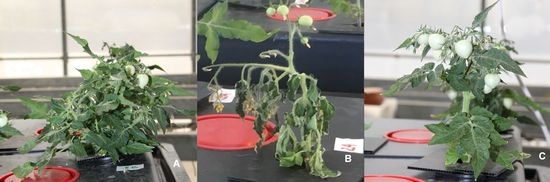
1. Introduction
Paramylon is the storage product of the unicellular alga Euglena gracilis. This polysaccharide is a β-(1,3)-glucan endogenously synthetized as 1–2 µm granules consisting of 100% glucose [1]. The granules are composed of concentric segments, which possibly indicates the successive deposition of unbranched linear β-(1,3)-glucan chains on a central nucleus [2,3,4]. Wild type (WT) photosynthetic cells can accumulate paramylon up to 60% of cell dry weight (DW) [2], while the WZSL mutant of E. gracilis (spontaneous, non-chloroplastic, osmotrophic mutant; W describes the white color of the cells; Z means E. gracilis Klebs, Z strain; S means spontaneous mutant, and L means light grown parent culture) [5] can accumulate large amounts of it (up to 95% DW) when grown in the dark with an adequate carbon source [2].
B-glucans are PAMPs (pathogen-associated molecular patterns) recognized by specific membrane receptors (pattern recognition receptors, PRRs) which trigger the activation of the innate immune system [6,7]. Both the molecular structure and degree of polymerization affect the strength and efficacy of β-glucans recognition by PRRs, as well as their successive reactions [2,8,9,10].
Linear β-(1,3)-glucans bind preferentially to Dectin-1, a C-type lectin receptor expressed on most cells of the innate immune system [11,12]. A minimum of 10 units of glucose is necessary to trigger an immune response [8,13,14].
Evaluations of the effective potential of linear β-(1,3)-glucans have been often made by testing preparations from plant/algae/fungal sources that are always contaminated by pigments, proteins, and membranes resulting in non-specific immunoresponses. β-(1,3)-glucan purified from paramylon synthetized by the WZSL mutant lacks any kind of contaminations from cellular components, which are always present in the paramylon extracted from WT cells. β-1-3-glucan purified from the WZSL mutant is further processed to produce linear nanofibers suited for binding to Dectin-1 receptors of target cell membranes. The effect of these nanofibers has been already investigated in our laboratory on tomato plants, animals, and humans [4,15,16,17]. In tomatoes, paramylon nanofibers modulate conductance to carbon dioxide (CO2) diffusion from air to the carboxylation sites by regulating hormone levels and water-use efficiency, leading to an increase of plant defense capacity against drought [16].
Tomatoes are the most cultivated vegetable worldwide, being one of the most nutritionally and economically important crops. They require large amounts of water and are adversely affected by drought, which limits photosynthesis and, consequently, plant growth and yield worldwide [18]. Hence, we investigated the role of β-1,3-glucan nanofibers as elicitors of tomato plants response to drought to understand their physiological and photosynthetic responses to this stress.
In this study, tomato cv. Micro-Tom was chosen because of its small size (10–20 cm in height) and short life cycle of about 3 months. Plants were grown in an aeroponic system under three cultivation conditions: optimal water regimen, water scarcity regimen (drought), and water scarcity regimen (drought) coupled with a root treatment with paramylon to monitor and compare eco–physiological (leaf water potential, CO2 assimilation rate, stomatal conductance, internal CO2 concentration, photosystem II (PSII) photochemical efficiency, actual photon yield of PSII, and photochemical quenching of PSII), physicochemical (dry biomass, ashes, dry matter, moisture, microelements, weight, and size), and quality parameters (antioxidant compositions and activities, as well as soluble carbohydrates) throughout the lifecycle of the plants.
2. Materials and Methods
2.1. Aeroponic Culture System
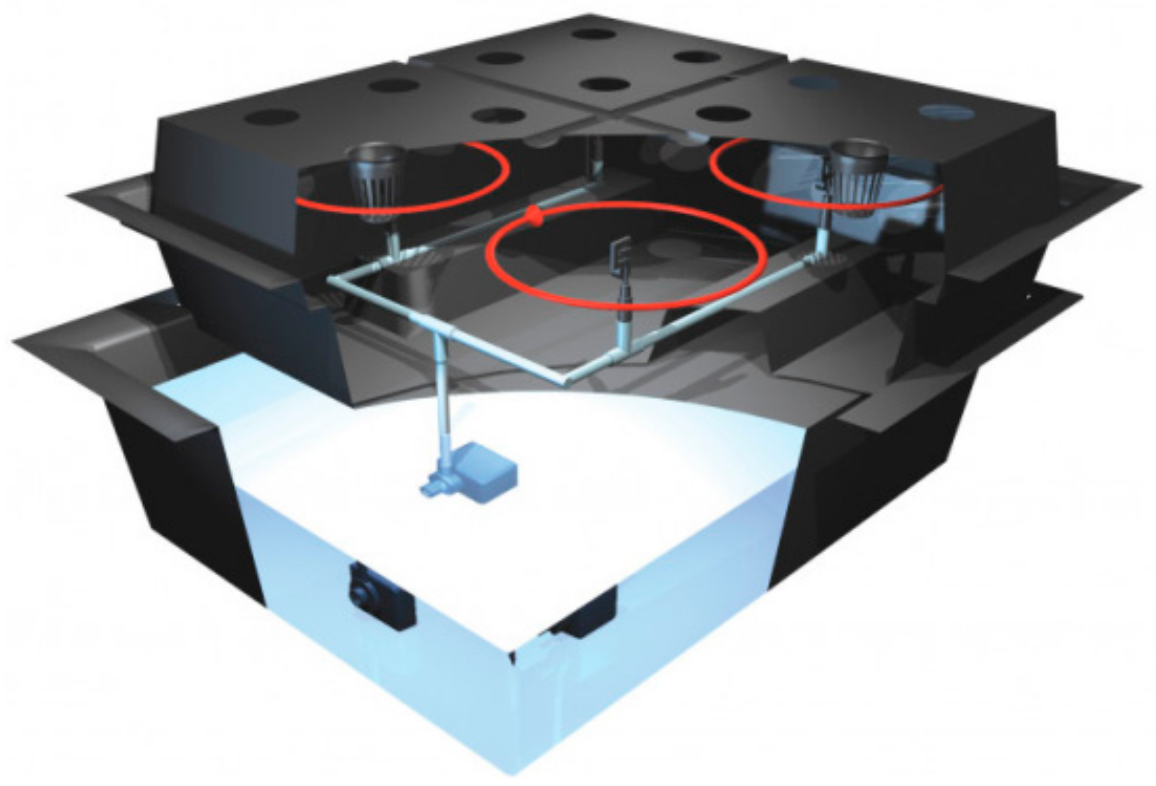
The aeroponic cultivation system used was the Nutriculture Twin Amazon 16 (Nutriculture DGS, UK), which consists of a 100 L reservoir tank (160 × 75 × 46 cm), a root chamber housing the delivery system and a molded plastic lid holding sixteen 75 mm mesh pots (Figure 1). The Maxi Jet 1000 pump (14 W, flow rate 1000 Lh−1, max head height 142 cm, NEWA Tecno Industria SRL, Italy) supplies a powerful spray creating a miniature rainstorm inside the chamber through eight 360 degree sprinklers that shower the whole root area, leaving no blind spots. Since the aeroponic container can be assimilated to a closed system, the condensation of growth medium eventually balances its evaporation, reducing the amount of evapotranspiration.
2.2. Paramylon Nanofibers Preparation
Paramylon granules were extracted and purified from two-days-old cultures of Euglena gracilis WZSL mutant according to Barsanti et al. [2]. Nanofibers were obtained by alkaline degradation of the granules [2]. Assuming a 20% loss during the procedure, the final concentration of β-1,3-glucan nanofibers was about 0.8% w/v.
2.3. Plant Material, Growth Conditions and Paramylon Treatment
Seeds of Solanum lycopersicum L., cv. Micro-Tom [19] were surface sterilized with a bleach solution (commercial bleach 30% v/v, Triton X-100 0.02% v/v) for 15 min, washed 3 times with sterile water, and placed overnight in the dark at 4 °C. Seeds were then sown on filter paper covering the bottom of 150 mm diameter Petri dishes (about 20 seeds per plate); the paper was wetted with sterile demineralized water, the dishes were wrapped with Parafilm, and they were placed in the dark for about 2 days to aid germination. Upon germination, the cover was removed to allow the development of the roots (2–3 days). Seedlings were then transferred to rock wool (Grodan® Pro Plug) plugs, one seed per plug, to grow under controlled climate conditions (16/8 h light/dark; 400 μmolm−2 s−1 PAR, Photosynthetic Active Radiation; 22 °C) for approximately 2 weeks in a plastic tray containing half strength nutrient solution [Ca(NO3)2 4H2O, 0.944 gL−1; KNO3, 0.808 gL−1; MgSO4 2H2O, 0.492 gL−1; NH4H2PO4, 0.152 gL−1; microelements, 0.050 gL−1; pH 5.5] according to the protocol by Motohashi et al. [20] in a non-circulating hydroponic method. Upon appearance of the first true leaf, seedlings selected for uniform development were transferred to 3 aeroponic cultivation systems, 16 plants per system, in a glasshouse with a mean temperature of 24 °C, a 14/10 h light/dark photoperiod, and 800 μmolm−2 s−1 PAR irradiance. Plants were transferred into the greenhouse on May 14, 2018, 39 days after germination (dag). Each aeroponic tank was filled with 100 L of half strength nutrient solution, average pH (±SE) 5.50 ± 0.02.
Three cultivation conditions were tested: optimal water regimen (WW_P−), water scarcity regimen (drought, WS_P−), and water scarcity regimen (drought) coupled with root treatment with paramylon (WS_P+).
Paramylon was added to the nutrient solution of one of the 3 tanks to a final concentration of 500 mg L−1. The paramylon concentration was chosen according to the results of previous experiments [16]. The atomization spray time and interval time were 3-s on/5 min off in the control system (optimal water regimen), and 3-s on/120 min off in the other two systems (water scarcity regimen with and without paramylon). As a consequence, the irrigation supply was 8.64 Lplant−1 d−1 in WW_P− and 0.36 Lplant−1d−1 in both WS_P+ and WS_P−. The parameters of the aeroponics system used in the experiment are shown in Table 1.
The optimal water regimen was chosen according to Johnstone et al. [21], who used an aeroponic system for nutritional studies on Lycopersicon esculentum Mill. cv Cannery Row and established a misting regimen to plant roots of about 10 Ld−1 plant−1. The water scarcity regimen (0.36 Ld−1 plant−1) was assessed previously by a watering threshold experiment and by checking the representative features of the plants for yellowing and wilting symptoms in 100 tomato plants 30 dag in early spring. We want to stress that the irrigation supply did not correspond to the water needed by the plants.
The levels of nutrient solution and pH were monitored daily; a fresh solution was added in order to maintain a volume of 100 L in each tank. Controlled conditions were maintained throughout the experiment (14/10 h light/dark; 800 µmolm−2 s−1 PAR; 24 °C; pH (±SE) 5.5 ± 0.022).
2.4. Scanning Electron Microscopy (SEM) Preparations
Root samples were fixed in 100% methanol for 20 min and then transferred in 100% dry ethanol for 30 min with a further change into fresh 100% ethanol overnight. After dehydration, samples were dried in a critical-point dryer apparatus, coated with gold and viewed using a Philips-SEM 505 microscope (Eindhoven, The Netherlands).
2.5. Water Potential, Gas Exchanges and Chlorophyll a Fluorescence
Preliminary measurements of water potential, gas exchanges and chlorophyll a fluorescence were done to assess whether there were variations of these parameters in the different leaves of each plant. Since no variation was detected, measurement was performed on a single leaf per plant, using the same leaf for all the measurement of the experiment.
The first measure of all the eco–physiological parameters was performed upon the transfer of the plants to the aeroponic system, i.e., 39 dag. The predawn leaf water potential (Ψw) was measured on one fully expanded mature leaf per plant (n = 16), using a Scholander-type pressure chamber (model 600, PMS Instrument, Albany, OR, USA) and N2 for the application of pressure, following the precautions suggested by Turner and Long [22].
Leaf gas exchanges and chlorophyll a fluorescence measurements were determined between 10:00 AM and 1:00 PM (solar time) on one fully-expanded mature leaf plant (n = 16). Instantaneous measurements of steady state photosynthetic carbon dioxide (CO2) assimilation rate (A), stomatal conductance (gs), and internal CO2 concentration (Ci) were performed using an LI-6400 portable photosynthesis system (Li-Cor, Lincoln, NE, USA), according to Scartazza et al. [16]. The modulated chlorophyll a fluorescence and the status of the electron transport of photosystem II (PSII) were measured with a PAM-2000 fluorometer (Walz, Effeltrich, Germany) on the same leaves used for gas exchange after 40 min of dark-adaptation. Fluorescence in light-adapted leaves was induced according to Scartazza et al. [16] and Schreiber et al. [23]. The maximum efficiency of PSII photochemistry was calculated as Fv/Fm = (Fm−F0)/Fm; the actual photon yield of PSII photochemistry (ΦPSII) was calculated as (F’m−F’)/F’m; the photochemical quenching qP was calculated as (F’m−Ft)/(F’m−F’0). The used variables in dark-adapted state were as follows: Fv was the variable fluorescence, Fm was the maximal fluorescence, and F0 was the minimum fluorescence. The used variables in light-adapted state were: F′ was the fluorescence at the actual state of PSII reaction centers, F’m was the maximal fluorescence, F’0 was the minimal fluorescence, and Ft was the transient fluorescence.
2.6. Physicochemical Parameters and Mineral Content
At the end of the experiment, all plants were sampled and separated in fruits, leaves, stems, and roots. Fruits were harvested at the ripening category intermediate between VI and VII [24]. All the fruits produced by each plant were gathered and samples (16 fruits) for the analysis were taken from this pool. Several quality attributes were determined on the plants: fresh and dry weights, dry matter content, size (using Vernier calipers), number of fruits, and total ash. The roots, stems, leaves, and fruits of all the plants were dried at 40 °C for 96 h in a ventilated oven. One gram of dry matter was ashed at 550 °C for 6 h. Total micronutrient content (Ca, Cu, Fe, K, Mg, Mn, Na and Zn) was determined in a sub-sample after digestion with HNO3 and HClO4 [25]. The digests were analyzed by means of a Varian AA240 FS (Varian, USA) hydride generation atomic absorption spectrophotometer equipped with flow vapor generation accessory VGA 77 (Agilent Technologies, USA). Eight independent replicates were used for chemical analysis, and data are presented as mean ± standard deviation (n = 8).
2.7. Antioxidant Compounds, Total Antioxidant Capacity and Carbohydrates
Retinol content was obtained using standard conversion formula (1 µg retinol = 1 retinol equivalent (RE) method used; 1 µg β-carotene = 0.167 µg RE), according to Aremu and Nweze [26]. Lycopene and β-carotene contents were measured spectrophotometrically according to Georgé et al. [27]. Dried tomatoes (500 mg) were homogenized in a mortar with 100 mL of hexane/acetone/ethanol (50/25/25, v/v/v) in the dark, ultrasonically disrupted, and centrifuged at 12,000× g for 20 min at 4 °C. The supernatants were filtered through 0.2 µm Minisart SRT 15 filters and transferred into a separating funnel. The organic phase was washed three times with 20 mL of distilled water (in order to remove acetone and ethanol). The aqueous phase was discarded, and the remaining water in the organic phase was removed by adding anhydrous sodium sulphate. The final volume was made up to 50 mL with hexane. The reaction mixture absorbance was measured at 436 and 450 for β-carotene determination and 503 nm for lycopene determination.
Reduced (ascorbic acid, AsA) and oxidized (dehydroascorbate, DHA) ascorbate contents were measured spectrophotometrically according to Kampfenkel et al. [28]. Fresh fruit samples (250 mg) were homogenized in a mortar with 0.5 mL of 2% (w/v) phosphoric acid and centrifuged at 12,000× g for 15 min at 4 °C. The AsA assay mixture contained 50 µL of sample extract, 150 µl of K/P 200 mM (pH 7.4), 50 µl of trichloroacetic acid (TCA) 6% (w/v) and 50 µL of water. The total ascorbate (AsA + DHA) assay mixture contained 50 µl of sample extract, 150 µl of K/P 200 mM (pH 7.4), 50 µl of TCA 6% (w/v) and 50 µL of dithiothreitol (DTT) 10 mM. The reaction mixture was left at room temperature for 15 min; 50 µL of N-ethylmaleimide 0.5% (w/v) were added after the reduction of DHA to AsA. The color was developed in both assays by adding the reagents in the following sequence: 250 µL of TCA 10% (w/v), 200 µL of ortho-phosphoric acid 42% (v/v), 200 µL of 2,2-dipyridyl 4.0% (w/v) in ethanol 70% (v/v) and 100 µL of FeCl3 3% (v/v) to a final volume of 1 mL. Controls were also run, and the solution was allowed to stand at 40 °C for an Fe2+-bathophenanthroline complex to develop. The DHA levels were estimated on the basis of the difference between total ascorbate and AsA values. A standard calibration curve covering 0–10 nM of AsA or DHA range was used.
Tocopherols were determined by HPLC according to Döring et al. [29]. Fresh fruit samples (250 mg) were homogenized in a mortar with 0.4 mL of 100% HPLC-grade methanol and incubated overnight at 4 °C in the dark. The supernatant was filtered through 0.2 µm Minisart SRT 15 filters and immediately analyzed at room temperature with a reverse-phase Dionex column (Acclaim 120, C18, 5 µm particle size, 4.6 mm internal diameter × 150 mm length). Tocopherols were eluted at a flow rate of 1 mL min−1 using 100% solvent A (acetonitrile/methanol, 75/25, v/v) for the first 14 min, followed by a 3 min linear gradient to 100% solvent B (methanol/ethylacetate, 68/32, v/v) and 15 min with 100% solvent B. Tocopherols were detected at 280 nm. Authentic standards (Sigma-Aldrich, Italy) were used to quantify the tocopherols content of each sample.
The content of carbohydrates in fruits was determined spectrophotometrically according to Aguiar et al. [30] and quantified using a K-SUFRG commercial kit (Megazyme, Wicklow, Ireland), following the manufacturer’s protocol.
The antioxidant properties of the fruits were assessed spectrofluorimetrically by the oxygen radical absorption capacity (ORAC) and hydroxyl radical antioxidant capacity (HORAC) assays [31,32]. Fresh fruit samples (10 mg) were added to 0.75 mL of 100% ethanol/methanol/water/formic acid (35:35:28:2, v/v/v/v) and centrifuged at 12,000× g for 10 min at 4 °C. The supernatant was collected, and 10 µL were mixed with 170 µL of 48 nM fluorescein (FL). The reagents were transferred into the main reagent wells (OptiPlate 96 F plates, Perkin Elmer, Waltham, MA, USA) and incubated at 37 °C for 20 min before recording the initial fluorescence (excitation/emission = 485/527 nm). After incubation, 20 µL of the 2,2′-azobis(2-methylpropionamidine) dihydrochloride reagent (51.5 mM final concentration) were added, and fluorescence readings were taken every minute for 60 min. A phosphate buffer (75 mM, pH 7.4) was used as a blank, and a Trolox solution (0.78–25 µM) was used as a standard. The final ORAC values were calculated by using a regression equation between the Trolox concentration and the net area under the FL decay curve and expressed as µmol Trolox equivalents (TE) per gram of fresh weight (FW). In the HORAC assay, 10 µL of supernatant were mixed with 170 µL of 48 nM fluorescein (605 mM final concentration) and incubated at 37 °C for 10 min, before recording the initial fluorescence (excitation/emission = 485/520 nm). After incubation, 10 µL of H2O2 (27.5 mM final concentration) and 10 µL of Co(II) (230 µM final concentration) solutions were added, and fluorescence readings were taken every minute for 60 min. A phosphate buffer was used as a blank, and a gallic acid solution (100–600 µM) was used as a standard. The final HORAC values were calculated using a regression equation between the standard antioxidant concentration and the net area under the curve. One HORAC unit was assigned to the net protection area provided by 1 µM gallic acid, and the activity of the sample was expressed as µmol gallic acid equivalent (GAE) per gram of fresh weight (FW).
The content of total phenolic compounds was determined spectrophotometrically according to Waterhouse [33]. Fresh fruit samples (100 mg) were homogenized in a mortar with 5 mL of methanol acidified with 1 % HCl (v/v) for 20 h in the dark at 4 °C. Extracts were centrifuged for 15 min at 12,000× g at 4 °C, and the supernatants were filtered through 0.2 µm Minisart SRT 15 filters and stored in test tubes at −20 °C. Fifty µL of a 4-times diluted extract was mixed with 2.45 mL of distilled water and 250 µL of Folin–Ciocalteu’s phenol reagent. After incubation at room temperature for 6 min, 750 µL sodium carbonate 7.5% (w/v) and 500 µL of deionized water were mixed. After 120 min incubation at room temperature, the reaction mixture absorbance was measured at 760 nm. A calibration curve was prepared using a standard solution of gallic acid (range 0–1 mg mL−1). Eight independent replicates were used for chemical analysis, and data are presented as mean ± standard deviation (n = 8).
2.8. Statistical Analysis
The statistical analysis was performed using JMP 12 (SAS institute, Cary, NC, USA). The normality of the data was preliminary tested by the Shapiro–Wilk W test. If measurements were carried out for more than two time points, data were analyzed using one-way repeated measures ANOVA, and comparison among means was determined by Tukey’s HSD (honestly significant difference) multiple comparison test (p < 0.05). All the other data were analyzed by Student’s t test.
3. Results and Discussion
Aeroponics is a soil-less cultivation system considered a specialized version of hydroponics [34]. It is an air-water system in which the roots of the plant extend and grow inside a closed container in the dark, are exposed to air, and directly sprayed with a nutrient-water mix through atomizers (Figure 1). The aerial portions of the plant (leaves, stem and crown) extend above the wet zone separated from the root. Aeroponics systems are very useful for plant root studies under controlled conditions; we chose it to monitor the response of tomato plants to drought and feasibility of paramylon nanofibers, directly applied to the root system, in modulating the response of the whole plant to this stressor.
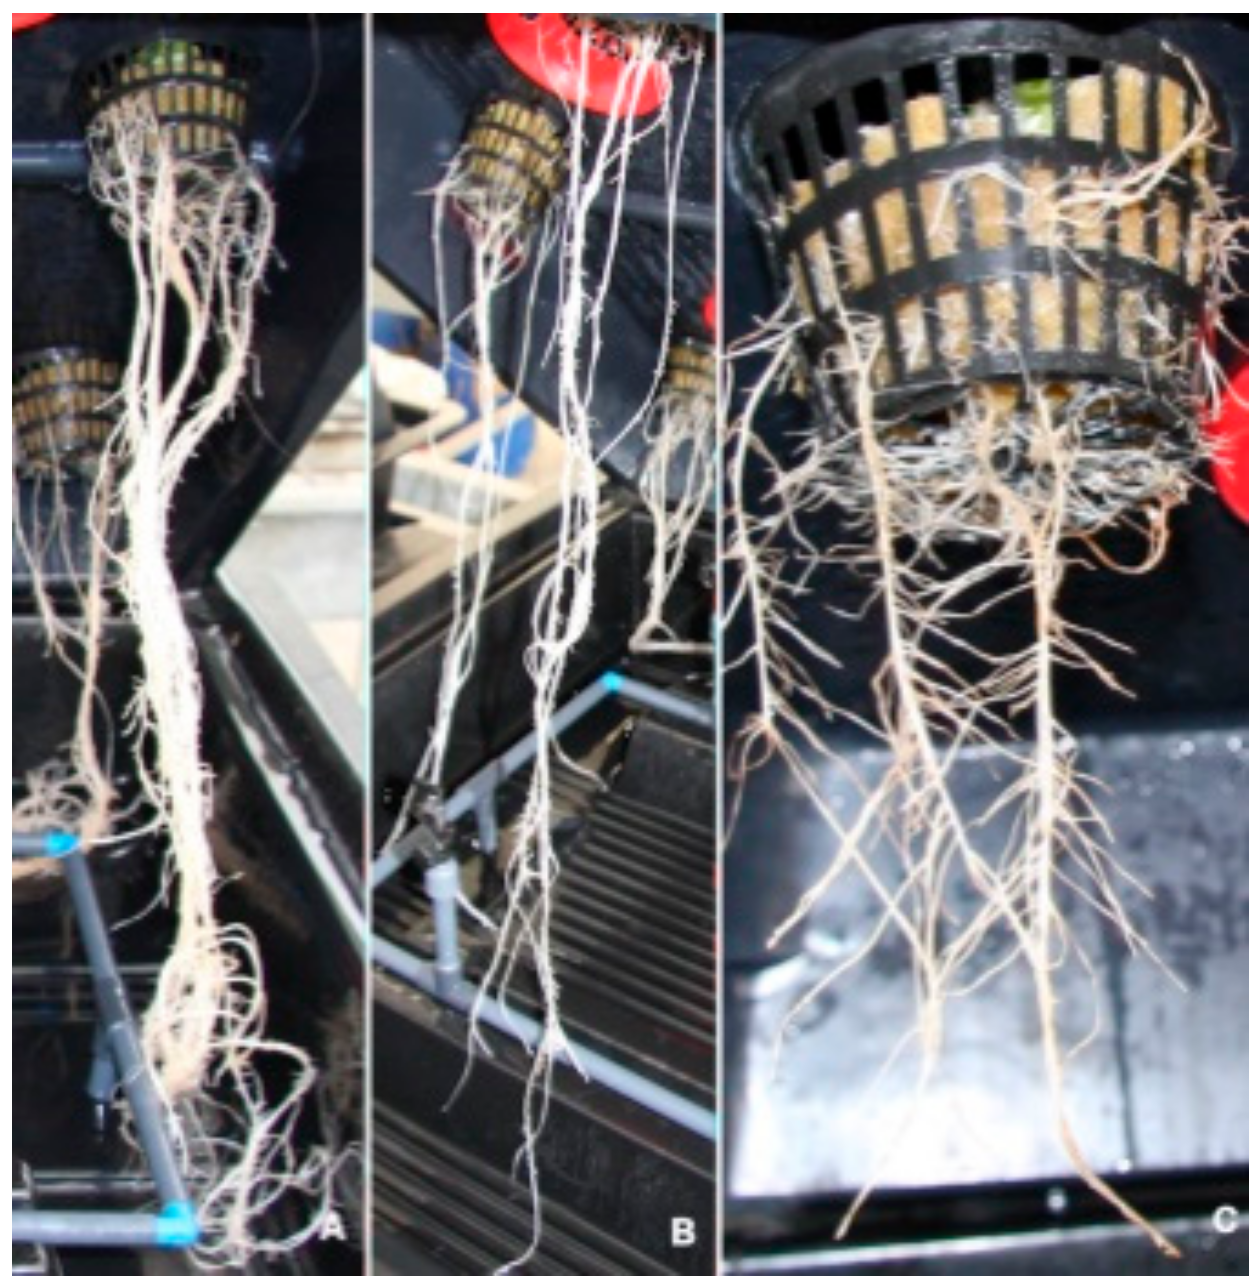
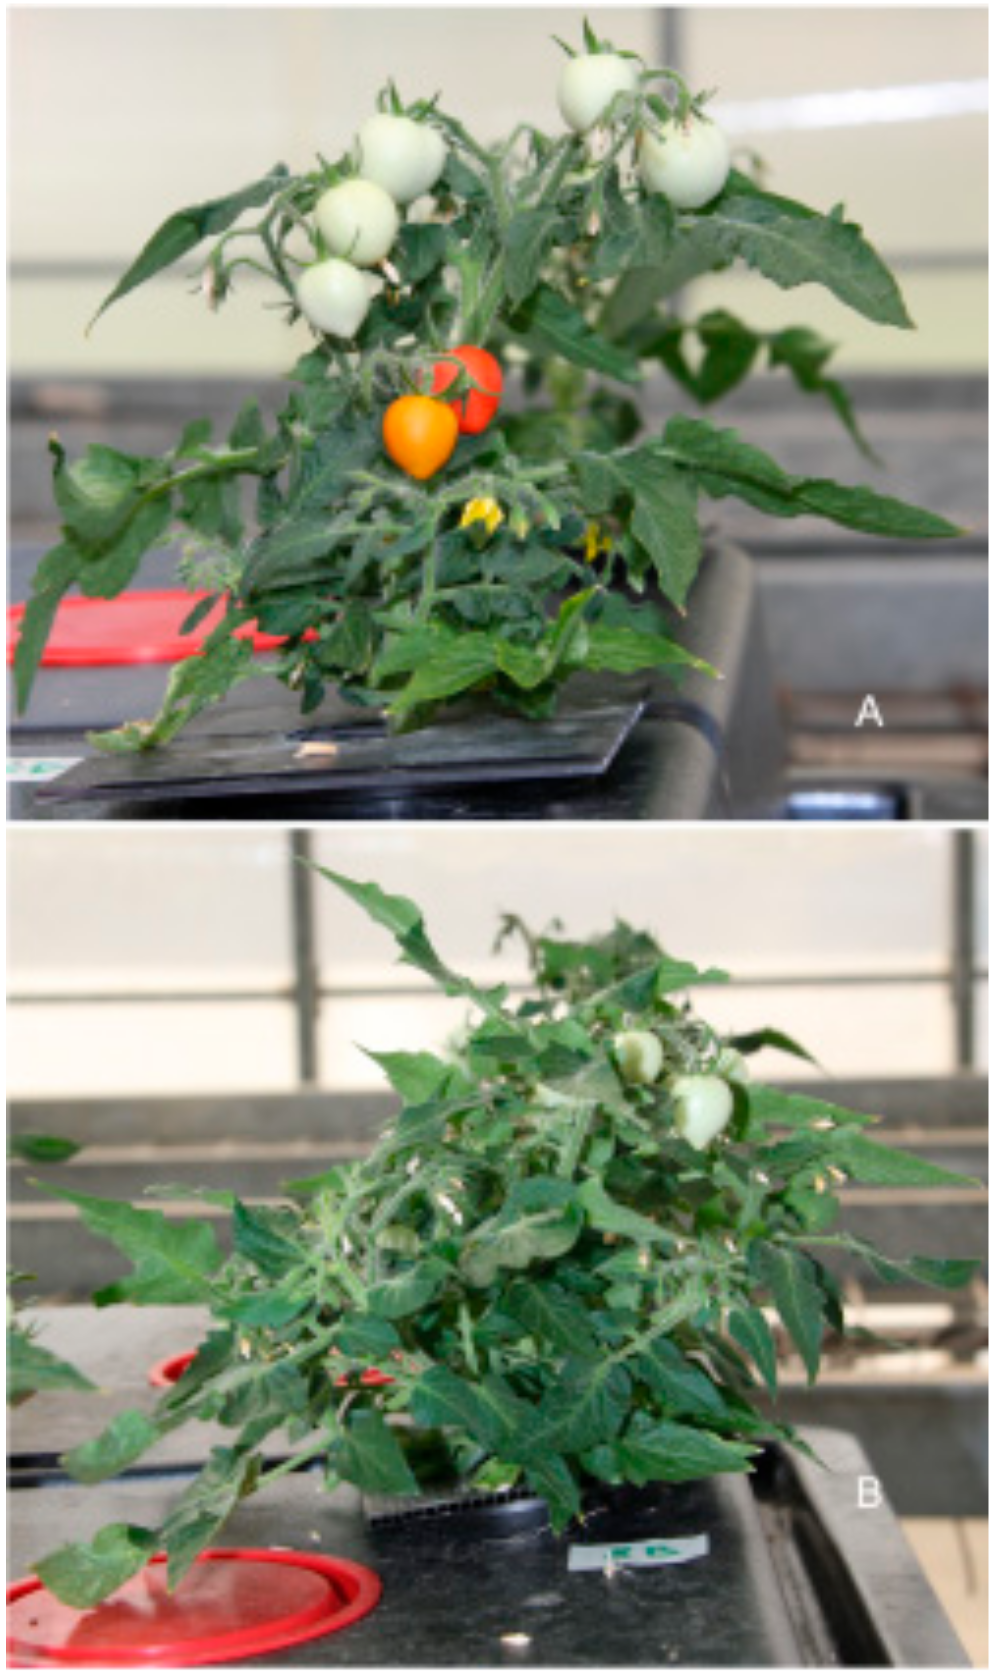
The representative features of the plants (aerial parts and root system) 60 dag under the three cultivation conditions tested are shown in Figure 2 and Figure 3. Under the optimal water regimen (Figure 2A), plants showed a normal compact growth habit with short internodes, fully expanded leaves, and regular fruit size typical of the determinate growth of Micro-Tom. The root system was fully developed with extremely long roots and plenty lateral roots, indicating a superior growth with respect to the plants under the other cultivation conditions (Figure 3A). Drought stressed plants (Figure 2B) showed wilting symptoms, with yellowing and rolling of the lower leaves, as well as a reduced fruit size. The root system appeared reduced in density and length (Figure 3B). Stressed plants with paramylon root treatment (Figure 2C) did not show any wilting; the growth habit was quite compact, the internode length was greater with respect to plants grown under optimal water regimen, and the fruit sizes were comparable. The root system showed a dramatic reduction of both density and length, coupled with an increase of the lateral rootlets (Figure 3C).
Figure 4 and Figure 5 show the variations of the main eco–physiological parameters, monitored to highlight the effect of the paramylon root treatment during the life cycle of the plants.
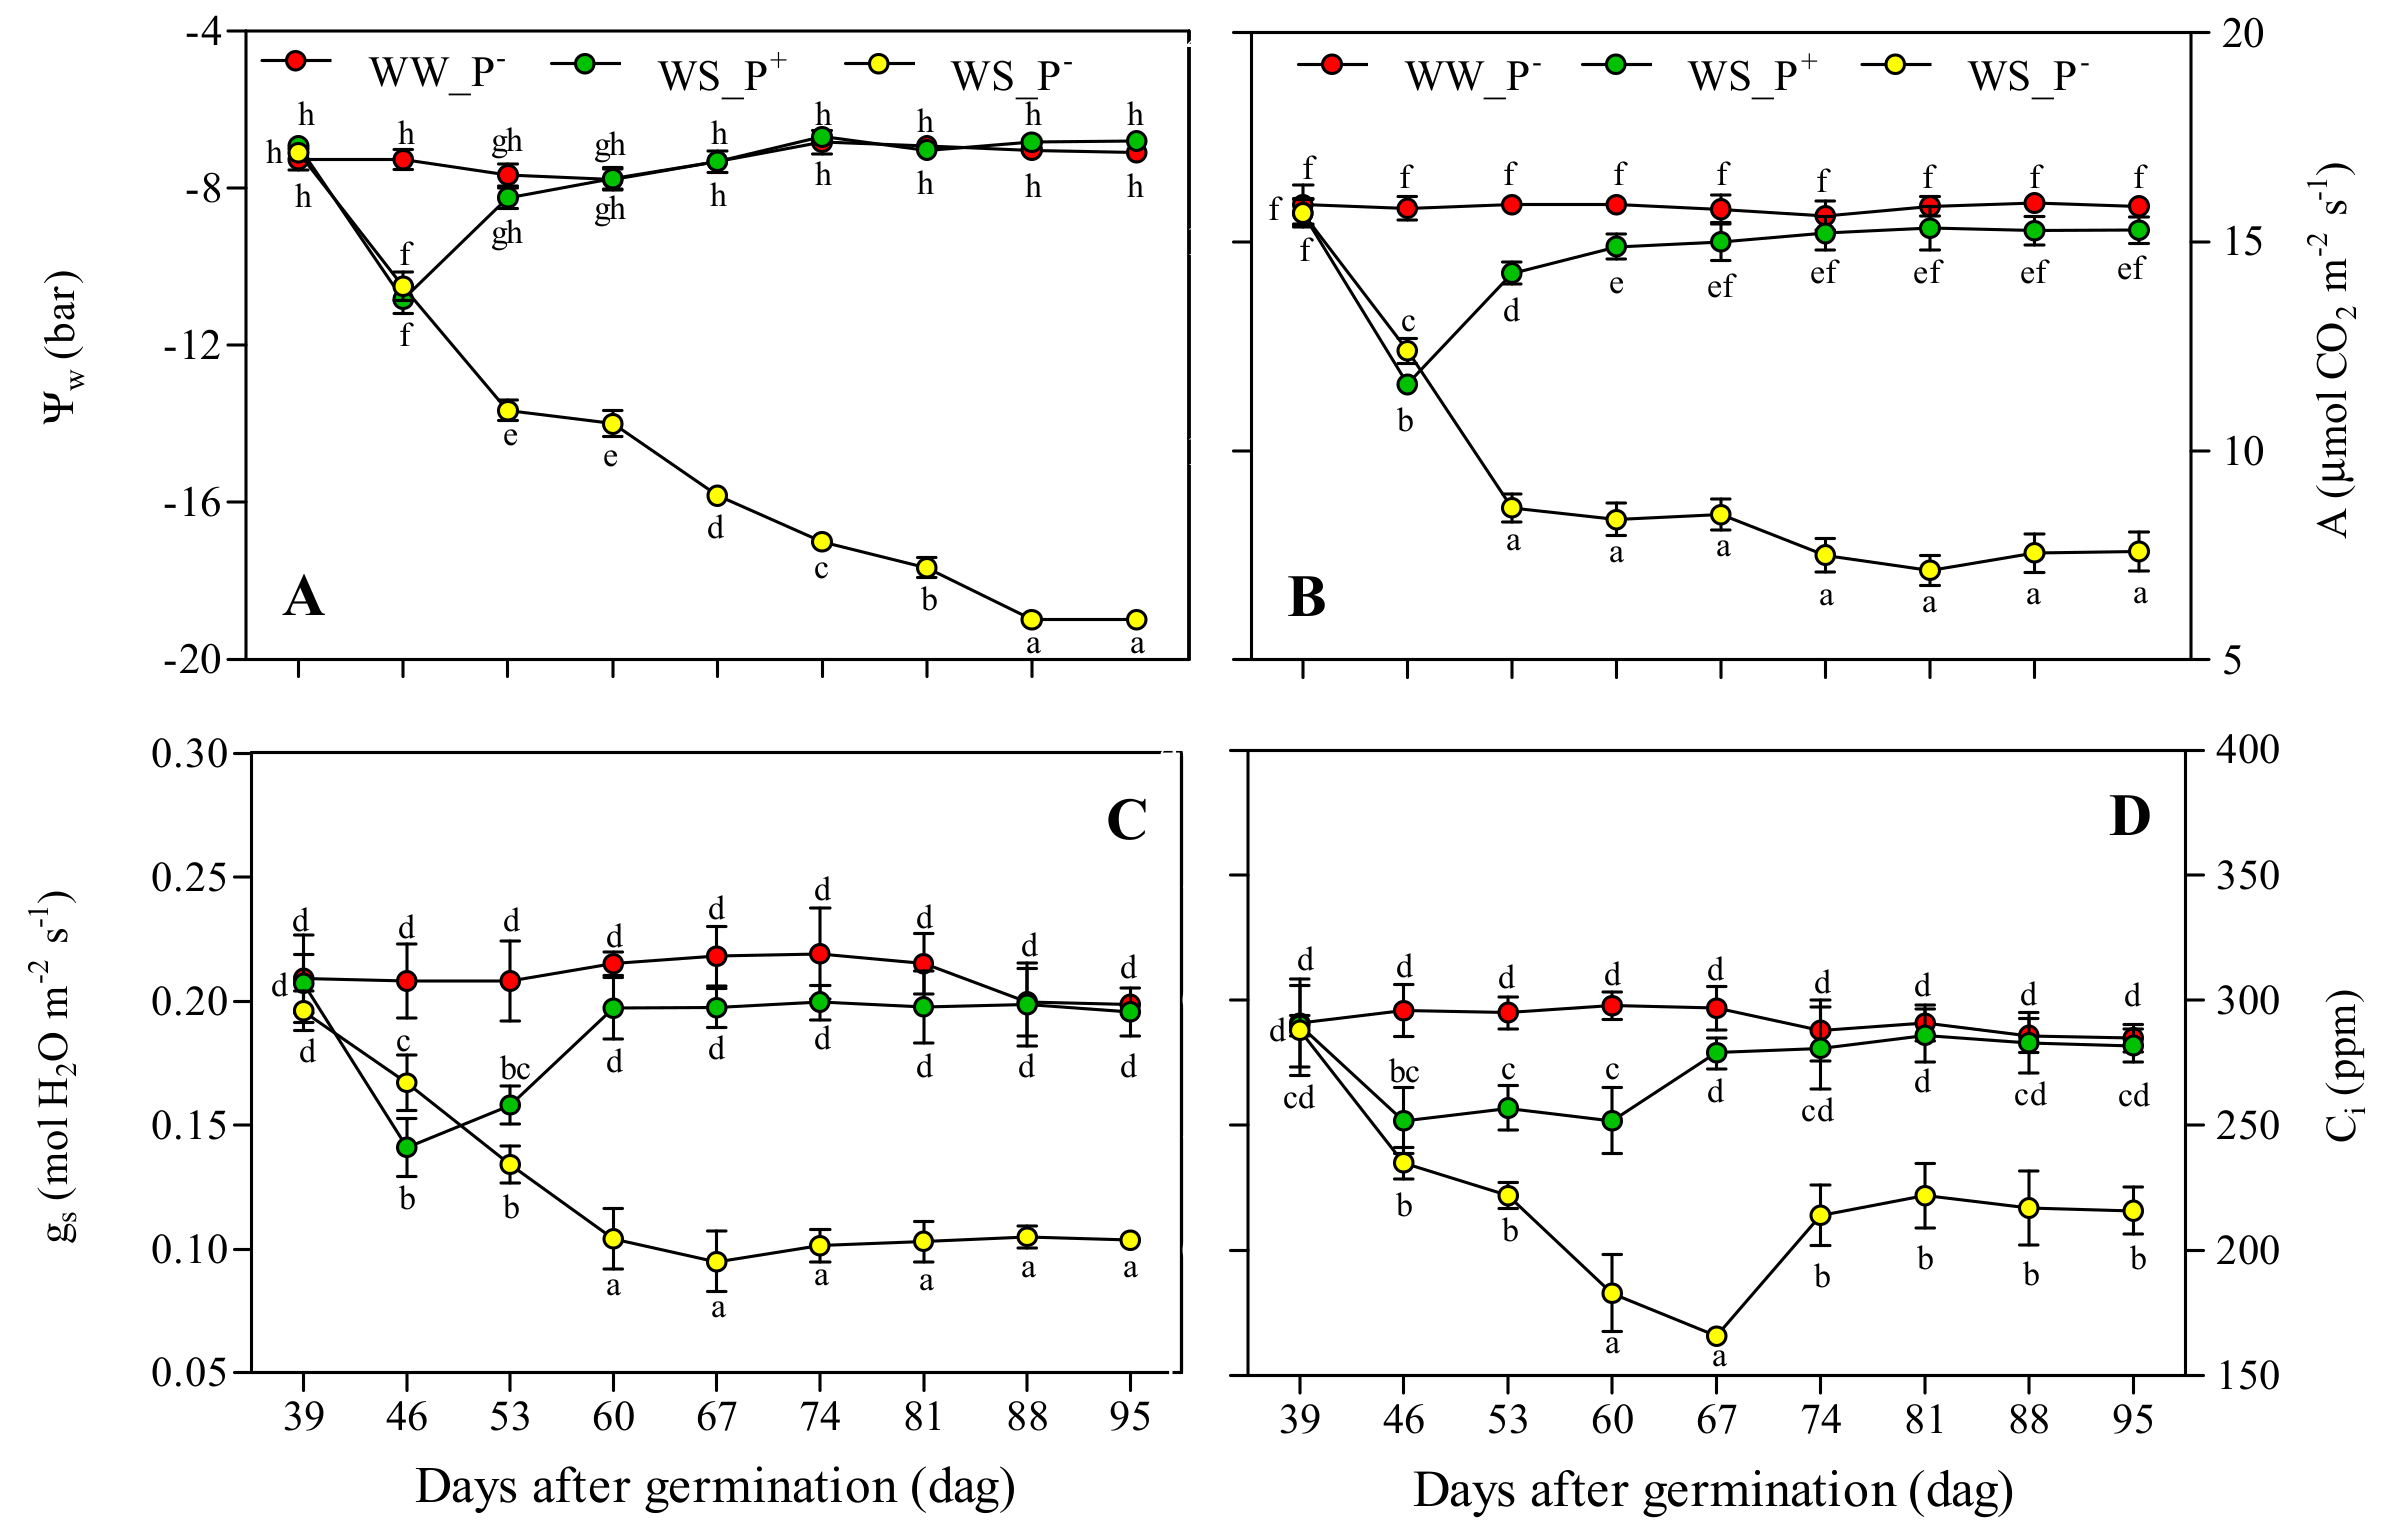
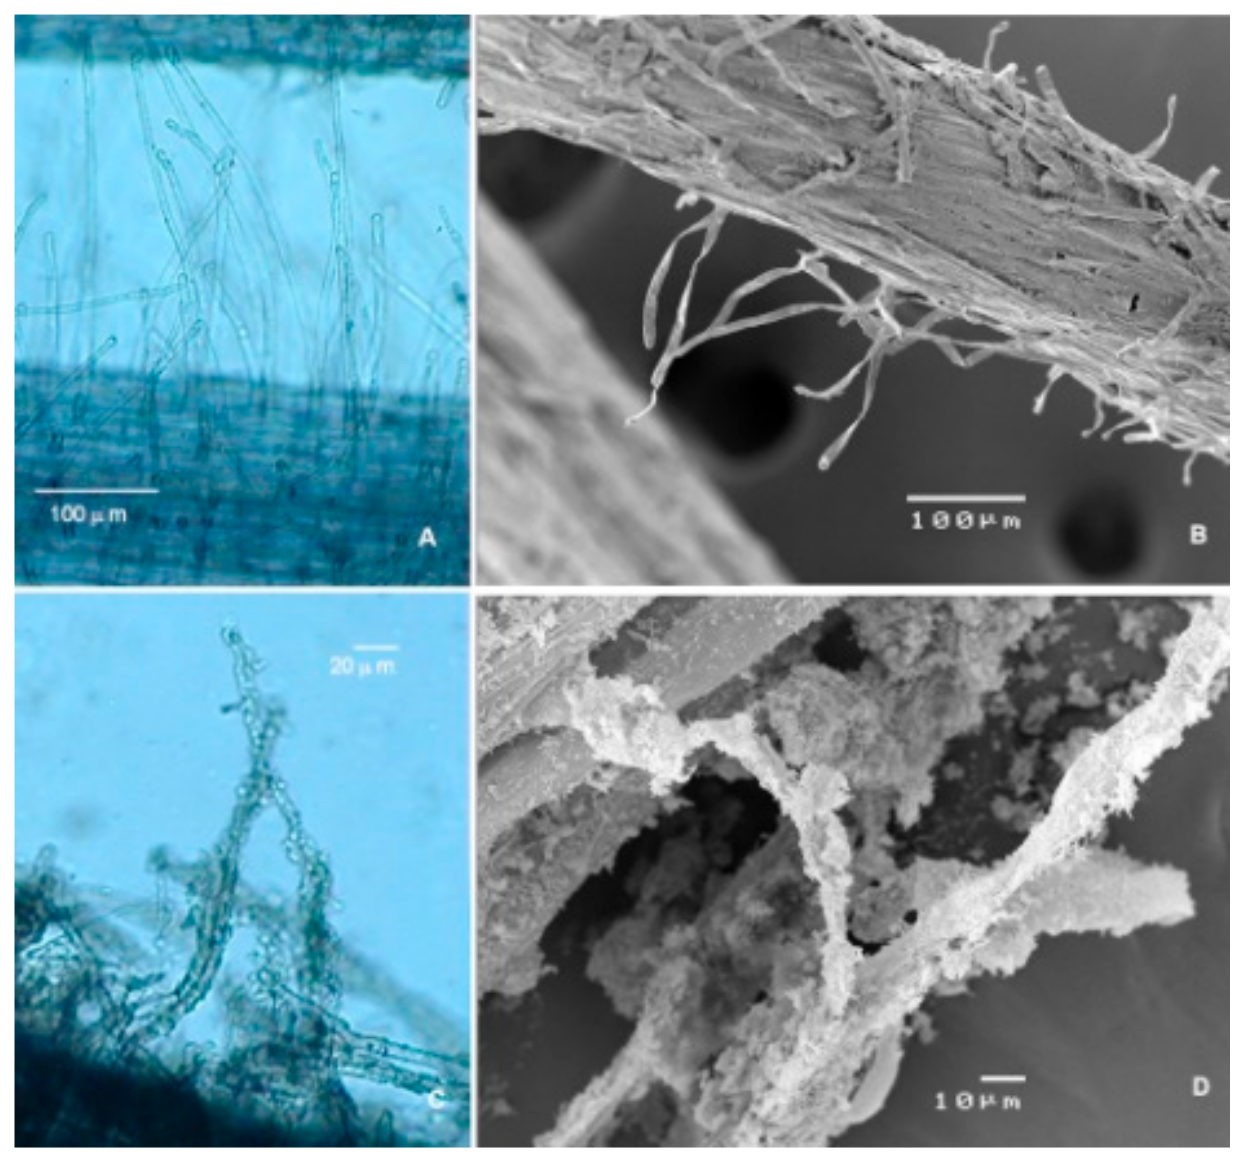
Figure 4 shows that the leaf water potential (Ψw) (Figure 4A), CO2 assimilation rate (A) (Figure 4B), stomatal conductance (gs) (Figure 4C), and internal CO2 concentration (Ci) (Figure 4D) had time series with a similar trend in each growth condition tested. In WW_P− plants, the values of these parameters were almost constant and comparable with the values present in the literature [35] (Figure 4A–D). These data confirm that the chosen water regimen (8.64 Ld−1 plant−1) was optimal for Micro-Tom growth [21]. In WS_P− plants, the four parameters underwent a steep decrease after a week of treatment (46 dag), which reached saturation before the end of experiment (Figure 4A–D). The reduction of the stomatal conductance as a reaction to water stress was the cause of this decreasing trend [36,37]. Additionally, in WS_P+ plants, the four parameters underwent a steep decrease after a week of treatment (46 dag), but the values recovered to those of control plants (WW_P−) after one or two weeks (Figure 4A–D). This delayed effect of paramylon nanofibers was mainly due to the time necessary to colonize the root system (Figure 6).
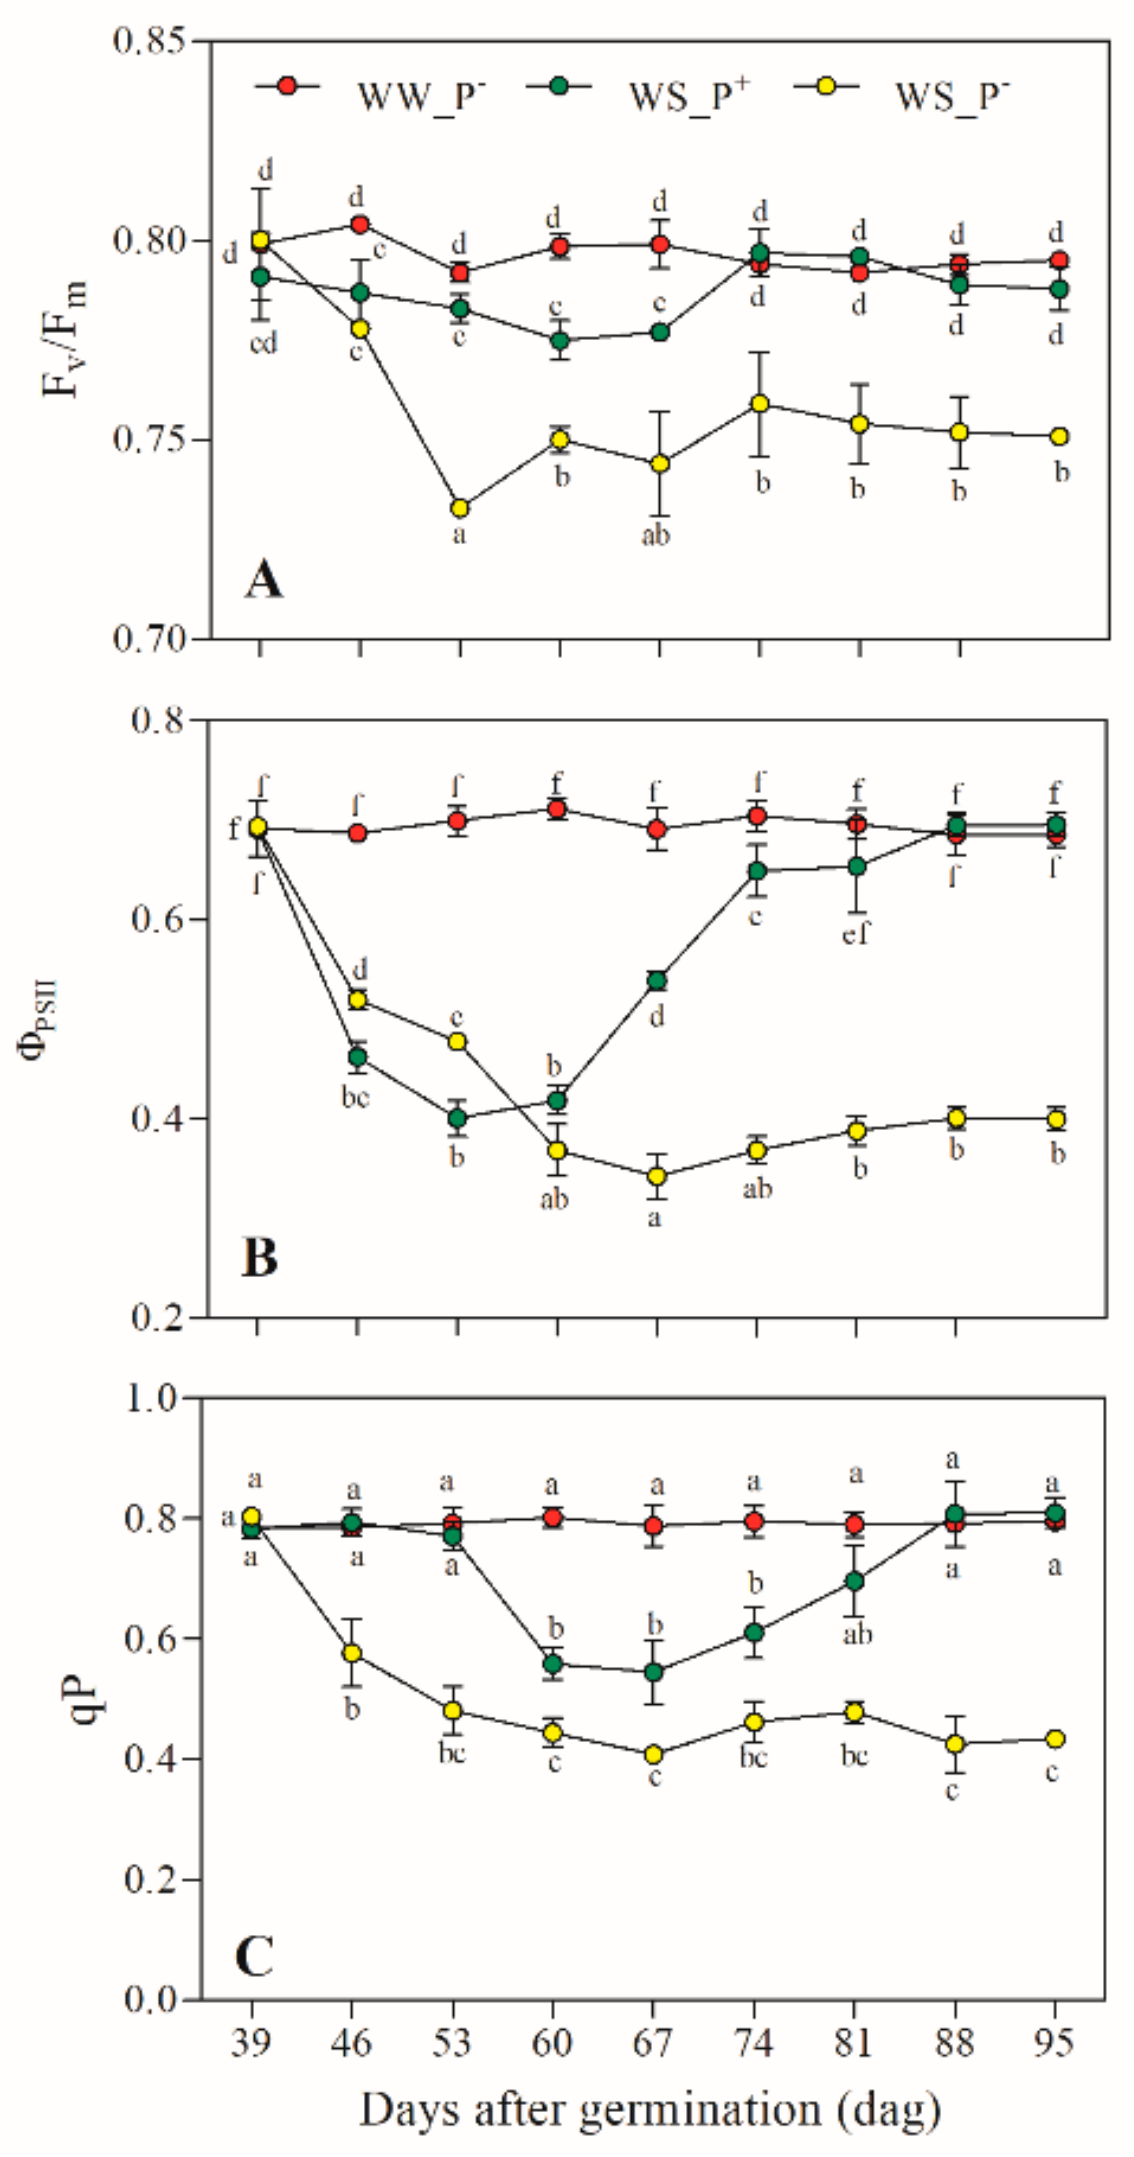
Figure 5 shows that the PSII photochemical efficiency (Fv/Fm) (Figure 5A), photon yield of PSII photochemistry (ΦPSII) (Figure 5B), and photochemical quenching of PSII (qP) (Figure 5C) also had time series with a similar trend for each growth condition tested.
In WW_P− plants, the values of the three parameters were almost constant (Figure 5A–C). In WS_P− plants, they underwent a steep decrease after a week of treatment (46 dag), which reached saturation before the end of experiment (Figure 5A–C). Additionally, in WS_P+ plants, the three parameters underwent a steep decrease after a week of treatment (46 dag), but their values recovered to those of control plants (WW_P−) after several weeks (Figure 5A–C).
We can say that paramylon nanofibers induced dehydration tolerance and improved intrinsic water use efficiency by influencing stomatal behaviour. Scartazza et al. [16] monitored the effects of water removal on the Ψw and ΦPSII of paramylon-treated tomato plants. They suggested that the paramylon caused an increase of CO2 diffusional constraints but also promoted the ability of tomato plants to reduce water losses and counteract the reduction of ΦPSII caused by the drought. According to these authors [16], β-glucan nanofibers play a potential role in reducing the sensitivity of PSII to potential dehydration damages thanks to a strong stomatal control associated with the transient modified profile of the three major plant hormones content (i.e., abscissic acid, jasmonic acid, salicylic acid) in the xylem sap. Furthermore, they stated that paramylon induced a consistent increase of gm/gs ratio (mesophyll conductance/stomatal conductance) and carbon gained per unit water used, which represents a relevant adaptive trait under water-limited conditions [16,36].
All our eco–physiological data confirmed the potentiality of paramylon nanofibers in the buffering water stress effect on both the photosynthetic rate and the PSII photochemical efficiency. The rate of linear electron transport (ΦPSII) returned to the value of the control (WW_P− plants) with the consequent increase of the proportion of PSII reaction centres that were open (qP). Therefore, PSII photoinhibition and photodamage were counteracted (e.g., a complete recovery of Fv/Fm and ΦPSII values), reducing the sensitivity of PSII to potential dehydration damages.
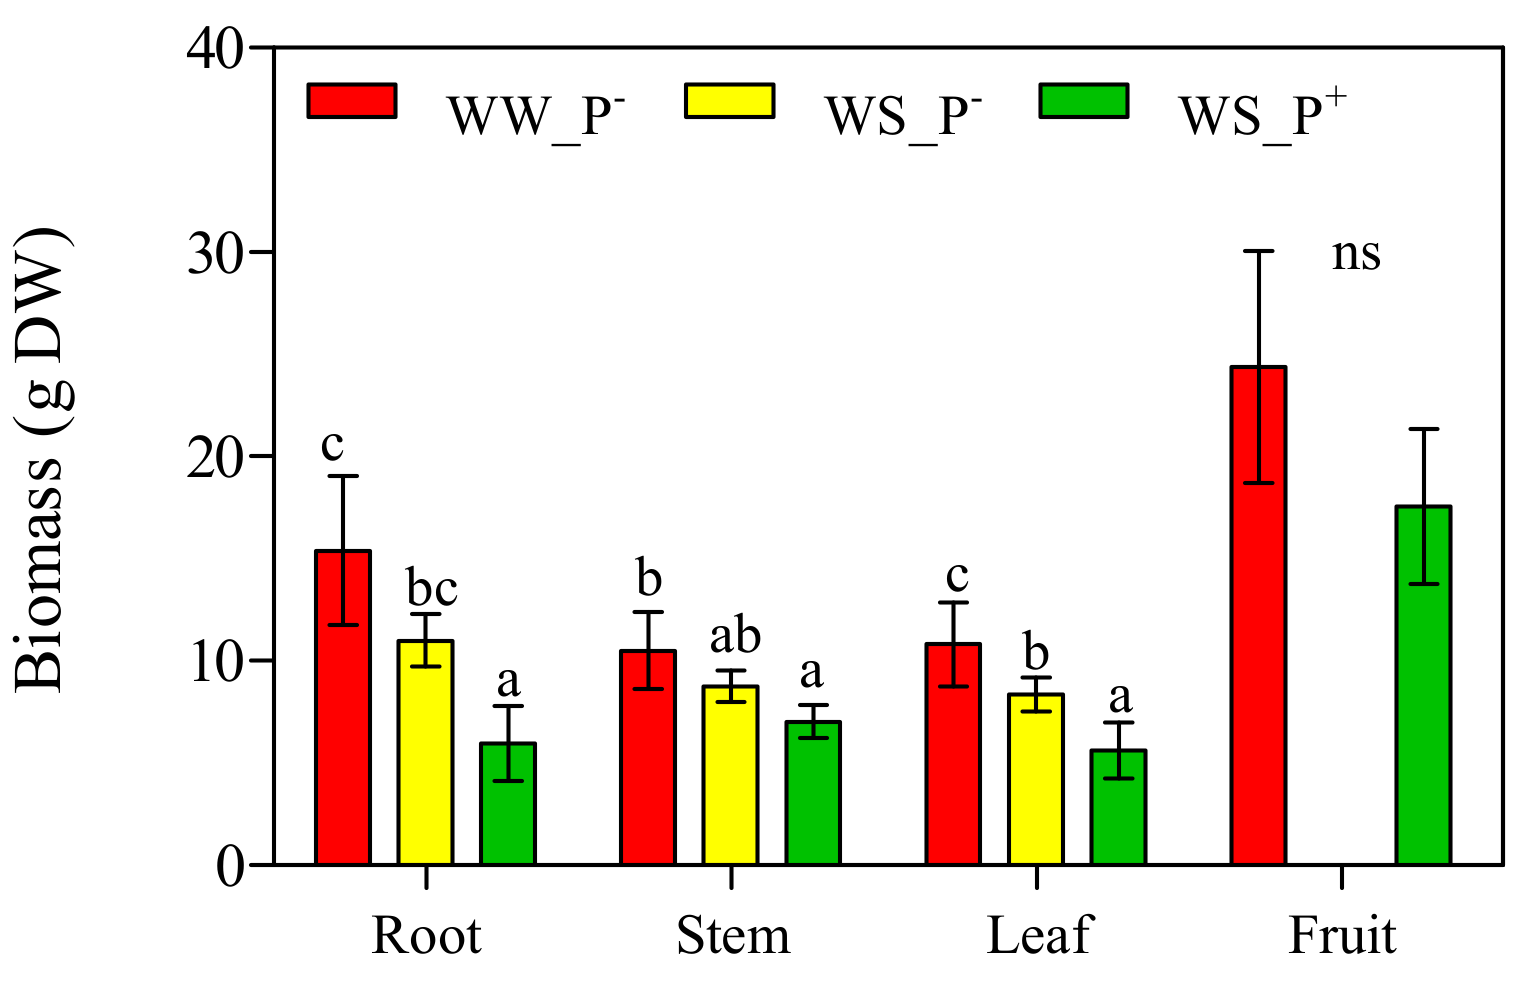
The values of the root, stem, leaf and fruit dry biomass measured 95 dag on the plants under the three different cultivation conditions are shown in Figure 7. WS_P− plants showed a significant reduction only in leaf DW (−23% compared with WW_P−) data relative to the fruits are not shown because the fruit did not ripe beyond the II category (mature green) [24]. Drought stress conditions were so severe that all the eco–physiological parameters were deeply altered (Figure 2, Figure 5, and Figure 6) and inhibited the progress of ripening.
A significant reduction of root, stem and leaf DW was observed in WS_P+ plants (−61%, −33% and −48% compared with WW_P−). This reduction of growth could be explained as an adaptation strategy to reduce resource spending and allow the plants to divert energy in the fruits. No significant differences (p > 0.05) were observed between red ripe fruits DW of WW_P− and WS_P+ plants. It is clear that WS induced a negative effect on leaf biomass and fruit ripening, as confirmed by the reduction of leaf DW and the alteration of fruit-ripening processes. Our results are not consistent with those by other authors [38,39,40] but are in accordance with Khan et al. [41]. The differences observed in the WS sensitivity may be due to the severity of drought.
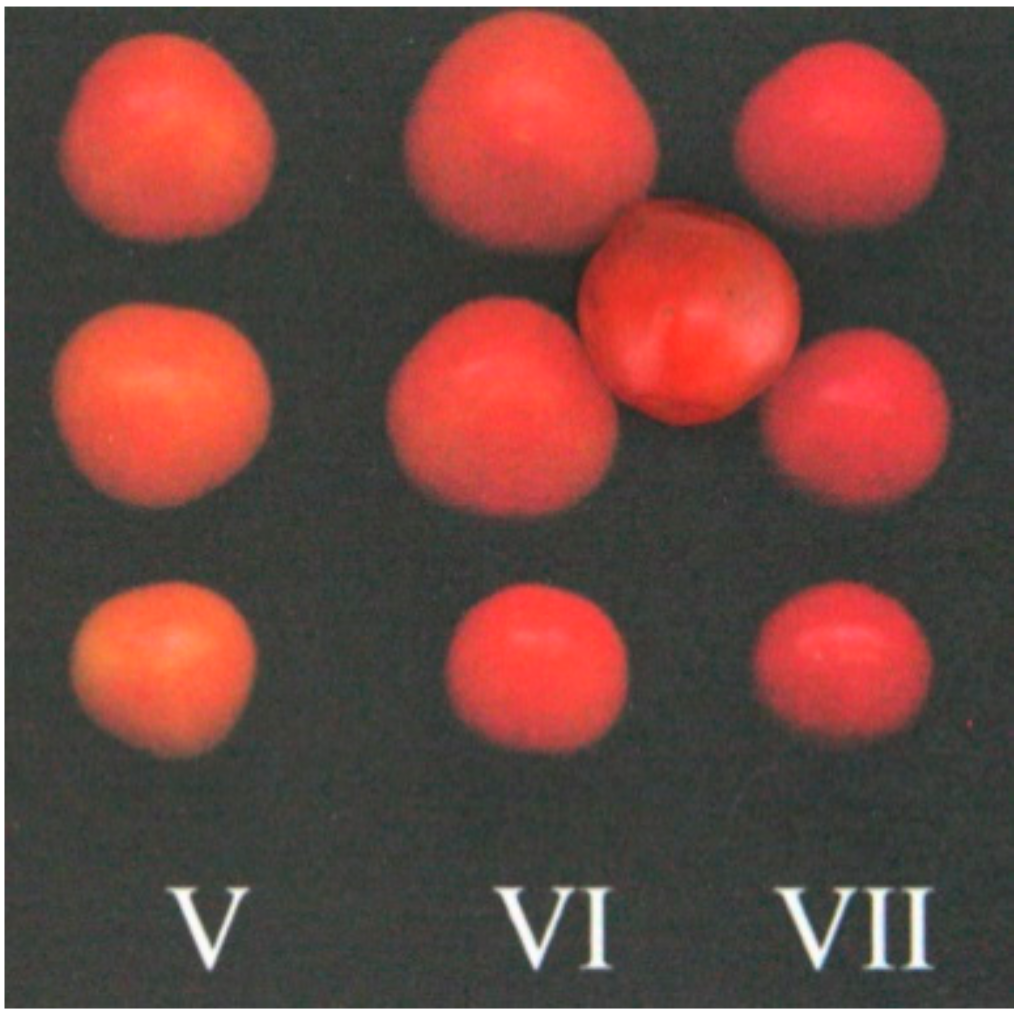
The other physicochemical parameters (ashes, microelements, weight, size and yield) and the quality parameters (antioxidant compositions and activities, soluble carbohydrates) were measured on fruits assigned to a ripening category intermediate between the VI (red ripe) and the VII (red overripe) categories (Figure 8) [24].
No significant differences were observed between the number, weight and dimensions of the fruits of WW_P− and WS_P+ (data not shown), though paramylon-treated plants showed precocious fruiting and ripening (Figure 9). As already stated, data relative to fruits of the drought stressed plants without paramylon (WW_P−) are not shown because the fruits did not ripe beyond the II category (mature green).
The effects of cultivation conditions on red ripe fruits were monitored by the quantification of biometric parameters (ashes, dry matter, and moisture; Figure 10), microelement content, and bioactive compounds (antioxidant compositions and activities, soluble carbohydrates; Figure 11, Figure 12 and Figure 13). In fruits harvested from WS_P+ plants, a significant increase of ashes and dry matter was observed compared with WW_P− plants, while moisture showed an opposite trend (Figure 10). These data confirmed that paramylon treatment could improve fruit quality.
No significant differences were observed between WW_P− and WS_P+ fruits regarding microelements content (data not shown).
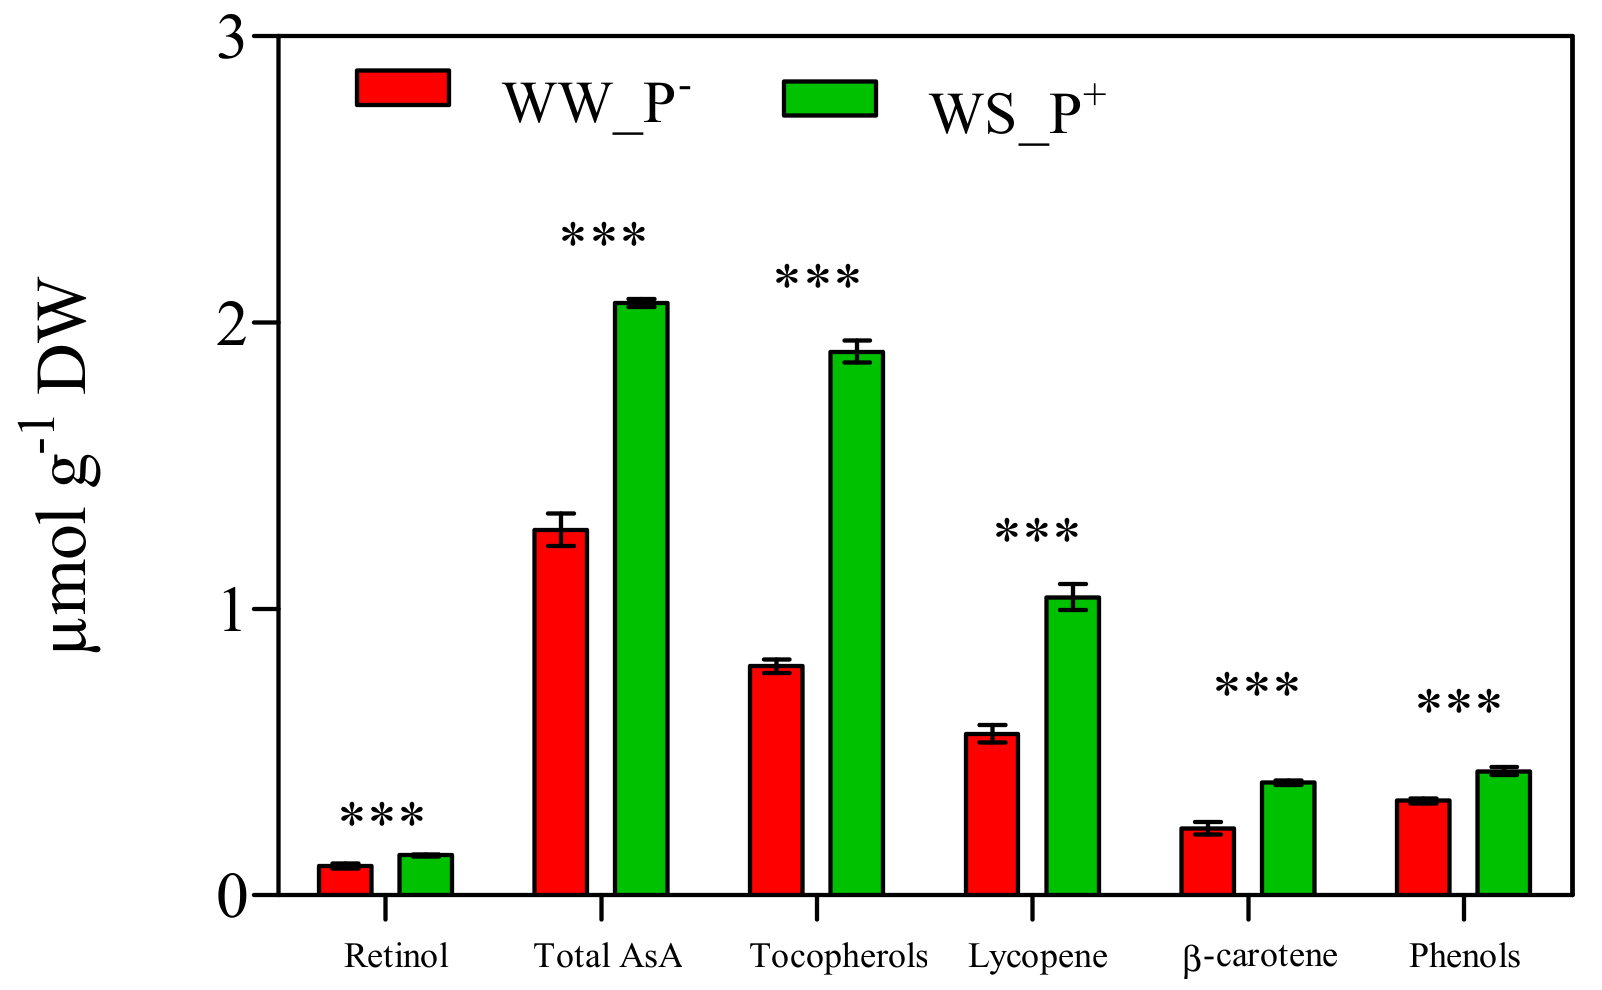
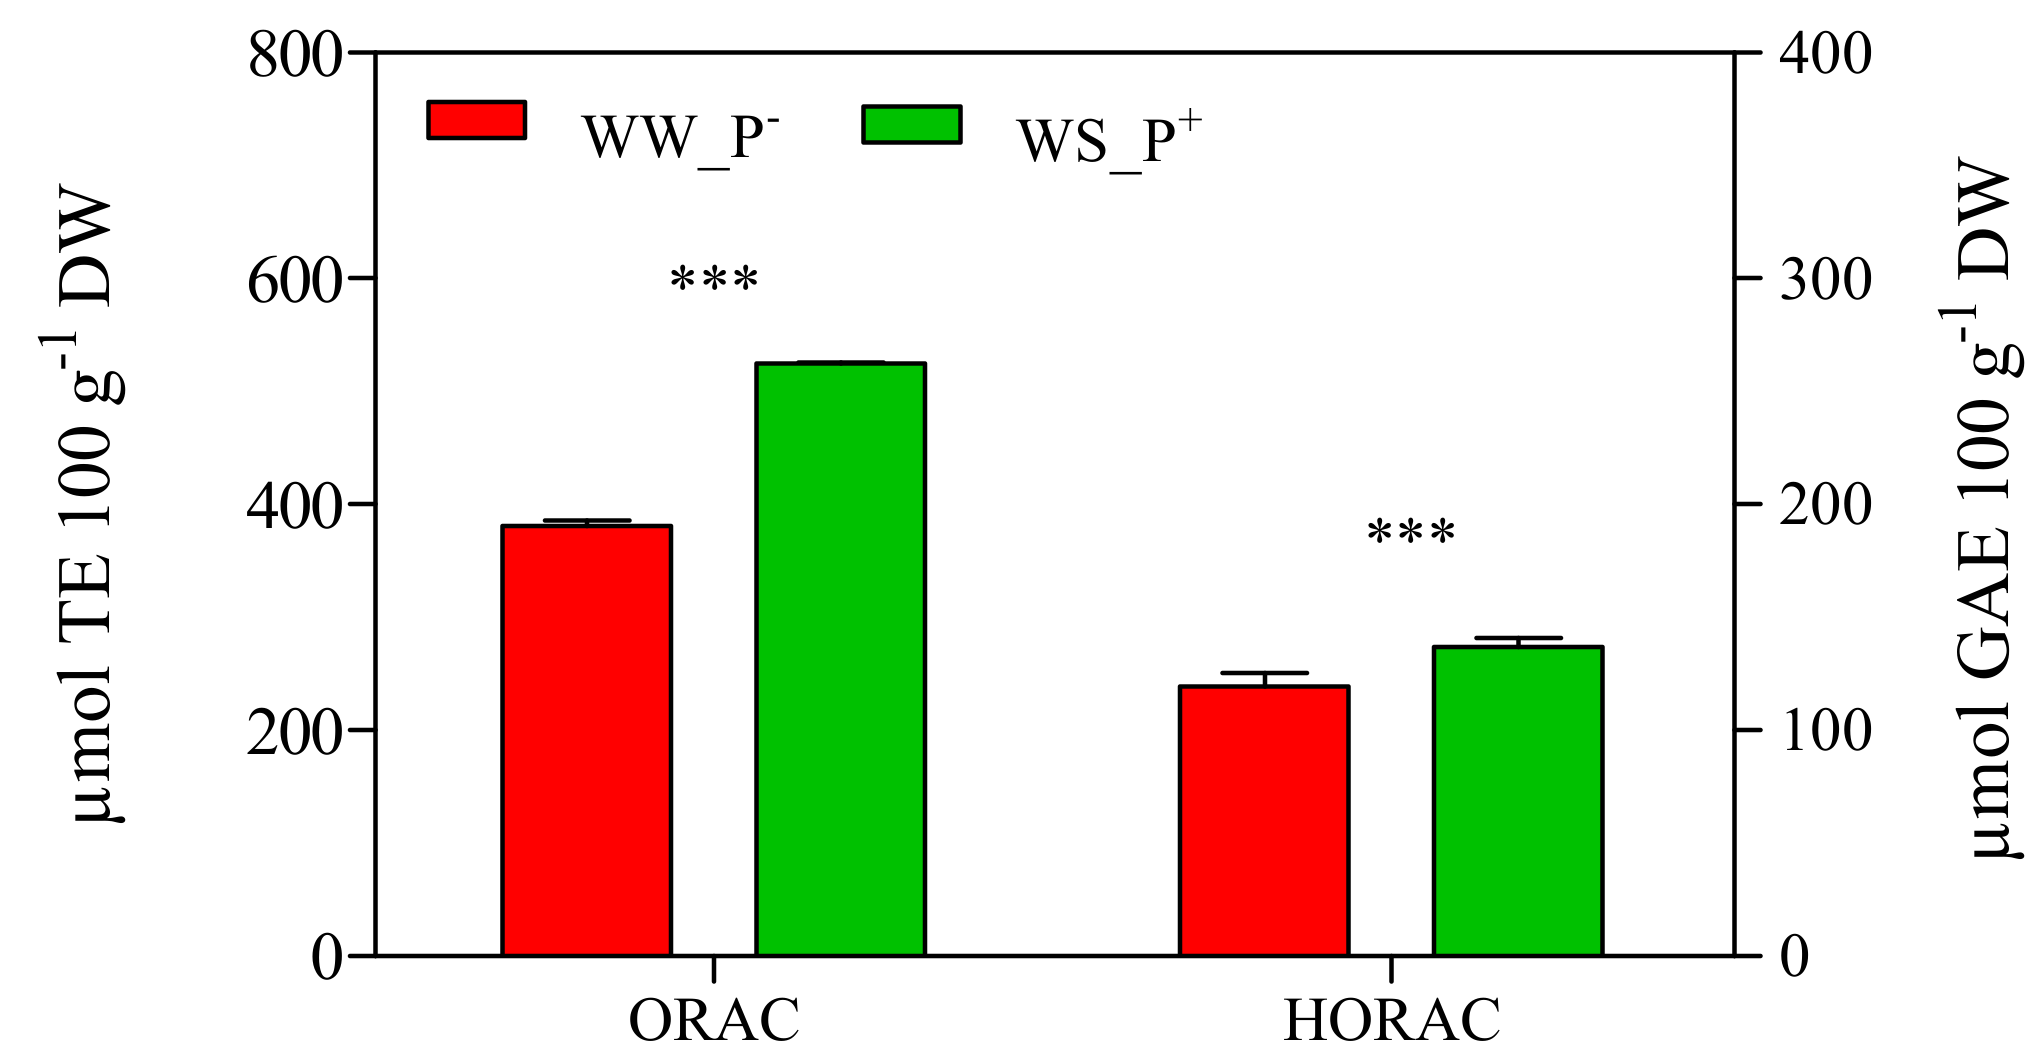
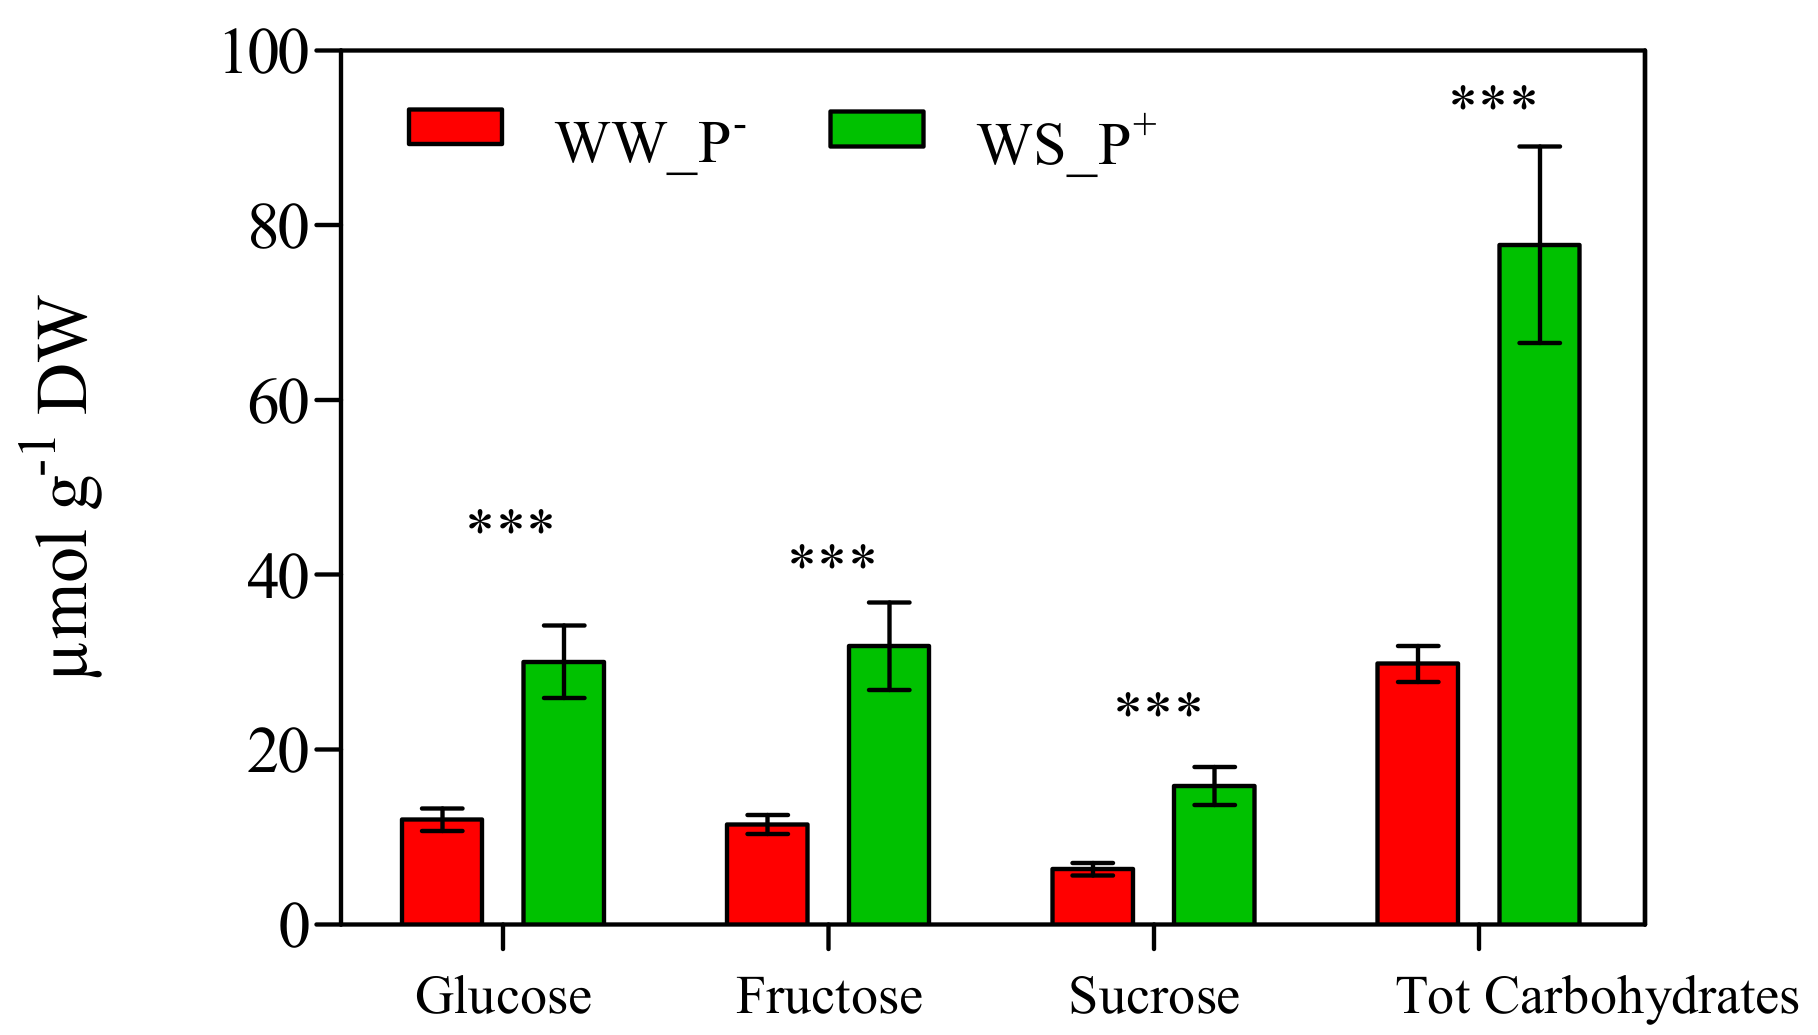
The cultivation conditions significantly affected the amount of antioxidant compounds of the fruits: all biochemical parameters (retinol, i.e., Vitamin A, tot AsA, i.e., Vitamin C, tocopherols, i.e., Vitamin E, lycopene, β-carotene and phenols) deeply increased in fruits harvested from WS_P+ plants (about two-fold higher than those recorded in WW_P− plants; Figure 11). A high AsA content is an important trait in tomato fruits, as it prevents oxidative stress (especially during fruit ripening) and thus enhances shelf life [42]. Similarly, an increase of lycopene (a highly characteristic phytonutrient of tomatoes) could affect the final nutritional quality and commercial value of tomato fruit [43]. In fact, lycopene greatly enhances fruit quality thanks to its intense antioxidant activity that suppresses cell proliferation and interferes with the growth of cancer cells [44,45]. In addition, a marked increase of the antioxidant activity expressed as the ORAC and HORAC values was observed in fruits harvested from WS_P+ plants (+38% and +15%, compared with WW_P−; Figure 12). This result confirms the involvement of lycopene, β-carotene, and retinol in the antioxidant response of WS_P+ fruits. Tocopherols are non-enzymatic lipid-soluble antioxidants that protect the pigments, proteins, and polyunsaturated fatty acids of the photosynthetic apparatus against reactive oxygen species [46]. It has been reported that the tocopherols content in tomato fruits depends on many factors such as the level of irrigation, light, and NaCl [47]. We found that plants grown under WS_P+ conditions produced fruits with a high tocopherol content, thus indicating an induction of defense mechanisms. Phenolic compounds and AsA represent the main water-soluble antioxidants in tomatoes [48]. In WS_P+ fruits, a significant increase of total phenols was observed, suggesting that they contribute positively to the antioxidant activity of the tomato water-soluble fraction by reducing the levels of free radicals due to WS (as confirmed by the increase of ORAC and HORAC levels). This response can be considered an adaptive mechanism to water stress that promotes the de novo synthesis of these metabolites [40]. At the end of the experiment, the content of carbohydrates showed a similar trend. Glucose, fructose, and sucrose concentrations, as well as total carbohydrates, in the fruits of WS_P+ plants were nearly three-fold higher than in fruits harvested from WW_P− plants (Figure 13). Carbohydrates are essential for plant growth and survival, as well as maintenance and repair processes, and they are also major sources of cellular energy [49]. These compounds play a key role in regulating overall cellular metabolism, maintaining osmotic equilibrium, and preventing turgor loss in tissue [50,51]. They also can act as scavengers of reactive oxygen species (ROS) and contribute to the protection of membranes and macromolecules [52,53]. Micro-Tom fruits contain the reducing sugars fructose and glucose with trace amounts of sucrose, typical of tomatoes [54]. The carbohydrates composition found here was in agreement with that reported in the literature [55].
4. Conclusions
Drought is by far the most important environmental stressor in agriculture worldwide, and it is expected to contribute to the severe salinization of more than 50% of world arable land by 2050. The research efforts to improve crop productivity under water limiting conditions, focused mainly on natural selection and the breeding activity of tolerant genotypes. Root treatment could be another method to cope with the drought stress. In this paper, we showed the results of the direct application of paramylon on the root system of Micro-Tom tomatoes. Paramylon extracted from the E. gracilis WZSL mutant was processed to linear nanofibers that interacted with the Dectin-1 receptors present on the target cell membranes of tomato roots, enhancing the plant defense capacity against drought. Drought tolerance was achieved by influencing stomatal behavior and inducing an effective improvement of water use efficiency, obtained by modulating the conductance to CO2 diffusion from air to the carboxylation sites through the modulation of hormone levels [16]. We observed that the paramylon treatment allowed the optimal water regimen of about 8.64 L plant−1 day−1 to be lowered to 0.36 Lplant−1 day−1 without a detrimental effect on the yield and eco–physiological parameters. The great increase of antioxidant compounds (Vitamin A/C/E, lycopene, β-carotene and phenols) together with the increase of carbohydrates (glucose, fructose and sucrose) in the fruits of paramylon-treated plants improved their nutritional value and sensory quality.
These results confirm the biostimulant activity of paramylon in increasing plant adaptation capacity for abiotic stress.
Author Contributions
Conceptualization, methodology, investigation, writing—L.B. and P.G.; resources, software, and data curation—P.C.
Funding
This research received no external funding.
Conflicts of Interest
The authors declare no conflict of interest.
References
- Barsanti, L.; Passarelli, V.; Evangelista, V.; Frassanito, A.M.; Gualtieri, P. Chemistry, physico-chemistry and applications linked to biological activities of β-glucans. Nat. Prod. Rep. 2011, 28, 457–466. [Google Scholar] [CrossRef] [PubMed]
- Barsanti, L.; Vismara, R.; Passarelli, V.; Gualtieri, P. Paramylon (β-1,3-glucan) content in wild type and WZSL mutant of Euglena gracilis: effects of growth conditions. J. Appl. Phycol. 2001, 13, 59–65. [Google Scholar] [CrossRef]
- Shibakami, M.; Tsuboichi, G.; Nakamura, M.; Hayashi, M. Preparation of carboxylic acid-bearing polysaccharide nanofiber made from euglenoid β-1,3-glucans. Carbohydr. Polym. 2013, 15, 95–101. [Google Scholar] [CrossRef] [PubMed]
- Russo, R.; Barsanti, L.; Evangelista, V.; Frassanito, A.M.; Longo, V.; Pucci, L.; Penno, G.; Gualtieri, P. Euglena gracilis paramylon activates human lymphocytes by upregulating pro-inflammatory factors. Food Sci. Nutr. 2017, 5, 205–214. [Google Scholar] [CrossRef] [PubMed]
- Rosati, G.; Barsanti, L.; Passarelli, V.; Giambelluca, A.; Gualtieri, P. Ultrastructure of a novel non-photosynthetic Euglena mutant. Micron 1996, 27, 367–373. [Google Scholar] [CrossRef]
- Takeuchi, O.; Akira, S. Pattern recognition receptors and inflammation. Cell 2010, 140, 805–820. [Google Scholar] [CrossRef] [PubMed]
- Thompson, I.J.; Oyston, P.C.F.; Williamson, D.E. Potential of the β-glucans to enhance innate resistance to biological agents. Expert Rev. Anti. Infect. Ther. 2010, 8, 339–352. [Google Scholar] [CrossRef] [PubMed]
- Adams, E.L.; Rice, P.J.; Graves, B.; Ensley, H.E.; Yu, H.; Brown, G.D.; Williams, D.L. Differential high-affinity interaction of dectin-1 with natural or synthetic glucans is dependent upon primary structure and is influenced by polymer chain length and side chain branching. J. Pharmacol. Exp. Ther. 2008, 325, 115–123. [Google Scholar] [CrossRef]
- Fu, C.; Iyer, P.; Herkal, A.; Abdullah, J.; Stout, A.; Free, S.J. Identification and characterization of genes required for cell-to-cell fusion in Neurospora crassa. Eukaryot. Cell 2011, 10, 1100–1109. [Google Scholar] [CrossRef]
- Bashir, K.M.I.; Choi, J.-S. Clinical and physiological perspectives of β-glucans: the past, present, and future. Int. J. Mol. Sci. 2017, 18, 1906. [Google Scholar] [CrossRef]
- Dennehy, K.M.; Brown, G.D. The role of the beta-glucan receptor dectin-1 in control of fungal infection. J. Leukoc. Biol. 2007, 82, 253–258. [Google Scholar] [CrossRef]
- Monie, T.P. Immune cells and the process of pattern recognition. In The innate immune system: A compositional and functional perspective; Monie, T.P., Ed.; Academic Press: London, UK, 2017; pp. 41–83. [Google Scholar]
- Palma, A.S.; Feizi, T.; Zhang, Y.; Stoll, M.S.; Lawson, A.M.; Diaz-Rodríguez, E.; Campanero-Rhodes, A.S.; Costa, J.; Brown, G.D.; Chai, W. Ligands for the beta-glucan receptor, dectin-1, assigned using “designer” microarrays of oligosaccharide probes (neoglycolipids) generated from glucan polysaccharides. J.Biol. Chem. 2006, 281, 5771–5779. [Google Scholar] [CrossRef] [PubMed]
- Tsoni, S.V.; Brown, G.D. β-glucans and dectin-1. Ann. N. Y. Acad. Sci. 2008, 1143, 45–60. [Google Scholar] [CrossRef] [PubMed]
- Vismara, R.; Vestri, S.; Frassanito, A.M.; Barsanti, L.; Gualtieri, P. Stress resistance induced by paramylon treatment in Artemia sp. J. Appl. Phycol. 2004, 16, 61–67. [Google Scholar] [CrossRef]
- Scartazza, A.; Picciarelli, P.; Mariotti, L.; Curadi, M.; Barsanti, L.; Gualtieri, P. The role of Euglena gracilis paramylon in modulating xylem hormone levels, photosynthesis and water-use efficiency in Solanum lycopersicum L. Physiol. Plant. 2017, 161, 486–501. [Google Scholar] [CrossRef] [PubMed]
- Kusmic, C.; Barsanti, L.; Di Lascio, N.; Faita, F.; Evangelista, V.; Gualtieri, P. Anti-fibrotic effect of paramylon nanofibers from the WZSL mutant of Euglena gracilis on liver damage induced by CCl4 in mice. J. Funct. Foods 2018, 46, 538–545. [Google Scholar] [CrossRef]
- Morison, J.I.L.; Baker, N.R.; Mullineaux, P.M.; Davies, W.J. Improving water use in crop production. Philos. Trans. R. Soc. Lond. 2008, 363, 639–658. [Google Scholar] [CrossRef] [PubMed]
- Scott, J.W.; Harbaugh, B.K. Micro-Tom: A Miniature Dwarf Tomato; Agricultural Experiment Station, Institute of Food and Agricultural Sciences, University of Florida: Gainesville, FL, USA, 1989; pp. 1–6. [Google Scholar]
- Motohashi, R.; Enoki, H.; Fukazawa, C.; Kiriiwa, S. Hydroponic culture of Micro-Tom tomato. Bio-protocol 2015, 5, e1613. [Google Scholar] [CrossRef]
- Johnstone, P.R.; Nichols, M.A.; Fisher, K.J.; Reid, J. Nutritional studies with processing tomato grown in aeroponic. Acta Horticulture 2001, 143–150. [Google Scholar] [CrossRef]
- Turner, N.C.; Long, M.J. Errors arising from rapid water loss in the measurement of leaf water potential by the pressure chamber technique. Aust. J. Plant Physiol. 1980, 7, 527–537. [Google Scholar] [CrossRef]
- Schreiber, U.; Schilwa, U.; Bilger, W. Continuous recording of photochemical and non-photochemical chlorophyll fluorescence quenching with a new type of modulation fluorometer. Photosynth. Res. 1986, 10, 51–62. [Google Scholar] [CrossRef] [PubMed]
- Leide, J.; Hildebrandt, H.; Reussing, K.; Riederer, M.; Vogg, G. The developmental pattern of tomato fruit wax accumulation and its impact on cuticular transpiration barrier properties: effects of a deficiency in a β-ketoacyl-coenzyme A synthase (LeCER6). Plant Physiol. 2007, 144, 1667–1679. [Google Scholar] [CrossRef] [PubMed]
- Zasoski, R.J.; Burau, R.G. A rapid nitric-perchloric acid digestion method for multi-element tissue analysis. Comm. Soil Sci. Plant Anal. 1977, 8, 425–436. [Google Scholar] [CrossRef]
- Aremu, S.O.; Nweze, C.C. Determination of vitamin A content from selected Nigerian fruits using spectrophotometric method. Bangladesh J. Sci. Ind. Res. 2017, 52, 153–158. [Google Scholar] [CrossRef] [Green Version]
- Georgé, S.; Tourniaire, F.; Gautier, H.; Goupy, P.; Rock, E.; Caris-Veyrat, C. Changes in the contents of carotenoids, phenolic compounds and vitamin C during technical processing and lyophilization of red and yellow tomatoes. Food Chem. 2011, 124, 1603–1611. [Google Scholar]
- Kampfenkel, K.; Van Montagu, M.; Inzé, D. Extraction and determination of ascorbate and dehydroascorbate from plant tissue. Anal. Biochem. 1995, 10, 165–167. [Google Scholar] [CrossRef] [PubMed]
- Döring, A.S.; Pellegrini, E.; Campanella, A.; Trivellini, A.; Gennai, C.; Petersen, M.; Nali, C.; Lorenzini, G. How sensitive is Melissa officinalis to realistic ozone concentrations? Plant Physiol. Biochem. 2014, 74, 156–164. [Google Scholar] [CrossRef]
- Aguiar, F.; Menezes, V.; Rogez, H. Spontaneous postharvest fermentation of acai (Euterpe oleracea) fruit. Postharvest Biol. Technol. 2013, 86, 294–299. [Google Scholar] [CrossRef]
- Ou, B.X.; Hampsch-Woodill, M.; Prior, R.L. Development and validation of an improved Oxygen Radical Absorbance Capacity Assay using fluorescein as the fluorescent probe. J. Agric. Food Chem. 2001, 49, 4619–4626. [Google Scholar] [CrossRef]
- Ou, B.X.; Huang, D.J.; Hampsch-Woodill, M.; Flanagan, J.A.; Deemer, E.K. Analysis of antioxidant activities of common vegetables employing oxygen radical absorbance capacity (ORAC) and ferric reducing antioxidant power (FRAP) assays: a comparative study. J. Agric. Food Chem. 2002, 50, 3122–3128. [Google Scholar] [CrossRef]
- Waterhouse, A.L. Polyphenolics: determination of total phenolics. In Current Protocols in Food Analytical Chemistry; Wrolstad, R.E., Ed.; Wiley: New York, NY, USA, 2002; pp. 1–4. [Google Scholar]
- Lakhiar, I.A.; Gao, J.; Syed, T.N.; Chandio, F.A.; Buttar, N.A. Modern plant cultivation technologies in agriculture under controlled environment: a review on aeroponics. J. Plant Interact. 2018, 13, 338–352. [Google Scholar] [CrossRef]
- Alves, F.R.R.; Melo, H.C.; Crispin-Filho, A.J.; Costa, A.C.; Nascimiento, K.J.T.; Carvalho, R.F. Physiological and biochemical responses of photomorphogenic tomato mutants (cv. Micro-Tom) under water withholding. Acta Physiol. Plant 2016, 38, 155–170. [Google Scholar] [CrossRef]
- Centritto, M.; Lauteri, M.; Monteverdi, M.C.; Serraj, R. Leaf gas exchange, carbon isotope discrimination, and grain yield in contrasting rice genotypes subjected to water deficits during the reproductive stage. J. Exp. Bot. 2009, 60, 2325–2339. [Google Scholar] [CrossRef] [PubMed]
- Flexas, J.; Niinements, U.; Gallé, A.; Barbour, M.M.; Centritto, M.; Diaz-Espejo, A.; Douthe, C.; Galmés, J.; Ribas-Carbo, M.; Rodriguez, P.L.; et al. Diffusional conductances to CO2 as a target for increasing photosynthesis and photosynthetic water-use efficiency. Photosynth. Res. 2913, 117, 45–59. [Google Scholar] [CrossRef] [PubMed]
- Patanè, C.; Cosentino, S.L. Effects of soil water deficit on yield and quality of processing tomato under a Mediterranean climate. Agric. Water Manag. 2010, 97, 131–138. [Google Scholar] [CrossRef]
- Casa, R.; Rouphael, Y. Effects of partial root-zone drying irrigation on yield fruit quality, and water-use efficiency in processing tomato. J. Hortic. Sci. Biotechnol. 2014, 89, 389–396. [Google Scholar] [CrossRef]
- Guida, G.; Sellami, M.H.; Mistretta, C.; Oliva, M.; Buonomo, R.; De Mascellis, R.; Patanè, C.; Rouphael, Y.; Albrizio, R.; Giorio, P. Agronomical, physiological and fruit quality responses of two Italian long-storage tomato landraces under rain-fed and full irrigation conditions. Agric. Water Manag. 2017, 180, 126–135. [Google Scholar] [CrossRef]
- Khan, S.H.; Khan, A.; Litaf, U.; Shah, A.S.; Khan, M.A.; Bilal, M.; Ali, M.U. Effect of drought stress on tomato cv. Bombino. J. Food Process. Technol. 2015, 6, 465. [Google Scholar] [CrossRef]
- Slimestad, R.; Verheul, M. Review of flavonoids and other phenolics from fruits of different tomato (Lycopersicon esculentum L.) cultivars. J. Sci. Food Agric. 2009, 89, 1255–1270. [Google Scholar] [CrossRef]
- Dumas, Y.; Dadomo, M.; Licca, G.D.; Grolier, P. Effects of environmental factors and agricultural techniques of antioxidant content of tomatoes. J. Sci. Food Agric. 2003, 83, 369–382. [Google Scholar] [CrossRef]
- Levi, F.; Pasche, C.; Lucchini, F.; La Vecchia, C. Dietary intake of selected micronutrients and breast-cancer risk. Int. J. Cancer 2001, 91, 260–263. [Google Scholar] [CrossRef]
- Stahl, W.; Sies, H. Bioactivity and protective effects of natural carotenoids. Biochim. Biophys. Acta 2005, 30, 101–107. [Google Scholar] [CrossRef] [PubMed]
- Quadrana, L.; Almeida, J.; Otaiza, S.N.; Duffy, T.; Corrêa da Silva, J.V.; de Godoy, F.; Asís, R.; Bermúdez, L.; Fernie, A.R.; Carrari, F.; et al. Transcriptional regulation of tocopherol biosynthesis in tomato. Plant Mol. Biol. 2013, 81, 309–325. [Google Scholar] [CrossRef] [PubMed]
- Raiola, A.; Tenore, G.C.; Barone, A.; Frusciante, L.; Rigano, M.M. Vitamin E content and composition in tomato fruits: beneficial roles and bio-fortification. Int. J. Mol. Sci. 2015, 8, 29250–29264. [Google Scholar] [CrossRef] [PubMed]
- Fanasca, S.; Colla, G.; Maiani, G.; Venneria, E.; Rouphael, Y.; Azzini, E.; Saccardo, F. Changes in antioxidant content of tomato fruits in response to cultivar and nutrient solution composition. J. Agric. Food Chem. 2006, 54, 4319–4325. [Google Scholar] [CrossRef]
- Kusvuran, S.; Ellialtioglu, S.; Polat, Z. Antioxidative enzyme activity lipid peroxidation, and proline accumulation in the callus tissues of salt and drought tolerant and sensitive pumpkin genotypes under chilling stress. Hortic. Environ. Biotechnol. 2013, 54, 319–325. [Google Scholar] [CrossRef]
- Clifford, S.C.; Arndt, S.K.; Corlett, J.E.; Joshi, S.; Sankhla, N.; Popp, M.; Jones, H.G. The role of solute accumulation, osmotic adjustment and changes in cell wall elasticity in drought tolerance in Ziziphus mauritania (Lamk.). J. Exp. Bot. 1998, 49, 967–977. [Google Scholar] [CrossRef]
- Sivakumar, P.; Sharmila, P.; Jain, V.; Pardha-Saradhi, P. Sugars have potential to curtail oxygease acitivity of Rubisco. Biochem. Biophys. Res. Commun. 2002, 298, 247–250. [Google Scholar] [CrossRef]
- Hoekstra, F.A.; Golovina, E.A.; Buitink, J. Mechanisms of plant desiccation tolerance. Trends Plant Sci. 2001, 6, 431–438. [Google Scholar] [CrossRef]
- Mahajan, S.; Tuteja, N. Cold, salinity and drought stresses: an overview. Arch. Biochem. Biophys. 2005, 444, 139–158. [Google Scholar] [CrossRef]
- Malundo, T.M.M.; Shewfelt, R.L.; Scott, J.W. Flavor quality of fresh tomato (Lycopersicon esculentum Mill) as affected by sugar and acid levels. Postharvest Biol. Technol. 1995, 6, 103–110. [Google Scholar] [CrossRef]
- Gomez, P.; Ferrer, M.A.; Fernandez-Trujillo, J.P.; Calderon, A.; Artes, F.; Egea-Cortines, M.; Weiss, J. Structural changes, chemical composition and antioxidant activity of cherry tomato fruits (cv Micro-Tom) stored under optimal and chilling conditions. J. Sci. Food Agric. 2009, 89, 1543–1551. [Google Scholar] [CrossRef]
Figure 1.
The aeroponic cultivation system.

Figure 2.
The representative features of the tomato plants (aerial parts) under the three cultivation conditions tested 60 days after germination (dag): (A) Optimal water regimen; (B) water scarcity regimen; (C) water scarcity regimen coupled with paramylon root treatment.
Figure 2.
The representative features of the tomato plants (aerial parts) under the three cultivation conditions tested 60 days after germination (dag): (A) Optimal water regimen; (B) water scarcity regimen; (C) water scarcity regimen coupled with paramylon root treatment.

Figure 3.
The root system of the tomato plants under the three cultivation conditions tested 60 dag. (A) Optimal water regimen, root length about 100 cm; (B) water scarcity regimen, root length about 80 cm; (C) water scarcity regimen coupled with paramylon root treatment, root length about 10 cm.
Figure 3.
The root system of the tomato plants under the three cultivation conditions tested 60 dag. (A) Optimal water regimen, root length about 100 cm; (B) water scarcity regimen, root length about 80 cm; (C) water scarcity regimen coupled with paramylon root treatment, root length about 10 cm.

Figure 4.
(A) Leaf water potential (Ψw), (B) CO2 assimilation rate (A), (C) stomatal conductance (gs), and (D) internal CO2 concentration (Ci) in leaves of Solanum lycopersicum cv. Micro-Tom grown under well-watered (WW) and water-stressed (WS) conditions coupled (or not) with root treatment with paramylon (P+ and P−). Data are shown as mean ± standard deviation (n = 16), and measurements were made starting from 39 dag. In each graph, different letters indicate significant differences among treatments (p < 0.05, Tukey’s HSD post hoc test).

Figure 5.
(A) Photosystem II (PSII) photochemical efficiency (Fv/Fm), (B) actual photon yield of PSII photochemistry (ΦPSII), and (C) photochemical quenching state of PSII (qP) in leaves of Solanum lycopersicum cv. Micro-Tom grown under well-watered (WW) and water-stressed (WS) conditions coupled (or not) with root treatment with paramylon (P+ and P−). Data are shown as mean ± standard deviation (n = 16), and measurements were made starting from 39 dag. In each graph, different letters indicate significant differences among treatments (p < 0.05, Tukey’s HSD post hoc test).

Figure 6.
Optical microscopy and scanning electron microscopy images of tomato root hairs 50 dag. (A and B) Hair surface of non-treated plants. (C and D) Hair surface of paramylon-treated plants.
Figure 6.
Optical microscopy and scanning electron microscopy images of tomato root hairs 50 dag. (A and B) Hair surface of non-treated plants. (C and D) Hair surface of paramylon-treated plants.

Figure 7.
Dry biomass expressed as g dry weight (DW) of leaf, stem, root, and red ripe fruits of Solanum lycopersicum cv. Micro-Tom grown under well-watered (WW) and water-stressed (WS) conditions coupled (or not) with root treatment with paramylon (P+ and P−). Data are shown as mean ± standard deviation (n = 8). Measurements were made 95 days after germination (dag). For each parameter, different letters indicate significant differences among treatments (p < 0.05, Tukey’s HSD post hoc test).

Figure 8.
Ripening categories table according to Leide et al. [24]: Fruits used for the measurement of physicochemical and quality parameters belong to a ripening category intermediate between the VI (red ripe) and the VII (red overripe) categories.
Figure 8.
Ripening categories table according to Leide et al. [24]: Fruits used for the measurement of physicochemical and quality parameters belong to a ripening category intermediate between the VI (red ripe) and the VII (red overripe) categories.

Figure 9.
Precocious fruiting and ripening of the fruits of WS_P+ plants (A) with respect to WW_P− plants (B) 74 dag.
Figure 9.
Precocious fruiting and ripening of the fruits of WS_P+ plants (A) with respect to WW_P− plants (B) 74 dag.

Figure 10.
Biometric parameters (dry ash, dry matter and moisture) in red ripe fruits of Solanum lycopersicum cv. Micro-Tom grown under well-watered (WW) and water-stressed (WS) conditions coupled (or not) with root treatment with paramylon (P+ and P−). Data are shown as mean ± standard deviation (n = 8). Measurements were made 95 dag. For each parameter, the data were analyzed by Student’s t test. The significant differences are for: *** = p < 0.001 and * = p > 0.05.

Figure 11.
Antioxidant compounds in red ripe fruits of Solanum lycopersicum cv. Micro-Tom grown under well-watered (WW) and water-stressed (WS) conditions coupled (or not) with root treatment with paramylon (P+ and P−). Data are shown as mean ± standard deviation (n = 8). Measurements were made 95 dag. For each parameter, the data were analyzed by Student’s t test. The significant differences are for: *** = p < 0.001. Abbreviations: DW, dry weight; Total AsA, total ascorbate (reduced and oxidized forms).

Figure 12.
Antioxidant capacity expressed as oxygen radical absorbance capacity (ORAC) and hydroxyl radical antioxidant capacity (HORAC) in red ripe fruits of Solanum lycopersicum cv. Micro-Tom grown under well-watered (WW) and water-stressed (WS) conditions coupled (or not) with root treatment with paramylon (P+ and P−). Data are shown as mean ± standard deviation (n = 8). Measurements were made 95 dag. For each parameter, the data were analyzed by Student’s t test. The significant differences are for: *** = p < 0.001. Abbreviations: DW, dry weight; GAE, gallic acid equivalent; TE, trolox equivalent.

Figure 13.
Carbohydrates in red ripe fruits of Solanum lycopersicum cv. Micro-Tom grown under well-watered (WW) and water-stressed (WS) conditions coupled (or not) with root treatment with paramylon (P+ and P−). Data are shown as mean ± standard deviation (n = 8). Measurements were made 95 dag. For each parameter, the data were analyzed by Student’s t test. The significant differences are for: *** = p < 0.001. Abbreviations: DW, dry weight.


Table 1.
Parameters of the aeroponic system used in the experiment.
| Parameters | Units | WW_P− | WS_P− and WS_P+ |
|---|---|---|---|
| Root available space | m−3 | 0.012 | 0.012 |
| Resident water | L | 100 | 100 |
| Emitter capacity | mLs−1 | 20 | 20 |
| Emitters per system | 8 | 8 | |
| Plants per system | 16 | 16 | |
| Irrigation duration | sh−1 | 36 | 1.5 |
| Irrigation supply per emitter | mLh−1 | 720 | 30 |
| Irrigation supply per system | Lh−1 | 5.76 | 0.24 |
| Irrigation supply per plant | Ld−1 | 8.64 | 0.36 |
© 2019 by the authors. Licensee MDPI, Basel, Switzerland. This article is an open access article distributed under the terms and conditions of the Creative Commons Attribution (CC BY) license (http://creativecommons.org/licenses/by/4.0/).
Share and Cite
MDPI and ACS Style
Barsanti, L.; Coltelli, P.; Gualtieri, P. Paramylon Treatment Improves Quality Profile and Drought Resistance in Solanum lycopersicum L. cv. Micro-Tom. Agronomy 2019, 9, 394. https://0-doi-org.brum.beds.ac.uk/10.3390/agronomy9070394
AMA Style
Barsanti L, Coltelli P, Gualtieri P. Paramylon Treatment Improves Quality Profile and Drought Resistance in Solanum lycopersicum L. cv. Micro-Tom. Agronomy. 2019; 9(7):394. https://0-doi-org.brum.beds.ac.uk/10.3390/agronomy9070394
Chicago/Turabian StyleBarsanti, Laura, Primo Coltelli, and Paolo Gualtieri. 2019. "Paramylon Treatment Improves Quality Profile and Drought Resistance in Solanum lycopersicum L. cv. Micro-Tom" Agronomy 9, no. 7: 394. https://0-doi-org.brum.beds.ac.uk/10.3390/agronomy9070394
Note that from the first issue of 2016, this journal uses article numbers instead of page numbers. See further details here.