Genetic Mapping Reveals Large-Effect QTL for Anther Extrusion in CIMMYT Spring Wheat
by
 ,
,
Quddoos H. Muqaddasi
1,* ,
,
Jochen C. Reif
1,
Marion S. Röder
1,
Bhoja R. Basnet
2 and
Susanne Dreisigacker
2 1
Leibniz Institute of Plant Genetics and Crop Plant Research (IPK), Corrensstraße 3, D-06466 Stadt Seeland, OT Gatersleben, Germany
2
International Maize and Wheat Improvement Center (CIMMYT), 06600 Mexico D.F., Mexico
*
Author to whom correspondence should be addressed.
Agronomy 2019, 9(7), 407; https://0-doi-org.brum.beds.ac.uk/10.3390/agronomy9070407
Submission received: 5 June 2019
/
Revised: 4 July 2019
/
Accepted: 17 July 2019
/
Published: 23 July 2019
(This article belongs to the Section Crop Breeding and Genetics)
Abstract
:Hybrid breeding facilitates the exploitation of heterosis and it can result in significant genetic gains and increased crop yields. Inefficient cross-pollination is a major limiting factor that hampers hybrid wheat seed production. In this study, we examined the genetic basis of anther extrusion (AE), which is an important trait in increasing cross-pollination, and thus improving seed set on the female lines and hybrid wheat seed production. We studied 300 segregating F2 plants and F2:3 families that result from a cross of two elite spring wheat lines. We observed that F2 and F2:3 populations hold significant and continuous genetic variation for AE, which suggests its reliable phenotypic selection. Composite interval mapping detected three quantitative trait loci (QTL) on chromosomes 3A, 5A, and 5D. The QTL on chromosome 5A (i.e., QAe.cimmyt-5A) was of large-effect, being consistently identified across generations, and spanned over 25 cM. Our study shows that (1) AE possesses strong genetic control (heritability), and (2) the QTL QAe.cimmyt-5A that imparted on an average of 20% of phenotypic variation can be used for marker-assisted selection (MAS) in breeding programs. In addition, pyramiding the large-effect QTL for MAS could efficiently complement the phenotypic selection since it is relatively easy and cheap to visually phenotype AE. This study reports the first large-effect QTL for AE in spring wheat, endorsing the use of this analysis in current hybrid wheat breeding and future Mendelization for the detection of underlying gene(s).
1. Introduction
Hybrid breeding in cross-pollinating crops has significantly contributed to increased grain yield per unit area since the beginning of the 20th century, and it continues to attract the attention of breeders and geneticists. Nevertheless, the benefits of hybrid breeding have not been exploited in wheat to date, mainly due to wheat’s (1) self-pollinating behavior, which makes crossing laborious and expensive, and (2) low levels of observed heterosis [1,2,3,4]. However, a recent large scale study showed the potential of wheat hybrids for grain yield heterosis to be around 10%, which seems to be reasonable given the advantages of hybrids for their abiotic and biotic stress tolerances and stable performances, especially in marginal environments [5,6,7,8,9,10]. Nevertheless, the level of heterosis in breeding programs could be improved by establishing the heterotic groups and patterns [11,12].
The spike architecture of wheat restricts the anthers inside the florets during flowering and it consequently limits the amount of pollen that sheds into the air—A key factor that governs cross-pollination. Therefore, the ineffective rate of cross-pollination remains as one of the major limitations for cost-effective establishment and the deployment of wheat hybrids. Anther extrusion (AE)—anthers extruding outside the florets during flowering at the yellow anther stage—governs the extent of cross-pollination and seed set on the female lines. In recent years, AE has been mainly investigated as a trait per se for its importance in hybrid seed production and as an indirect trait contributing to Fusarium head blight resistance [13,14,15,16,17,18].
Marker-assisted selection (MAS) is a procedure for selecting a trait based on trait-linked markers. Selection based on the markers is useful for breeding when the quantitative trait loci (QTL) linked with the markers are of significant effect, stable across generations and environments, and match the genetic background of varieties into which they are introgressed [19]. The genetic analysis of AE in recent bi-parental and diverse mapping populations revealed that AE is a quantitative trait, although highly heritable. AE is mainly affected by the wild-type alleles of reduced height (Rht) genes (i.e., Rht-B1a and -D1a), which may limit other agronomic advantages, such as lodging resistance [20,21,22,23]. The selection on Rht-B1a and -D1a alleles in combination with other reduced height loci, such as Rht24, could be performed to fine-tune the plant height since the taller male lines are required to promote smooth pollen flow to the female lines, as suggested in Würschum et al., [24]. Nevertheless, a highly heritable nature of AE suggests that large-effect QTL exist, but remain undetected possibly due to (1) low frequency of AE alleles in the investigated populations and (2) the significant effect of the Rht-1a loci, which masks the existing AE QTL.
In this study, we performed an elite-by-elite spring wheat cross and examined 300 F2 plants and F2:3 families for their capacity to extrude anthers. The objectives were (1) to evaluate the distribution and inheritance of AE in F2 and F2:3 populations and (2) to map the QTL underlying AE for use in MAS.
2. Materials and Methods
2.1. Populations, Field Trials, and Phenotypic Data Analyses
We developed an F2 population that comprised 300 wheat plants by crossing two parents: KA/NAC//TRCH/4/MILAN/KAUZ//DHARWAR DRY/3/BAV92 (parent A) and GK ARON/AG SECO 7846//2180/4/2*MILAN/KAUZ//PRINIA/3/BAV92 (parent B). Parent A (female) and B (male) have among the highest general combining ability in the CIMMYT hybrid wheat program. Several years of assessment have demonstrated that parent A exhibits intermediate AE, with a visual score of 5, and parent B exhibits good AE, with a score of 6. The AE in the derived F1 population was observed to be better than both parents, with a visual score of 7.
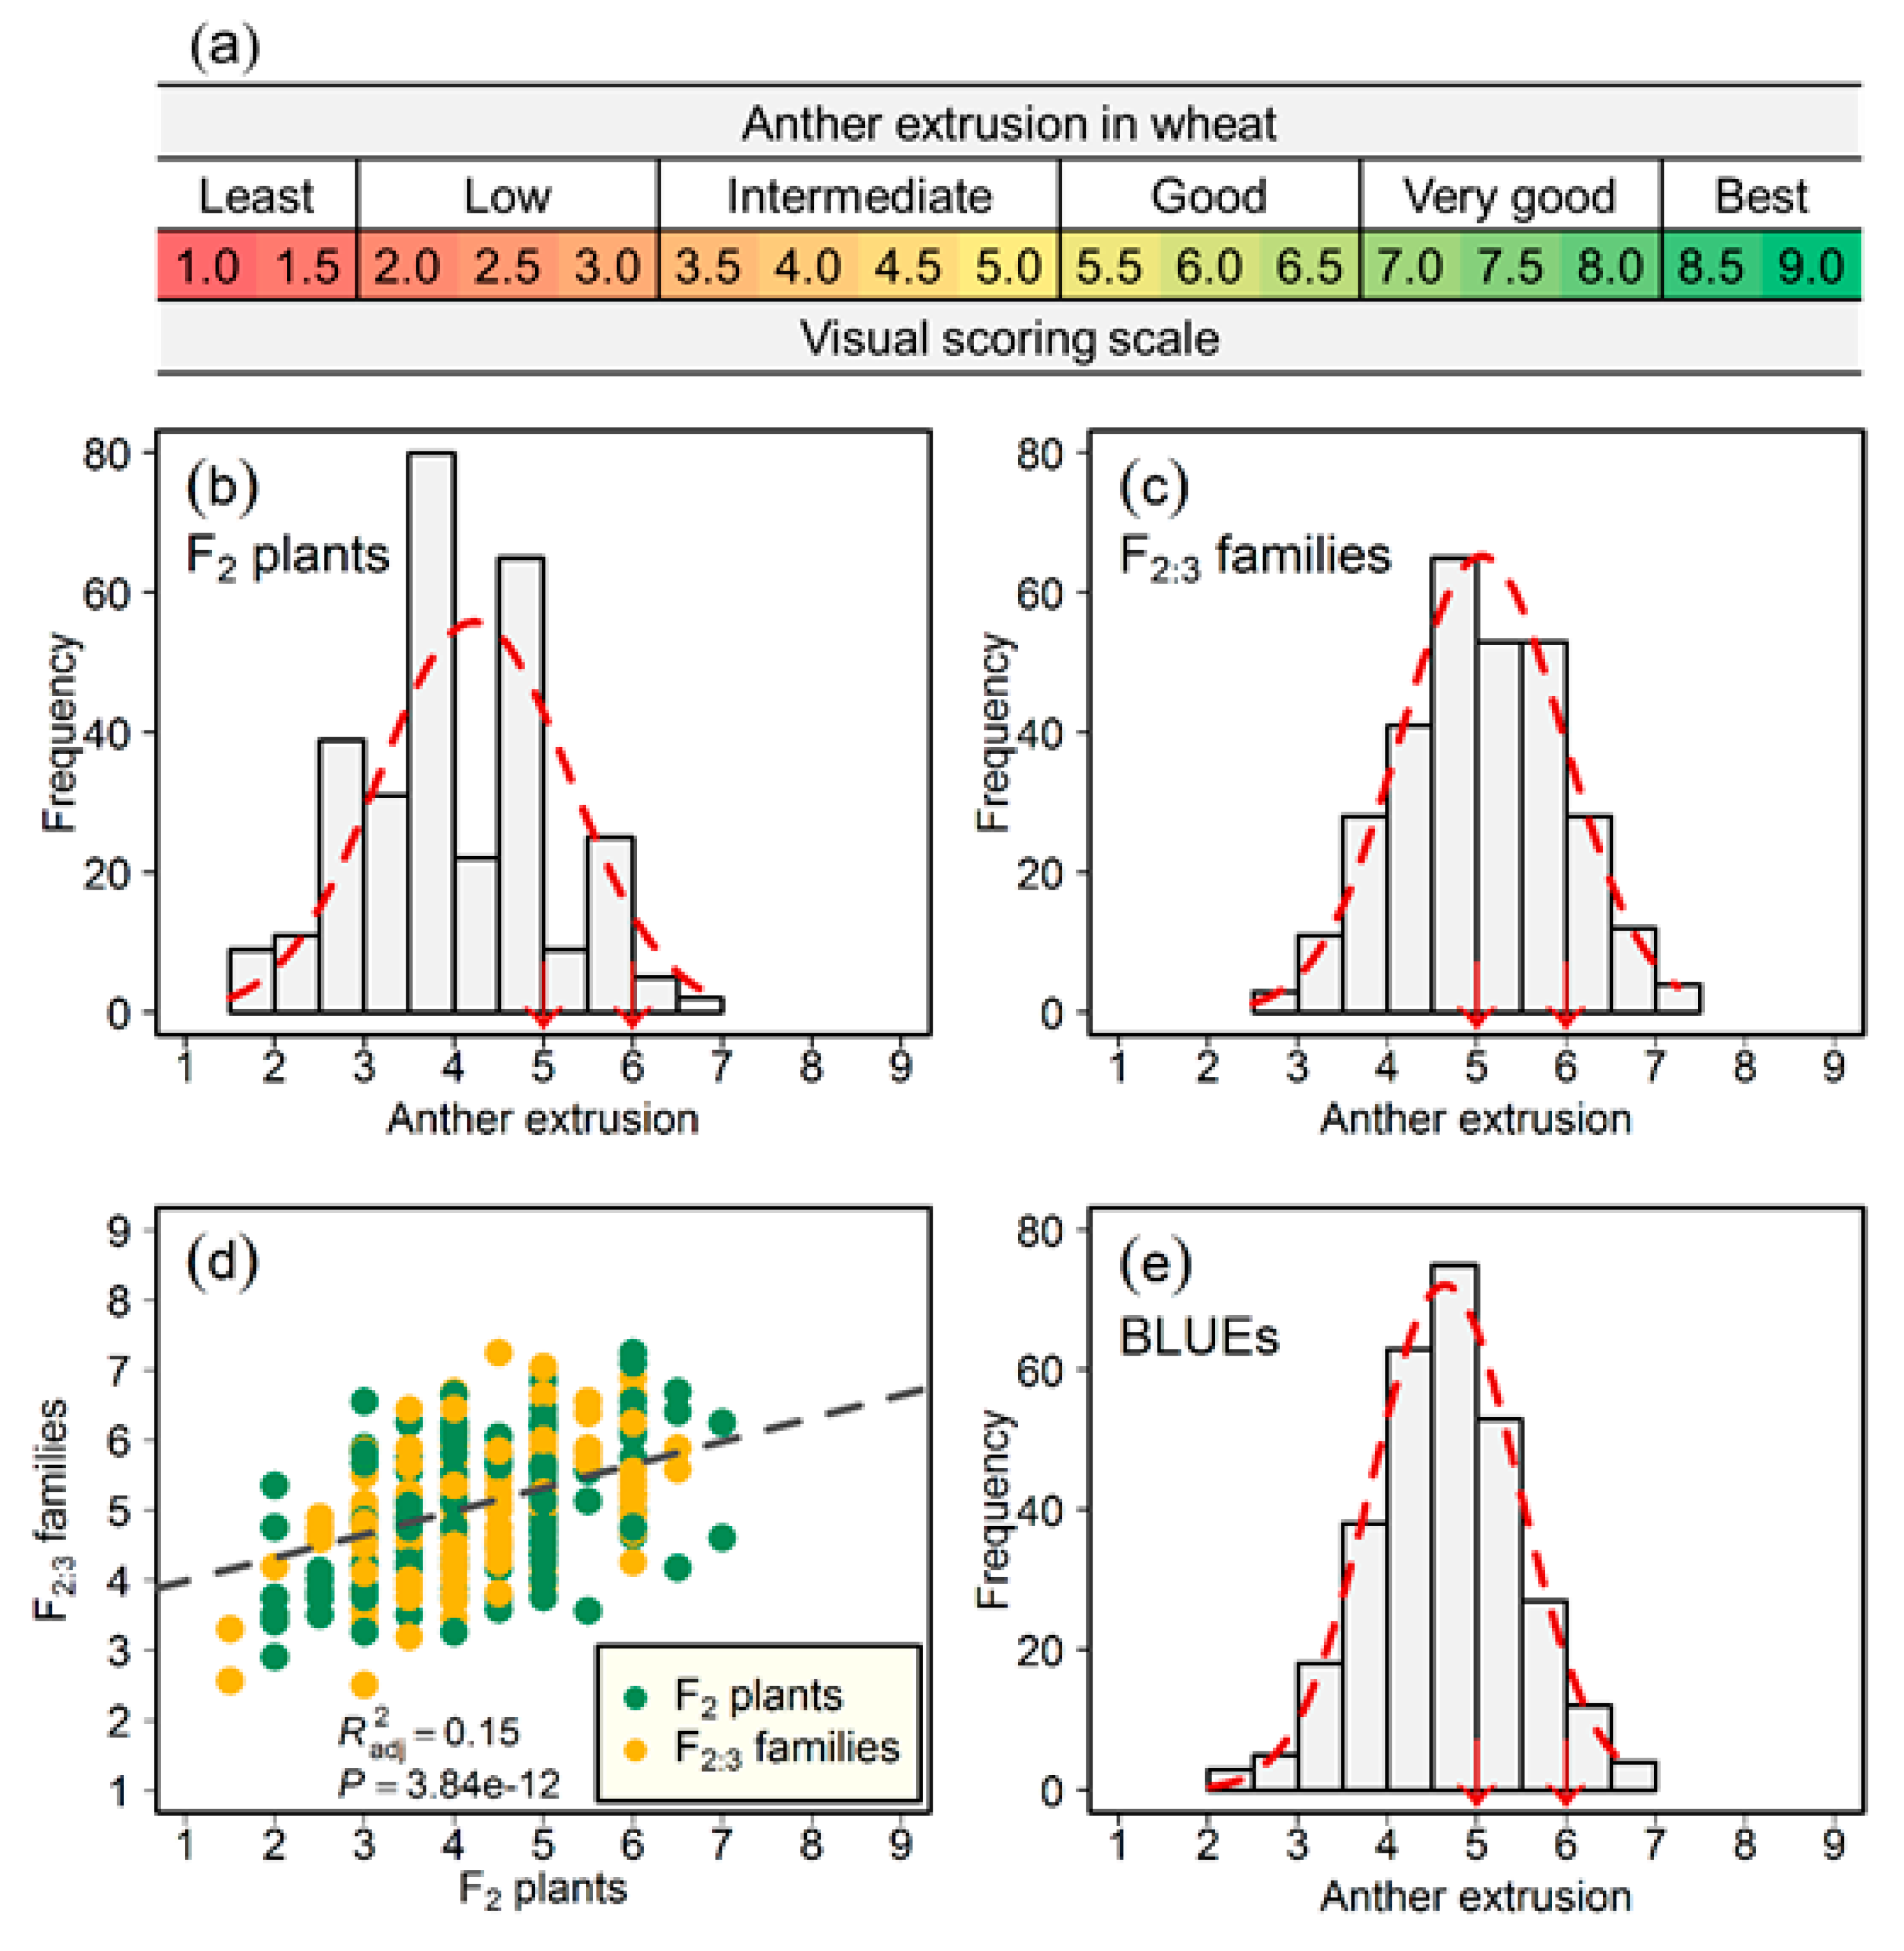
In total, we planted 300 F2 plants, 20 cm apart in a long raised bed of 60 m. We grew the F2 population during the 2015/2016 winter cropping season (November through April), at the Norman E. Borlaug experimental station (CENEB), Ciudad Obregon, Sonora, Mexico, and then evaluated for AE. Anther extrusion was visually scored with a score from one (least; no or a few anthers extruded) to nine (best; all anthers extruded). Figure 1a gives a full scale to visually score AE in the field. This is a fast and effective method: visual scoring is positively correlated with the empirical anther count in wheat florets [25].
The visual estimations represent the AE scores across all the spikes when about 50% of the spikes showed extruded anthers. In the F2 population, we performed single scoring within two to five days after the onset of anthesis. We observed AE from 9 am to 11 am by walking in one direction and avoiding the direct sunlight. It has been observed that the extruded anthers remain intact for about one week in the absence of rain and, therefore, the scoring can be performed within a range of days after anthesis.
We advanced the F2 population to F2:3 families by harvesting two random spikes per plant. We grew the F2:3 families in 1 m long double-row plots and evaluated them for AE during the following summer cropping season (May to September) at CIMMYT’s headquarters in El Batan, State of Mexico, Mexico. The F2:3 families were grown in two blocks as one spike per entry per block. Both of the blocks were sown in the same field, but about 50 m apart, and, thus, represent two replicates of the experiment. We sowed seeds in each block four days apart due to logistical and regulatory reasons. We evaluated the first block two to three times within seven days after the onset of anthesis in order to capture the temporal variation in AE. We performed AE scoring only once from the second block because the AE scores were similar across multiple evaluations in the first block.
We took the mean AE in order to calculate the correlation with the second block since we evaluated AE multiple times in the first block. The following linear mixed-effect model was used to analyze F2:3 families:
where, yij is the AE score of the ith genotype in the jth block, μ is the common intercept, Gi is the effect of the ith genotype, Bj is the effect of the jth block, and eij is the corresponding error term. All of the effects except μ were assumed to be random in the model to compute the variance components and to calculate the repeatability between the blocks of F2:3 families as:
where, and denote the variance components of the genotype and error, respectively, and nB denotes the number of blocks. All effects except the intercept and the genotype were assumed to be random in the above model (1) to calculate the best linear unbiased estimations (BLUEs) across blocks for the F2:3 population.
We calculated the heritability of AE between F2 plants and the BLUEs of F2:3 families while using the following model:
where, yij is the AE score of the ith genotype in the jth environment (i.e., F2 and BLUEs of F2:3), μ is the common intercept term, Gi is the effect of the ith genotype, Ej is the effect of the jth environment, and eij denotes the corresponding error term. All effects, except the intercept, were assumed to be random to estimate the variance components to calculate heritability across generations as:
where, and , denote the variance components of the genotype and error, respectively, and nE denotes the number of generations. We performed all calculations while using the R software package lme4 [26,27].
2.2. Genotypic Data Analysis, Linkage Map Construction, and QTL Mapping
We genotyped the F2:3 families and both parents with the wheat Illumina 20 k Infinium single nucleotide polymorphism (SNP) array that was developed at the TraitGenetics (available online: http://www.traitgenetics.com/en/). We extracted the DNA from the leaf tissues at the seedling stage from ten random plants per F2:3 family that were subsequently pooled for SNP genotyping. The SNP scores from the pooled DNA of each F2:3 families were assumed to represent the original F2 plant genotype. We performed a quality check by removing the SNPs that harbored more than 20% missing values and the individuals with missing genotypic information. We also implemented a χ2 (p < 0.001) test to remove the SNPs that deviated from the expected Mendelian segregation pattern (1:2:1).
We generated a genetic linkage map by selecting the markers from each chromosome according to consensus maps [28,29] while using the Kosambi mapping function [30], with the logarithm of the odds (LOD) values ranging from 3.0 to 8.0. Only the markers which passed the quality criteria and the χ2 test were used to create the linkage map in Joinmap v 4.0 [31].
We performed composite interval mapping (CIM) to detect QTL underlying AE, with both backward and forward regression at a walking speed of 2-centimorgan (cM) on F2 and F2:3 populations and their best linear unbiased estimations (BLUEs), while using Windows QTL Cartographer 2.5 [32]. We empirically estimated the LOD threshold values to declare the presence of QTL by performing 1000 independent random rounds of permutations at α = 0.05 [33]. The proportion of phenotypic variation that was explained by a QTL at a test site was determined as the square of the partial correlation coefficient (R2).
The QTL were named based on the recommended rules for gene symbolization in wheat (available online: https://wheat.pw.usda.gov/ggpages/wgc/98/Intro.htm), and the QTL identified in both generations and their BLUEs were defined as consistent. We established the connection of the markers that were present in the consistent QTL genetic interval by anchoring the markers onto the physical map of the corresponding chromosome of the wheat reference sequence RefSeq v 1.0 [34] via BLAST [35]. The high-confidence genes and their descriptions were retrieved to study the underlying genes and their functions.
3. Results
3.1. Phenotypic Data Analyses Show that AE in Wheat Can be Reliably Evaluated Across F2 Plants and F2:3 Families
Phenotypic data gathered from 300 F2 plants and F2:3 families segregating for AE approximated a normal distribution (Figure 1). The Pearson’s product-moment correlation of AE between two blocks of 300 F2:3 families amounted to 0.42 (p < 0.001), with a repeatability of 0.59 across the blocks (Table 1). We also observed a positive and significant Pearson’s correlation (r = 0.39; p < 0.001) between the phenotypic data of F2 plants and the BLUEs of the F2:3 families (Figure 1). The heritability of AE across generations amounted to 0.55 (Table 1). The distribution of BLUEs calculated across F2 and F2:3 generations mirrored the populations at individual generation stage (Figure 1). Significant genotypic variance coupled with a reasonably high heritable performance suggests that AE could elicit a high selection response in breeding programs, although AE’s phenotypic distribution at every stage indicates a quantitative genetic nature. Moreover, the broad-sense heritability value across generations hints at the presence of large-effect QTL.
3.2. Linkage Map Construction Points to the Similar Breeding History of Parent A and Parent B
The 20 k Infinium SNP array generated 17,267 SNP markers in total. Two of the 300 lines were not genotyped due to the limited slots on the SNP arrays, and therefore, phenotypic and SNP data for 298 lines were used for further analyses. Removing the SNPs harboring > 20% of missing values resulted in 2850 SNPs; of which 705 passed the χ2 test of segregation distortion at p < 0.001. Of the 705 SNPs, we could assign 623 SNPs to 21 linkage groups during linkage map construction. The lowest number of SNPs were mapped on the D-genome (84), followed by A-(253) and B-genome (286). Although we genotyped a reasonably large population, a low number of polymorphic SNPs that were mapped on three sub-genomes suggest that both of the parents are genetically related. In the final SNP matrix, 25.8% and 26.5% of the alleles were homozygous for parent A and parent B, respectively; a total of 41.9% of the alleles were at heterozygous (H) state, while 5.9% of the alleles were missing values in the investigated population.
3.3. QTL Mapping of AE Identifies a Large-Effect QTL
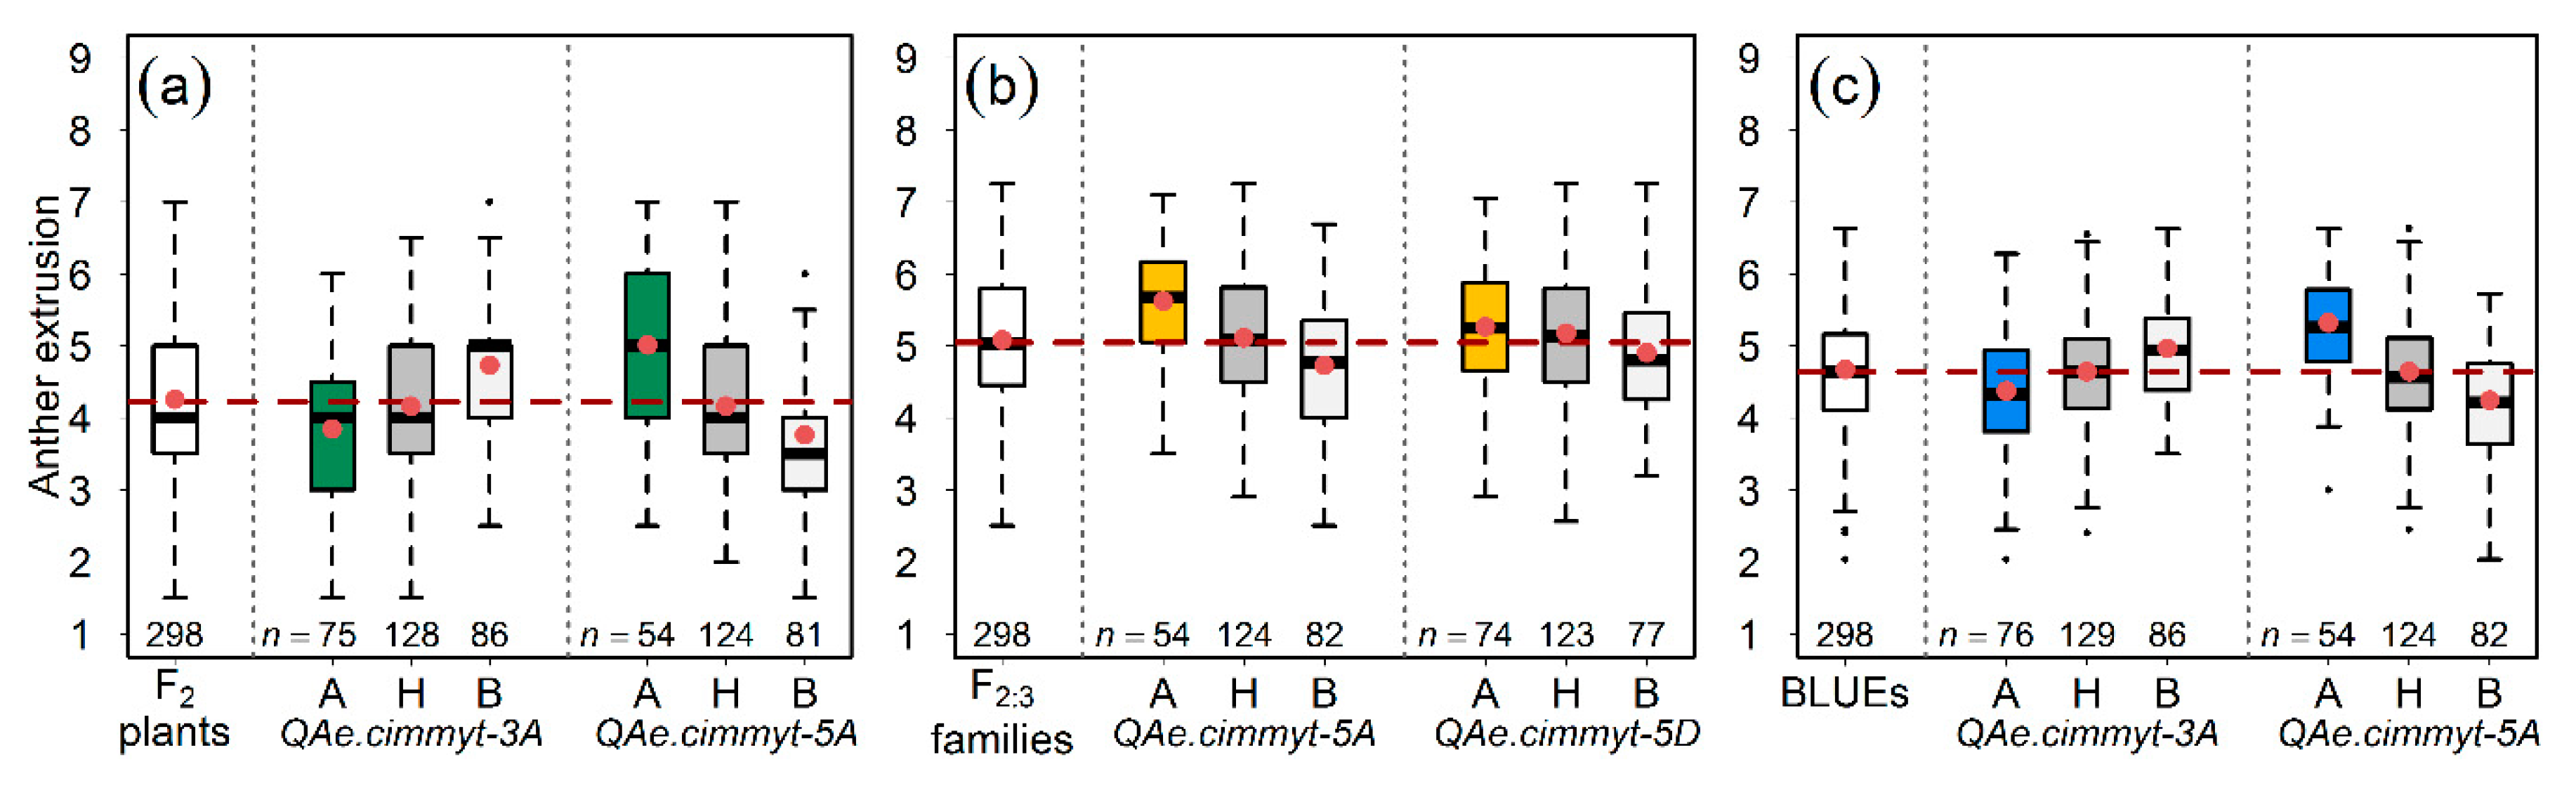
We performed composite interval mapping of AE on population at F2 and F2:3 generations and the resulting BLUEs. While using an empirically estimated LOD threshold with 1000 rounds of permutations (i.e., LOD in F2 = 3.7, F2:3 = 3.7, and BLUEs = 3.9), we detected AE QTL on chromosomes 3A, 5A, and 5D, which were designated as QAe.cimmyt-3A, QAe.cimmyt-5A, and QAe.cimmyt-5D, respectively (Figure 2). The QAe.cimmyt-3A and QAe.cimmyt-5D were environment (population) specific, whereas QAe.cimmyt-5A was consistently identified in both F2 and F2:3 populations and their corresponding BLUEs, explaining an average of about 20% of the phenotypic variance for the trait AE (Figure 2 and Table 2).
The results of our linkage mapping exercise found that QAe.cimmyt-5A spanned over a large genetic interval of about 25 cM (37.17–62.21 cM) and harbored 32 polymorphic markers (Figure 3). We conducted an analysis of the marker sequences that were retrieved from published sources [28,29] via BLAST (Megablast method) to identify the genes on chromosome 5A of the wheat reference sequence RefSeq v 1.0 [34,35]. Of the 32 polymorphic markers that were harbored by the QAe.cimmyt-5A genetic interval, we were able to anchor 15 markers to high-confidence genes (Table S1). This strategy allows for the identification of high-confidence genes and their corresponding functions. However, any prediction of the genes and their function controlling the AE phenotype would be impractical, since the genetic interval and its corresponding physical interval (around 500-Mb) harbors 2838 genes–too many for analysis. Nevertheless, the results warrant extending the present analysis to narrow down the genetic interval and to Mendelize the QAe.cimmyt-5A.
4. Discussion
4.1. Anther Extrusion Exhibits Quantitative Variation and Possesses a Strong Genetic Control
Breeding is a continuous process where the inheritance of a trait from one generation to another determines the rate of its selection. Efficient hybrid wheat breeding depends on an excellent seed set on male-sterilized female lines. The extent of anther extrusion (AE) from the male plants governs the rate of cross-pollination and the seed set on female lines. In this study, we evaluated AE in an F2 population that comprised of 300 plants and F2:3 families to observe how AE is inherited in breeding populations and mapped the quantitative trait loci (QTL) via linkage mapping.
In our study, the AE phenotypic data at both generations exhibited a wide variation and approximated a normal distribution, which suggested the complex genetic nature of AE. We also observed the stable and reasonably high genetic control (heritability) of AE. All recent studies on bi-parental as well as diverse mapping populations suggest that AE is a quantitative trait and it exhibits significant genetic variance [16,17,18,20,21,22,25,36,37]. These findings suggest two conclusions regarding the selection for increased AE to improve hybrid wheat seed production. On the one hand, we find that it is valuable to phenotypically select for AE due to the wide genotypic variation and consistent heritability values that facilitate its high selection response. On the other hand, detection and introgression of a large-effect stable AE QTL would efficiently complement the phenotypic selection to make MAS more cost-effective and increase hybrid wheat’s genetic gain over time because meaningful results from MAS depend on the presence of large-effect stable QTL that are introgressed into varieties with similar genetic backgrounds.
4.2. Construction of a Linkage Map Suggests that Mapping Population Parents are Genetically Related
Successful linkage mapping of traits depends on the genetic variance for the trait and genetic polymorphism that are available in the investigated population [38]. In this study, we genotyped F2:3 families plus parents with 20 k single nucleotide polymorphism (SNP) array. In total, 623 SNPs were assigned to the 21 linkage groups. We observed a low number of polymorphic markers covering the whole genome although we genotyped a reasonably large population (298 lines) with a fairly dense SNP array. This indicates that either (1) the parents lack polymorphism at the genetic level due to a likely similar breeding history or (2) the density of marker loci to cover the polymorphic sites across the genome is very low. Here, it is essential to note that breeding programs usually involve elite-by-elite crosses, and the pedigree of parents may share common ancestors. Moreover, varieties are usually simultaneously bred for an index of traits, which necessitates a degree of genetic relatedness to avoid drastic yield drag. In our study, the pedigrees of parents A and B shared common ancestors (MILAN, KAUZ, and BAVIACORA M92), which is a possible reason for the lack of high genetic polymorphism.
4.3. Genetic Mapping of Anther Extrusion Reveals QAe.Cimmyt-5A as a Large-Effect QTL
Cost-effective genetic gain over time can be enhanced by complementing phenotypic selection with MAS [19,39]. While recent research highlights the importance of AE as an essential trait for hybrid wheat seed production, it has also been suggested as an escape mechanism from a devastating wheat disease “Fusarium head blight” [15,17,18,20]. We identified two QTL in the population of F2 plants (i.e., QAe.cimmyt-3A and QAe.cimmyt-5A), two in the population of F2:3 families (QAe.cimmyt-5A and QAe.cimmyt-5D), and two based on the combined analysis of the F2 and F2:3 populations in our analysis (BLUEs; QAe.cimmyt-3A and QAe.cimmyt-5A). We found that AE is a heritable trait, as analogous to previous reports; however, not all of its phenotypic variance could be explained by the identified QTL [16,17,18,20]. The unexplained phenotypic variance may be attributed to the quantitative genetic nature of AE and the low number of polymorphic loci that were used in mapping due to which some QTL might have been missed.
As previously mentioned, linkage mapping depends on the genetic background of the population and the environment in which it is evaluated for a particular trait. It is generally not easy to compare different populations due to diverse genetic backgrounds and differing marker systems. Nevertheless, we compared the QTL from our analysis with other bi-parental populations. The QTL detected in our study are novel—with a possible exception of QAe.cimmyt-5A (37.17–62.21 cM), which was identified in a winter wheat population of the recombinant inbred lines by Buerstmayr and Buerstmayr [18], but in a slightly different genetic interval. Likewise, Muqaddasi et al., [25] identified a consistent QTL on chromosome 5A at 37.92 cM across three years in a diverse mapping population that comprised of gene bank spring wheat accessions. Recently, Okada et al., [23] showed that Rht-B1 and photoperiod sensitivity (Ppd-D1) genes influence traits that help in wheat’s cross-pollination. It appears that the genes regulating photoperiod sensitivity on group 2 chromosomes in wheat (i.e., Ppd-A1, -B1, and -D1) do not influence AE in our population since QAe.cimmyt-5A is present on chromosome 5A. Nonetheless, vernalization (Vrn) genes can also influence flowering; therefore, Vrn-A1 (Uniprot-ID AY747599; Gene-ID TraesCS5A01G391700) located on the long arm of chromosome 5A was investigated as a possible gene that influences AE. However, it lies about 55-Mb (587,423,240-bp-587,411,825-bp) from the distal end (533,071,664-bp) of the QTL (Table S1), which suggests that Vrn-A1 may not be the gene controlling AE in the investigated population. As described elsewhere, AE is not only essential for creating excellent males with high pollen supply, but it is also positively correlated with other traits, such as Fusarium head blight resistance [15,17,18]. In light of the quantitative genetic nature of AE, the effect of QTL that was identified in this study suggests that efficient MAS can be performed. Currently, CIMMYT is validating the QAe.cimmyt-5A in a set of parents for its hybrid wheat program by using Kompetitive Allele Specific PCR (KASP) markers.
The quantitative genetic nature of AE makes it a perfect candidate for genomic selection (GS)—a selection procedure in which the total genetic value of a trait is predicted based on dense marker genotypes, irrespective of their effect sizes [40]. However, GS is often not often applicable—especially in smaller breeding programs—because it requires (1) funding for routine whole-genome genotyping of new lines and (2) functional pipelines for genotyping, genomic prediction analysis, and selection at early stages of a breeding cycle. Pyramiding the large-effect QTL for MAS could be an efficient alternative to GS since it is relatively easy and cheap to visually phenotype AE.
5. Conclusions
The success of wheat hybrids is mainly hindered by the high cost due to the low seed set on the male-sterilized female lines. Anther extrusion in male lines improves pollen load to maximize cross-pollination and increases seed set on the female lines. Therefore, improving AE is of immediate relevance to hybrid wheat breeding. In this study, we observed that F2 and F2:3 populations hold significant and continuous genetic variance for AE, which suggests its reliable phenotypic selection. Moreover, our analysis detected a large-effect AE QTL on chromosome 5A across generations. Our study shows that (1) AE possesses strong genetic control across generations and (2) the consistent QTL (QAe.cimmyt-5A) can be used for MAS in breeding programs and it is a candidate for future Mendelization.
Supplementary Materials
The following are available online at https://0-www-mdpi-com.brum.beds.ac.uk/2073-4395/9/7/407/s1, Table S1: Anchoring the markers in QAe.cimmyt-5A genetic interval onto the corresponding physical sequence of chromosome 5A.
Author Contributions
Analyzed the data, interpreted the results, and wrote the manuscript, Q.H.M.; conceived, designed, and performed the experiments, S.D. and B.R.B.; participated in the interpretation of results, J.C.R., M.S.R., B.R.B., and S.D.
Funding
This research was funded by Bundesministerium für wirtschaftliche Zusammenarbeit (BMZ), Small Grant Project, grant number 12.1433.7-001.00.
Conflicts of Interest
The authors declare no conflict of interest.
References
- Uphof, J.C.T. Cleistogamic flowers. Bot. Rev. 1938, 4, 21–49. [Google Scholar] [CrossRef]
- Pickett, A.A. Hybrid wheat—Results and problems. In Fortschritte der Pflanzenzüchtung; Paul Parey Scientific Publishers: Berlin, Germany, 1993; Volume 15. [Google Scholar]
- Pickett, A.A.; Galwey, N.W. A further evaluation of hybrid wheat. Plant Var. Seeds 1997, 10, 15–32. [Google Scholar]
- Longin, C.F.H.; Mühleisen, J.; Maurer, H.P.; Zhang, H.L.; Gowda, M.; Reif, J.C. Hybrid breeding in autogamous cereals. Theor. Appl. Genet. 2012, 125, 1087–1096. [Google Scholar] [CrossRef] [PubMed]
- Jordaan, J. Hybrid wheat: Advances and challenges. In Increasing Yield Potential in Wheat: Breaking the Barriers; CIMMYT: Edo Mex, Mexico, 1996; Volume 66, pp. 66–67. [Google Scholar]
- Barbosa-Neto, J.F.; Sorrells, M.E.; Cisar, G. Prediction of heterosis in wheat using coefficient of parentage and RFLP-based estimates of genetic relationship. Genome 1996, 39, 1142–1149. [Google Scholar] [CrossRef] [PubMed]
- Bruns, R.; Peterson, C.J. Yield and stability factors associated with hybrid wheat. Euphytica 1998, 100, 1–5. [Google Scholar] [CrossRef]
- Dreisigacker, S.; Melchinger, A.; Zhang, P.; Ammar, K.; Flachenecker, C.; Hoisington, D.; Warburton, M. Hybrid performance and heterosis in spring bread wheat, and their relations to SSR-based genetic distances and coefficients of parentage. Euphytica 2005, 144, 51–59. [Google Scholar] [CrossRef]
- Mühleisen, J.; Piepho, H.P.; Maurer, H.P.; Longin, C.F.H.; Reif, J.C. Yield stability of hybrids versus lines in wheat, barley, and triticale. Theor. Appl. Genet. 2014, 127, 309–316. [Google Scholar] [CrossRef]
- Jiang, Y.; Schmidt, R.H.; Zhao, Y.; Reif, J.C. A quantitative genetic framework highlights the role of epistatic effects for grain-yield heterosis in bread wheat. Nat. Genet. 2017, 49, 1741. [Google Scholar] [CrossRef]
- Melchinger, A.E.; Gumber, R.K. Overview of Heterosis and Heterotic Groups in Agronomic Crops. In Concepts and Breeding of Heterosis in Crop Plants; Crop Science Society of America: Madison, WI, USA, 1998; pp. 29–44. [Google Scholar] [CrossRef]
- Zhao, Y.; Li, Z.; Liu, G.; Jiang, Y.; Maurer, H.P.; Würschum, T.; Mock, H.-P.; Matros, A.; Ebmeyer, E.; Schachschneider, R.; et al. Genome-based establishment of a high-yielding heterotic pattern for hybrid wheat breeding. Proc. Natl. Acad. Sci. USA 2015, 112, 15624–15629. [Google Scholar] [Green Version]
- De Vries, A.P. Flowering biology of wheat, particularly in view of hybrid seed production—A review. Euphytica 1971, 20, 152–170. [Google Scholar] [CrossRef]
- De Vries, A.P. Some aspects of cross-pollination in wheat (Triticum aestivum L.) 2. Anther extrusion and ear and plant flowering pattern and duration. Euphytica 1973, 22, 445–456. [Google Scholar] [CrossRef]
- Graham, S.; Browne, R.A. Anther extrusion and Fusarium head blight resistance in European wheat. J. Phytopathol. 2009, 157, 580–582. [Google Scholar] [CrossRef]
- Skinnes, H.; Semagn, K.; Tarkegne, Y.; Maroy, A.G.; Bjørnstad, Å. The inheritance of anther extrusion in hexaploid wheat and its relationship to Fusarium head blight resistance and deoxynivalenol content. Plant Breed. 2010, 129, 149–155. [Google Scholar] [CrossRef]
- Lu, Q.X.; Lillemo, M.; Skinnes, H.; He, X.Y.; Shi, J.R.; Ji, F.; Dong, Y.H.; Bjørnstad, Å. Anther extrusion and plant height are associated with Type I resistance to Fusarium head blight in bread wheat line ‘Shanghai-3/Catbird’. Theor. Appl. Genet. 2013, 126, 317–334. [Google Scholar] [CrossRef] [PubMed]
- Buerstmayr, M.; Buerstmayr, H. Comparative mapping of quantitative trait loci for Fusarium head blight resistance and anther retention in the winter wheat population Capo × Arina. Theor. Appl. Genet. 2015, 128, 1519–1530. [Google Scholar] [CrossRef] [PubMed]
- Bernardo, R. Breeding for Quantitative Traits in Plants, 2nd ed.; Stemma Press: Woodbury, Minnesota, 2010. [Google Scholar]
- He, X.; Singh, P.K.; Dreisigacker, S.; Singh, S.; Lillemo, M.; Duveiller, E. Dwarfing genes Rht-B1b and Rht-D1b are associated with both Type I FHB susceptibility and low anther extrusion in two bread wheat populations. PLoS ONE 2016, 11, e0162499. [Google Scholar] [CrossRef] [PubMed]
- Boeven, P.H.; Longin, C.F.H.; Leiser, W.L.; Kollers, S.; Ebmeyer, E.; Würschum, T. Genetic architecture of male floral traits required for hybrid wheat breeding. Theor. Appl. Genet. 2016, 129, 2343–2357. [Google Scholar] [CrossRef] [PubMed]
- Muqaddasi, Q.H.; Pillen, K.; Plieske, J.; Ganal, M.W.; Röder, M.S. Genetic and physical mapping of anther extrusion in elite European winter wheat. PLoS ONE 2017, 12, e0187744. [Google Scholar] [CrossRef] [PubMed]
- Okada, T.; Jayasinghe, J.E.A.R.M.; Eckermann, P.; Watson-Haigh, N.S.; Warner, P.; Hendrikse, Y.; Baes, M.; Tucker, E.J.; Laga, H.; Kato, K.; et al. Effects of Rht-B1 and Ppd-D1 loci on pollinator traits in wheat. Theor. Appl. Genet. 2019, 132, 1965–1979. [Google Scholar] [CrossRef] [PubMed]
- Würschum, T.; Liu, G.; Boeven, P.H.; Longin, C.F.H.; Mirdita, V.; Kazman, E.; Zhao, Y.; Reif, J.C. Exploiting the Rht portfolio for hybrid wheat breeding. Theor. Appl. Genet. 2018, 131, 1433–1442. [Google Scholar] [CrossRef] [PubMed]
- Muqaddasi, Q.H.; Lohwasser, U.; Nagel, M.; Börner, A.; Pillen, K.; Röder, M.S. Genome-wide association mapping of anther extrusion in hexaploid spring wheat. PLoS ONE 2016, 11, e0155494. [Google Scholar] [CrossRef] [PubMed]
- R Core Team. R: A Language and Environment for Statistical Computing; R Foundation for Statistical Computing: Vienna, Austria, 2015. [Google Scholar]
- Bates, D.; Machler, M.; Bolker, B.M.; Walker, S.C. Fitting Linear Mixed-Effects Models Using lme4. J. Stat. Softw. 2015, 67, 1–48. [Google Scholar] [CrossRef]
- Wang, S.C.; Wong, D.B.; Forrest, K.; Allen, A.; Chao, S.M.; Huang, B.E.; Maccaferri, M.; Salvi, S.; Milner, S.G.; Cattivelli, L.; et al. Characterization of polyploid wheat genomic diversity using a high-density 90 000 single nucleotide polymorphism array. Plant Biotechnol. J. 2014, 12, 787–796. [Google Scholar] [CrossRef] [PubMed]
- Allen, A.M.; Winfield, M.O.; Burridge, A.J.; Downie, R.C.; Benbow, H.R.; Barker, G.L.; Wilkinson, P.A.; Coghill, J.; Waterfall, C.; Davassi, A.; et al. Characterization of a Wheat Breeders’ Array suitable for high-throughput SNP genotyping of global accessions of hexaploid bread wheat (Triticum aestivum). Plant Biotechnol. J. 2017, 15, 390–401. [Google Scholar] [CrossRef] [PubMed]
- Kosambi, D.D. The estimation of map distances from recombination values. Ann. Eugen. 1943, 12, 172–175. [Google Scholar] [CrossRef]
- Van Ooijen, J. JoinMap® 4, Software for the calculation of genetic linkage maps in experimental populations; Kyazma BV: Wageningen, The Netherlands, 2006; Volume 33. [Google Scholar]
- Wang, S.; Basten, C.J.; Zeng, Z.-B. Windows QTL Cartographer 2.5; Department of Statistics, North Carolina State University: Raleigh, NC, USA, 2012. [Google Scholar]
- Churchill, G.A.; Doerge, R.W. Empirical threshold values for quantitative trait mapping. Genetics 1994, 138, 963–971. [Google Scholar] [PubMed]
- Consortium, I.W.G.S. Shifting the limits in wheat research and breeding using a fully annotated reference genome. Science 2018, 361, eaar7191. [Google Scholar]
- Altschul, S.F.; Gish, W.; Miller, W.; Myers, E.W.; Lipman, D.J. Basic local alignment search tool. J. Mol. Biol. 1990, 215, 403–410. [Google Scholar] [CrossRef]
- Muqaddasi, Q.H.; Brassac, J.; Börner, A.; Pillen, K.; Röder, M.S. Genetic architecture of anther extrusion in spring and winter wheat. Front. Plant Sci. 2017, 8, 754. [Google Scholar] [CrossRef] [PubMed]
- Muqaddasi, Q.H.; Reif, J.C.; Li, Z.; Basnet, B.R.; Dreisigacker, S.; Röder, M.S. Genome-wide association mapping and genome-wide prediction of anther extrusion in CIMMYT spring wheat. Euphytica 2017, 213, 73. [Google Scholar] [CrossRef]
- Mackay, T.F. The genetic architecture of quantitative traits. Ann. Rev. Genet. 2001, 35, 303–339. [Google Scholar] [CrossRef] [PubMed]
- Anderson, J.A.; Chao, S.; Liu, S. Molecular breeding using a major QTL for Fusarium head blight resistance in wheat. Crop Sci. 2007, 47, S112–S119. [Google Scholar] [CrossRef]
- Meuwissen, T.H.E.; Hayes, B.J.; Goddard, M.E. Prediction of total genetic value using genome-wide dense marker maps. Genetics 2001, 157, 1819–1829. [Google Scholar] [PubMed]
Figure 1.
Phenotypic distribution of anther extrusion (AE). (a) Scale to visually score anther extrusion in wheat; (b) Distribution of AE in the population of 300 F2 plants; (c) Distribution of best linear unbiased estimations (BLUEs) of AE calculated in the population of 300 F2:3 families; (d) Association of AE evaluated in F2 plants with BLUEs of F2:3 families; and, (e) Distribution of AE’s BLUEs calculated across F2 and F2:3 generations. The down arrows mark the performance of the parents. and P denote the adjusted coefficient of determination and its significance value, respectively.

Figure 2.
Allele-wise distribution of the most significant markers linked to the quantitative trait loci (QTL) for anther extrusion (AE). The QTL detected in (a) the population of F2 plants, (b) the population of F2:3 families, and, (c) best linear unbiased estimations (BLUEs) of F2 and F2:3 populations. A, B, and H represent the homozygous alleles from parent A, parent B, and heterozygous state, respectively. The dashed horizontal line marks the mean value of AE in the respective population. The red dots within the boxplots and n represent the mean of lines harboring respective alleles and the number of plants or families, respectively.

Figure 3.
Linkage map of chromosome 5A harboring large-effect QTL (QAe.cimmyt-5A) for anther extrusion identified in F2 and F2:3 generations, and their best linear unbiased estimations (BLUEs). The color code of the identified QTL in different generations is given in the figure. The α-value denotes the logarithm of the odds (LOD) threshold to declare the presence of QTL.


Table 1.
Phenotypic performance of anther extrusion in F2 plants, F2:3 families, and their corresponding best linear unbiased estimations (BLUEs).
Table 1.
Phenotypic performance of anther extrusion in F2 plants, F2:3 families, and their corresponding best linear unbiased estimations (BLUEs).
| Population | Mean ± SD | Range | H2 |
|---|---|---|---|
| F2 Plants | 4.23 ± 1.06 | 1.50–7.00 | N/A |
| F2:3 Families | 5.04 ± 0.91 | 2.50–7.25 | 0.59 |
| BLUEs | 4.64 ± 0.83 | 2.03–6.63 | 0.55 |
SD = standard deviation; H2 (F2:3) = repeatability between the blocks; H2 (BLUEs) = broad-sense heritability across the F2 and F2:3 generations; N/A = not applicable.
Table 2.
Quantitative trait loci (QTL) for anther extrusion in F2 and F2:3 progenies, and their best linear unbiased estimations (BLUEs).
Table 2.
Quantitative trait loci (QTL) for anther extrusion in F2 and F2:3 progenies, and their best linear unbiased estimations (BLUEs).
| Population | Chr. | QTL | Pos. (cM) | Sig. SNP | Pos. (cM) | Genetic Interval | LOD Score | Add. Effect | Dom. Effect | R2 (%) |
|---|---|---|---|---|---|---|---|---|---|---|
| F2 Plants | 3A | QAe.cimmyt-3A | 74.90 | AX-94481094 | 72.91 | 68.21–98.73 | 7.09 | −0.396 | −0.281 | 3.76 |
| 3A | QAe.cimmyt-3A | 87.00 | Kukri_c1308_2782 | 78.95 | 68.21–98.73 | 7.63 | −0.520 | −0.065 | 10.84 | |
| 5A | QAe.cimmyt-5A | 43.90 | Ku_c69633_1873 | 43.93 | 37.17–62.21 | 7.77 | 0.460 | −0.417 | 16.21 | |
| 5A | QAe.cimmyt-5A | 52.00 | BS00109052_51 | 52.02 | 37.17–62.21 | 11.31 | 0.625 | −0.205 | 19.22 | |
| 5A | QAe.cimmyt-5A | 59.50 | Ex_c104539_35 | 59.50 | 37.17–62.21 | 9.72 | 0.565 | −0.164 | 15.90 | |
| F2:3 Families | 5A | QAe.cimmyt-5A | 54.00 | BS00109052_51 | 52.02 | 43.44–72.81 | 9.37 | 0.458 | −0.206 | 17.44 |
| 5A | QAe.cimmyt-5A | 59.30 | Ra_c700_2210 | 59.31 | 43.44–72.81 | 7.99 | 0.418 | −0.197 | 14.75 | |
| 5D | QAe.cimmyt-5D | 18.00 | BS00082423_51 | 0.00 | 0.00–36.89 | 4.51 | 0.391 | 0.153 | 7.32 | |
| BLUEs | 3A | QAe.cimmyt-3A | 93.00 | Kukri_c1308_2782 | 78.95 | 78.95–98.73 | 6.71 | −0.336 | 0.112 | 11.09 |
| 5A | QAe.cimmyt-5A | 45.70 | AX-94826558 | 45.68 | 37.17–62.21 | 13.53 | 0.444 | −0.226 | 22.98 | |
| 5A | QAe.cimmyt-5A | 52.00 | BS00109052_51 | 52.02 | 37.17–62.21 | 17.98 | 0.579 | −0.160 | 28.24 | |
| 5A | QAe.cimmyt-5A | 59.50 | Ex_c104539_35 | 59.50 | 37.17–62.21 | 14.53 | 0.507 | −0.133 | 22.61 |
Chr. = chromosome; QTL = name of the quantitative trait loci; Pos. = genetic (cM) position; Sig. SNP = the name of the closest, most significant single nucleotide polymorphism (SNP) linked to the QTL; Genetic interval = genetic (cM) interval of the QTL; LOD = logarithm of the odds; Add. = additive; Dom. = Dominant; R2 (%) = percentage of the phenotypic variance imparted by the corresponding QTL
© 2019 by the authors. Licensee MDPI, Basel, Switzerland. This article is an open access article distributed under the terms and conditions of the Creative Commons Attribution (CC BY) license (http://creativecommons.org/licenses/by/4.0/).
Share and Cite
MDPI and ACS Style
Muqaddasi, Q.H.; Reif, J.C.; Röder, M.S.; Basnet, B.R.; Dreisigacker, S. Genetic Mapping Reveals Large-Effect QTL for Anther Extrusion in CIMMYT Spring Wheat. Agronomy 2019, 9, 407. https://0-doi-org.brum.beds.ac.uk/10.3390/agronomy9070407
AMA Style
Muqaddasi QH, Reif JC, Röder MS, Basnet BR, Dreisigacker S. Genetic Mapping Reveals Large-Effect QTL for Anther Extrusion in CIMMYT Spring Wheat. Agronomy. 2019; 9(7):407. https://0-doi-org.brum.beds.ac.uk/10.3390/agronomy9070407
Chicago/Turabian StyleMuqaddasi, Quddoos H., Jochen C. Reif, Marion S. Röder, Bhoja R. Basnet, and Susanne Dreisigacker. 2019. "Genetic Mapping Reveals Large-Effect QTL for Anther Extrusion in CIMMYT Spring Wheat" Agronomy 9, no. 7: 407. https://0-doi-org.brum.beds.ac.uk/10.3390/agronomy9070407
Note that from the first issue of 2016, this journal uses article numbers instead of page numbers. See further details here.