Article

Influence of Different Photoperiod and Temperature Regimes on Growth and Bulb Quality of Garlic (Allium sativum L.) Cultivars

1
Department of Vegetable Science, College of Horticulture, Northwest A&F University, Yangling 712100, China
2
Vegetable Crops Program, National Agricultural Research Centre, Islamabad 44000, Pakistan
3
College of Natural Resource and Environment, Northwest A&F University, Yangling 712100, China
*
Author to whom correspondence should be addressed.
Submission received: 17 November 2019 / Revised: 9 December 2019 / Accepted: 10 December 2019 / Published: 11 December 2019

Abstract

:
Growth and bulb development in garlic is affected considerably by variations in photoperiod and temperature thereby influencing its morphology, physiology, and nutritive quality. Varied combinations of photoperiods and temperatures may influence the bulb development and quality, and can determine the suitability of a cultivar for a particular region. Experiments were conducted to study the impact of different photoperiod and temperature combinations on the growth, morpho-physiology, and nutritive quality of garlic bulb. Three garlic cultivars viz; G103, G024, and G2011-5 were exposed to different combinations of photoperiod (8 h/16 h, 10 h/14 h, 12 h/12 h, 14 h/10 h, 16 h/8 h (light/dark)) and temperature (20 °C/15 °C, 25 °C/18 °C, and 30 °C/20 °C). Results revealed that longer photoperiod (14 h or 16 h) and higher temperature (25 °C or 30 °C) treatments significantly improved the garlic bulbing imparting maximum bulb diameter, height, bulbing index, and the shortest growth period. Whereas, 12-h photoperiod had maximum bulb weight. In addition, total soluble solid (TSS), content of soluble protein, soluble sugar, total sugar, glucose, sucrose, fructose, starch, total phenols, and total flavonoids increased significantly because of 14-h photoperiod and 30 °C temperature condition, however exhibited decline with 8 h photoperiod and lowest temperature (20 °C). These alterations were related to bulb characteristics and bulbing index. Maximum plant standing height and pseudostem diameter of the garlic plant were observed at 20 °C. Additionally, plants under the combination of 14 h–30 °C had maximum fresh weight, bulb diameter, shortest growth period, maximum physiological and nutritive quality traits of the bulb, while as 12 h–30 °C combinations resulted in maximum bulb weight and 16 h–30 °C had maximum bulb height. Among cultivars cv. G103 showed best response to tested photoperiod and temperature combinations in terms of morpho-physiological and biochemical attributes studied, except for bulbing index which was maximum in cv. G024. Present study concludes the influence of photoperiod and temperature combinations on garlic growth and bulbing characteristics through the modulations induced in soluble protein, sugars, and phenolic compounds.

1. Introduction

Garlic (Allium sativum L.) is grown widely throughout the world and China is among the major producers of garlic bulb in the world [1]. The global production of garlic also indicates that garlic possesses genetic plasticity because of capricious environmental conditions throughout the world. The difference in the environmental conditions may contribute to the growth and developmental variations in garlic bulb and its quality. Among these environmental factors, photoperiod and temperature may be the key factors to regulate the garlic bulb development. Previous studies have reported that exposure to prolonged daylight and temperatures higher than 20 degrees improves garlic bulb production and quality [2]. In addition, vernalization accomplishment provided with prolonged daylight and high temperature may enhance garlic growth and development [3].
Photoperiod specifies the day length or incidence of light for plants grown at the total absence of natural light. Plants use photoreceptor proteins of phytochromes or cryptochromes to perceive length of light along with darkness or absence of light. Bulb beginning in alliaceous crops is highly inclined by day length [4,5]. Long photoperiod accelerates the flower stalks initial elongation and bulbing in garlic [6]. Changes in relative darkness or night length are influenced by geographical location, distance from equator, and period of the year which have been described to affect plant development and yield [7,8,9,10]. Higher temperatures impact bulbing with cultivars exhibiting differential responses [11].
Photoperiod and temperature combinations significantly stimulate the course of development. Garlic bulbing is affected by the day length and temperature to which the dormant cloves are subjected before the start of bulbing [12]. The competition for resources by the developing bulbs and inflorescence sinks regulates the fate of stalk elongation and bulb formation [13]. It has been suggested that impact of photoperiod and temperature on bulb growth should be considered in the background of the immediate but viable bulb growth [6]. Environmental restrictions may result because of the interaction between photoperiod and temperature, and the warm conditions of late spring accelerate bulbing response in short-day cultivars thereby imposing plants to develop smaller bulbs, however colder winter temperatures can induce bolting. The time spell from planting to inflorescence progressively curtails with increasing photoperiod or temperature [14]. The impact of external factors like photoperiod and temperature on plant evolution and growth has been described in numerous garlic genotypes [15]. Different combinations of long or short photoperiod with low or high growth temperatures produce changes in plant development. Nevertheless, long photoperiod and high temperatures induce bulb growth once bulbing has started. Influence of environmental effects on garlic bulb development has been studied and the internal physiological mechanisms causing alterations in productivity between cultivars under the same ecological conditions have been unidentified [16].
The quality of vegetables and bulbing induced by photoperiod and temperature, and far red light is important [17,18,19,20]. In plants, synthesis of phenolics and flavonoids is influenced by environmental factors [21]. Plant growth and development is not only regulated by light but also the biosynthesis of primary and secondary metabolites [22]. Phenolic biosynthesis is modulated by light, and flavonoid biosynthesis is categorically light dependent [23]. Bulbing at the end of crop cycle is a very vital stage in development where bulb becomes the greatest sink organ of photo assimilates which are altered to fructooligosaccharides and high-molecular weight fructans till plant senescence happens [24]. The quantity of fructans like other metabolites is sturdily prejudiced by genetic and ecological aspects, and growth factors like photoperiod, temperature, humidity and fertilizers, microbes and insects, UV radiation, heavy metals and pesticides [25].
Chemical composition of garlic bulbs is significantly affected by the genotype, thus the cultivar choice, in accordance with the climate chucks and standards of market quality could be an important means toward the quality enhancement of the final products. Regardless of the fact that in many parts of the world garlic is asexually propagated with cloves by farmers who use their cloves from the previous growing season. There is also a great range in agronomic and morphological types generally because of the presence of several ecotypes that are cultivated in the same areas for a long time and the ensuing accretion of natural mutations [26]. Gonzalez et al. [27] have distinguished substantial variability in the case of organosulfur compounds, pungency, total soluble solids, and antiplatelet activity, not only among garlic clones belonging to different ecophysiological groups, but also between same group clones. Mohammadi et al. [26] described that amongst topographical basis and genetic assortment a relationship for various Iranian garlic cultivars with germplasm differences were generally as an outcome of genotype and plant material transfer between the numerous growing areas. Furthermore, Singh et al. [28] have also examined the morphological variability of 47 Indian garlic collections.
There has been hardly any data available on garlic bulb quality related traits as effected by daylength and growth temperature combination. In this backdrop it was hypothesized that photoperiod and temperature combinations can influence bulb development and related attributes in garlic. So, the major objective of this investigation was to evaluate the effects of photoperiod and temperature combinations on nutritive quality indices of garlic bulb in terms of some traits like total soluble solid, soluble protein, sugars, starch, and phenolic compounds.

2. Materials and Methods

2.1. Experimental Cloves Sowing Site Description

The plantation of experimental cloves was done at the Horticultural Experimental Station (34°16′ N, 108°4′ E), Northwest A&F University, Yangling, Shaanxi Province, China in 2017–2018. This region had a temperate monsoon climate, with 12–14 °C of annual average temperature. Chemical characteristics of the soil used for growing experimental plants were: pH 7.8, electrical conductivity 239.1 μS cm−1, available N (nitrogen) 56.32 mg kg−1, available P (phosphorus) 52.57 mg kg−1 and available K (potassium) 224.90 mg kg−1. Deep plough and deep tillage of the plot was done before plantation. After that, each plot was broadcasted and incorporated with 1.5 kg “Pengdixin” (organic matter ≥30%, N + P + K ≥ 4%, humic acid ≥20%, organic sylvite ≥5%; Zhengzhou, Henan Province, China), 0.25 kg Stanley compound fertilizer (21–10–11; Yimeng, Shandong Province, China) and 0.4 kg ammonium hydrogen carbonate (Hanzhong, Shaanxi Province, China) as a basal dose of fertilizer before plantation. Throughout the time, standard agronomic practices were used to maintain the plants.

2.2. Photoperiod and Temperature Treatments

The trial was a three-factor (cultivar × photoperiod × temperature) complete randomized experiment. Healthy cloves of three garlic cultivars (G103, G024, and G2011-5) were selected as the experimental material and were sterilized with 0.6% Dacotech (75% chlorothalonil, Syngenta, Guangzhou, China). The difference in the selected cultivar was: G103 (growth period: 240 days, bulb skin color: white, mean number of cloves per bulb: 12–14, bulb fresh weight: 45–55 g), G024 (growth period: 240 days, bulb skin color: purple, mean number of cloves per bulb: 11–12, bulb fresh weight: 40–50 g), G2011-5 (growth period: 250 days, bulb skin color: purple, mean number of cloves per bulb: 12–14, bulb fresh weight: 45–55 g).
The experimental cloves were planted in the field on 1st September, 2017 at 5 cm depth, 5 cm plant to plant spacing, and 20 cm row to row spacing. The plot length and width were 1 m and 3 m, respectively. On 30th January 2018, the experimental plants of three garlic cultivars were transplanted into 15 × 15 cm pots and were filled with organic substrate “Jiahui” (20–25% of organic matter, 8–10% of humic acid, 6.5–6.8 of pH; Liaocheng, Shandong Province, China). Four uniform garlic plants were maintained in each pot and for each replication nine pots were used per treatment. Three biological replicates were used for experiments.
On 30th January 2018, the experimental plants were accustomed for 48 h under 20/18 °C (light/dark) and 80% RH to avoid transplanting shock. On 1st February 2018, the experimental plants were exposed to different combinations of photoperiod (8/16 h, 10/14 h, 12/12 h, 14/10 h, 16/8 h (light/dark)) and temperature (20/15 °C; 25/18 °C, and 30/20 °C (light/dark)) treatments in fifteen separate growth chambers (Ningbo Jiangnan Instrument Factory, Zhejiang Province, China) with 70% RH (relative humidity) and 105 μmol m−2 s−1 PAR (photosynthetic active radiation) per replicate.
On 12 March 2018, 40 days after photoperiod and temperature treatment, six plants from six pots from each treatment of each replication were randomly sampled. After measuring the morphological traits (plant standing height, fresh weight, pseudostem diameter, bulb diameter, bulb weight, bulb height, and bulbing index) bulbs were cleaned with distilled water and dried with absorbent paper. Samples were collected in liquid nitrogen and stored at −80 °C in a freezer until analysis of the physiological and nutritive quality indices (TSS, soluble protein content, soluble sugar content, total sugar content, glucose content, sucrose content, fructose content, starch content, total phenol content, and total flavonoid content). Three technical replicates were used to assay physiological and nutritive quality indices. From April to May 2018, the garlic bulb weight, height, and diameter were measured.

2.3. Measurement of Garlic Plant Morphological Indices, Bulb Characteristics, Growth Period, and Bulbing Index

The garlic morphological traits were assessed in the laboratory using measuring tape (plant standing height), electronic balance (Changzhou, China) (fresh weight and bulb weight), and electronic vernier caliper (Guanglu, China) (pseudostem diameter, bulb height, and bulb diameter). Growth period (number of days) was calculated from the treatment date (01 February) in growth chambers to the harvest date. Bulbing index (BI) was articulated as the ratio of the bulb diameter to pseudostem diameter. Bulbing was considered to begin when BI = 2 [29].

2.4. Assessment of Garlic Bulb Physiological and Nutritive Quality Indices

2.4.1. TSS (Total Soluble Solid)

Digital refractometer (PAL-1, Minato-ku, Tokyo, Japan) was used to estimate TSS content of the garlic bulb juice.

2.4.2. Soluble Protein Content

Coomassie Brilliant Blue (CBB) method was used to determine the soluble protein content [30]. Coomassie Brilliant Blue G-250 (100 mg) was dissolved in 50 mL 95% ethanol and to this solution 100 mL 85% (w/v) phosphoric acid was added. The resulting solution was diluted to a final volume of 1 L. Final concentrations in the reagent were 0.01% (w/v) Coomassie Brilliant Blue G-250, 4.7% (w/v) ethanol, and 8.5% (w/v) phosphoric acid. The absorbance was taken at 595 nm and content of protein was calculated from the standard curve.

2.4.3. Soluble Sugar Content

Estimation of the soluble sugar content in garlic cloves was done according to Fei et al. [31]. The extracts of H2O were diluted with 80% methanol with concentration of 10 mg/mL. 1.0 mL diluted extracts and 1.0 mL of 5% phenol were mixed and 5.0 mL H2SO4 was added and mixed thoroughly. After cooling, the absorbance was recorded at 485 nm and concentration of soluble sugar was determined from the standard curve of glucose solution (concentration range from 0 to 100 µg/mL). Results were expressed as % of glucose equivalents for g of garlic cloves.

2.4.4. Total Sugar Content

Total sugar content was estimated according to McCready et al. [32]. Five hundred milligram of sample was extracted in ethanol. After centrifugation at 5000× g for 10 min supernatant was mixed with 15 mL hydrochloric acid (1N) and incubated in a water bath for 20 min. Thereafter, 1 mL hydrolyzed extract was taken in test tube and 4 mL anthrone reagent was added. After 10 min absorbance was read at 620 nm and calculations were done from standard curve of glucose.

2.4.5. Glucose Content

Measurement of glucose content was done according to Miller [33]. Samples were extracted in distilled water and supernatant was mixed with 1 mL alkaline copper tartrate reagent and resultant solution was incubated in boiling water bath for 10 min. The test tubes were removed and cooled followed by addition of 1 mL of arsenomolybdate reagent. The volume of each test tube was made up to 10 mL with distilled water. After 10 min absorbance reading was taken at a wavelength of 620 nm. The amount of reducing sugar present in the sample was calculated from the standard curve of glucose.

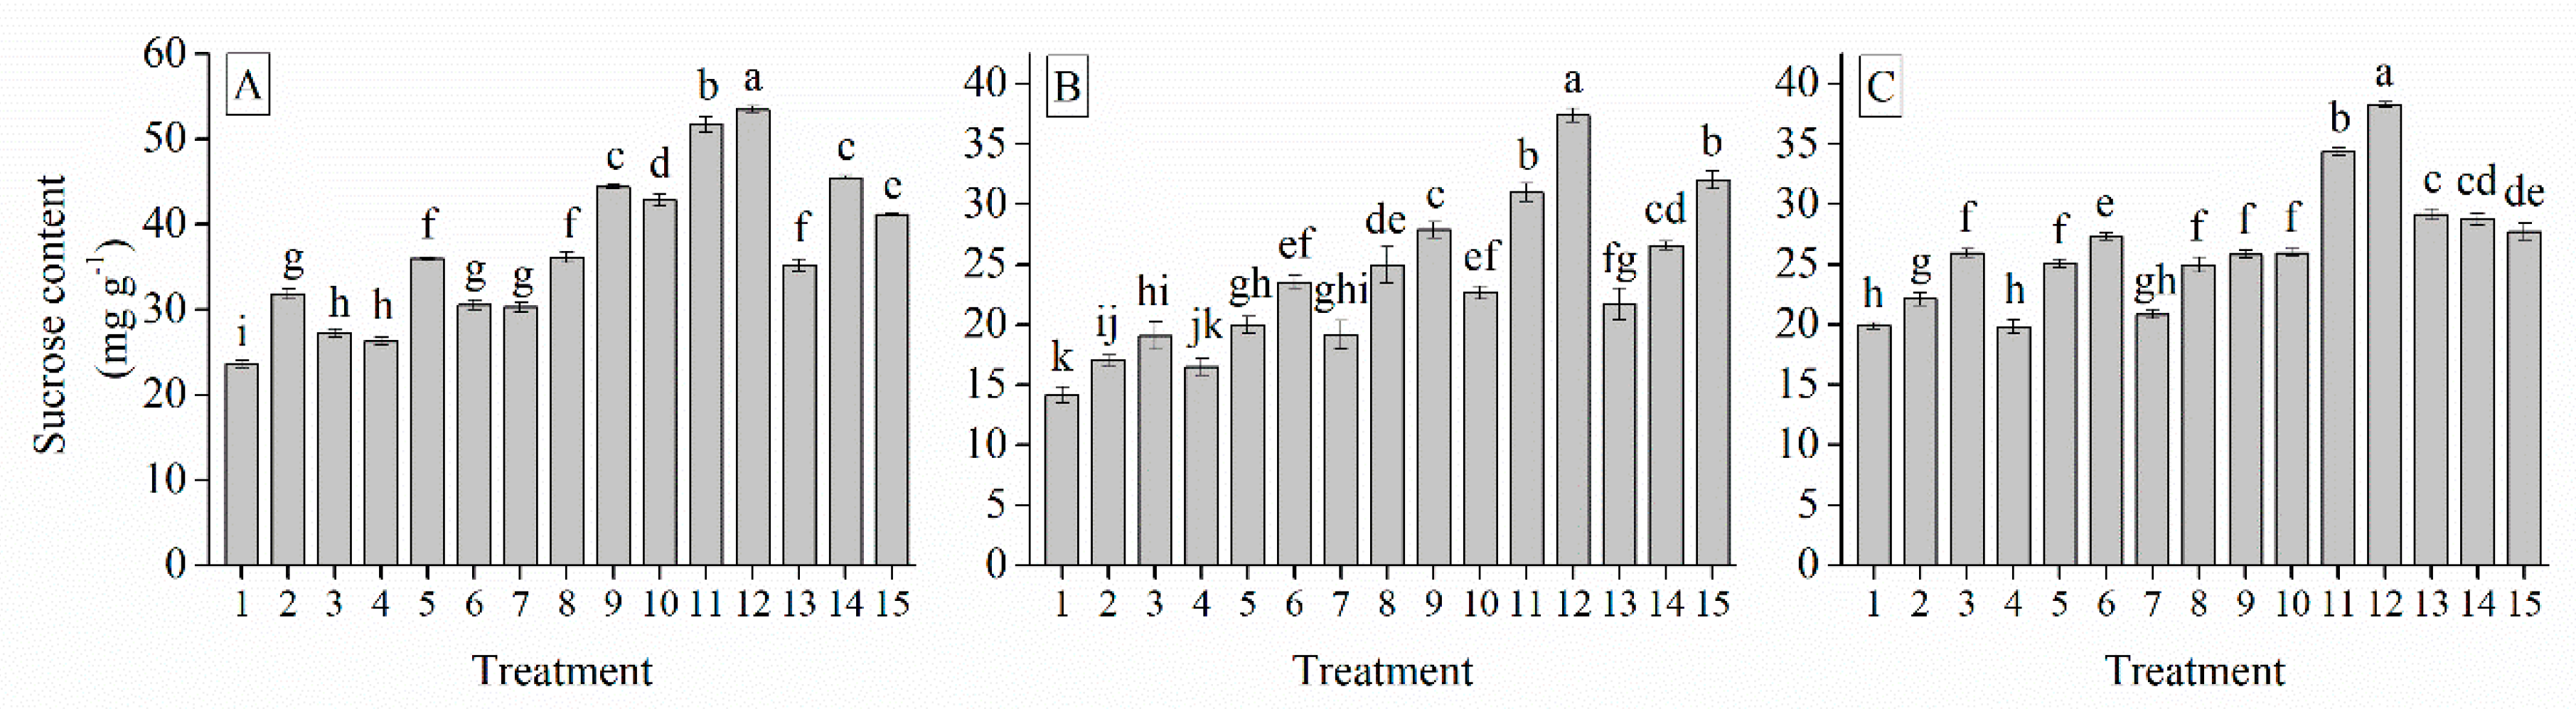
2.4.6. Sucrose Content

Sucrose content was assayed according to Handel [34]. After extraction supernatant was mixed with 2 N NaOH and incubated in water bath for 10 min. After cooling, 3.5 mL hydrochloric acid (30%), and 1 mL resorcinol (0.1%) were added, and resulting solution was mixed thoroughly. After incubating at 80 ℃ in water bath for 30 min samples were cooled and read at 480 nm.

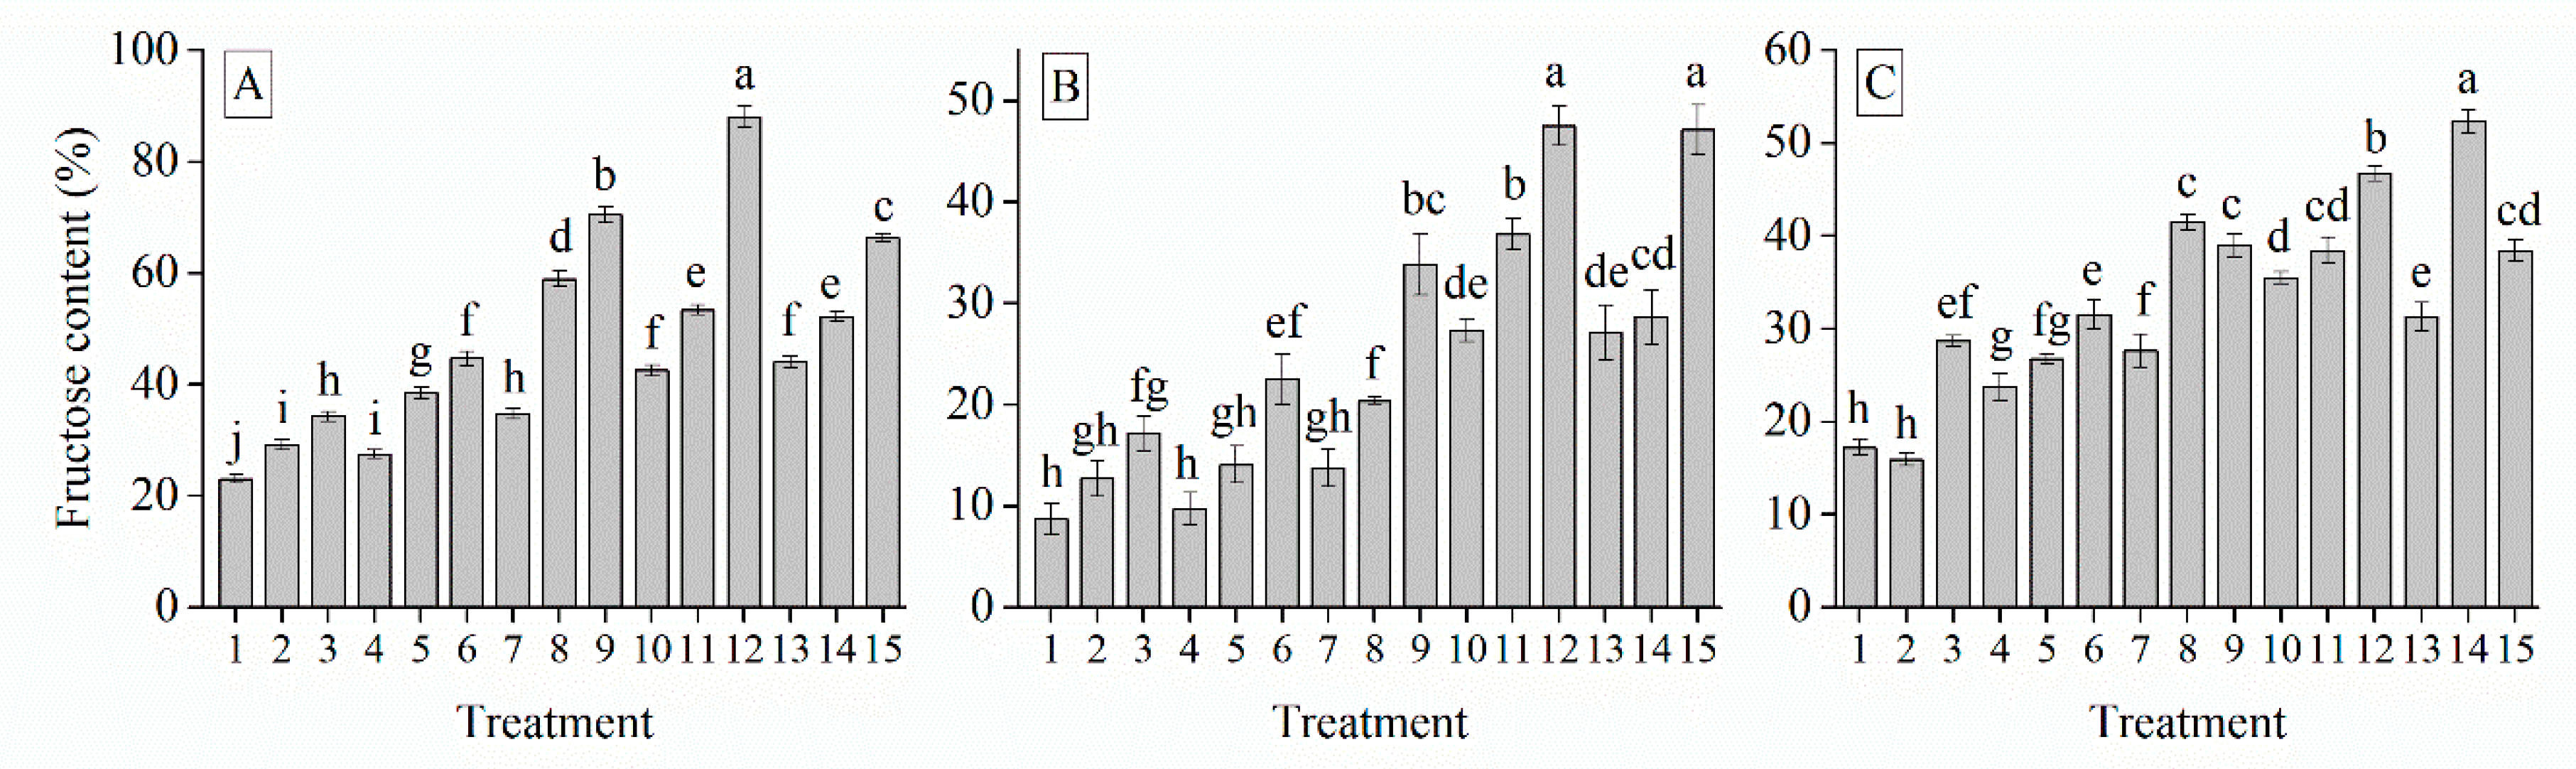
2.4.7. Fructose Content

Determination of fructose content was done according to Ashwell. [35]. 50 mg sample was extracted in 4 mL 80% ethanol in water bath at 80 ℃. Supernatant was collected and residue was again extracted in 2 mL 80% ethanol. Ten milligram of activated carbon was added to the supernatant to decolorize it. A total of 2 mL 0.1% resorcinol and 1 mL H2O were added and incubated at 80 ℃ water bath for 10 min. After cooling at room temperature OD was read at 480 nm and calculation was done using standard curve of fructose.

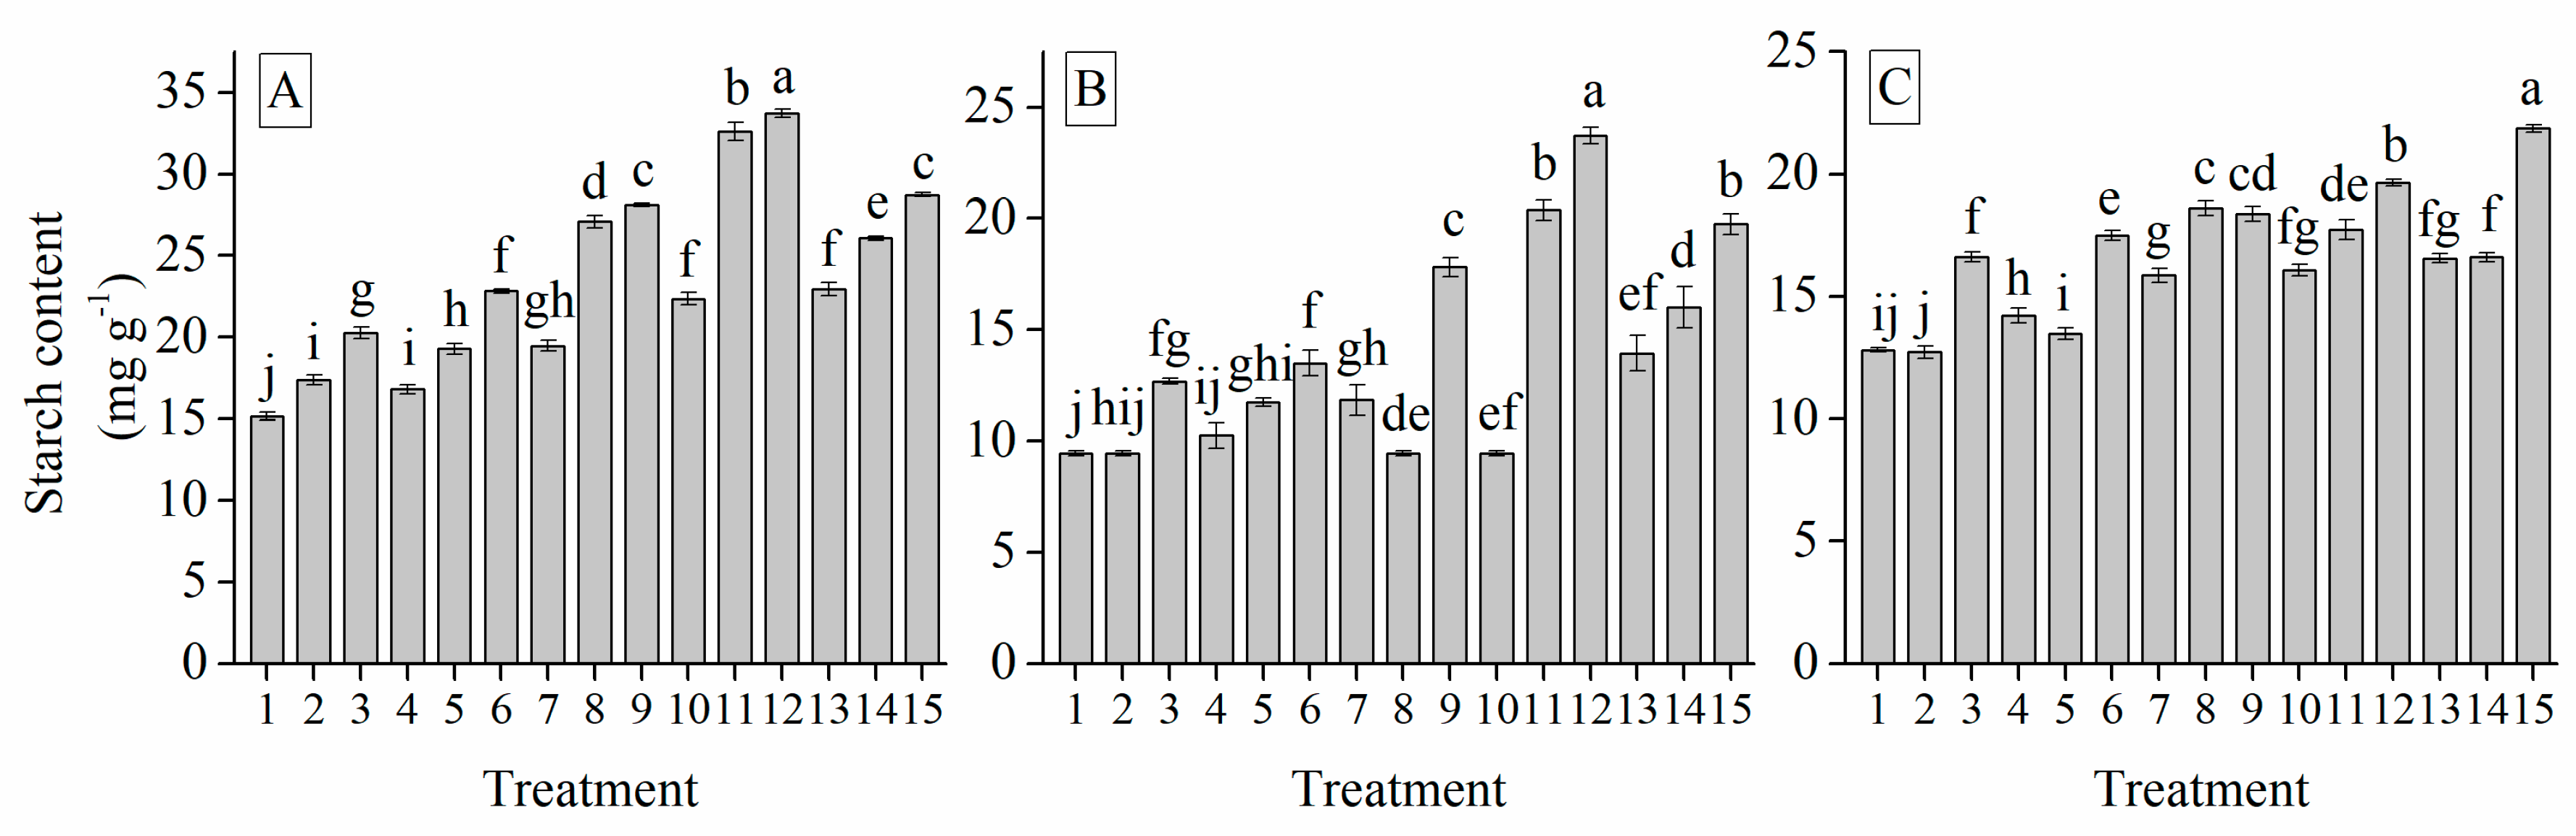
2.4.8. Starch Content

Starch content was evaluated according to McCready et al. [32]. Residue left after sugar estimation was dried and extracted in 3 mL of water at 100 ℃ in water bath for 20 min. Thereafter, 2 mL 9.2 N perchloric acid was added and allowed to stand for 10 min followed by centrifugation at 4000× g for 15 min. After that 2.4 mL water and 1.6 mL 9.2 N perchloric acid were added and allowed to stand for 10 min. Samples were again centrifuged and supernatants were mixed. Total of 4 mL anthrone-sulfuric acid reagent was added to 0.4 mL extract and incubated at 90 ℃ for 15 min. After cooling absorbance was recorded at 620 nm.

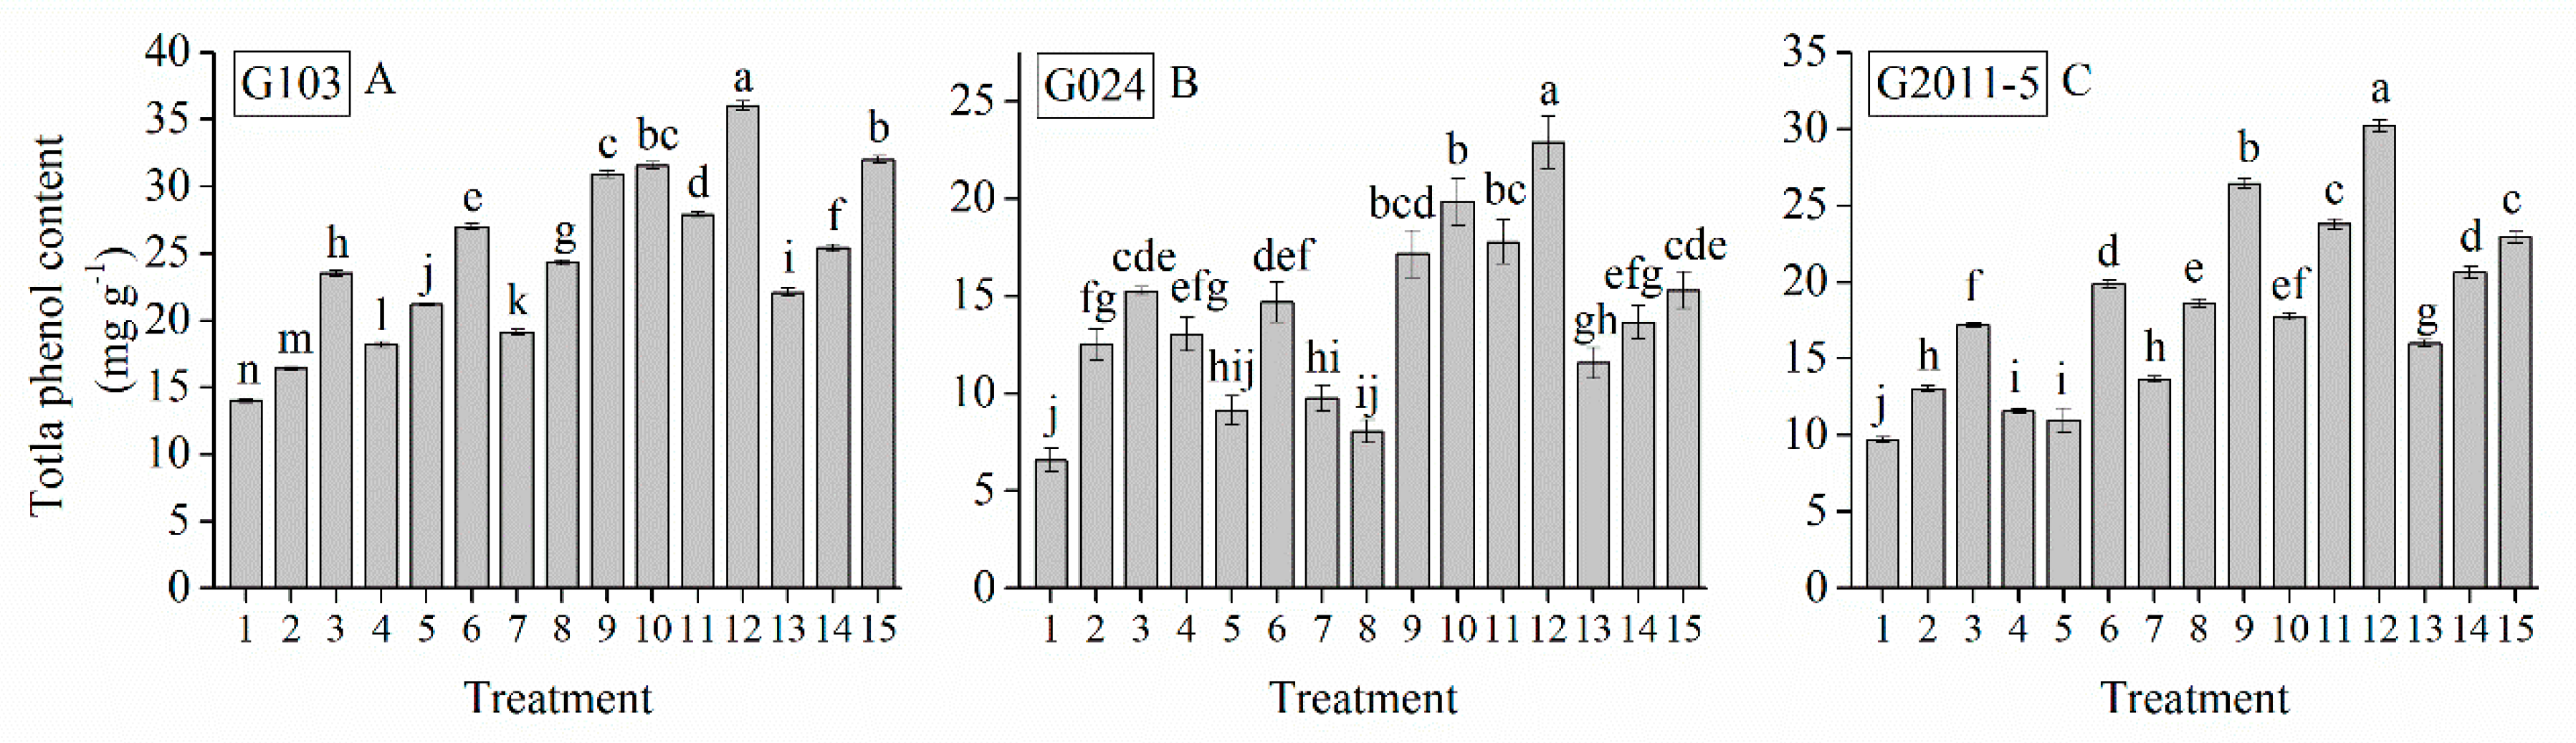
2.4.9. Total Phenol Content

Total phenol content was estimated according to Singleton and Rossi, [36]. Total of 100 mg sample was extracted in methanol and extract was centrifuged at 3000× g for 10 min. One milliliter supernatant was mixed with 1 mL FC (Folin phenol) reagent and 3 mL 20% Na2CO3. After 30 min absorbance was taken at 765 nm wavelength. Standard curve of gallic acid was used for calculation.

2.4.10. Total Flavonoid Content

The method of Yong et al. [37] was used to estimate the total flavonoids content. After extracting 100 mg sample in 30% ethanol 5 mL of 5% sodium nitrite was added to supernatant and allowed to stand for 5 min. Thereafter 10% aluminum nitrite solution was added followed by addition of sodium hydroxide. The absorbance was taken at 510 nm and standard curve of rutin was used for calculation.

2.5. Statistical Analysis

The homogeneity of variance of data was tested by using Bartlett’s test and the normality of distribution of data was tested by using Shapiro–Wilk test to confirm that the data meet the assumptions of ANOVA. Afterward, the data were evaluated using ANOVA (analysis of variance) as a 3 × 5 × 3 (cultivar × photoperiod × temperature) factorial design for this trial. SPSS 17.0 software (SPSS Inc., Chicago, IL, USA) was used. Tukey HSD tests were used for comparison of mean among treatments at p < 0.05. Correlations were calculated with the Pearson test at p < 0.05. The data were collected in triplicate.

3. Results

3.1. The Main Effect of Cultivar, Photoperiod and Temperature Treatments on the Garlic Plant Morphology, Bulb Characteristics, Growth Period, and Bulbing Index

The main effect of each factor was analyzed (Table 1). All of the considered factors, including cultivar (C), photoperiod (L), and temperature (T) have highly significant outcome on plant standing height, fresh weight, pseudostem diameter, bulb diameter, bulb weight, bulb height, growth period, and bulbing index. The longer photoperiod (14 h) and highest test temperature (30 °C) offered a significant enhancing result on the fresh weight, bulb diameter, growth period, and bulbing index, and the lowest temperature (20 °C) caused the highest plants and maximum pseudostem diameter, among all the treatments (Table 1). In addition, 12-h photoperiod and 25 °C resulted maximum bulb weight and 16-h photoperiod and 30 °C resulted in maximum bulb height. Among cultivars, G103 had the highest plant standing height, maximum fresh weight, pseudostem diameter, bulb diameter, bulb weight, bulb height, and shortest growth period whereas cv. G024 had maximum bulbing index (Table 1).

3.2. Interaction Effects of Photoperiod and Temperature Treatments on Plant Morphology of Three Garlic Cultivars

The interaction of C × L (cultivar×photoperiod), C × T (cultivar×temperature), L × T (photoperiod × temperature), and C × L × T significantly affected the plant standing height, fresh weight, and pseudostem diameter (Table 1). Results depicted in Table 1 reveal that growth of garlic plants fluctuated significantly in response to different treatments. Though the plant standing height and pseudostem diameter varies among cultivars, a similar general outline was detected in which a longer photoperiod and lower temperature significantly improved the plant standing height and pseudostem diameter of the garlic plant among the treatments, whereas maximum fresh weight of garlic plant was observed in longer photoperiod and higher temperature. The garlic plant standing height responded positively to the L14T20 treatment for three studied cultivars with an increase of 30%, 25%, and 26% for cvs. G103, G024, and G2011-5, respectively (Table 2). Maximum fresh weight of garlic plant was observed in L14/T30 and maximum pseudostem diameter was observed in L14/T20, for cvs. G103, G024, and G2011-5. The increase in fresh weight was 34%, 31%, and 33% for cvs G103, G024, and G2011-5, respectively and increase in pseudostem diameter was 44% in G103, 46% in G024, and 42% in G2011-5 (Table 2).

3.3. Interaction Effects of Photoperiod and Temperature Treatments on Bulb Characteristics and Growth Period of Three Garlic Cultivars

The garlic bulb characteristics (bulb diameter, weight, and height) were significantly improved by the interaction of C × L, C × T, L × T, and C × L × T (Table 1). It was evident that different treatments had significantly different effects on garlic bulb characteristics (Table 1). Even though garlic bulb diameter, weight, and height varied among cultivars. The same overall pattern was detected in which a longer photoperiod and higher temperature significantly enhanced the bulb characteristics among the treatments. L14/T30 treatment had maximum bulb diameter as related to other treatments for cvs. G103, G024, and G2011-5 with an increase of 49%, 78%, and 60%, respectively (Table 3). Maximum bulb weight was observed at L10/T30 in cv. G103 with an increase of 44%, and at L12/T30 in cv. G024 with increase of 37%. Cv. G2011-5 had the maximum bulb weight at L12/T30 with increase of 40% (Table 3). The maximum bulb height was observed at L16/T30 in cv. G103 with an increase of 28% and at L14/T30 in cv. G024 and cv. G2011-5 with increase of 29% and 28%, respectively (Table 3). L14/T30 treatment combination had the shortest growth period in comparison with other treatments in all the studied cultivars (Table 3). This outcome proposed that longer photoperiods and higher temperatures improved the maturity of the garlic plant and shortened the growth period.

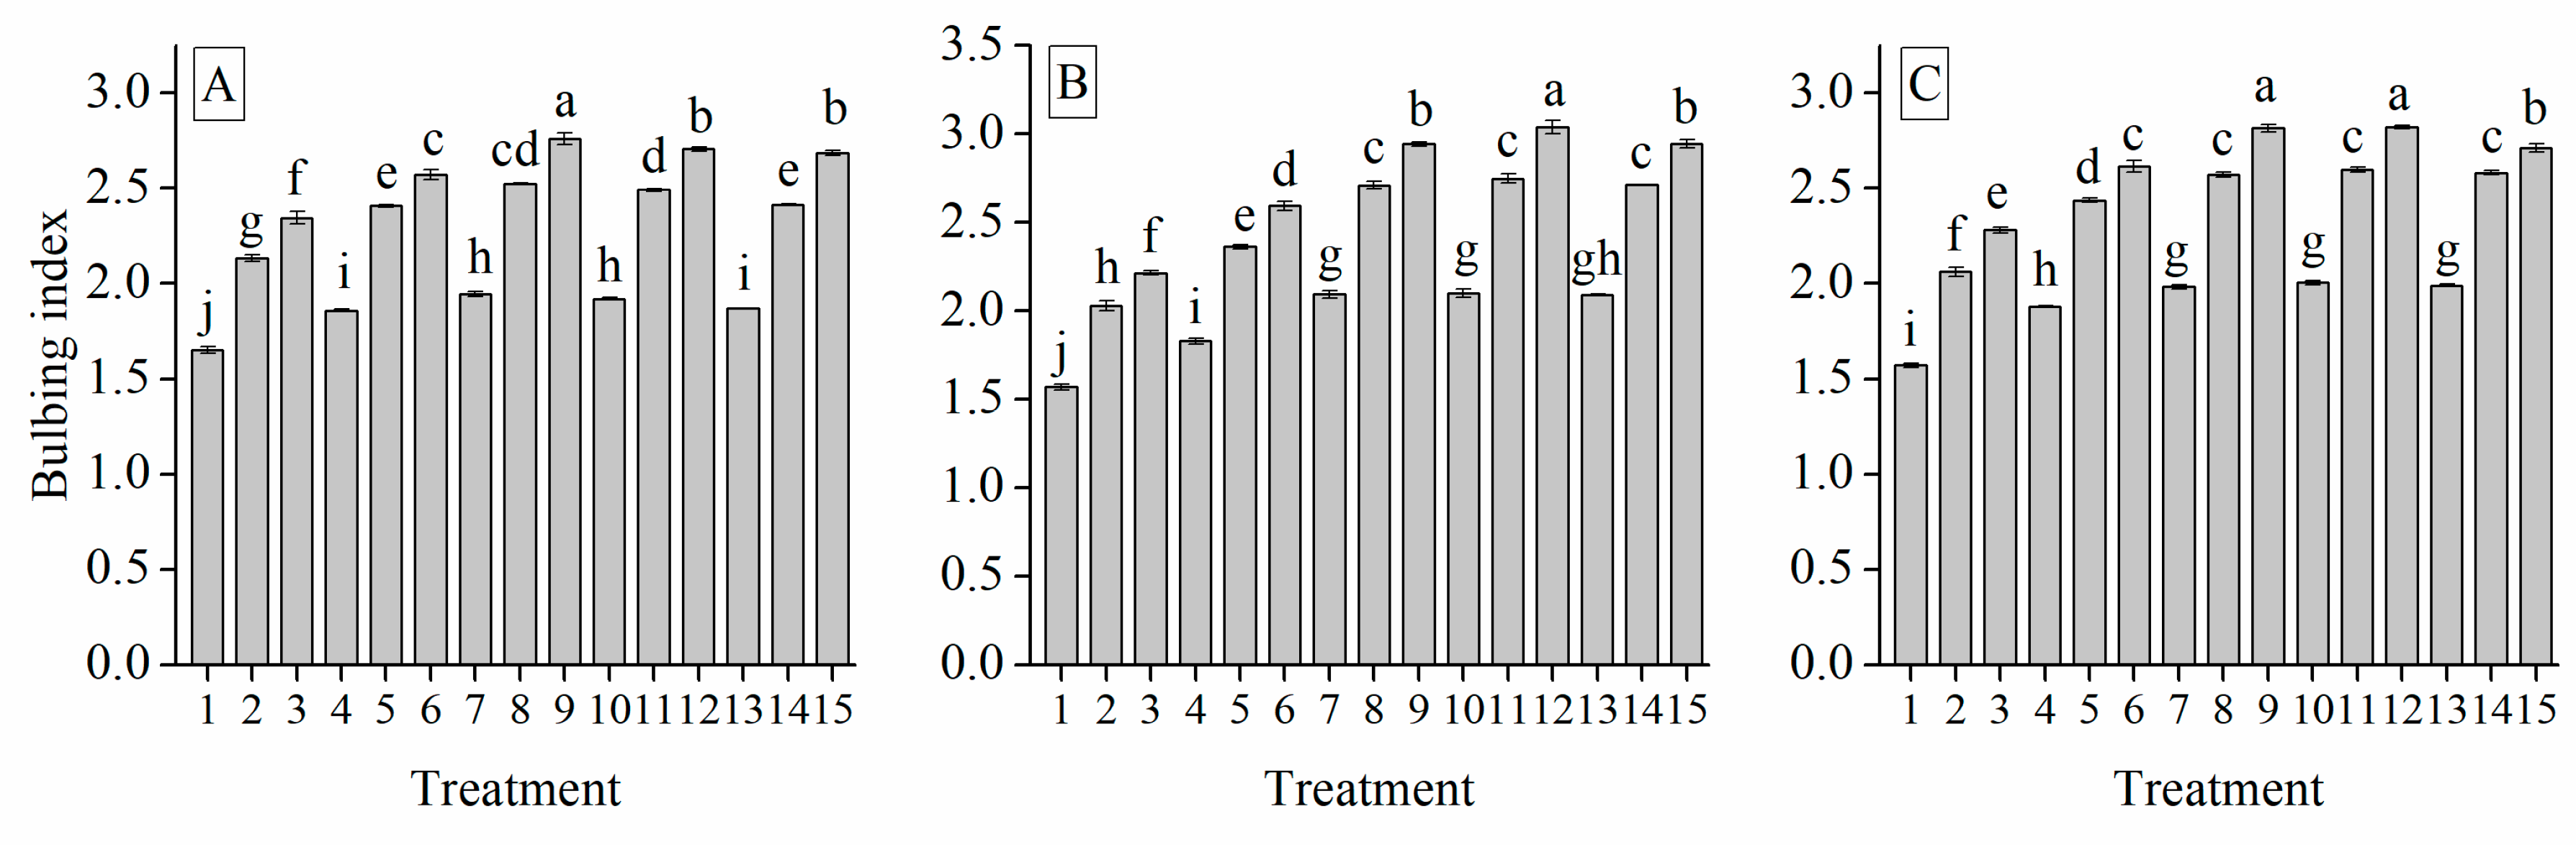
3.4. Interaction of Cultivar, Temperature and Photoperiod Treatments on Bulbing Index

Bulbing was considered to start when BI = 2. The interactions of C × L, C × T, L × T, and C × L × T had a significant effect on BI (Table 1). The results of the experiment indicated that a longer photoperiod and higher temperature significantly boosted the bulbing of garlic, while short photoperiod and the lower temperature had only a small BI upsurge in the present study (Figure 1). In this study bulbing began for cv. G103 in L8T25 (Figure 1A), and the highest BI was achieved under L12T30 (Figure 1A), for cv. G024 bulbing began in L8T25 (Figure 1B), and the highest BI was achieved under L14T30 (Figure 1B), for cv. G2011-5 bulbing began in L14T20 (Figure 1C), and the highest BI was achieved under L14T30 (Figure 1C).

3.5. The Main Effect of Cultivar, Photoperiod, and Temperature Treatments on the Garlic Bulb Physiological and Nutritive Quality Traits

The key effects of each factor on nutritive quality traits in garlic bulbs was analyzed (Table 4). A significant impact was observed for all of the studied factors (C, L, and T). The responses were similar to bulb characteristics. Cv. G103 with the highest bulb characteristics, had the highest total soluble solid (TSS), soluble protein, soluble sugar, total sugar, glucose, sucrose, fructose, starch contents while cv. G024 with the lowest bulb characteristics, showed the lowest nutritive quality traits (Table 4). Similar to the bulb characteristics, the photoperiod and temperature treatments significantly increased the protein and sugar content (Table 1, Table 3 and Table 4). Moreover, the longer photoperiod (L14) and higher temperature (T30) had a significantly improving effect on the nutritive quality traits among the photoperiod and temperature treatments which is similar to the increasing trend of BI.

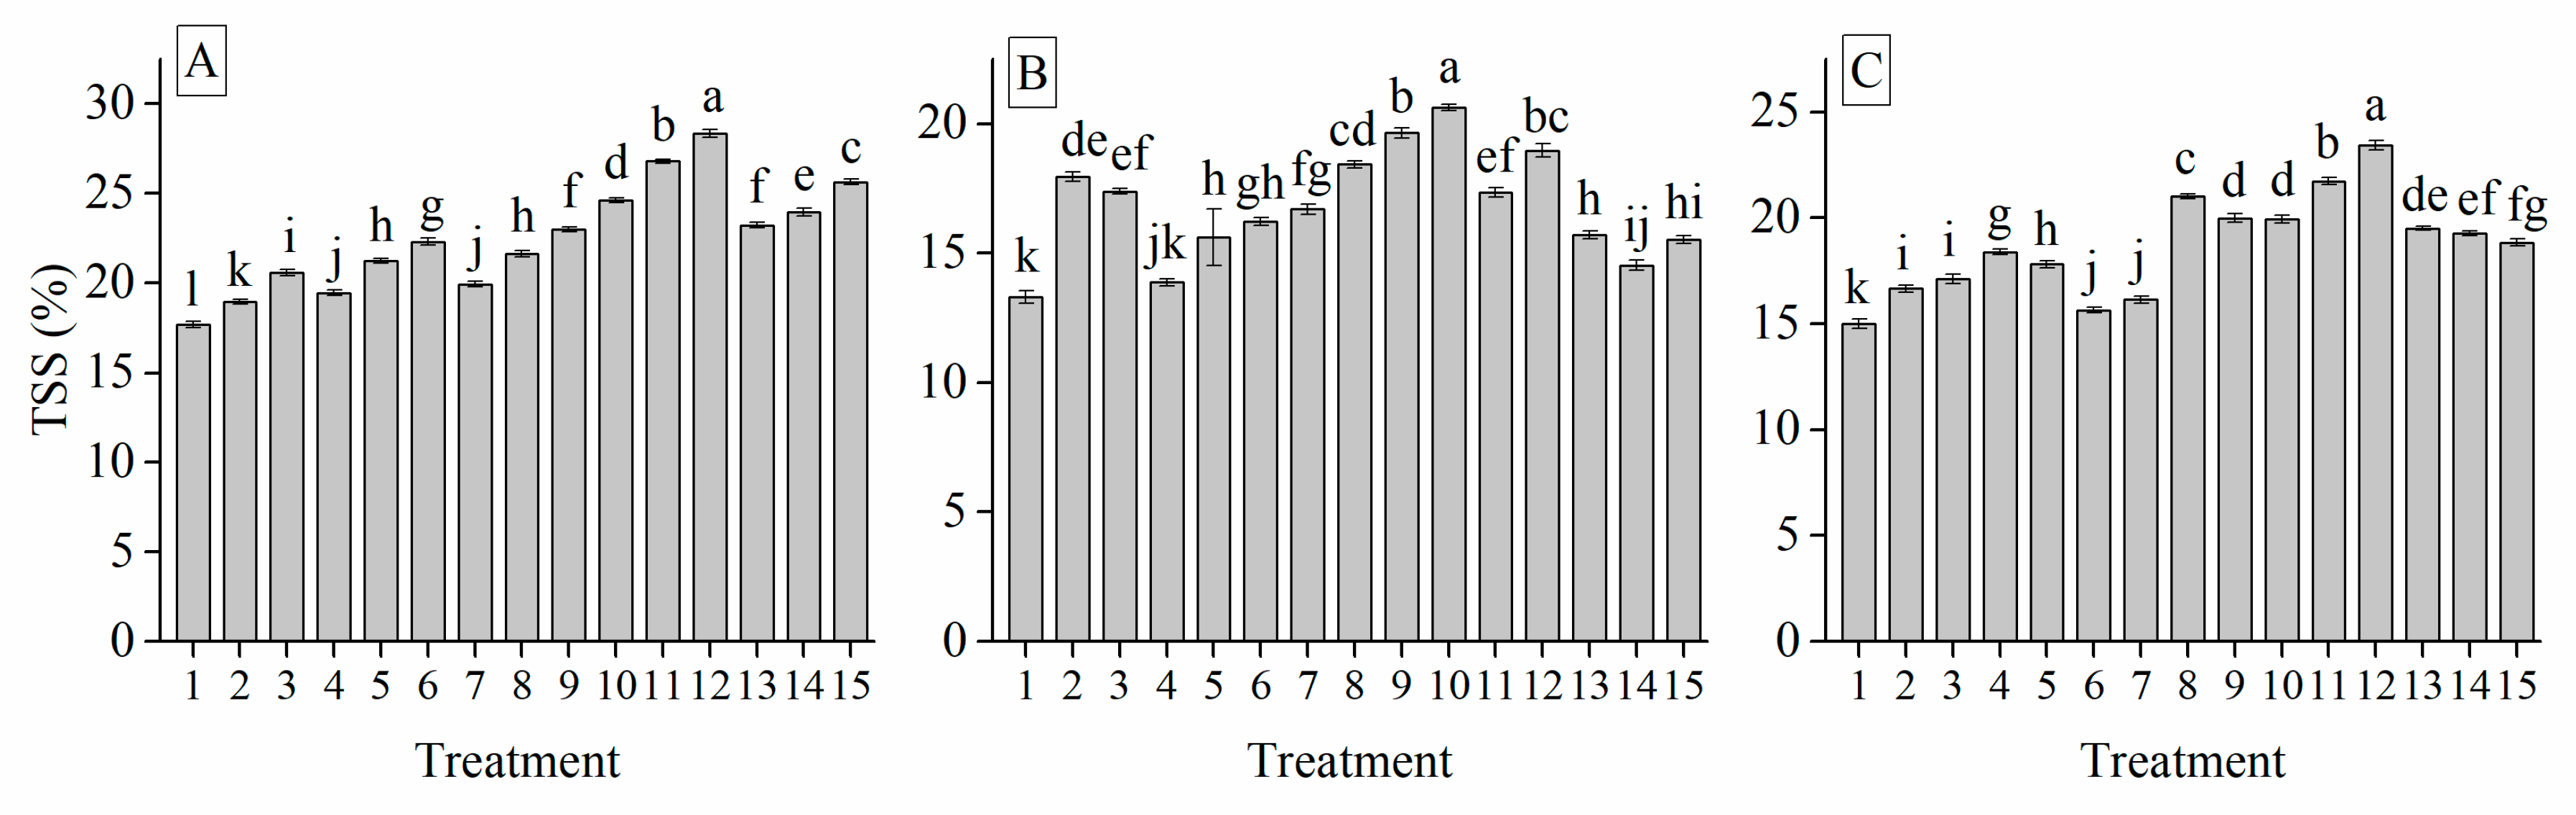
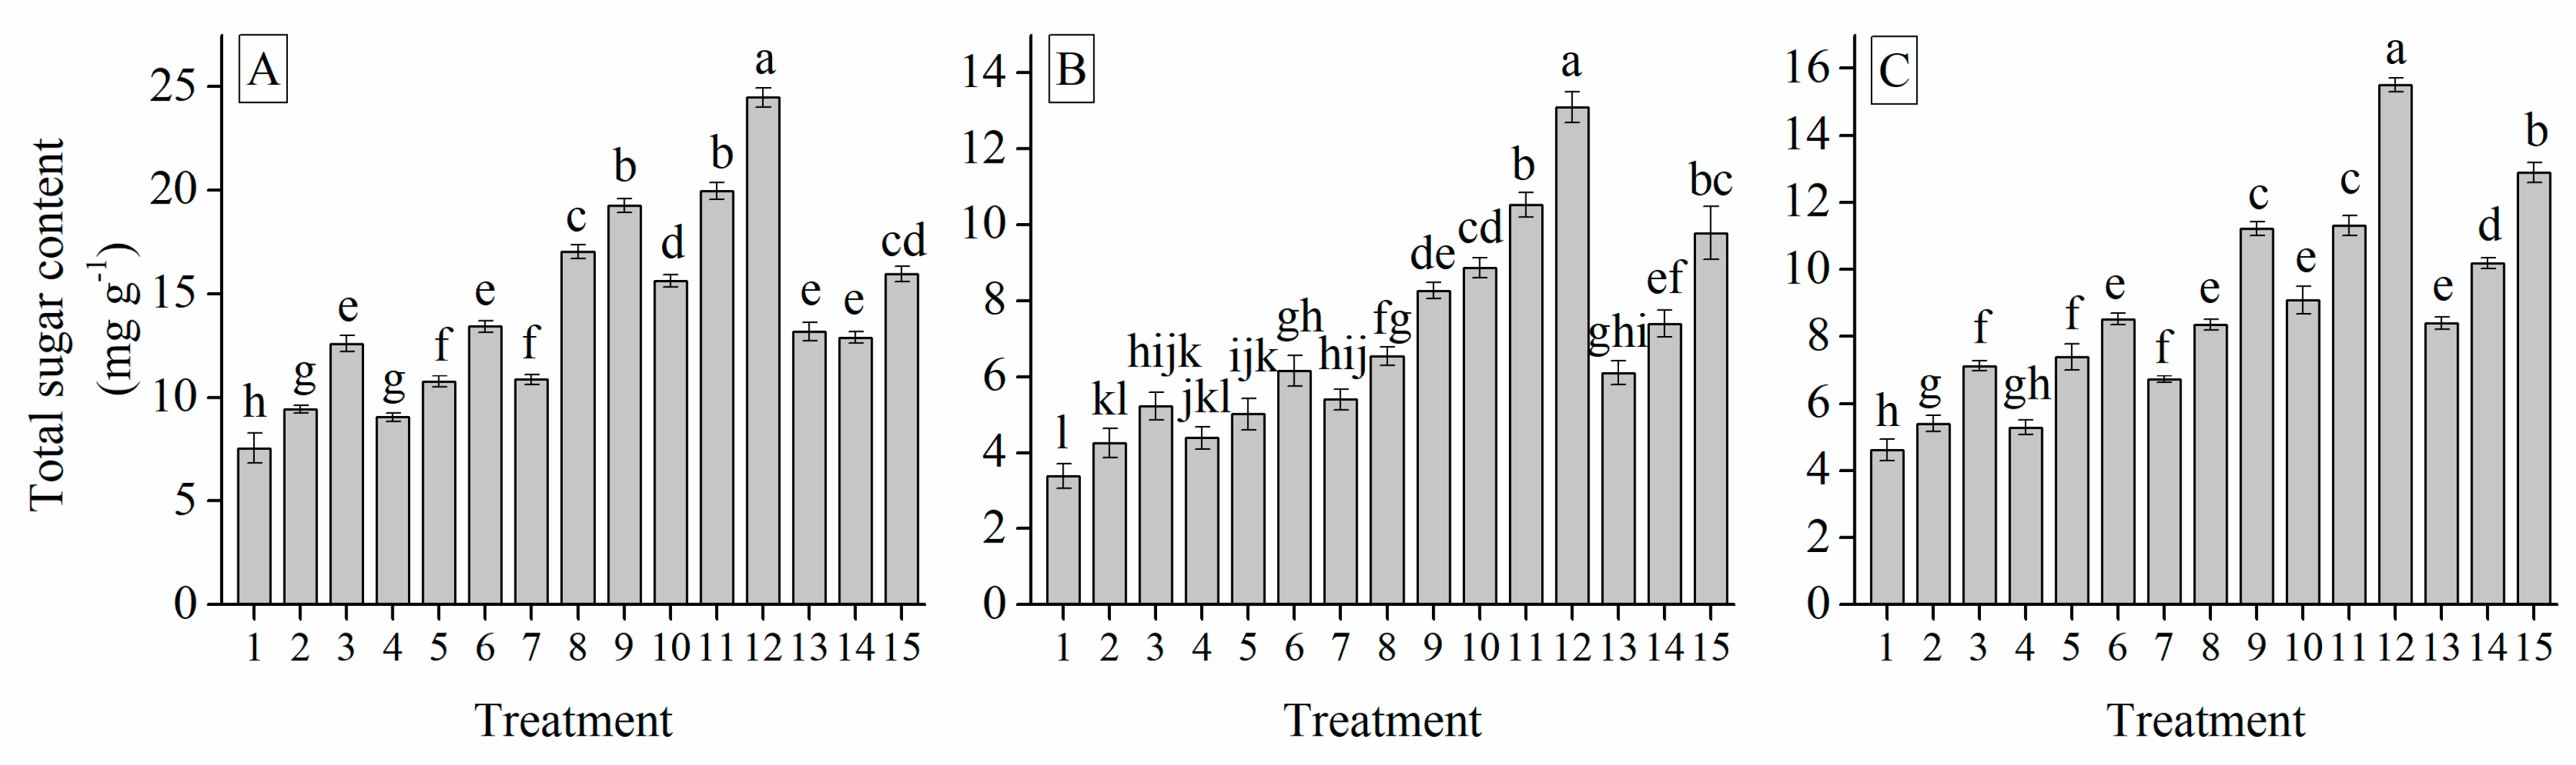
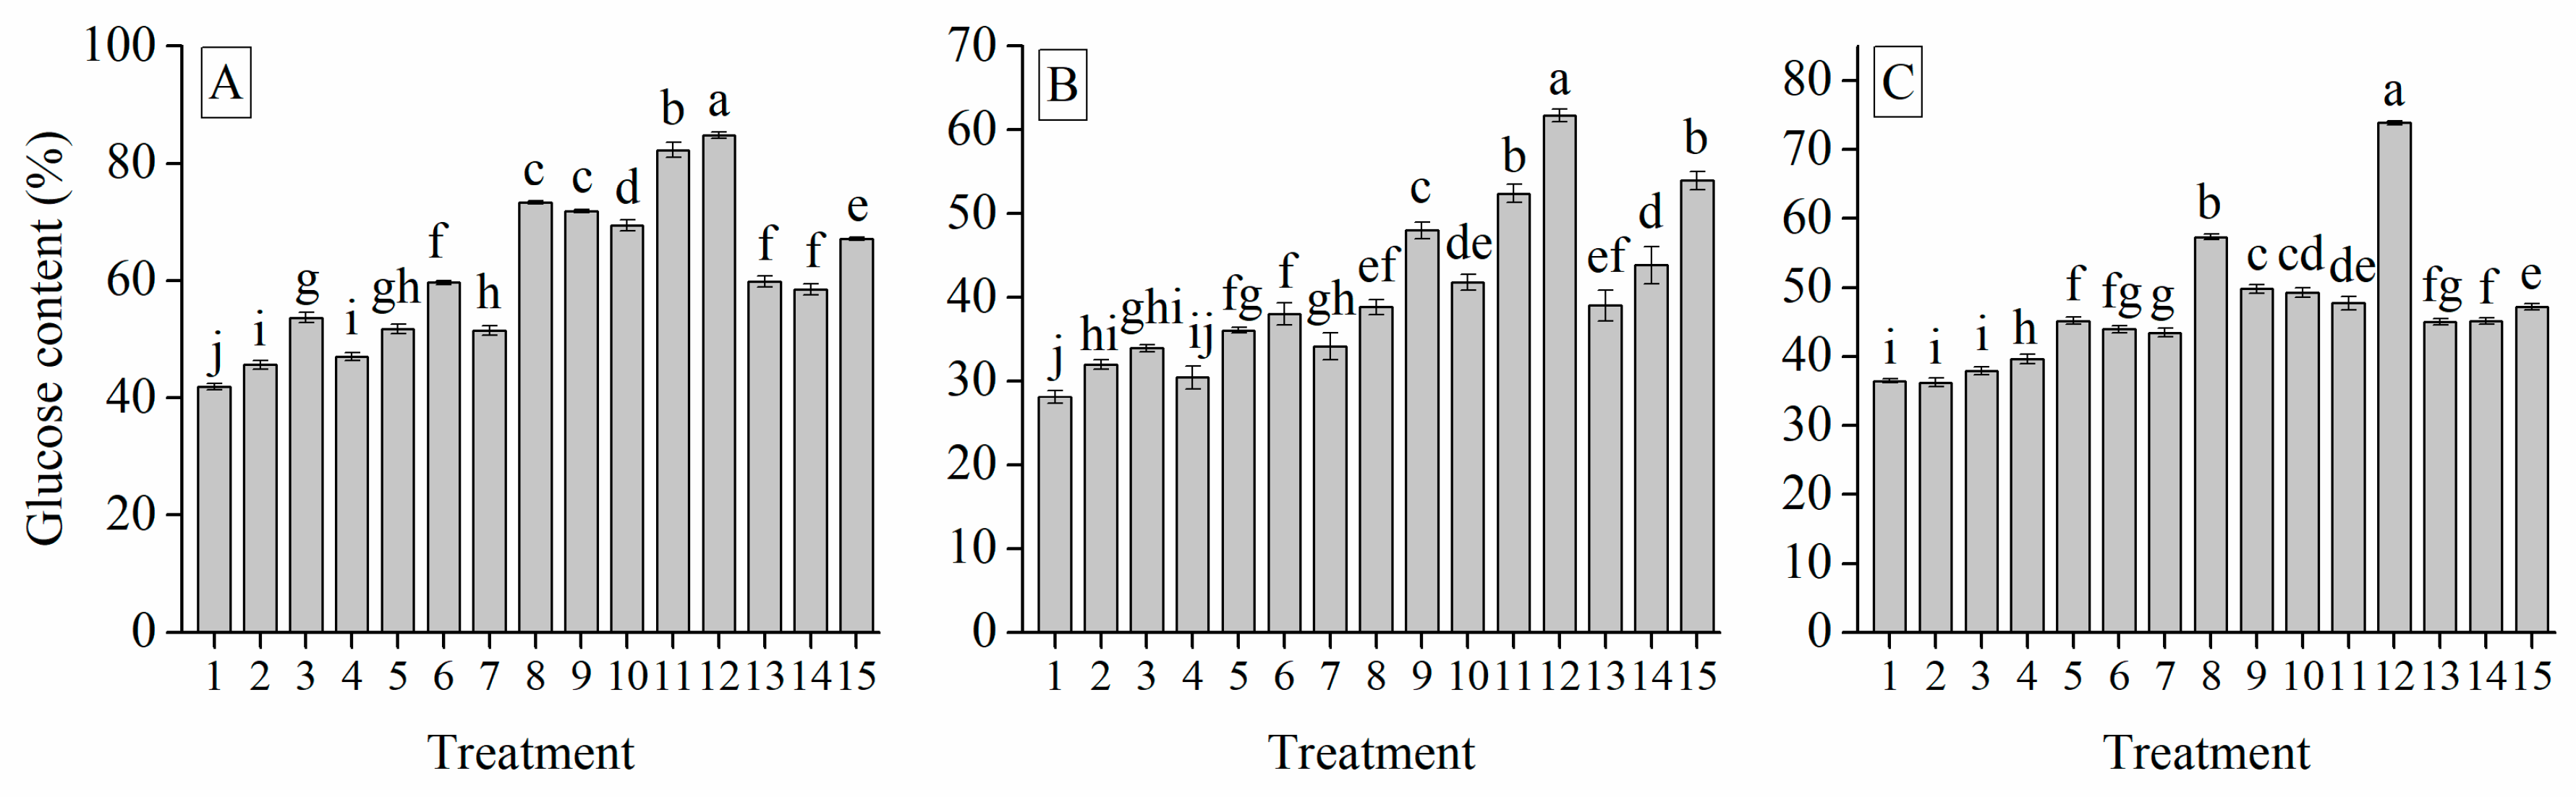
3.6. Interaction of Cultivar, Photoperiod and Temperature Treatments on the Garlic Bulb Physiology and Nutritive Quality Traits

C × L, C × T, L × T, and C × L × T significantly affected garlic bulb nutritional traits (Table 4). The findings of this study revealed that longer photoperiod and higher temperature significantly increased the contents of soluble protein and sugars of garlic bulbs. The TSS of the garlic bulb responded positively to longer photoperiod and higher temperature. L14T30 have maximum TSS with an increase of 60% (Figure 2A) and 56% (Figure 2C), for cvs. G103 and G2011-5, respectively. L14T20 had maximum TSS with an increase of 55% (Figure 2B), for cv. G024. Maximum protein content was observed in the combination of longer photoperiod and higher temperature (L14T30) with an increase of 310% (Figure 3A), 426% (Figure 3B), and 358% (Figure 3C) for cv. G103, cv. G024, and G2011-5, respectively. The combination of longer photoperiod and higher temperature (L14T30) significantly enhanced the soluble sugar content of garlic bulb with an increase of 333% (Figure 4A), 454% (Figure 4B), and 393% (Figure 4C) for cv. G103, cv. G024, and G2011-5, respectively. Total sugar content responded favorably to L14T30 with an increase of 224% (Figure 5A) for cv. G103, 288% (Figure 5B) increase for cv. G024, and 235% (Figure 5C) increase for cv. G2011-5. Highest TSS, soluble protein, soluble sugar, and total sugar was observed in cv G103 (Figure 2A, Figure 3A, Figure 4A and Figure 5A). Highest glucose, sucrose, fructose, and starch content was found in L14T30 (longer photoperiod and higher temperature) for three studied cultivars (Figure 6, Figure 7, Figure 8 and Figure 9). Cv. G103 had an increase of 103% (Figure 6A), 127% (Figure 7A), 282% (Figure 8A), and 122% (Figure 9A) for glucose, sucrose, fructose, and starch content, respectively; Cv. G024 had an increase of 119% (Figure 6B), 164% (Figure 7B), 443% (Figure 8B), and 151% (Figure 9B) for glucose, sucrose, fructose, and starch content, respectively. G2011-5 exhibited a maximum increase of 104% (Figure 6C), 93% (Figure 7C), 229% (Figure 8C), and 72% (Figure 9C) for glucose, sucrose, fructose, and starch content, respectively.

3.7. The Main Effect of Cultivar, Photoperiod and Temperature Treatments on the Garlic Bulb Phenolic Compounds

The effect of cultivar, photoperiod, and temperature on phenolic compounds in garlic bulbs was analyzed (Table 4) and significant effect was observed for all of the studied factors (C, L, and T). The responses were similar to bulb characteristics. Cv. G103, with the highest bulb characteristics, had the highest total phenol and flavonoid contents while cv. G024, with the lowest bulb characteristics, showed the lowest phenols and flavonoid contents (Table 4). Similar to the bulb characteristics, the increasing photoperiod and temperature treatments significantly increased the total phenols and total flavonoids content (Table 4). Furthermore, the longer photoperiod (L14) and highest temperature (T30) showed a significant enhancing effect on the phenolic compounds among the photoperiod and temperature treatments, which agreed with the increasing trend of the bulb characteristics.

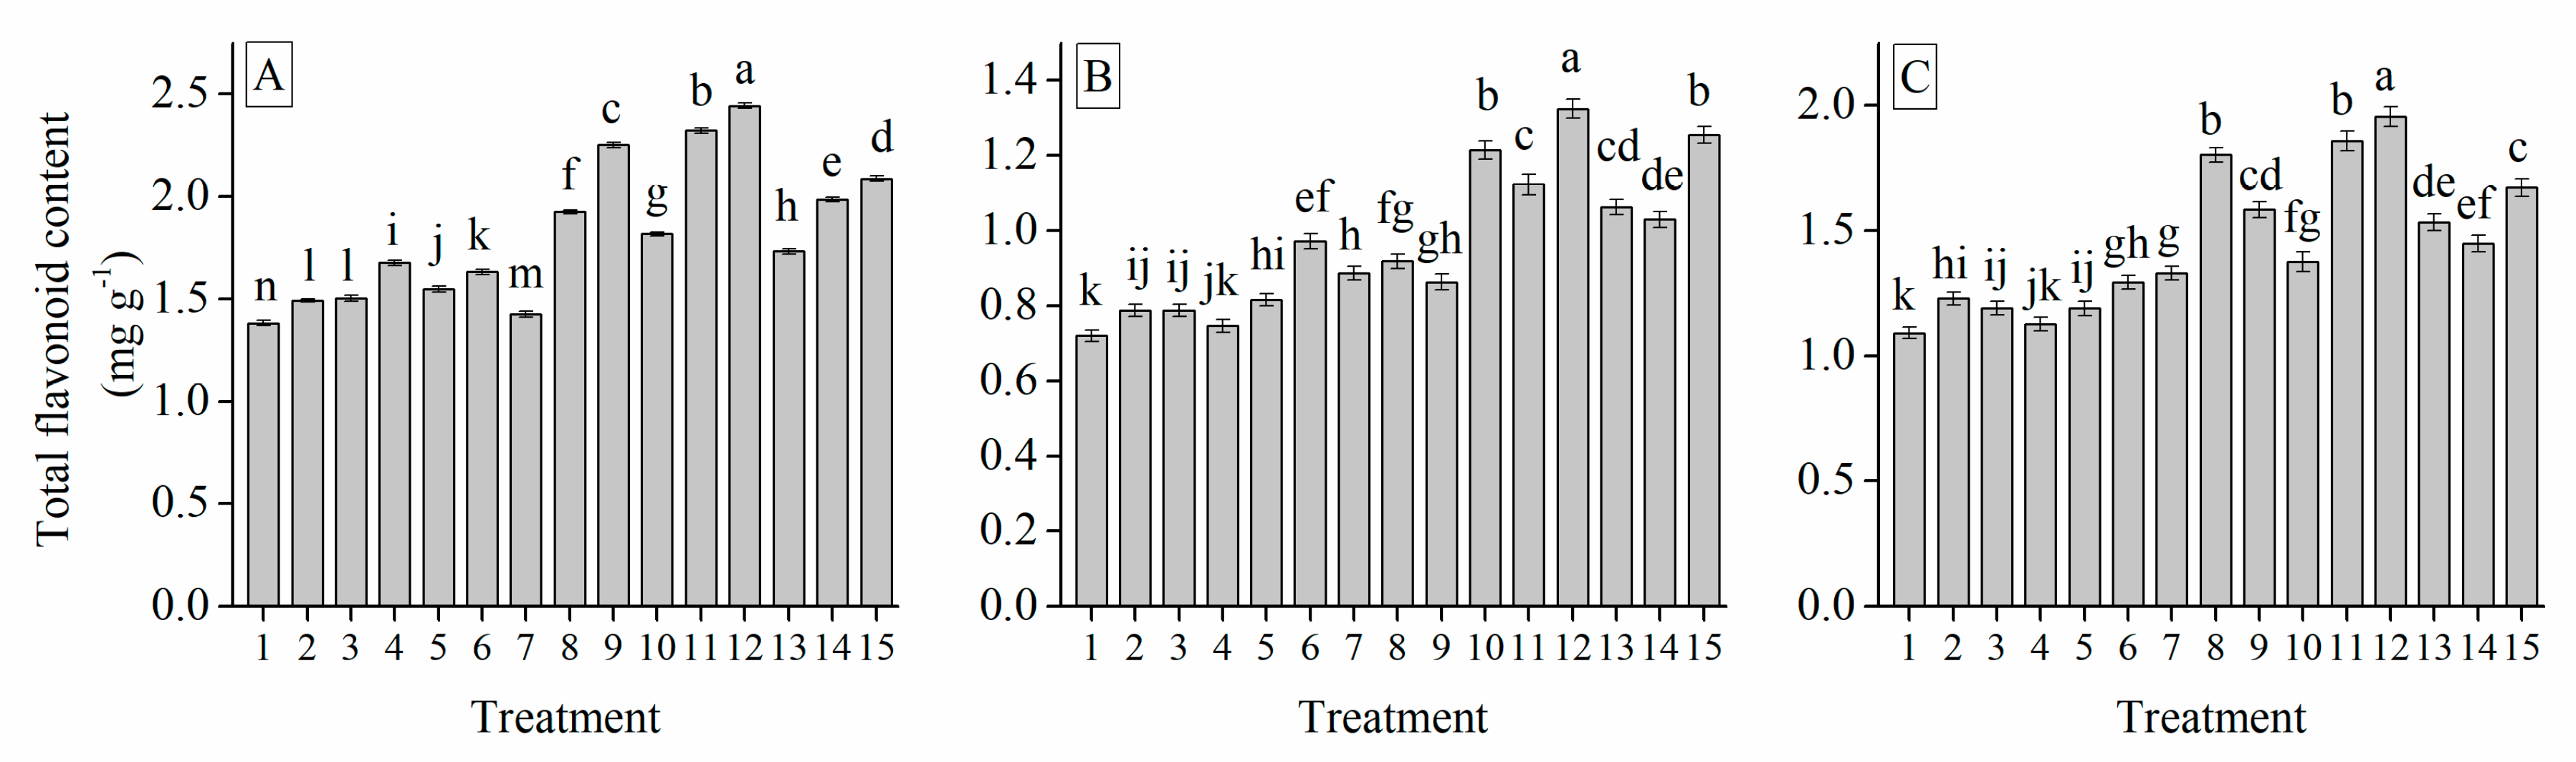
3.8. Interaction of Cultivar, Photoperiod, and Temperature Treatments on Garlic Bulb Phenolic Compounds

Total phenolic content of garlic bulb was significantly affected by C × L, C × T, L × T, and C × L × T (Table 4). Combination of longer photoperiod and higher temperature (L14T30) had the highest content of total phenols with increase of 157% (Figure 10A), 247% (Figure 10B), and 212% (Figure 10C) for cvs. G103, G024, and G2011-5, respectively. C × L, C × T, L × T significantly affected the total flavonoids content whereas non-significantly affected by C × L × T. L14T30 had the highest content of total flavonoid content with increase of 77% (Figure 11A), 83% (Figure 11B), and 80% (Figure 11C) for cvs. G103, G024, and G2011-5, respectively.

3.9. Correlation Analysis

Correlation analysis was performed among the pseudostem diameter, garlic bulb characteristics, growth period, bulbing index, garlic bulb nutritive quality traits and phenolic compounds, and between each trait for three garlic cultivars (Table 5). The analyses showed highly significant correlations between bulb characteristics, growth period, bulbing index, and physiological and nutritive quality traits and phenolic compounds except between bulb weight and bulb height, bulbing index, soluble protein, and soluble sugar. Significant correlations were seen between garlic plant morphological indices and physiological and nutritive quality traits except among pseudostem diameter and bulb height, soluble protein; among the fresh weight of garlic plant and pseudostem diameter, bulb weight which had non-significant correlations. Non-significant correlations were found between bulb diameter, bulb physiological, and nutritive quality traits except for total flavonoids. Significant correlations had been observed among bulb characteristics, bulbing index, pseudostem diameter, fresh weight, and total flavonoid (Table 5).

4. Discussion

4.1. Effect of Photoperiod and Temperature on Garlic Plant Growth Traits and Bulbing

This study results revealed that garlic bulbing responded favorably to longer photoperiod and higher temperature. Garlic cultivars variation in bulbing and environmental signals response is observed and is most probably parallel to other Allium species [38,39,40,41,42,43]. In alliaceous crops, bulbing depends on environmental signals, i.e., long photoperiods (lily) and high temperature (onion) [40,41,42,43,44]. Takagi [15] stated that long photoperiods are indispensable for floral scape elongation. A long photoperiod and higher temperature were required for the bulbing of garlic [3,45].
In the present research, garlic plants were grown under numerous combinations of photoperiod and temperature treatments for the bulbing response. The results showed that three studied cultivars had a higher bulbing rate under longer photoperiod (14 h or 16 h) and higher temperatures (25 °C or 30 °C) as compared to other treatments, which was in agreement with previous findings. In the present research, we wanted to establish the requirement of photoperiod and temperature for bulbing of garlic cultivars. In this study, results provide a further indication for the enlightening impact of a longer photoperiod and higher temperature on garlic bulbing. It was practical to assume that longer photoperiods and higher temperatures were essential for the bulbing of garlic. The significantly different features of the selected cultivars might result in the diverse routines of bulb characteristics and bulbing index. The physiological, nutritive quality traits, and phenolic compounds were significantly different between the studied cultivars, which might elucidate the mechanism of the numerous bulbing performances after photoperiod and temperature treatments (Table 4; Figure 2, Figure 3, Figure 4, Figure 5, Figure 6, Figure 7, Figure 8, Figure 9, Figure 10 and Figure 11).
It had long been recognized that photoperiod and temperature play key roles in the ultimate size of the bulb and formation. After 40 days of treatment, the bulbing procedure initiated for all of the cultivars. In divergence, the beginning of bulb growth only happened at a longer photoperiod and higher temperature for all cultivars. The results were in agreement with the former research in which bulbing required longer photoperiods and higher temperatures [46]. In our study, the three particular cultivars were implanted in the field at the same time on 1 September 2017. With the growth transitions the early growing garlic had an early commencement of bulbs and finished the whole life cycle early, therefore, clearing up why when we transplanted the experimental plants into the growth chamber and then sampled them on 12 March, cv. G024 produced the largest BI, although cv. G103 had the lowest BI (Table 2). Late maturing cultivars had a late start of bulbs. It was identified that the late maturing cultivars had a benefit in yield and fruit quality somewhat because of the longer growth period. Moreover, the biological characteristics of cvs G024 and G103 were different. Subsequently, when harvested, cv. G103 had the largest bulb and highest yield.
The longer photoperiod (14 h and 16 h) and higher temperature (30 °C) are significantly effective for garlic bulbing among all of the treatments in this study, and the critical photoperiod and temperature conditions were cultivar specific. It has been stated that garlic produces poor bulbs in warm, short-day lowland tropical regions, while in temperate zones, in which days were long and winters were cold, flower induction and variation occur and were frequently tailed by scape elongation [42]. It was supposed that under optimum growing conditions (especially appropriate photoperiod and temperature conditions) significantly affect bulbing and also improve the bulb development of garlic thereby affecting its yield [6]. It looked that competition for resources was a very important aspect but only as a second or third phase in a number of trials [6]. Burba and Riera [47] detected a largely optimistic relationship amid maturity and bulb yield in garlic. Panthee et al. [48] also observed that early maturity and high yields of garlic are connected, inspiring the breeding of a short-duration and high-yielding cultivars. The outcomes of this investigation were in agreement with these aforementioned studies. Under long photoperiod and higher temperature environments, the garlic plant matured earlier with a higher yield which was of great advantage for the production of garlic bulb.

4.2. Role of Photoperiod and Temperature in the Garlic Bulb Quality Attributes

A longer photoperiod and higher temperature combination led to a significant upsurge in the concentration of TSS, soluble protein and sugars (Table 4; Figure 2, Figure 3, Figure 4, Figure 5, Figure 6, Figure 7, Figure 8 and Figure 9). Bulbing was controlled by inner indicators, which can be inhibited or stimulated by the environmental situations. Soluble protein and sugars regulated plant growth, were considered to play a vital role in the development of garlic bulb. Our results exhibited that the soluble protein and sugar levels in garlic bulb were significantly increased by the longer photoperiod (14 h) and higher temperature (30 °C) and were reduced by the shorter photoperiod (8 h) and lower temperature (20 °C) (Table 4; Figure 2, Figure 3, Figure 4, Figure 5, Figure 6, Figure 7, Figure 8 and Figure 9). This response accorded with that of the BI (Table 1; Figure 1) and bulb characteristics (diameter and height) (Table 1 and Table 3). Plants treated with L14/T30 had the highest soluble protein and sugar levels for cv. G103 (Figure 3A, Figure 4A, Figure 5A, Figure 6A, Figure 7A, Figure 8A and Figure 9A). The results further established that the higher bulbing ability might be due to the higher soluble protein and sugar levels in plants. Cultivars along with the environmental conditions (photoperiod and temperature) affect the soluble protein and sugar levels, which finally regulated garlic bulb development. It was practical to assume that soluble protein and sugar levels were highly related to the bulbing capability of garlic, and higher levels were valuable for garlic bulbing. It had been endorsed that sugars can have antagonistic and synergetic, as well as stabilizer effects on different physiological processes. In this way they interrelated to normalized floral transition and organogenesis under the effect of light signals [49]. Accordingly, different photoperiod and temperature might persuade variations in the absorption and alignment of the soluble sugars in plant tissues, leading to alterations of plant growth and development. The content of soluble sugars also increased from short to long photoperiod and low to high temperature. Responses we observed were mostly because of the rise in photoperiod and temperature. Generally, based on the plant growth linked with the photoperiod and temperature tempted absorption changes, our results suggest that soluble sugar responses may be involved in garlic bulb photoperiod and temperature adaptation.
The sugars in the bulbs of garlic were significantly affected by the photoperiod and temperature treatments (Table 4; Figure 4, Figure 5, Figure 6, Figure 7 and Figure 8). Berries grown at different latitudes have different concentration of sugars [50,51]. Zheng et al. [50] found a higher content of sugars in currant cultivars grown in southern Finland compared to the northern regions. Comparable inclination was detected in sea buckthorn [52]. Sugars content and their type are key contributors to taste in vegetables [53]. Rosa et al. [54] observed higher levels of sugar in three varieties of Brassica oleracea grown in spring and summer season than in those grown in the summer and winter season. It could hence be that longer photoperiod and higher temperatures had higher sugars content and probably effect on the nutritive quality. Hence, our study highlighted the importance of estimating photoperiod and temperature concurrently to evaluate their impact on the nutritive quality attributes of garlic bulb. Our data suggested that complementary photoperiod and temperature regimes could be anticipated to cause distinction in the sugars content in garlic.
In the current investigation, the total phenols and flavonoids content of garlic bulb increased following the increase of the photoperiod and temperature (Table 4; Figure 10 and Figure 11). The increased levels of total phenols and flavonoids could be related to the plant’s defense mechanisms. Consequently, garlic bulbs produced at longer photoperiod and higher temperature own higher antioxidant properties which is a positive nutritional improvement. These possible health profits of phenolic compounds depend on their absorption and metabolism. Higher levels of phenolic compounds suggested that the garlic bulbs grown at longer photoperiod and higher temperatures had not only higher total phenol content, but also higher quantities of flavonoids. These data could be used as valuable approaches to produce garlic bulbs with higher nutritional value. According to Beato et al. [54] the selection of cultivar may be a useful resource to increase the total phenolics and ferulic acid content. Garlic phenols are one of the nutritional qualities of garlic. Previous studies had revealed that the synthesis and accretion of phenolic compounds were affected by the photoperiod and appropriate light treatment can increase the total phenolic content in the plant and enhance free radical scavenging capacity [55,56]. Garlic has also been anticipated as one of the richest bases of phenolic compounds among the frequently consumed vegetables, although it is highly graded concerning the per capita feeding of phenolics in the human diet [57]. However, there is a great distinction in the total phenolic content, detected not only between the several genotypes and ecotypes, but also amid the applied cultivation practices and growing situations [58]. Other quality characters connected with the chemical composition, such as total soluble solids, pH, and carbohydrate content also showed a great disparity among genotypes [59]. More combinations with different light/dark photoperiods and temperatures shall be tested in future to find out the more optimum combinations of photoperiod and temperature for garlic bulbing. According to the Pearson correlation coefficients, a significant correlation between bulb characteristics and nutritive quality traits of garlic bulb existed (Table 5). These outcomes recommend that photoperiod and temperature stimulate bulb development and improves garlic bulb yield. The data exhibited the highest correlation of bulb diameter with bulb quality related indices advocates the implication of these parameters as proficient indicators of garlic bulb formation and enlargement (Table 5).

5. Conclusions

In conclusion, it was obvious that a longer photoperiod and higher temperature were critical for garlic bulbing. The soluble protein, sugars and phenolic compound levels increased significantly after treatment, which might have led to the different responses of the three studied cultivars to photoperiod and temperature treatments combination. It was presumed that higher soluble protein, sugars, and phenolic compound levels are valuable for garlic bulbing. The critical condition was cultivar specific. Cv. G103 had improved bulb formation under the environments of 14 h–30°C as compared to other cultivars. Practically, photoperiod and temperature treatments must have substantial profitable demand and value in improving garlic bulb production particularly in those months of the year when days are naturally short. In addition, further studies are required to identify the genes regulating the bulb development and related attributes under varied photoperiod and temperature regimes.

Author Contributions

Conceptualization, M.J.A. and Z.C.; methodology, M.J.A.; software, M.J.A. and M.A., validation, M.J.A., B.A. and M.I.G.; formal analysis, M.J.A. and Y.Z.; investigation, M.J.A.; resources, Z.C.; data curation, M.J.A.; writing—original draft preparation, M.J.A.; writing—review and editing, M.J.A., S.H. and Z.C.; supervision, Z.C.; project administration, Z.C.; funding acquisition, Z.C.

Funding

This research was supported by grants from the National Natural Science Foundation of China (31772293), and Education Development Fund Project of Northwest A&F University (2017).

Conflicts of Interest

All authors have no conflict of interest to declare.

References

  1. Wang, H.; Li, X.; Shen, D.; Oiu, Y.; Song, J. Diversity evaluation of morphological traits and allicin content in garlic (Allium sativum L.) from China. Euphytica 2014, 198, 243–254. [Google Scholar] [CrossRef]
  2. Grubben, G.J.H.; Denton, C.M. Plant Resources of Tropical Africa 2: Vegetables. In Plant Resources of Tropical Asia Foundation; Bakhuys Publishers: Leiden, The Netherlands, 2004; p. 59. [Google Scholar]
  3. Wu, C.; Wang, M.; Dong, Y.; Cheng, Z.; Meng, H. Growth, bolting and yield of garlic (Allium sativum L.) in response to clove chilling treatment. Sci. Hortic. 2015, 194, 43–52. [Google Scholar] [CrossRef]
  4. Chia, P.L.; Kubota, C. End-of-day far-red light quality and dose requirements for tomato rootstock hypocotyl elongation. HortScience 2010, 45, 1501–1506. [Google Scholar] [CrossRef] [Green Version]
  5. Craig, D.S.; Runkle, E.S. An intermediate phytochrome photoequilibria from night-interruption lighting optimally promotes flowering of several long-day plants. Environ. Exp. Bot. 2016, 121, 132–138. [Google Scholar] [CrossRef]
  6. Mathew, D.; Forer, Y.; Rabinowitch, H.D.; Kamenetsky, R. Effect of long photoperiod on the reproductive and bulbing processes in garlic (Allium sativum L.) genotypes. Environ. Exp. Bot. 2010, 71, 166–173. [Google Scholar] [CrossRef]
  7. Miralles, D.J.; Richards, R.A. Responses of leaf and tiller emergence and primordium initiation in wheat and barley to interchanged photoperiod. Ann. Bot. 2000, 85, 655–663. [Google Scholar] [CrossRef]
  8. Lefsrud, M.G.; Kopsell, D.A.; Auge, R.M.; Both, A.J. Biomass production and pigment accumulation in kale grown under increasing photoperiods. HortScience 2006, 41, 603–606. [Google Scholar] [CrossRef] [Green Version]
  9. Ali, M.D.; Khandaker, L.; Oba, S. Comparative study on functional components, antioxidant activity and color parameters of selected colored leafy vegetables as affected by photoperiods. J. Food Agric. Environ. 2009, 7, 392–398. [Google Scholar]
  10. Xu, H.L.; Xu, Q.C.; Li, F.L.; Feng, Y.Z.; Qin, F.F.; Fang, W. Applications of xerophytophysiology in plant production-LED blue light as a stimulus improved the tomato crop. Sci. Hortic. 2012, 148, 190–196. [Google Scholar] [CrossRef]
  11. Steer, B.T. The role of night temperature in the bulbing of onion (Allium cepa L.). Aust. J. Agric. Res. 1980, 31, 519–523. [Google Scholar] [CrossRef]
  12. Bandara, M.S.; Krieger, K.; Slinkard, A.E.; Tanino, K.K. Pre-plant chilling requirements for cloving of spring-planted garlic. Can. J. Plant Sci. 2000, 80, 379–384. [Google Scholar] [CrossRef]
  13. Etoh, T.; Simon, P.W. Diversity, fertility and seed production in garlic. In Allium Crop Science: Recent Advances; Rabinowitch, H.D., Currah, L., Eds.; CAB International: Wallingford, UK, 2002; pp. 101–117. [Google Scholar]
  14. Gaskell, M.; Cantwell, M.; Nie, X.; Smith, S.; Faber, B.; Voss, R. Effects of transplant date and transplant size on production, quality and pungency of sweet onions. In Proceedings of the National Onion (and other Allium) Research Conference, Sacramento, CA, USA, 10–12 December 1998; pp. 337–341. [Google Scholar]
  15. Takagi, H. Garlic (Allium sativum L.). In Onions and Allied Crops, Volume 3: Biochemistry, Food Science, and Minor Crops; Rabinowitch, H.D., Brewster, J.L., Eds.; CRC Press: Boca Raton, FL, USA, 1990; pp. 109–157. [Google Scholar]
  16. Kamenetsky, R. Garlic: Botany and horticulture. Hortic. Rev. 2007, 33, 123. [Google Scholar]
  17. Huyskens-Keil, S.; Schreiner, M. Quality dynamics and quality assurance of fresh fruits and vegetables in pre and postharvest. In Production Practices and Quality Assessment of Food Crops; Dris, R., Jain, S.M., Eds.; Quality Handing and Evaluation; Kluwer Academic Publishers: Dordrecht, The Netherland, 2004; Volume 3, pp. 401–409. [Google Scholar]
  18. Filgueira, F.A.R. New Manual of Olericulture, 3rd ed.; UFV: Vicosa, Brazil, 2008; p. 421. [Google Scholar]
  19. Brewster, J.L. Physiology of crop growth and bulbing. In Onions and other Vegetable Alliums; Rabinowitch, H.D., Brewster, J.L., Eds.; CRC Press: Boca Raton, FL, USA, 1990; pp. 53–88. [Google Scholar]
  20. Lercari, B. The promoting effect of far-red light on bulb formation in the long day plant Allium cepa L. Plant Sci. Lett. 1982, 27, 243–254. [Google Scholar] [CrossRef]
  21. Hemm, M.R.; Rider, S.D.; Ogas, J.; Murry, D.J.; Chapple, C. Light induces phenylpropanoid metabolism in Arabidopsis roots. Plant J. 2004, 38, 765–778. [Google Scholar] [CrossRef] [PubMed]
  22. Liu, C.Z.; Guo, C.; Wang, Y.C.; Ouyang, F. Effect of light irradiation on hairy root growth and artemisinin biosynthesis of Artemisia annua L. Process Biochem. 2002, 38, 581–585. [Google Scholar] [CrossRef]
  23. Xie, B.D.; Wang, H.T. Effects of light spectrum and photoperiod on contents of flavonoid and terpene in leaves of Ginkgo biloba L. Nanjing For. Univ. 2006, 30, 51–54. [Google Scholar]
  24. Rizzalli, R.H.; Villalobos, F.J.; Orgaz, F. Radiation interception, radiation-use efficiency and dry matter partitioning in garlic (Allium sativum L.). Eur. J. Agron. 2002, 18, 33–43. [Google Scholar] [CrossRef]
  25. Orcutt, D.M.; Nilsen, E.T. The Physiology of Plants under Stress: Soil and Biotic Factors; John Wiley & Sons: New York, NY, USA, 2000. [Google Scholar]
  26. Mohammadi, B.; Khodadadi, M.; Karami, E.; Shaaf, S. Variation in agro-morphological characters in Iranian garlic landraces. Int. J. Veg. Sci. 2014, 20, 202–215. [Google Scholar] [CrossRef]
  27. Gonzalez, R.E.; Soto, V.C.; Sance, M.M.; Camargo, A.B.; Galmarini, C.R. Variability of solids, organosulfur compounds, pungency and health-enhancing traits in garlic (Allium sativum L.) cultivars belonging to different ecophysiological groups. J. Agric. Food Chem. 2009, 57, 10282–10288. [Google Scholar] [CrossRef]
  28. Singh, L.; Kaul, V.; Gohil, R.N. Analysis of morphological variability in the Indian germplasm of Allium sativum L. Plant Syst. Evol. 2014, 300, 245–254. [Google Scholar] [CrossRef]
  29. Mann, L.K. Anatomy of the garlic bulb and factors affecting bulb development. Hilgardia 1952, 21, 195–251. [Google Scholar] [CrossRef] [Green Version]
  30. Bradford, M.M. A rapid and sensitive method for the quantitation of microgram quantities of protein utilizing the principle of protein-dye binding. Anal. Biochem. 1976, 72, 248–254. [Google Scholar] [CrossRef]
  31. Fei, M.L.I.; Tong, L.I.; Wei, L.I.; De Yang, L. Changes in antioxidant capacity, levels of soluble sugar, total polyphenol, organosulfur compound and constituents in garlic clove during storage. Ind. Crops Prod. 2015, 69, 137–142. [Google Scholar] [CrossRef]
  32. McCready, R.M.; Guggolz, J.; Silviera, V.; Owens, H.S. Determination of starch and amylase in vegetables. Anal. Chem. 1950, 22, 1156–1158. [Google Scholar] [CrossRef]
  33. Miller, G.N. Use of dinitrosalicylic acid reagent for determination of reducing sugars. Anal. Chem. 1959, 31, 426–428. [Google Scholar] [CrossRef]
  34. Handel, E.V. Direct micro determination of sucrose. Anal. Biochem. 1968, 22, 280–283. [Google Scholar] [CrossRef]
  35. Ashwell, G. Methods in Enzymology. In Methods in Enzymol; Colowick, S.J., Kaplan, N.O., Eds.; Academic Press: New York, NY, USA, 1957; Volume 3, p. 75. [Google Scholar]
  36. Singleton, V.; Rossi, J.A. Colorimetry of total phenolics with phosphomolybdic-phosphotungstic acid reagents. Am. J. Enol. Vitic. 1965, 16, 144–158. [Google Scholar]
  37. Yong, S.P.; Soon, T.J.; Seong, G.K.; Buk, G.H.; Patricia, A.A.; Fernando, T. Antioxidants and proteins in ethylene-treated kiwifruits. Food Chem. 2008, 107, 640–648. [Google Scholar]
  38. Rabinowitch, H.D. Onions and other edible Alliums. In Handbook of Flowering; Halevy, A.H., Ed.; CRC Press: Boca Raton, FL, USA, 1985; pp. 398–409. [Google Scholar]
  39. Rabinowitch, H.D. Physiology of flowering. In Onions and Allied Crops, I: Botany, Physiology and Genetics; Rabinowitch, H.D., Brewster, J.L., Eds.; CRC Press: Boca Raton, FL, USA, 1990; pp. 398–409. [Google Scholar]
  40. Kamenetsky, R.; Rabinowitch, H.D. Florogenesis. In Allium Crop Science: Recent Advances; Rabinowitch, H.D., Currah, L., Eds.; CAB International: Wallingford, UK, 2002; pp. 31–57. [Google Scholar]
  41. Khokhar, K.M.; Hadley, P.; Pearson, S. Effect of photoperiod and temperature on inflorescence appearance and subsequent development towards flowering in onion raised from sets. Sci. Hortic. 2007, 112, 9–15. [Google Scholar] [CrossRef]
  42. Brewster, J.L. Onions and other Vegetable Alliums, 2nd ed.; CABI Publishing: Wallingford, UK, 2008; p. 432. [Google Scholar]
  43. Dong, Y.; Cheng, Z.; Meng, H.; Liu, H.; Wu, C.; Khan, A.R. The effect of cultivar, sowing date and transplant location in field on bolting of welsh onion (Allium fistulosum L.). BMC Plant Biol. 2013, 13, 154. [Google Scholar] [CrossRef] [Green Version]
  44. Benschop, M.; Kamenetsky, R.; Le Nard, M.; Okubo, H.; De Hertogh, A. The global flower bulb industry: Production, utilization, and research. Hortic. Rev. 2010, 36, 1–115. [Google Scholar]
  45. Wu, C.; Wang, M.; Dong, Y.; Cheng, Z.; Meng, H. Effect of plant age and vernalization on bolting, plant growth and enzyme activity of garlic (Allium sativum L.). Sci. Hortic. 2016, 201, 295–305. [Google Scholar] [CrossRef]
  46. Brewster, J.L. The physiology of the onion. Hortic. Abstr. 1977, 47, 17–23. [Google Scholar]
  47. Burba, J.L.; Riera, P.G. Characterization, adaptation and selection of garlic germplasm (Allium sativum L.) through the management of dormancy in Mendoza, Argentina. First International Symposium on Edible Alliaceae. Acta Hortic. 1997, 433, 151–164. [Google Scholar]
  48. Panthee, D.R.; KC, R.B.; Regmi, H.N.; Subedi, P.P.; Bhattarai, S.; Dhakal, J. Diversity analysis of garlic (Allium sativum L.) germplasms available in Nepal based on morphological characters. Genet. Resour. Crop Evol. 2006, 53, 205–212. [Google Scholar] [CrossRef]
  49. Finkelstein, R.R.; Gibson, S. ABA and sugar interactions regulating development: Cross-talk or voices in a crowd? Curr. Opin. Plant Biol. 2001, 5, 26–32. [Google Scholar] [CrossRef]
  50. Zheng, J.; Yang, B.; Toumasjukka, S.; Ou, S.; Kallio, H. Effects of latitude and weather conditions on contents of sugars, fruit acids, and ascorbic acid in black currant (Ribes nigrum L.) juice. J. Agric. Food Chem. 2009, 57, 2977–2987. [Google Scholar] [CrossRef]
  51. Zheng, J.; Kallio, H.; Yang, B. Effects of latitude and weather conditions on sugars, fruit acids and ascorbic acid in currant (Ribes sp.) cultivars. J. Sci. Food Agric. 2009, 89, 2011–2023. [Google Scholar] [CrossRef]
  52. Zheng, J.; Yang, B.; Trepanier, M.; Kallio, H. Effects of genotype, latitude, and weather conditions on the composition of sugars, sugar alcohols, fruit acids, and ascorbic acid in sea buckthorn (Hippophaerhamnoides ssp. mongolica) berry juice. J. Agric. Food Chem. 2012, 60, 3180–3189. [Google Scholar] [CrossRef]
  53. Rosa, E.; David, M.; Gomes, M. Glucose, fructose and sucrose content in broccoli, white cabbage and Portuguese cabbage grown in early and late seasons. J. Sci. Food Agric. 2001, 81, 1145–1149. [Google Scholar] [CrossRef]
  54. Beato, V.M.; Orgaz, F.; Mansilla, F.; Montano, A. Changes in phenolic compounds in garlic (Allium sativum L.) owing to the cultivar and location of growth. Plant Foods Hum. Nutr. 2011, 66, 218–223. [Google Scholar] [CrossRef] [PubMed]
  55. Younis, M.E.; Hasaneen, M.N.A.; Abdel-Aziz, H.M.M. An enhancing effect of visible light and UV radiation on phenolic compounds and various antioxidants in broad bean seedlings. Plant Signal. Behav. 2010, 5, 1197–1230. [Google Scholar] [CrossRef] [PubMed] [Green Version]
  56. Swieca, M.; Gawlik-Dziki, U.; Kowalczyk, D.; Zlotek, U. Impact of germination time and type of illumination on the antioxidant compounds and antioxidant capacity of Lens culinaris sprouts. Sci. Hortic. 2012, 140, 87–95. [Google Scholar] [CrossRef]
  57. Lanzotti, V.; Scala, F.; Bonanomi, G. Compounds from Allium species with cytotoxic and antimicrobial activity. Phytochem. Rev. 2014, 13, 769–791. [Google Scholar] [CrossRef]
  58. Volk, G.M.; Stern, D. Phenotypic characteristics of ten garlic cultivars grown at different North American locations. HortScience 2009, 44, 1238–1247. [Google Scholar] [CrossRef] [Green Version]
  59. Pardo, J.E.; Escribano, J.; Gomez, R.; Alvarruiz, A. Physical-chemical and sensory quality evaluation of garlic cultivars. J. Food Qual. 2007, 30, 609–622. [Google Scholar] [CrossRef]
Figure 1. Bulbing index of cvs. G103 (A), G024 (B), and G2011-5 (C). Numbers (1–15) indicate 1: L8T20, 2: L8T25, 3: L8T30, 4: L10T20, 5: L10T25, 6: L10T30, 7: L12T20, 8: L12T25, 9: L12T30, 10: L14T20, 11: L14T25, 12: L14T30, 13: L16T20, 14: L16T25, 15: L16T30; Different letters indicate significant differences at p < 0.05 (ANOVA and Tukey HSD test); means ± SD.
Agronomy 09 00879 g001
Figure 2. Total soluble solid (TSS) (%) of cvs. G103 (A), G024 (B), and G2011-5 (C). Numbers (1–15) indicate 1: L8T20, 2: L8T25, 3: L8T30, 4: L10T20, 5: L10T25, 6: L10T30, 7: L12T20, 8: L12T25, 9: L12T30, 10: L14T20, 11: L14T25, 12: L14T30, 13: L16T20, 14: L16T25, 15: L16T30; Different letters indicate significant differences at p < 0.05 (ANOVA and Tukey HSD test); means ± SD.
Agronomy 09 00879 g002
Figure 3. Soluble protein content (mg g−1) of cvs. G103 (A), G024 (B), and G2011-5 (C). Numbers (1–15) indicate 1: L8T20, 2: L8T25, 3: L8T30, 4: L10T20, 5: L10T25, 6: L10T30, 7: L12T20, 8: L12T25, 9: L12T30, 10: L14T20, 11: L14T25, 12: L14T30, 13: L16T20, 14: L16T25, 15: L16T30 Different letters indicate significant differences at p < 0.05 (ANOVA and Tukey HSD test); means ± SD.
Agronomy 09 00879 g003
Figure 4. Soluble sugar content (%) of cvs. G103 (A), G024 (B), and G2011–5 (C). Numbers (1–15) indicate 1: L8T20, 2: L8T25, 3: L8T30, 4: L10T20, 5: L10T25, 6: L10T30, 7: L12T20, 8: L12T25, 9: L12T30, 10: L14T20, 11: L14T25, 12: L14T30, 13: L16T20, 14: L16T25, 15: L16T30 Different letters indicate significant differences at p < 0.05 (ANOVA and Tukey HSD test); means ± SD.
Agronomy 09 00879 g004
Figure 5. Total sugar content (mg g−1) of cvs. G103 (A), G024 (B), and G2011-5 (C). Numbers (1–15) indicate 1: L8T20, 2: L8T25, 3: L8T30, 4: L10T20, 5: L10T25, 6: L10T30, 7: L12T20, 8: L12T25, 9: L12T30, 10: L14T20, 11: L14T25, 12: L14T30, 13: L16T20, 14: L16T25, 15: L16T30 Different letters indicate significant differences at p < 0.05 (ANOVA and Tukey HSD test); means ± SD.
Agronomy 09 00879 g005
Figure 6. Glucose content (%) of cvs. G103 (A), G024 (B) and G2011–5 (C). Numbers (1–15) indicate 1: L8T20, 2: L8T25, 3: L8T30, 4: L10T20, 5: L10T25, 6: L10T30, 7: L12T20, 8: L12T25, 9: L12T30, 10: L14T20, 11: L14T25, 12: L14T30, 13: L16T20, 14: L16T25, 15: L16T30 Different letters indicate significant differences at p < 0.05 (ANOVA and Tukey HSD test); means ± SD.
Agronomy 09 00879 g006
Figure 7. Sucrose content (mg g−1) of cvs. G103 (A), G024 (B), and G2011-5 (C). Numbers (1–15) indicate 1: L8T20, 2: L8T25, 3: L8T30, 4: L10T20, 5: L10T25, 6: L10T30, 7: L12T20, 8: L12T25, 9: L12T30, 10: L14T20, 11: L14T25, 12: L14T30, 13: L16T20, 14: L16T25, 15: L16T30 Different letters indicate significant differences at p < 0.05 (ANOVA and Tukey HSD test); means ± SD.
Agronomy 09 00879 g007
Figure 8. Fructose content (%) of cvs. G103 (A), G024 (B), and G2011-5 (C). Numbers (1–15) indicate 1: L8T20, 2: L8T25, 3: L8T30, 4: L10T20, 5: L10T25, 6: L10T30, 7: L12T20, 8: L12T25, 9: L12T30, 10: L14T20, 11: L14T25, 12: L14T30, 13: L16T20, 14: L16T25, 15: L16T30 Different letters indicate significant differences at p < 0.05 (ANOVA and Tukey HSD test); means ± SD.
Agronomy 09 00879 g008
Figure 9. Starch content (mg g−1) of cvs. G103 (A), G024 (B), and G2011-5 (C). Numbers (1–15) indicate 1: L8T20, 2: L8T25, 3: L8T30, 4: L10T20, 5: L10T25, 6: L10T30, 7: L12T20, 8: L12T25, 9: L12T30, 10: L14T20, 11: L14T25, 12: L14T30, 13: L16T20, 14: L16T25, 15: L16T30 Different letters indicate significant differences at p < 0.05 (ANOVA and Tukey HSD test); means ± SD.
Agronomy 09 00879 g009
Figure 10. Total phenol content (mg g−1) of cvs. G103 (A), G024 (B), and G2011-5 (C). Numbers (1–15) indicate 1: L8T20, 2: L8T25, 3: L8T30, 4: L10T20, 5: L10T25, 6: L10T30, 7: L12T20, 8: L12T25, 9: L12T30, 10: L14T20, 11: L14T25, 12: L14T30, 13: L16T20, 14: L16T25, 15: L16T30 Different letters indicate significant differences at p < 0.05 (ANOVA and Tukey HSD test); means ± SD.
Agronomy 09 00879 g010
Figure 11. Total flavonoid content (mg g−1) of cvs. G103 (A), G024 (B), and G2011-5 (C). Numbers (1–15) indicate 1: L8T20, 2: L8T25, 3: L8T30, 4: L10T20, 5: L10T25, 6: L10T30, 7: L12T20, 8: L12T25, 9: L12T30, 10: L14T20, 11: L14T25, 12: L14T30, 13: L16T20, 14: L16T25, 15: L16T30 Different letters indicate significant differences at p < 0.05 (ANOVA and Tukey HSD test); means ± SD.
Agronomy 09 00879 g011
Table 1. Effects of photoperiod and temperature treatments on plant morphological traits, bulb characteristics, growth period, and bulbing index of three garlic cultivars.
TreatmentPlant Standing Height (cm)Fresh Weight (g)Pseudostem Diameter (mm)Bulb Diameter (mm)Bulb Weight (g)Bulb Height (mm)Growth Period (day)Bulbing Index
Grand mean72.841.3613.230.525.8344.174.52.34
Cultivar
G10376.7 a43.41 a14.5 a32.7 a28.08 a46.5 a73.8 b2.29 c
G02468.9 c39.55 c11.8 c28.2 c24.03 c41.6 c73.0 c2.39 a
G2011-572.7 b41.11 b13.3 b30.6 b25.36 b44.1 b76.5 a2.33 a
Photoperiod (light/dark)
8/16 hr70.9 e40.34 d12.3 d24.2 e24.93 e42.8 d92.9 a1.98 d
10/14hr72.1 d40.13 e12.6 c28.2 d25.72 c43.5 c82.1 b2.28 c
12/12hr72.9 c41.40 c13.3 b32.5 c27.19 a44.0 b72.1 c2.48 a
14/10hr74.3 a42.86 a13.9 a34.0 a25.82 b45.0 a59.1 e2.49 a
16/8hr73.7 b42.05 b13.9 a33.5 b25.47 d45.0 a66.00 d2.44 b
Temperature (light/dark)
20/15 °C82.2 a38.02 c15.0 a28.3 c26.00 b41.00 c86.0 a1.89 c
25/18 °C67.7 c39.10 b12.5 b30.7 b26.37 a41.5 b72.3 b2.45 b
30/20 °C68.5 b46.95 a12.1 c32.4 a25.11 c49.75 a65.1 c2.67 a
F-test
Cultivar (C)************************
Photoperiod (L)************************
Temperature (T)************************
C × L************************
C × T************************
L × T************************
C × L × T**********************
Different letters indicate significant differences between means within columns of cultivar, photoperiod and temperature at p < 0.05 by Tukey HSD test. * p < 0.05, *** p < 0.001.
Table 2. Interaction of photoperiod and temperature treatments on plant morphology of three garlic cultivars.
TreatmentG103G024G2011-5
Photoperiod
(light/dark)
Temperature
(light/dark)
Plant Standing Height (cm)Fresh Weight (g)Pseudostem Diameter (mm)Plant Standing Height (cm)Fresh Weight (g)Pseudostem Diameter (mm)Plant Standing Height (cm)Fresh Weight (g)Pseudostem Diameter (mm)
8/16 hr20/15 °C83.0 e38.26 m15.4 d76.0 c35.35 l12.3 d80.6 d36.54 n14.4 c
25/18 °C68.2 l39.58 k12.8 i63.8 ef36.87 i10.2 h66.3 k38.47 i11.8 g
30/20 °C69.1 k47.50 e12.3 j63.4 f44.33 d9.9 i67.2 i46.19 c11.2 h
10/14 hr20/15 °C86.2 d38.81 l15.5 d77.2 bc35.93 k13.1 c80.9 d36.90 m14.3 c
25/18 °C71.1 j39.91 jk12.9 i63.3 f36.31 j10.9 g66.8 j37.21 m14.3 g
30/20 °C71.9 i47.91 d12.7 i64.3 ef43.58 e10.4 h67.5 hi44.62 e11.7 g
12/12 hr20/15 °C87.3 c40.24 j16.6 c77.5 bc36.35 j13.5 b82.0 c37.92 k15.4 b
25/18 °C72.0 i41.21 h13.8 g64.0 ef37.82 g11.3 f67.7 h38.21 j12.8 e
30/20 °C72.6 h49.58 c13.3 h64.8 def45.41 b10.9 g68.4 g45.81 d12.3 f
14/10 hr20/15 °C88.6 a41.22 h17.3 b79.6 a37.22 h14.4 a83.8 a39.22 h15.9 a
25/18 °C73.2 g42.62 f14.4 f64.9 def38.67 f11.9 e68.9 f40.51 f13.3 d
30/20 °C73.8 f51.31 a13.9 g66.4 d46.38 a11.3 f69.8 e48.62 a12.8 e
16/8 hr20/15 °C88.1 b40.83 i17.6 a78.4 ab36.89 i14.3 a83.0 b38.63 i15.5 b
25/18 °C72.5 h41.90 g14.7 e64.6 ef37.30 h11.9 e68.5 g39.90 g12.9 e
30/20 °C73.4 g50.32 b13.9 g65.4 de44.81 c11.5 f69.2 f47.88 b12.9 e
Different letters indicate significant differences between means within columns of photoperiod and temperature combinations of three garlic cultivars at p < 0.05 by Tukey HSD test.
Table 3. Interaction of photoperiod and temperature treatments on bulb characteristics and growth period of three garlic cultivars.
TreatmentG103G024G2011-5
Photoperiod (h)
(light/dark)
Temperature (°C)
(light/dark)
Bulb Diameter (mm)Bulb Weight (g)Bulb Height (mm)Growth Period (day)Bulb Diameter (mm)Bulb Weight (g)Bulb Height (mm)Growth Period (day)Bulb Diameter (mm)Bulb Weight (g)Bulb Height (mm)Growth Period (day)
8/1620/1525.3 m27.91 ef42.0 l109.5 a19.2 l23.93 fg37.6 l103.9 a22.6 m25.91 e39.8 l99.2 a
25/1827.4 l28.43 cd42.5 k76.3 ef20.8 k24.28 ef38.1 jk100.0 b24.4 l26.26 d40.3 k97.9 a
30/2028.7 k23.72 i51.0 d76.6 ef24.0 i21.55 l45.7 d84.1 cd25.6 k22.36 k48.3 e89.1 b
10/1420/1528.9 k27.73 g42.8 j100.2 b21.8 j23.69 gh38.3 j86.3 c26.9 j25.71 ef40.5 k90.9 b
25/1831.2 j28.19 fg43.5 h82.9 cd25.8 h23.92 g38.0 k76.8 f29.1 i25.93 e41.0 j83.2 c
30/2032.7 h33.78 a52.2 c79.0 de27.1 g20.53 m45.6 d65.8 h30.5 h21.97 l49.2 d74.2 d
12/1220/1532.3 i27.29 g43.1 i84.2 c28.2 f23.24 ij38.7 i80.4 ef30.5 h25.22 g40.9 j88.9 b
25/1834.9 f27.53 fg43.7 gh69.2 gh31.0 d23.52 hi39.1 h63.7 h33.0 e25.61 f41.3 i74.8 d
30/2036.6 c33.36 a52.5 b68.0 h32.0 c28.21 a46.9 c53.5 j34.6 c30.71 a49.6 c66.3 ef
14/1020/1533.2 g28.30 cde43.9 g72.5 fg30.2 de24.33 e39.4 g70.5 g31.9 f26.80 b41.7 h68.7 e
25/1835.9 d29.41 b44.5 e50.0 j32.6 b27.41 b40.4 e58.3 i34.4 c24.64 h42.2 g60.2 g
30/2037.7 a24.89 h53.4 a49.5 j34.2 a22.99 jk48.6 a48.8 k36.2 a23.63 i51.0 a53.6 h
16/820/1532.9 gh28.70 c44.2 f77.6 e29.9 e24.91 d39.8 f81.4 de30.9 g26.32 cd42.0 g76.4 d
25/1835.6 e28.54 cd44.7 e58.3 i32.3 bc25.34 c40.0 f66.3 h33.4 d26.54 c42.5 f65.8 f
30/2037.4 b23.46 i53.6 a53.8 j33.9 a22.68 k48.0 b55.8 ij35.0 b22.78 j50.6 b58.4 g
Different letters indicate significant differences between means within columns of photoperiod and temperature combinations of three garlic cultivars at p < 0.05 by Tukey HSD test.
Table 4. Effects of photoperiod and temperature treatments on bulb physiological and nutritive quality traits of three garlic cultivars.
TreatmentTSS (%)Soluble Protein (mg g−1)Soluble Sugar (%)Total Sugar (mg g−1)Glucose (%)Sucrose (mg g−1)Fructose (%)Starch (mg g−1)Total Phenol (mg g−1)Total Flavonoid (mg g−1)
Grand mean19.337.6226.289.9749.5329.0334.9018.2818.881.41
Cultivar
G10322.50 a7.91 a27.45 a14.94 a61.21 a37.09 a47.21 a23.52 a24.66 a1.82 a
G02416.79 c7.31 c25.14 c6.96 c40.82 c23.57 c24.51 c14.74 c13.82 c0.97 c
G2011-518.70 b7.63 b26.23 b8.80 b46.55 b26.42 b32.98 b16.57 b18.16 b1.45 b
Photoperiod (light/dark)
8/16 hr17.19 d3.54 e11.16 e6.62 e38.42 e22.43 e20.78 e14.23 e14.25 e1.11 e
10/14 hr17.85 c7.11 d24.64 d7.78 d43.54 d24.90 d26.56 d15.51 d16.18 d1.21 d
12/12 hr19.61 b8.41 c28.82 c10.41 c52.02 b28.03 c37.81 c19.14 c18.68 c1.35 c
14/10 hr22.42 a10.00 a35.93 a14.27 a62.59 a36.16 a46.27 a22.24 a25.32 a1.83 a
16/8 hr19.58 b9.02 b30.82 b10.75 b51.07 c33.61 b43.08 b20.26 b19.96 b1.56 b
Temperature (light/dark)
20/15 °C18.28 c6.39 c23.03 c7.90 c43.80 c25.02 b26.27 c15.44 c15.63 c1.35 c
25/18 °C19.54 b7.86 b27.20 b9.76 b49.75 b30.98 a34.66 b18.38 b17.57 b1.40 b
30/20 °C20.18 a8.61 a28.60 a12.23 a55.03 a31.07 a43.77 a21.00 a23.44 a1.47 a
F-test
Cultivar (C)******************************
Photoperiod (L)******************************
Temperature (T)******************************
C × L******************************
C × T******************************
L × T****************************
C × L × T***************************ns
Different letters indicate significant differences between means within columns of photoperiod and temperature treatments of three garlic cultivars at p < 0.05 by Tukey HSD test. * p < 0.05, *** p < 0.001, ns: non-significant.
Table 5. Correlation coefficients between garlic plant pseudostem diameter, bulb characteristics, growth period, bulbing index, and bulb physiological traits.
IndexPDBDBWBHGPBITSSSPCSSCTSCGCSCFCSCTPTF
PD1
BD0.276 **1
BW0.415 ***0.325 ***1
BH−0.0890.597 ***0.1211
GP0.128−0.807 ***0.021−0.514 ***1
BI−0.513 ***0.673 ***−0.0310.586 ***−0.823 ***1
TSS0.403 ***0.716 ***0.437 ***0.545 ***−0.512 ***0.288 ***1
SPC0.0980.879 ***0.1630.448 ***−0.814 ***0.721 ***0.440 ***1
SSC0.216 *0.865 ***0.0940.333 ***−0.806 ***0.616 ***0.571 ***0.357 ***1
TSC0.307 ***0.814 ***0.399 ***0.694 ***−0.633 ***0.463 ***0.557 ***0.260 ***0.823 ***1
GC0.325 ***0.822 ***0.413 ***0.629 ***−0.629 ***0.464 ***0.650 ***0.584 ***0.700 ***0.628 ***1
SC0.298 ***0.801 ***0.383 ***0.596 ***−0.666 ***0.464 ***0.748 ***0.542 ***0.661 ***0.743 ***0.767 ***1
FC0.246 **0.863 ***0.357 ***0.705 ***−0.669 ***0.555 ***0.824 ***0.534 ***0.712 ***0.670 ***0.824 ***0.776 ***1
SC0.283 ***0.816 ***0.397 ***0.686 ***−0.641 ***0.485 ***0.853 ***0.501 ***0.639 ***0.651 ***0.718 ***0.753 ***0.816 ***1
TP0.275 **0.774 ***0.370 ***0.772 ***−0.588 ***0.451 ***0.888 ***0.386 ***0.540 ***0.508 ***0.671 ***0.705 ***0.759 ***0.840 ***1
TF0.593 ***0.766 ***0.441 ***0.539 ***−0.469 ***0.197 *0.828 ***0.590 ***0.506 ***0.423 ***0.683 ***0.741 ***0.767 ***0.767 ***0.824 ***1
* Correlation is significant at the 0.05 level; ** correlation is significant at the 0.01 level; *** correlation is significant at the 0.001 level. PD: pseudostem diameter; BD: bulb diameter; BW: bulb weight; BH: bulb height; GP: growth period; BI: bulbing index; TSS: total soluble solid; SPC: soluble protein content; SSC: soluble sugar content; TSC: total sugar content, TP: total phenol; TF: total flavonoid.

