
Enrofloxacin Dose Optimization for the Treatment of Colibacillosis in Broiler Chickens Using a Drinking Behaviour Pharmacokinetic Model

 ,
,  ,
,
Abstract
:1. Introduction
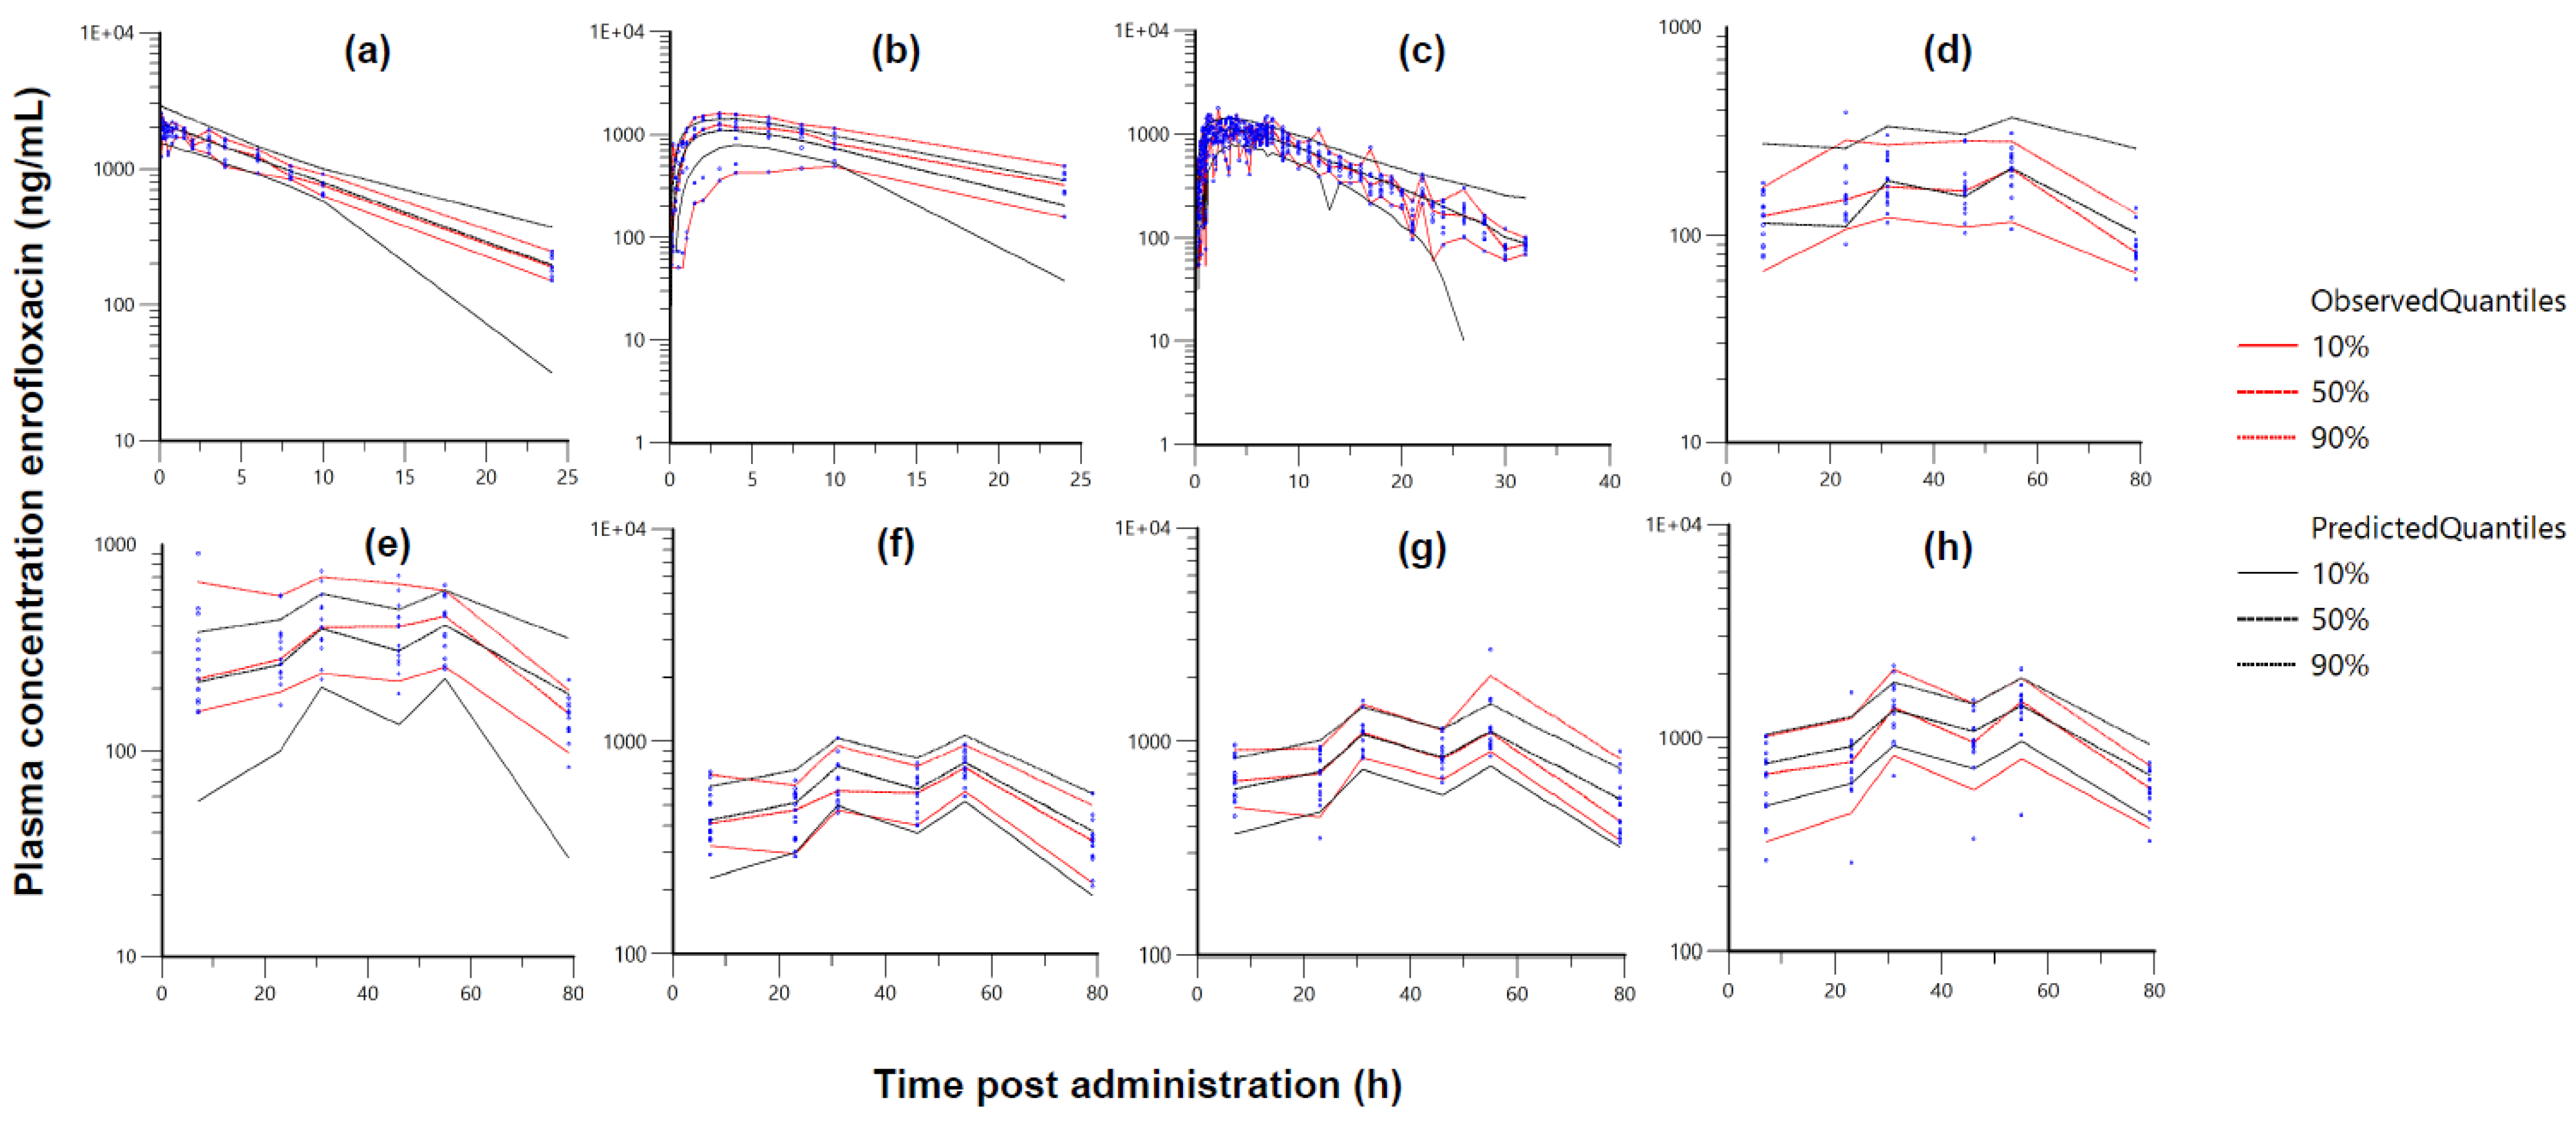
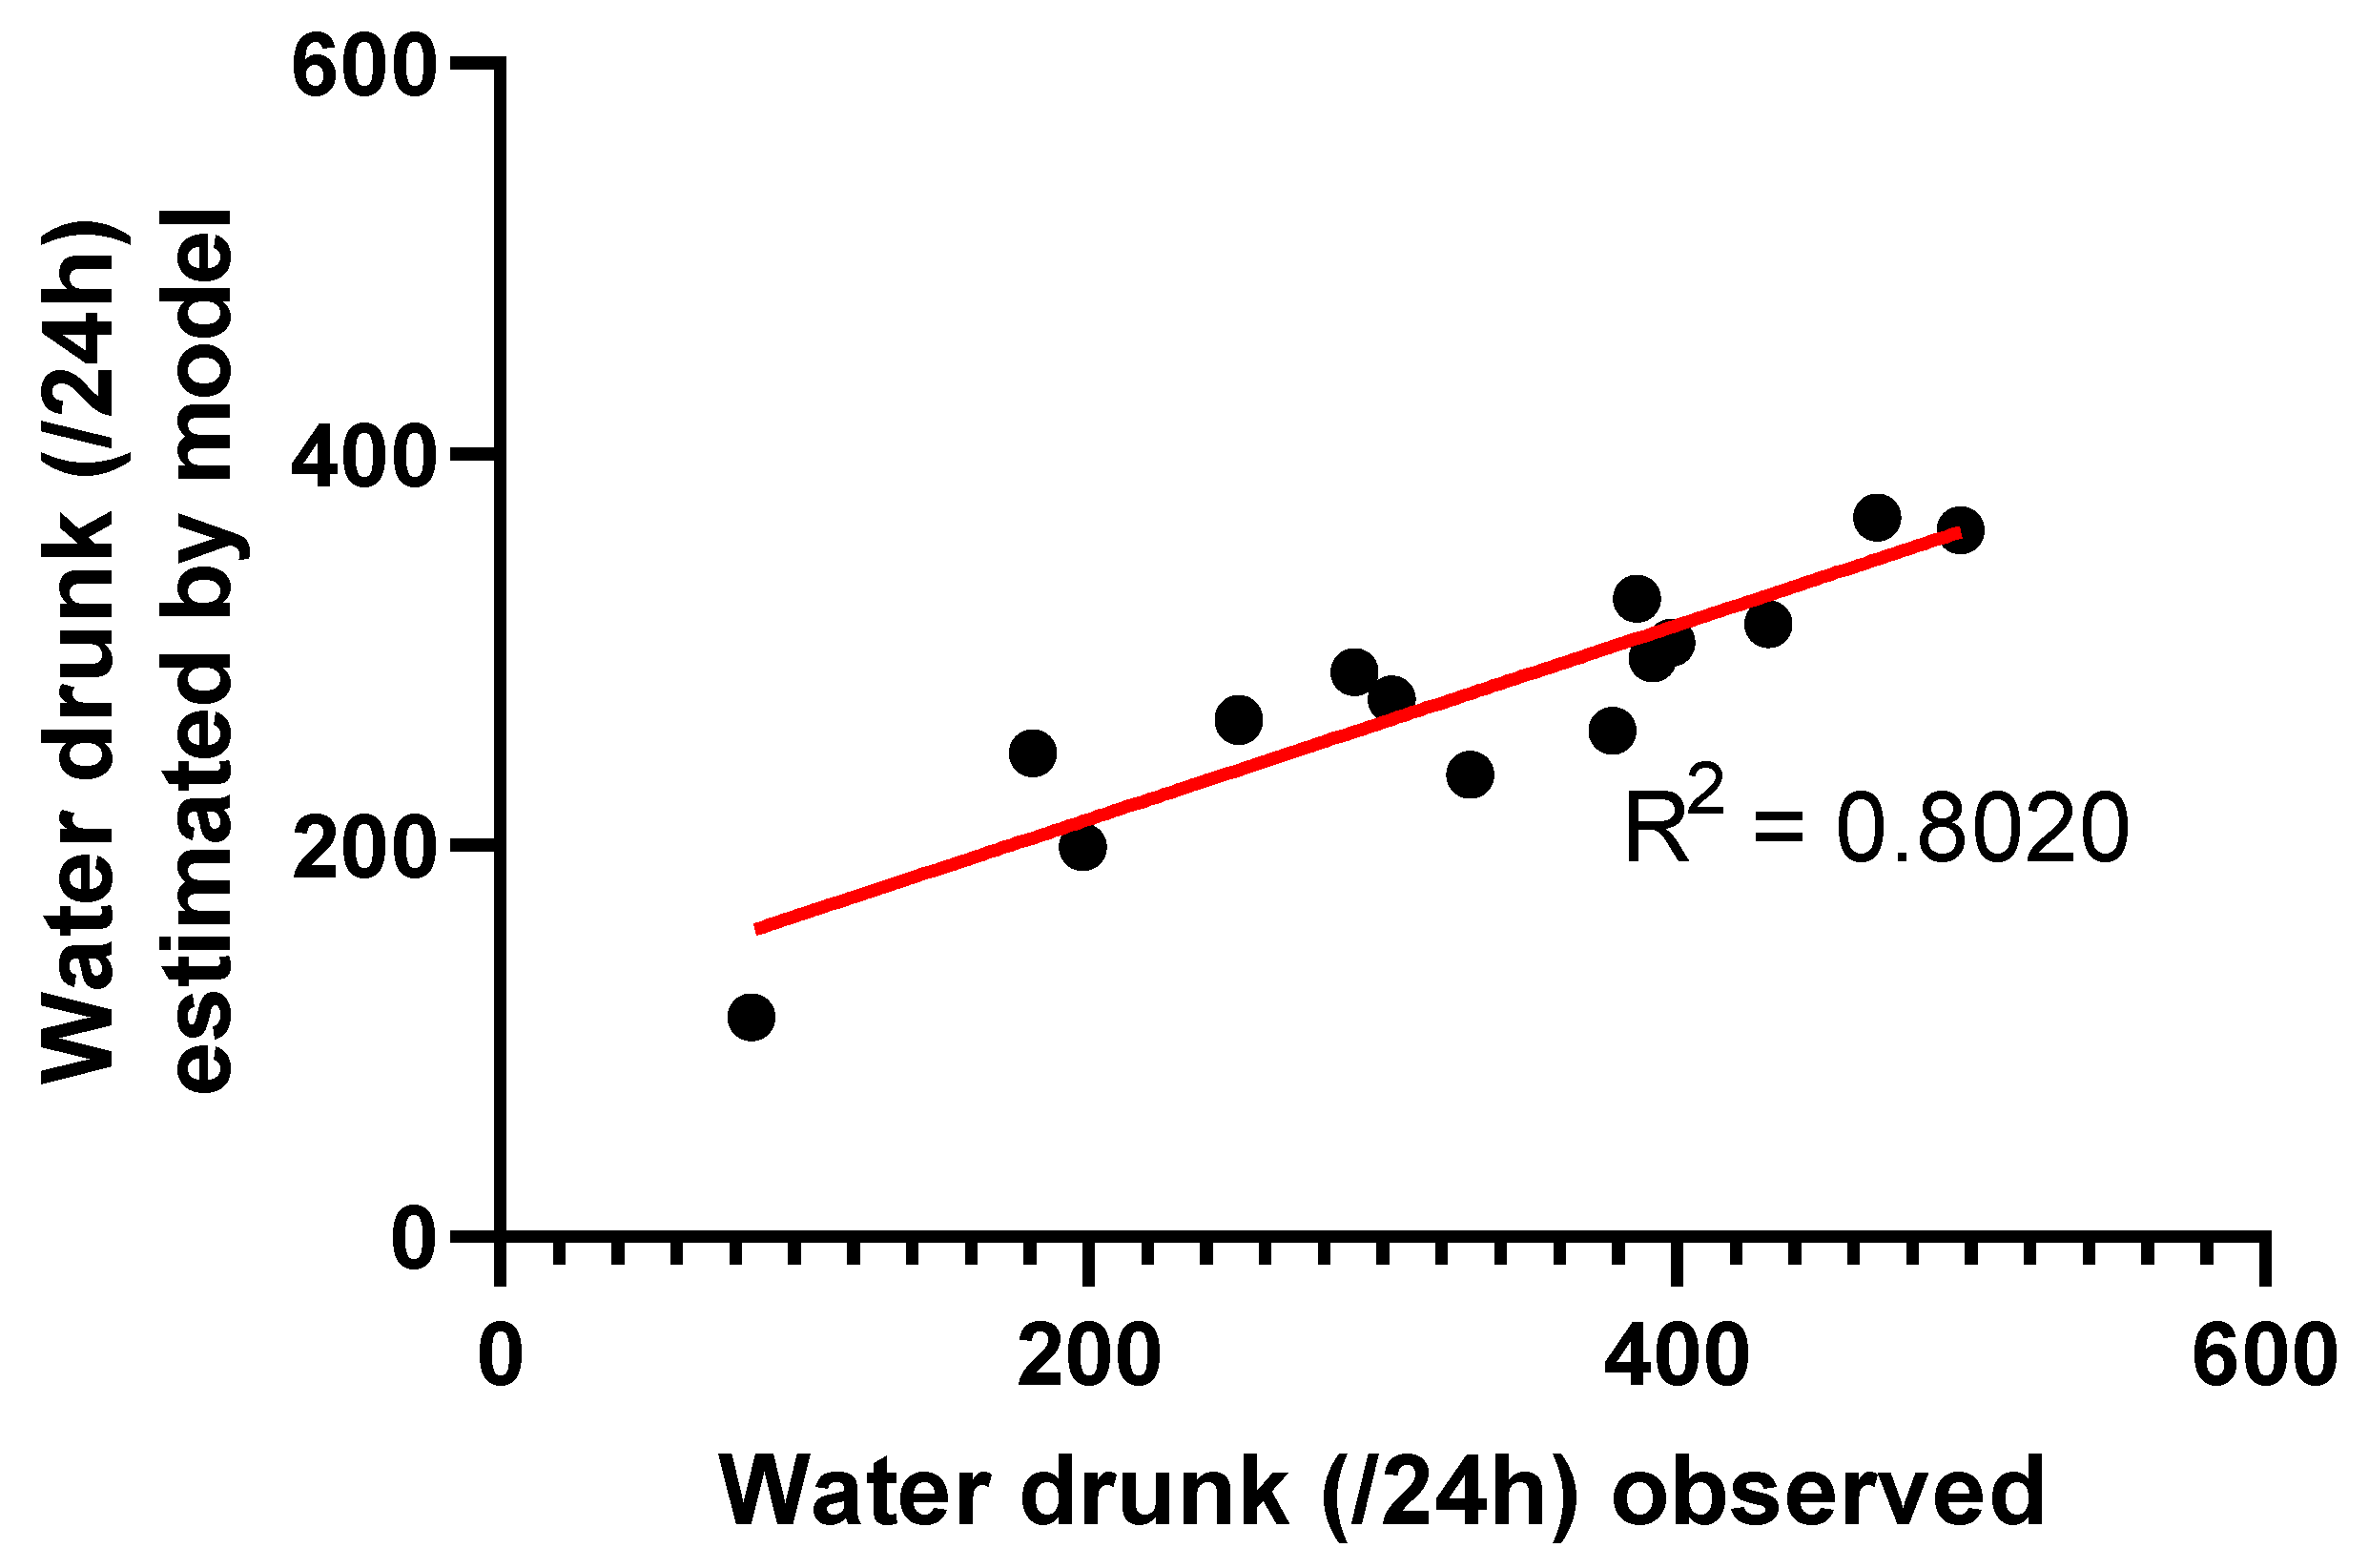
2. Results
3. Discussion
4. Materials and Methods
4.1. Animal Trials
4.2. Quantification of Enrofloxacin in Plasma
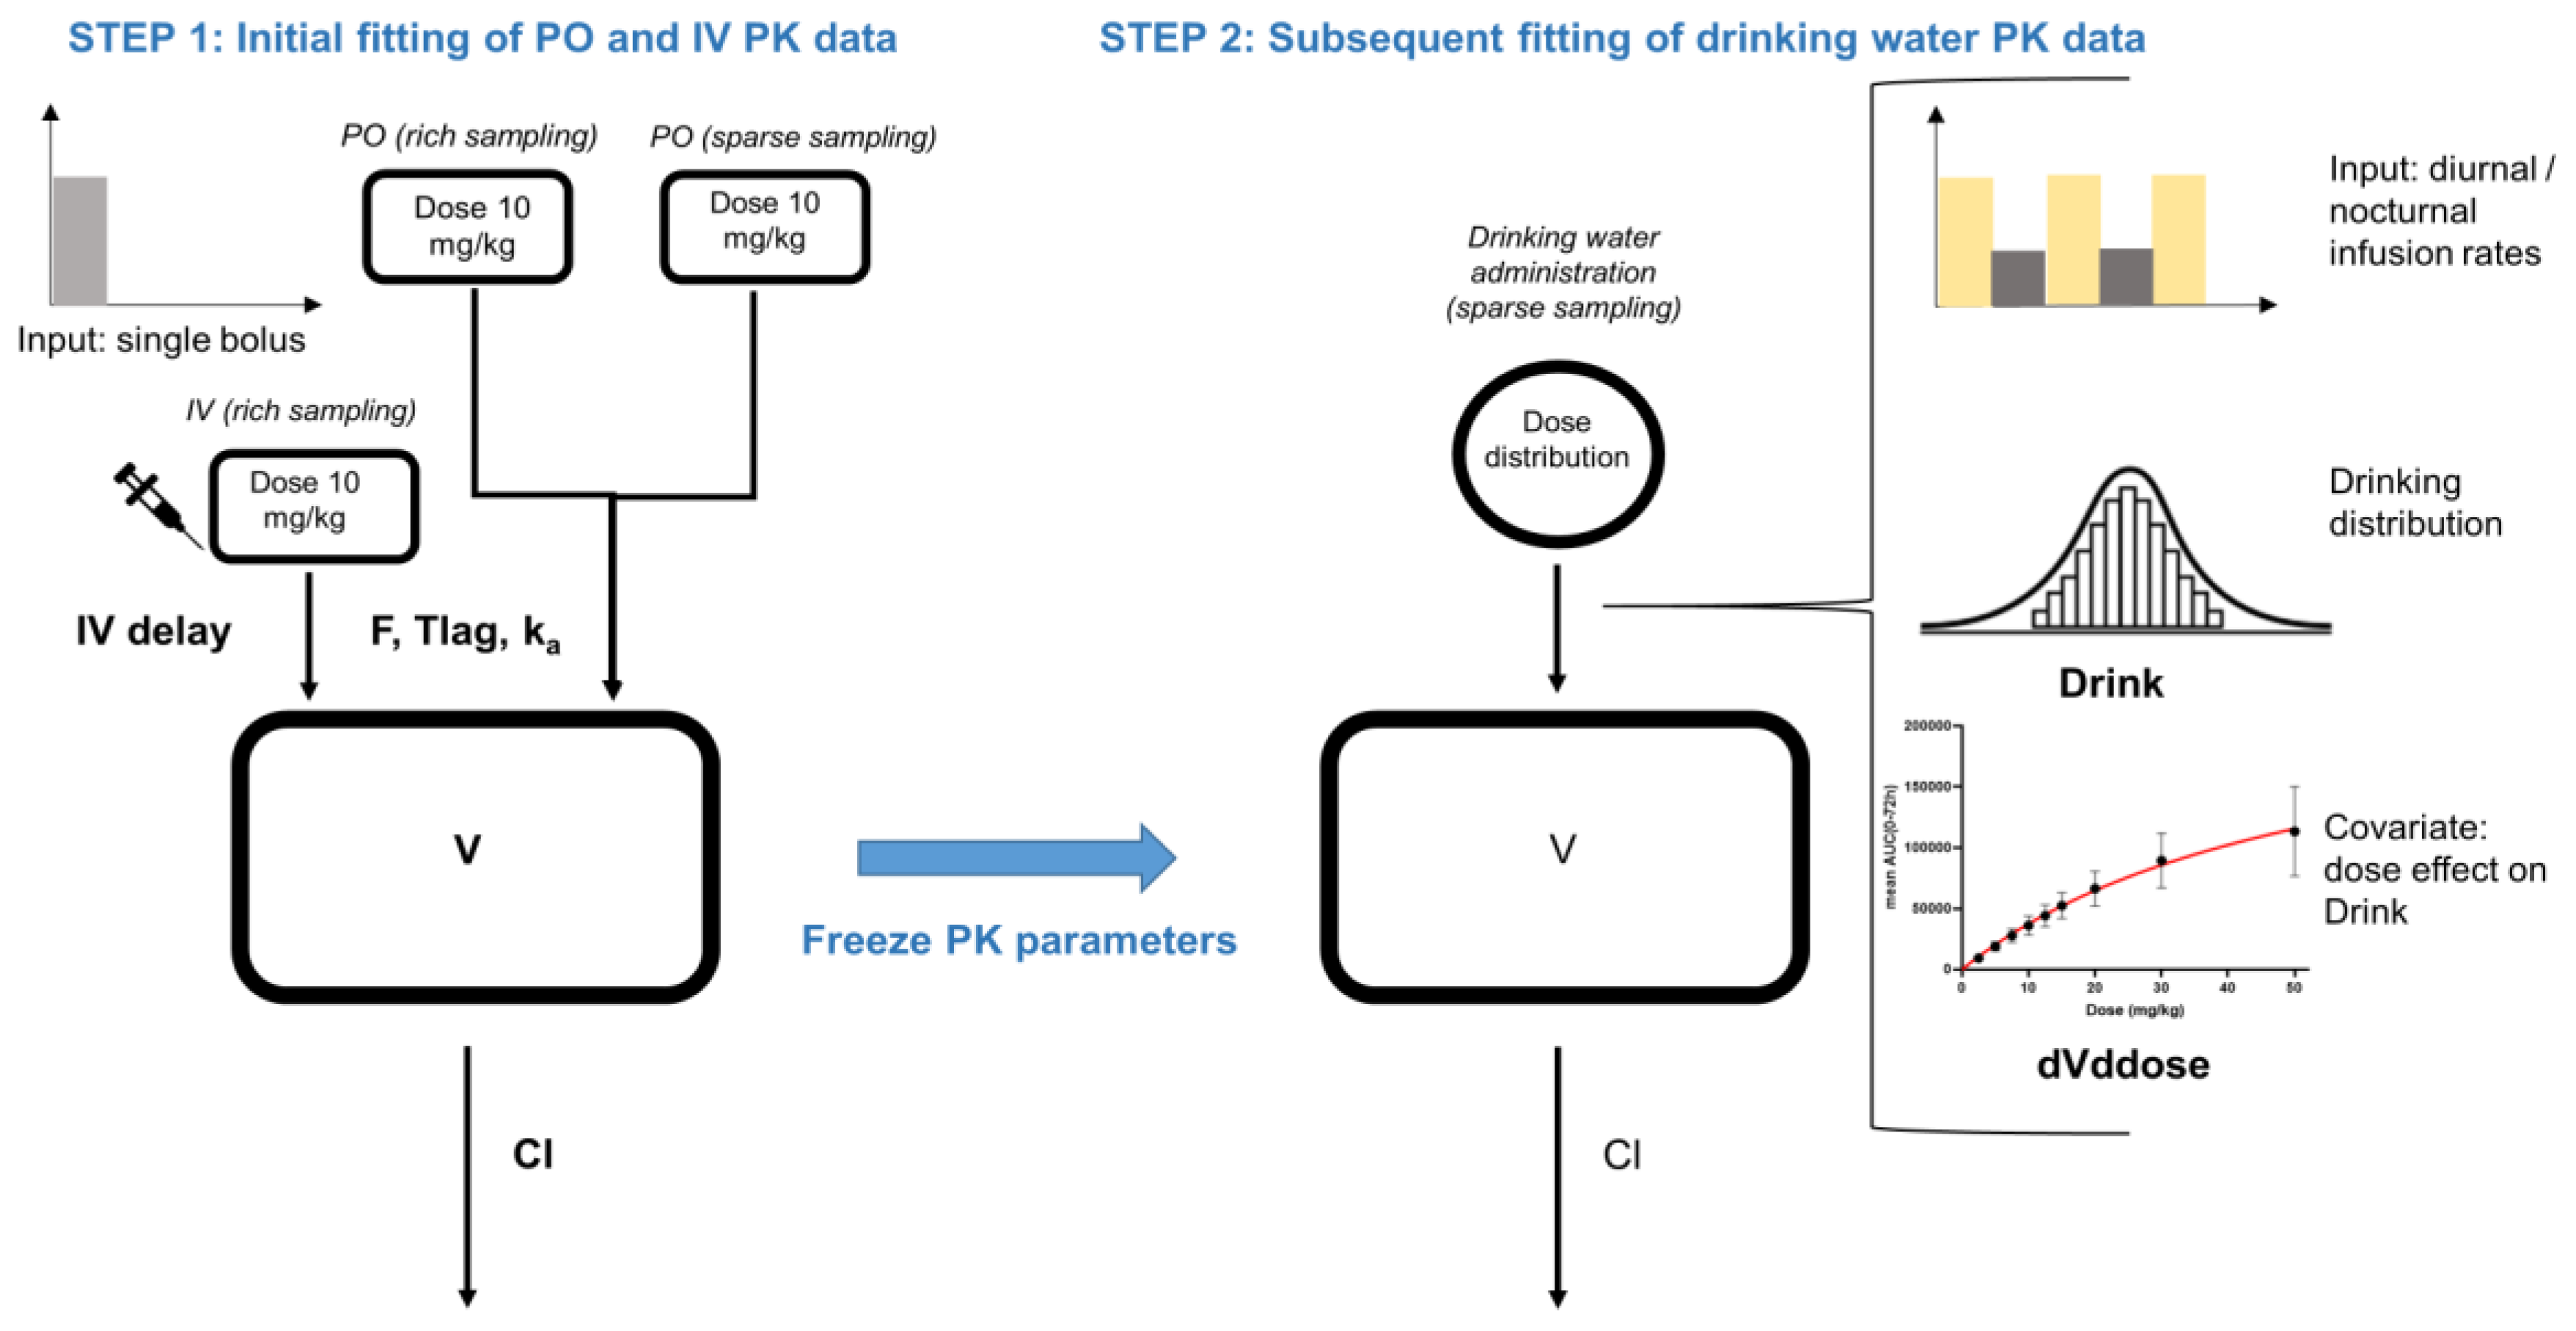
4.3. PK/PD Modelling and Simulation
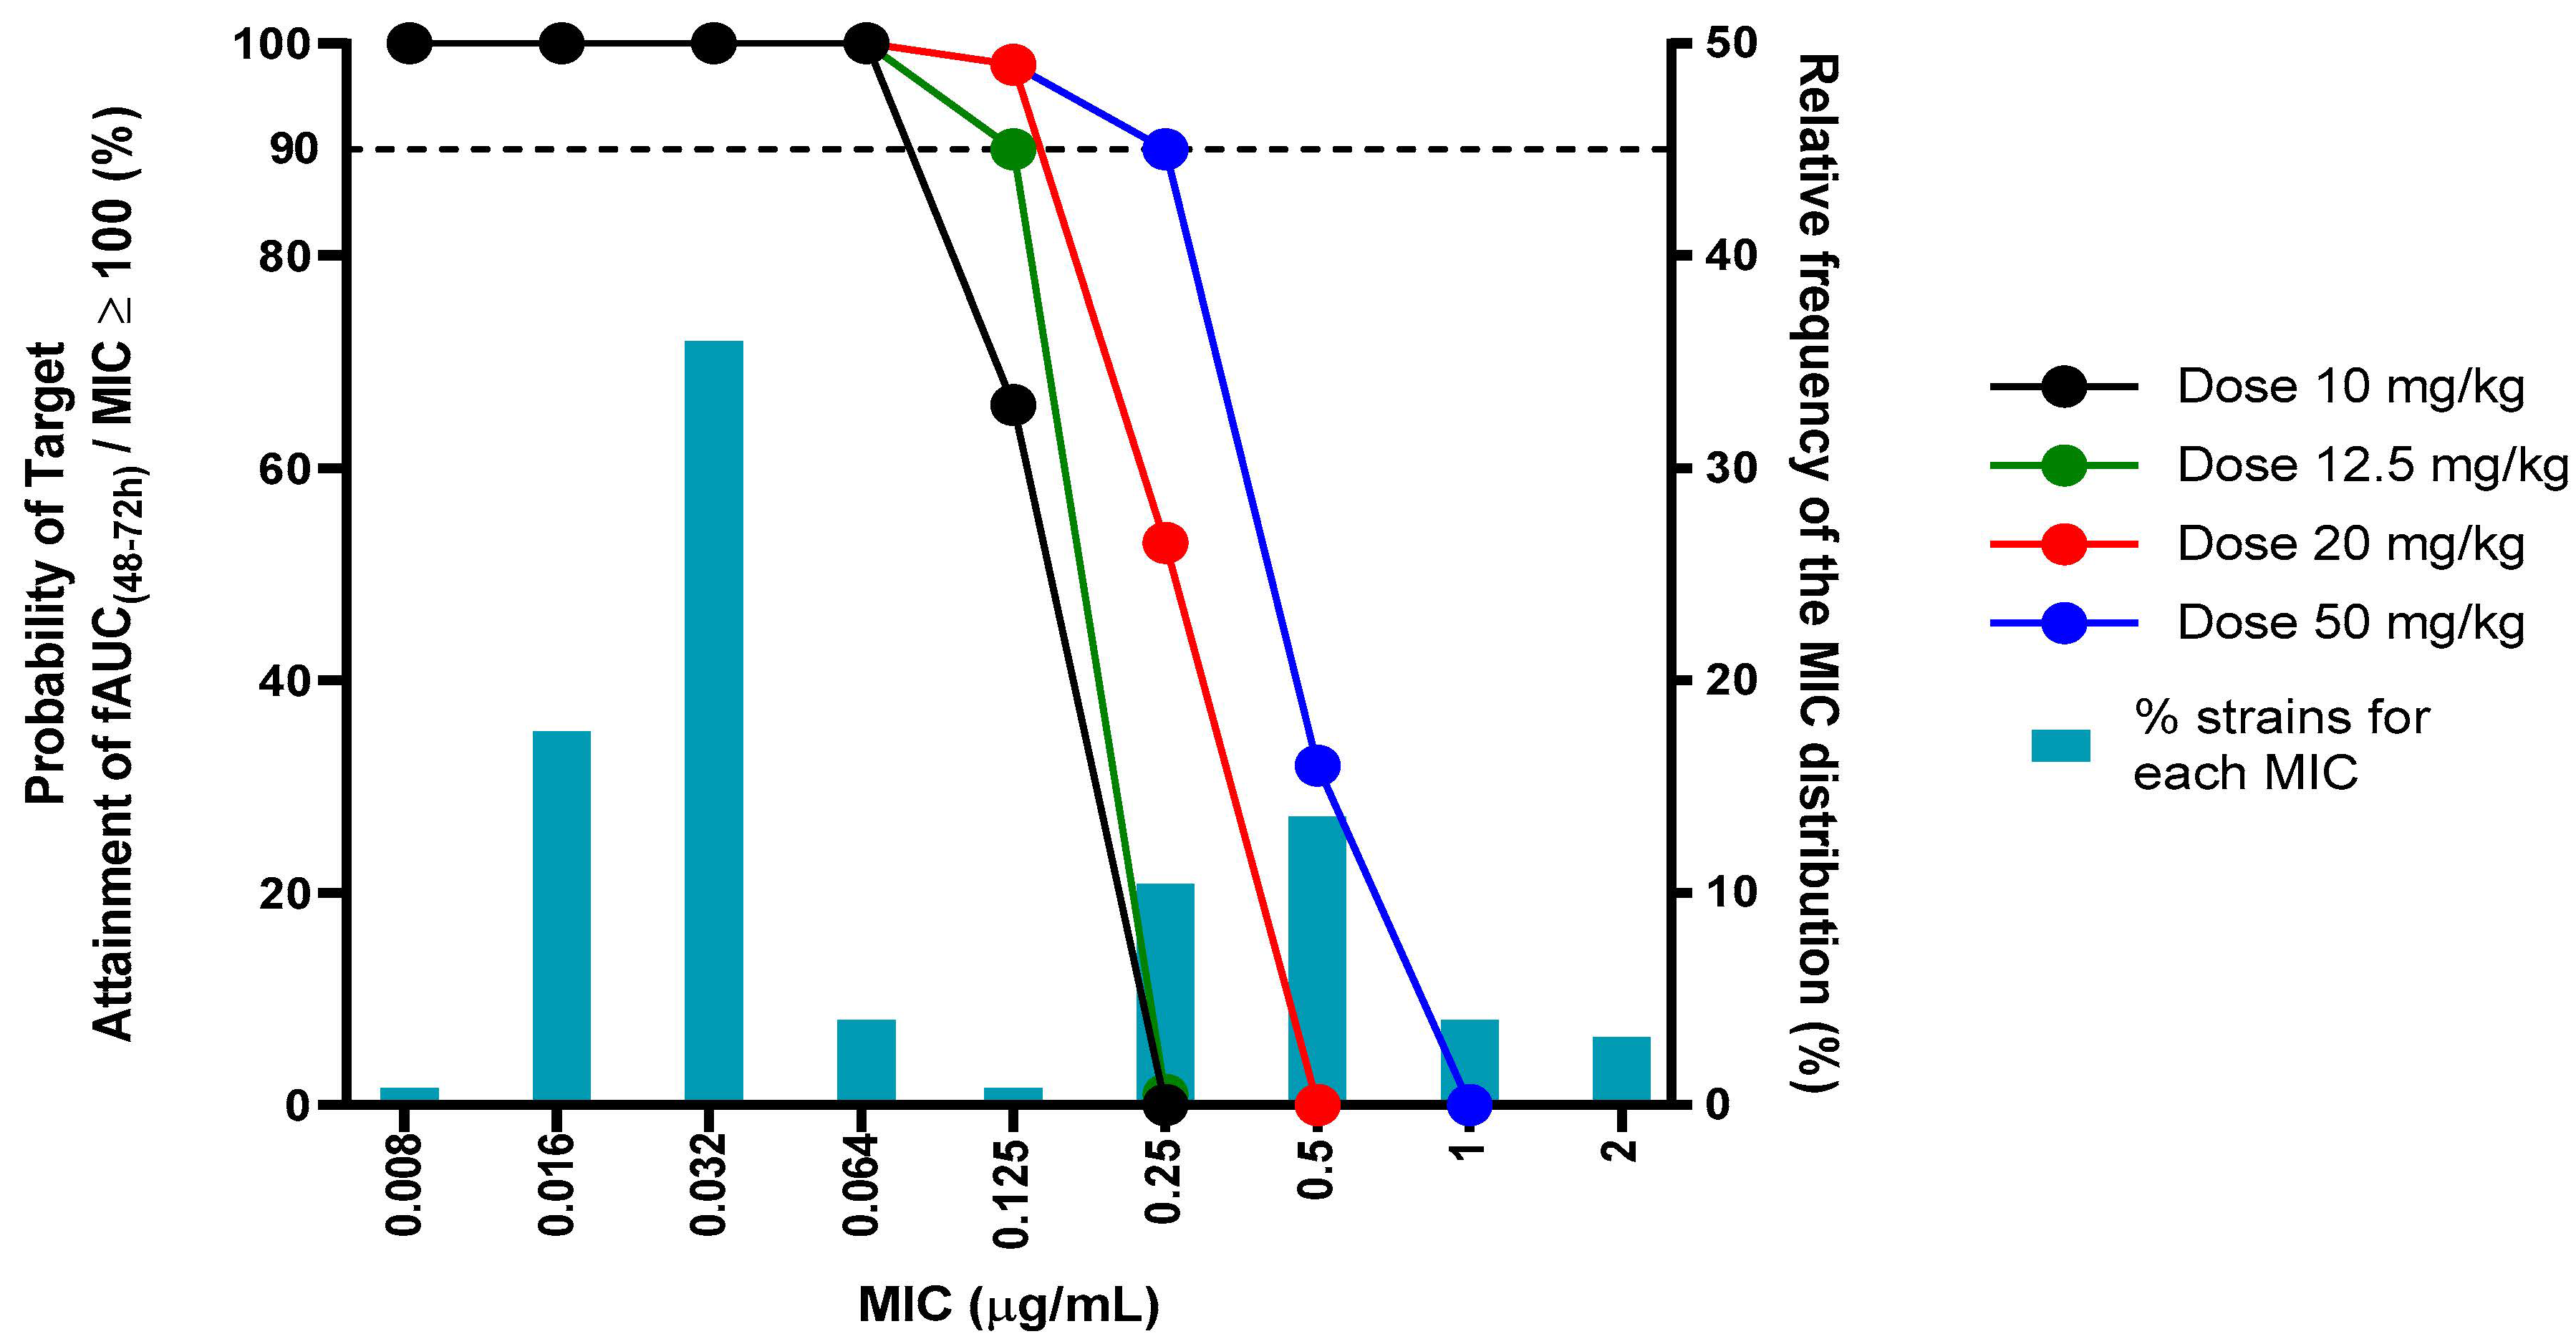
4.4. Simulation and Probability of Target Attainment Analysis
5. Conclusions
Supplementary Materials
Author Contributions
Funding
Institutional Review Board Statement
Informed Consent Statement
Data Availability Statement
Conflicts of Interest
References
- Devreese, M.; Antonissen, G.; De Baere, S.; De Backer, P.; Croubels, S. Effect of administration route and dose escalation on plasma and intestinal concentrations of enrofloxacin and ciprofloxacin in broiler chickens. BMC Vet. Res. 2014, 10, 1–9. [Google Scholar] [CrossRef] [PubMed] [Green Version]
- Li, Q.; Bi, X.; Diao, Y.; Deng, X. Mutant-prevention concentrations of enrofloxacin for Escherichia coli isolates from chickens. Am. J. Vet. Res. 2007, 68, 812–815. [Google Scholar] [CrossRef]
- Joosten, P.; Sarrazin, S.; Van Gompel, L.; Luiken, R.E.C.; Mevius, D.J.; Wagenaar, J.A.; Heederik, D.J.J.; Dewulf, J.; Graveland, H.; Schmitt, H.; et al. Quantitative and qualitative analysis of antimicrobial usage at farm and flock level on 181 broiler farms in nine European countries. J. Antimicrob. Chemother. 2019, 74, 798–806. [Google Scholar] [CrossRef] [PubMed]
- Nolan, L.K.; Vaillancourt, J.P.; Barbieri, N.L.; Logue, C.M. Colibacillosis. In Diseases of Poultry; Swayne, D.E., Boulianne, M., Logue, C.M., McDougald, L.R., Nair, V., Suarez, D.L., Eds.; Iowa State Press: Ames, IA, USA, 2020; pp. 770–830. [Google Scholar]
- Dwars, R.M.; Matthijs, M.G.R.; Daemen, A.J.J.M.; van Eck, J.H.H.; Vervelde, L.; Landman, W.J.M. Progression of lesions in the respiratory tract of broilers after single infection with Escherichia coli compared to superinfection with E. coli after infection with infectious bronchitis virus. Vet. Immunol. Immunopathol. 2009, 127, 65–76. [Google Scholar] [CrossRef] [PubMed] [Green Version]
- WHO Advisory Group on Integrated Surveillance of Antimicrobial Resistance (AGISAR). Critically Important Antimicrobials for Human Medicine 6th Revision 2018; Ranking of Medically Important Antimicrobials for Risk Management of Antimicrobial Resistance Due to Non-Human Use; AGISAR: Geneva, Switzerland, 2019; ISBN 9789241515528. [Google Scholar]
- European Medicines Agency. Questions and Answers on Use of Enrofloxacin-Containing Veterinary Medicines Administered via Drinking Water to Chickens and Turkeys; European Medicines Agency: Amsterdam, The Netherlands, 2018. [Google Scholar]
- European Medicines Agency. Reflection paper on dose optimisation of established veterinary antibiotics in the context of SPC harmonisation. Comm. Med. Prod. Vet. Use 2019, 44, 1–120. [Google Scholar]
- Toutain, P.L. Pharmacokinetic/pharmacodynamic integration in drug development and dosage-regimen optimization for veterinary medicine. AAPS PharmSci 2002, 4, 1–29. [Google Scholar] [CrossRef] [PubMed]
- Pelligand, L.; Soubret, A.; King, J.N.; Elliott, J.; Mochel, J.P. Modeling of large pharmacokinetic data using nonlinear mixed-effects: A paradigm shift in veterinary pharmacology. A case study with Robenacoxib in cats. CPT Pharmacomet. Syst. Pharmacol. 2016, 5, 625–635. [Google Scholar] [CrossRef] [PubMed] [Green Version]
- Mouton, J.W.; Ambrose, P.G.; Canton, R.; Drusano, G.L.; Harbarth, S.; MacGowan, A.; Theuretzbacher, U.; Turnidge, J. Conserving antibiotics for the future: New ways to use old and new drugs from a pharmacokinetic and pharmacodynamic perspective. Drug Resist. Updates 2011, 14, 107–117. [Google Scholar] [CrossRef]
- Forrest, A.; Nix, D.E.; Ballow, C.H.; Goss, T.F.; Birmingham, M.C.; Schentag, J.J. Pharmacodynamics of intravenous ciprofloxacin in seriously ill patients. Antimicrob. Agents Chemother. 1993, 37, 1073–1081. [Google Scholar] [CrossRef] [PubMed] [Green Version]
- Wright, D.H. Application of fluoroquinolone pharmacodynamics. J. Antimicrob. Chemother. 2000, 46, 669–683. [Google Scholar] [CrossRef]
- Craig, W.A. Does the Dose Matter? Clin. Infect. Dis. 2001, 33, S233–S237. [Google Scholar] [CrossRef] [PubMed]
- Levison, M.E.; Levison, J.H. Pharmacokinetics and Pharmacodynamics of Antibacterial Agents. Infect. Dis. Clin. N. Am. 2009, 23, 791–815. [Google Scholar] [CrossRef] [PubMed] [Green Version]
- Singer, R.S.; Hofacre, C.L. Potential impacts of antibiotic use in poultry production. Avian Dis. 2006, 50, 161–172. [Google Scholar] [CrossRef] [PubMed]
- Soraci, A.L.; Amanto, F.; Tapia, M.O.; de la Torre, E.; Toutain, P.L. Exposure variability of fosfomycin administered to pigs in food or water: Impact of social rank. Res. Vet. Sci. 2014, 96, 153–159. [Google Scholar] [CrossRef] [PubMed]
- Ferran, A.A.; Roques, B.B. Can oral group medication be improved to reduce antimicrobial use? Vet. Rec. 2019, 185, 402–404. [Google Scholar] [CrossRef] [PubMed]
- Ferran, A.A.; Lacroix, M.Z.; Bousquet-Mélou, A.; Duhil, I.; Roques, B.B. Levers to Improve Antibiotic Treatment of Lambs via Drinking Water in Sheep Fattening Houses: The Example of the Sulfadimethoxine/Trimethoprim Combination. Antibiotics 2020, 9, 561. [Google Scholar] [CrossRef] [PubMed]
- Bruno, L.D.G.; Maiorka, A.; Macari, M.; Furlan, R.L.; Givisiez, P.E.N. Water intake behavior of broiler chickens exposed to heat stress and drinking from bell or and nipple drinkers. Rev. Bras. Cienc. Avic. 2011, 13, 147–152. [Google Scholar] [CrossRef] [Green Version]
- Li, J.; Nekka, F. A pharmacokinetic formalism explicitly integrating the patient drug compliance. J. Pharmacokinet. Pharmacodyn. 2007, 34, 115–139. [Google Scholar] [CrossRef]
- Bon, C.; Toutain, P.L.; Concordet, D.; Gehring, R.; Martin-Jimenez, T.; Smith, J.; Pelligand, L.; Martinez, M.; Whittem, T.; Riviere, J.E.; et al. Mathematical modeling and simulation in animal health. Part III: Using nonlinear mixed-effects to characterize and quantify variability in drug pharmacokinetics. J. Vet. Pharmacol. Ther. 2018, 41, 171–183. [Google Scholar] [CrossRef] [Green Version]
- Li, J.; Petit-Jetté, C.E.; Gohore Bi, D.; Fenneteau, F.; del Castillo, J.R.E.; Nekka, F. Assessing pharmacokinetic variability directly induced by drug intake behaviour through development of a feeding behaviour-pharmacokinetic model. J. Theor. Biol. 2008, 251, 468–479. [Google Scholar] [CrossRef] [PubMed]
- Temmerman, R.; Garmyn, A.; Antonissen, G.; Vanantwerpen, G.; Vanrobaeys, M.; Haesebrouck, F.; Devreese, M. Evaluation of fluoroquinolone resistance in clinical avian pathogenic escherichia coli isolates from Flanders (Belgium). Antibiotics 2020, 9, 800. [Google Scholar] [CrossRef] [PubMed]
- Bélanger, L.; Garenaux, A.; Harel, J.; Boulianne, M.; Nadeau, E.; Dozois, C.M. Escherichia colifrom animal reservoirs as a potential source of human extraintestinal pathogenic E. coli. FEMS Immunol. Med. Microbiol. 2011, 62, 1–10. [Google Scholar] [CrossRef] [PubMed] [Green Version]
- Johnson, T.J.; Kariyawasam, S.; Wannemuehler, Y.; Mangiamele, P.; Johnson, S.J.; Doetkott, C.; Skyberg, J.A.; Lynne, A.M.; Johnson, J.R.; Nolan, L.K. The Genome Sequence of Avian Pathogenic Escherichia coli Strain O1:K1:H7 Shares Strong Similarities with Human Extraintestinal Pathogenic E. coli Genomes. J. Bacteriol. 2007, 189, 3228–3236. [Google Scholar] [CrossRef] [PubMed] [Green Version]
- Mitchell, N.M.; Johnson, J.R.; Johnston, B.; Curtiss, R.; Mellata, M. Zoonotic potential of Escherichia coli isolates from retail chicken meat products and eggs. Appl. Environ. Microbiol. 2015, 81, 1177–1187. [Google Scholar] [CrossRef] [PubMed] [Green Version]
- Bugyei, K.; Black, W.D.; McEwen, S. Pharmacokinetics of enrofloxacin given by the oral, intravenous and intramuscular routes in broiler chickens. Can. J. Vet. Res. 1999, 63, 193–200. [Google Scholar] [PubMed]
- García Ovando, H.; Gorla, N.; Luders, C.; Poloni, G.; Errecalde, C.; Prieto, G.; Puelles, I. Comparative pharmacokinetics of enrofloxacin and ciprofloxacin in chickens. J. Vet. Pharmacol. Ther. 1999, 22, 209–212. [Google Scholar] [CrossRef] [PubMed]
- Knoll, U.; Glünder, G.; Kietzmann, M. Comparative study of the plasma pharmacokinetics and tissue concentrations of danofloxacin and enrofloxacin in broiler chickens. J. Vet. Pharmacol. Ther. 1999, 22, 239–246. [Google Scholar] [CrossRef] [PubMed]
- El-Aziz, M.I.A.; Aziz, M.A.; Soliman, F.A.; Afify, N.A. Pharmacokinetic evaluation of enrofloxacin in chickens. Br. Poult. Sci. 1997, 38, 164–168. [Google Scholar] [CrossRef] [PubMed]
- Donkoh, A. Ambient temperature: A factor affecting performance and physiological response of broiler chickens. Int. J. Biometeorol. 1989, 33, 259–265. [Google Scholar] [CrossRef] [PubMed]
- May, J.D.; Lott, B.D. Feed and water consumption patterns of broilers at high environmental temperatures. Poult. Sci. 1992, 71, 331–336. [Google Scholar] [CrossRef] [PubMed]
- May, J.D.; Lott, B.D.; Simmons, J.D. Water Consumption by Broilers in High Cyclic Temperatures: Bell Versus Nipple Waterers. Poult. Sci. 1997, 76, 944–947. [Google Scholar] [CrossRef] [PubMed]
- Mack, L.A.; Felver-Gant, J.N.; Dennis, R.L.; Cheng, H.W. Genetic variations alter production and behavioral responses following heat stress in 2 strains of laying hens. Poult. Sci. 2013, 92, 285–294. [Google Scholar] [CrossRef] [PubMed]
- Curtis, S.E. Environmental Management in Animal Agriculture; Iowa State University Press: Ames, IA, USA, 1983. [Google Scholar]
- Mascarenhas, N.M.H.; da Costa, A.N.L.; Pereira, M.L.L.; de Caldas, A.C.A.; Batista, L.F.; Gonçalves, E.L. Thermal conditioning in the broiler production: Challenges and possibilities. J. Anim. Behav. Biometeorol. 2018, 6, 52–55. [Google Scholar] [CrossRef]
- Abdel-Moneim, A.-M.E.; Shehata, A.M.; Khidr, R.E.; Paswan, V.K.; Ibrahim, N.S.; El-Ghoul, A.A.; Aldhumri, S.A.; Gabr, S.A.; Mesalam, N.M.; Elbaz, A.M.; et al. Nutritional manipulation to combat heat stress in poultry—A comprehensive review. J. Therm. Biol. 2021, 98, 102915. [Google Scholar] [CrossRef]
- Bhutto, Z.A.; He, F.; Zloh, M.; Yang, J.; Huang, J.; Guo, T.; Wang, L. Use of quercetin in animal feed: Effects on the P-gp expression and pharmacokinetics of orally administrated enrofloxacin in chicken. Sci. Rep. 2018, 8, 4400. [Google Scholar] [CrossRef] [PubMed] [Green Version]
- Garmyn, A.; Martel, A.; Froyman, R.; Nauwynck, H.; Duchateau, L.; Haesebrouck, F.; Pasmans, F. Effect of multiple- and single-day enrofloxacin medications against dual experimental infection with avian pneumovirus and Escherichia coli in turkeys. Poult. Sci. 2009, 88, 2093–2100. [Google Scholar] [CrossRef] [PubMed]
- Toutain, P.-L.; Sidhu, P.K.; Lees, P.; Rassouli, A.; Pelligand, L. VetCAST Method for Determination of the Pharmacokinetic-Pharmacodynamic Cut-Off Values of a Long-Acting Formulation of Florfenicol to Support Clinical Breakpoints for Florfenicol Antimicrobial Susceptibility Testing in Cattle. Front. Microbiol. 2019, 10, 1310. [Google Scholar] [CrossRef] [Green Version]
- Toutain, P.L.; Bousquet-Mélou, A.; Damborg, P.; Ferran, A.A.; Mevius, D.; Pelligand, L.; Veldman, K.T.; Lees, P. En Route towards European Clinical breakpoints for veterinary antimicrobial susceptibility testing: A position paper explaining the VetCAST approach. Front. Microbiol. 2017, 8, 2344. [Google Scholar] [CrossRef] [Green Version]
- Nielsen, E.I.; Cars, O.; Friberg, L.E. Pharmacokinetic/Pharmacodynamic (PK/PD) Indices of Antibiotics Predicted by a Semimechanistic PKPD Model: A Step toward Model-Based Dose Optimization. Antimicrob. Agents Chemother. 2011, 55, 4619–4630. [Google Scholar] [CrossRef] [PubMed] [Green Version]
- Nielsen, E.I.; Viberg, A.; Löwdin, E.; Cars, O.; Karlsson, M.O.; Sandström, M. Semimechanistic pharmacokinetic/pharmacodynamic model for assessment of activity of antibacterial agents from time-kill curve experiments. Antimicrob. Agents Chemother. 2007, 51, 128–136. [Google Scholar] [CrossRef] [PubMed] [Green Version]
- Nielsen, E.I.; Friberg, L.E. Pharmacokinetic-pharmacodynamic modeling of antibacterial drugs. Pharmacol. Rev. 2013, 65, 1053–1090. [Google Scholar] [CrossRef] [PubMed] [Green Version]
- Khan, D.D.; Friberg, L.E.; Nielsen, E.I. A pharmacokinetic-pharmacodynamic (PKPD) model based on in vitro time-kill data predicts the in vivo PK/PD index of colistin. J. Antimicrob. Chemother. 2016, 71, 1881–1884. [Google Scholar] [CrossRef] [PubMed] [Green Version]
- Kristoffersson, A.N.; Bissantz, C.; Okujava, R.; Haldimann, A.; Walter, I.; Shi, T.; Zampaloni, C.; Nielsen, E.I. A novel mechanism-based pharmacokinetic-pharmacodynamic (PKPD) model describing ceftazidime/avibactam efficacy against β-lactamase-producing Gram-negative bacteria. J. Antimicrob. Chemother. 2020, 75, 400–408. [Google Scholar] [CrossRef] [PubMed]
- Balaje, R.M.; Sidhu, P.K.; Kaur, G.; Rampal, S. Mutant prevention concentration and PK-PD relationships of enrofloxacin for Pasteurella multocida in buffalo calves. Res. Vet. Sci. 2013, 95, 1114–1124. [Google Scholar] [CrossRef] [PubMed]
- Pelligand, L.; Lees, P.; Sidhu, P.K.; Toutain, P.L. Semi-mechanistic modeling of florfenicol time-kill curves and in silico dose fractionation for calf respiratory pathogens. Front. Microbiol. 2019, 10, 1237. [Google Scholar] [CrossRef] [PubMed]
- Sang, K.N.; Hao, H.H.; Huang, L.L.; Wang, X.; Yuan, Z.H. Pharmacokinetic-pharmacodynamic modeling of enrofloxacin against Escherichia coli in broilers. Front. Vet. Sci. 2016, 2, 80. [Google Scholar] [CrossRef] [PubMed] [Green Version]
- Xiao, X.; Jiang, L.; Lan, W.; Jiang, Y.; Wang, Z. In vivo pharmacokinetic/Pharmacodynamic modeling of Enrofloxacin against Escherichia coli in broiler chickens. BMC Vet. Res. 2018, 14, 374. [Google Scholar] [CrossRef] [PubMed]
- European Commission. Directive 2010/63/EU of the European Parliament and of the council of 22 September 2010 on the protection of animals used for scientific purposes. Off. J. Eur. Union 2010, L276, 33–79. [Google Scholar]
- Belgian Royal Decree of 29 May 2013 on the protection of animals used for scientific purposes. Belg. Staatsbl. 2013, 193, 42808–42912.
- Aviagen. Ross Broiler Management Handbook; Aviagen: Huntsville, AL, USA, 2014. [Google Scholar]
- European Commission. 2002/657/EC: Commission Decision of 12 August 2002 Implementing Council Directive 96/23/EC Concerning the Performance of Analytical Methods and the Interpretation of Results (Text with EEA Relevance) (Notified under Document Number C(2002) 3044)—Publica. Available online: https://op.europa.eu/en/publication-detail/-/publication/ed928116-a955-4a84-b10a-cf7a82bad858/language-en (accessed on 30 September 2020).
- European Medicines Agency. Guideline on Bioanalytical Method Validation; European Medicines Agency: Amsterdam, The Netherlands, 2011. [Google Scholar]
- VICH GL49. Studies to Evaluate the Metabolism and Residue Kinetics of Veterinary Drugs in Food-Producing Animals: Validation of Analytical Methods Used in Residue Depletion Studies|European Medicines Agency. Available online: https://www.ema.europa.eu/en/vich-gl49-studies-evaluate-metabolism-residue-kinetics-veterinary-drugs-food-producing-animals (accessed on 30 September 2020).
- Byon, W.; Fletcher, C.V.; Brundage, R.C. Impact of censoring data below an arbitrary quantification limit on structural model misspecification. J. Pharmacokinet. Pharmacodyn. 2008, 35, 101–116. [Google Scholar] [CrossRef] [PubMed]
- Xu, X.S.; Dunne, A.; Kimko, H.; Nandy, P.; Vermeulen, A. Impact of low percentage of data below the quantification limit on parameter estimates of pharmacokinetic models. J. Pharmacokinet. Pharmacodyn. 2011, 38, 423–432. [Google Scholar] [CrossRef] [PubMed]
- Beal, S.L. Ways to fit a PK model with some data below the quantification limit. J. Pharmacokinet. Pharmacodyn. 2001, 28, 481–504. [Google Scholar] [CrossRef] [PubMed]
- Karlsson, M.O.; Savic, R.M. Diagnosing model diagnostics. Clin. Pharmacol. Ther. 2007, 82, 17–20. [Google Scholar] [CrossRef] [PubMed]
- Savic, R.M.; Karlsson, M.O. Importance of shrinkage in empirical bayes estimates for diagnostics: Problems and solutions. AAPS J. 2009, 11, 558–569. [Google Scholar] [CrossRef] [PubMed] [Green Version]
- Haeseker, M.; Stolk, L.; Nieman, F.; Hoebe, C.; Neef, C.; Bruggeman, C.; Verbon, A. The ciprofloxacin target AUC: MIC ratio is not reached in hospitalized patients with the recommended dosing regimens. Br. J. Clin. Pharmacol. 2013, 75, 180–185. [Google Scholar] [CrossRef] [PubMed] [Green Version]
- Drusano, G.L.; Preston, S.L.; Fowler, C.; Corrado, M.; Weisinger, B.; Kahn, J. Relationship between Fluoroquinolone Area under the Curve:Minimum Inhibitory Concentration Ratio and the Probability of Eradication of the Infecting Pathogen, in Patients with Nosocomial Pneumonia. J. Infect. Dis. 2004, 189, 1590–1597. [Google Scholar] [CrossRef] [PubMed]


| Typical Values | Estimate | Units | SE | 2.5% CI | 97.5% CI | BSV (%) |
|---|---|---|---|---|---|---|
| Step 1: Initial modelling of IV and PO PK data | ||||||
| tvCl | 458.1 | mL/kg/h | 29.59 | 400.0 | 516.2 | 11 |
| tvV | 4671.9 | mL/kg | 339.1 | 4006.2 | 5337.7 | 22 |
| tvKa | 0.685 | 1/h | 0.051 | 0.584 | 0.786 | 100 |
| tvTlag | 0.041 | h | 0.006 | 0.030 | 0.052 | - |
| tvIV_delay | 0.054 | h | 0.013 | 0.028 | 0.079 | - |
| logit(tvF) | 1.313 * | 0.319 | 0.686 | 1.940 | - | |
| Step 2: Modelling of drinking water PK data | ||||||
| tvDrink | 193.9 | mL/kg/24 h | 5.827 | 182.4 | 205.3 | 24 |
| dVddose | −1.849 | 0.461 | −2.754 | −0.945 | - | |
| tvCMultStdev | 0.096 | % | 0.004 | 0.087 | 0.104 | - |
| stdev0 | 116.8 | ng/mL | 0.748 | 115.3 | 118.3 | - |
| Omega | |||
|---|---|---|---|
| nCl | nV | nKa | |
| nCl | 0.012 | ||
| nV | 0.008 | 0.048 | |
| nKa | −0.023 | 0.150 | 0.694 |
| Correlation between ETAs and shrinkage | |||
| nCl | 1 | ||
| nV | 0.348 | 1 | |
| nKa | −0.247 | 0.823 | 1 |
| Shrinkage | 0.207 | 0.139 | 0.086 |
Publisher’s Note: MDPI stays neutral with regard to jurisdictional claims in published maps and institutional affiliations. |
© 2021 by the authors. Licensee MDPI, Basel, Switzerland. This article is an open access article distributed under the terms and conditions of the Creative Commons Attribution (CC BY) license (https://creativecommons.org/licenses/by/4.0/).
Share and Cite
Temmerman, R.; Pelligand, L.; Schelstraete, W.; Antonissen, G.; Garmyn, A.; Devreese, M. Enrofloxacin Dose Optimization for the Treatment of Colibacillosis in Broiler Chickens Using a Drinking Behaviour Pharmacokinetic Model. Antibiotics 2021, 10, 604. https://0-doi-org.brum.beds.ac.uk/10.3390/antibiotics10050604
Temmerman R, Pelligand L, Schelstraete W, Antonissen G, Garmyn A, Devreese M. Enrofloxacin Dose Optimization for the Treatment of Colibacillosis in Broiler Chickens Using a Drinking Behaviour Pharmacokinetic Model. Antibiotics. 2021; 10(5):604. https://0-doi-org.brum.beds.ac.uk/10.3390/antibiotics10050604
Chicago/Turabian StyleTemmerman, Robin, Ludovic Pelligand, Wim Schelstraete, Gunther Antonissen, An Garmyn, and Mathias Devreese. 2021. "Enrofloxacin Dose Optimization for the Treatment of Colibacillosis in Broiler Chickens Using a Drinking Behaviour Pharmacokinetic Model" Antibiotics 10, no. 5: 604. https://0-doi-org.brum.beds.ac.uk/10.3390/antibiotics10050604