
National Antibiotics Utilization Trends for Human Use in Tanzania from 2010 to 2016 Inferred from Tanzania Medicines and Medical Devices Authority Importation Data

 ,
, 
Abstract
:1. Introduction
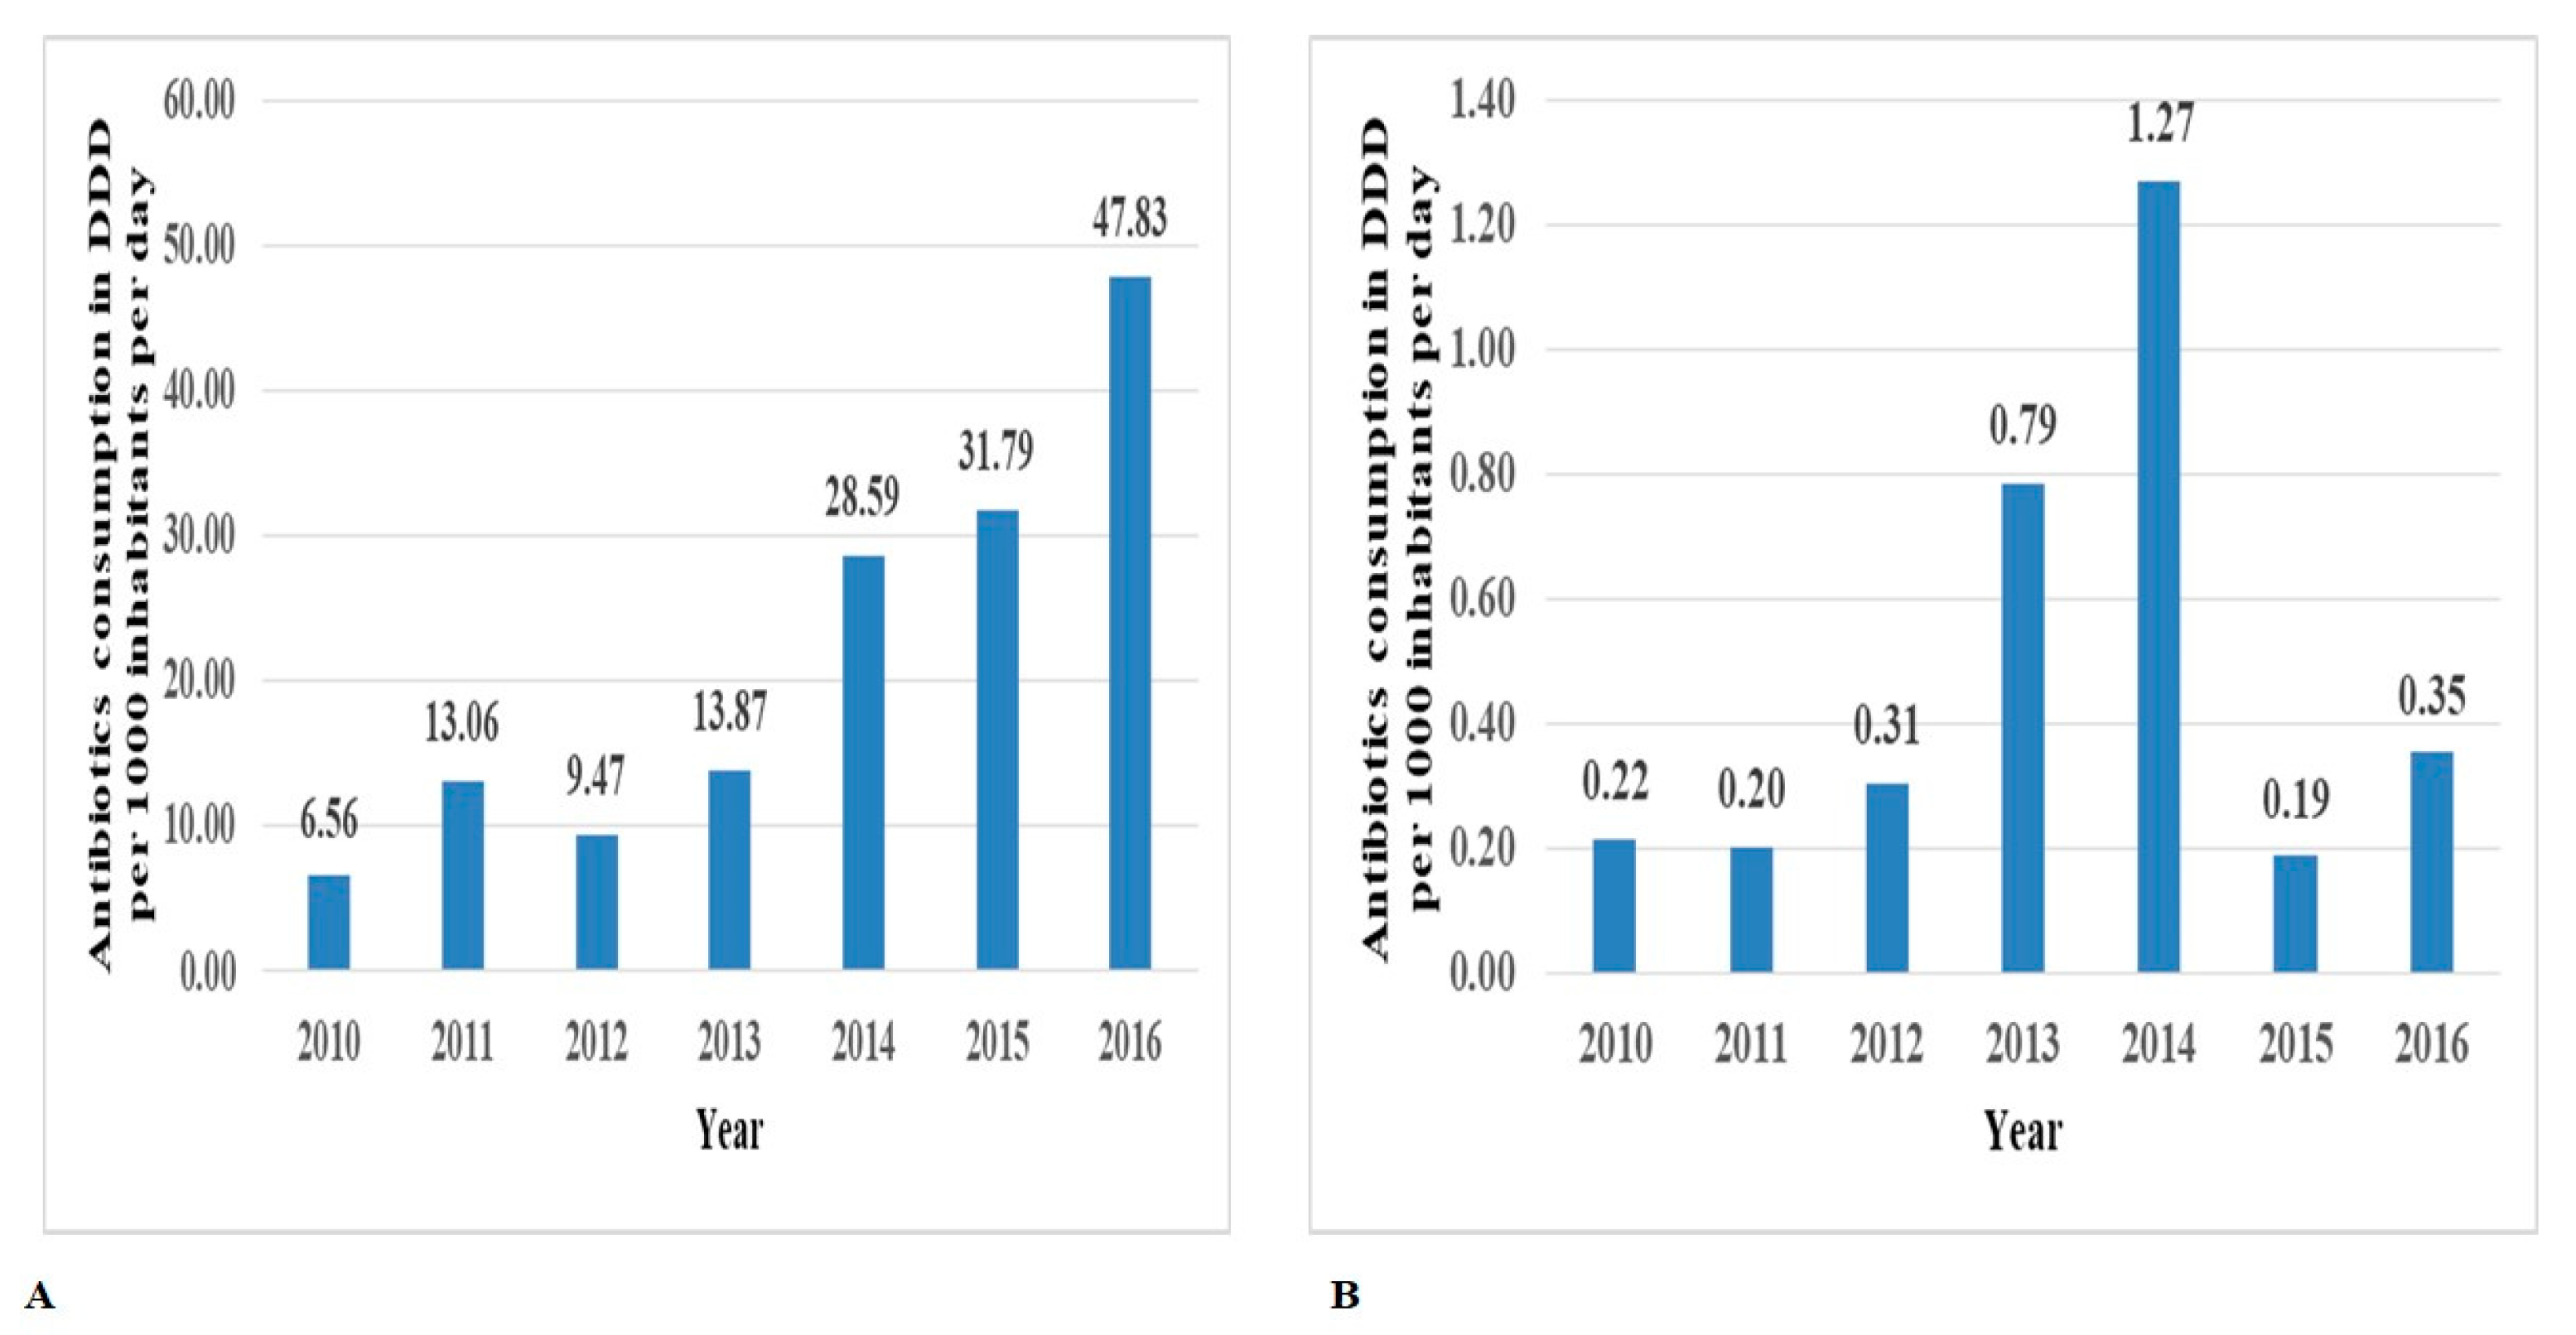
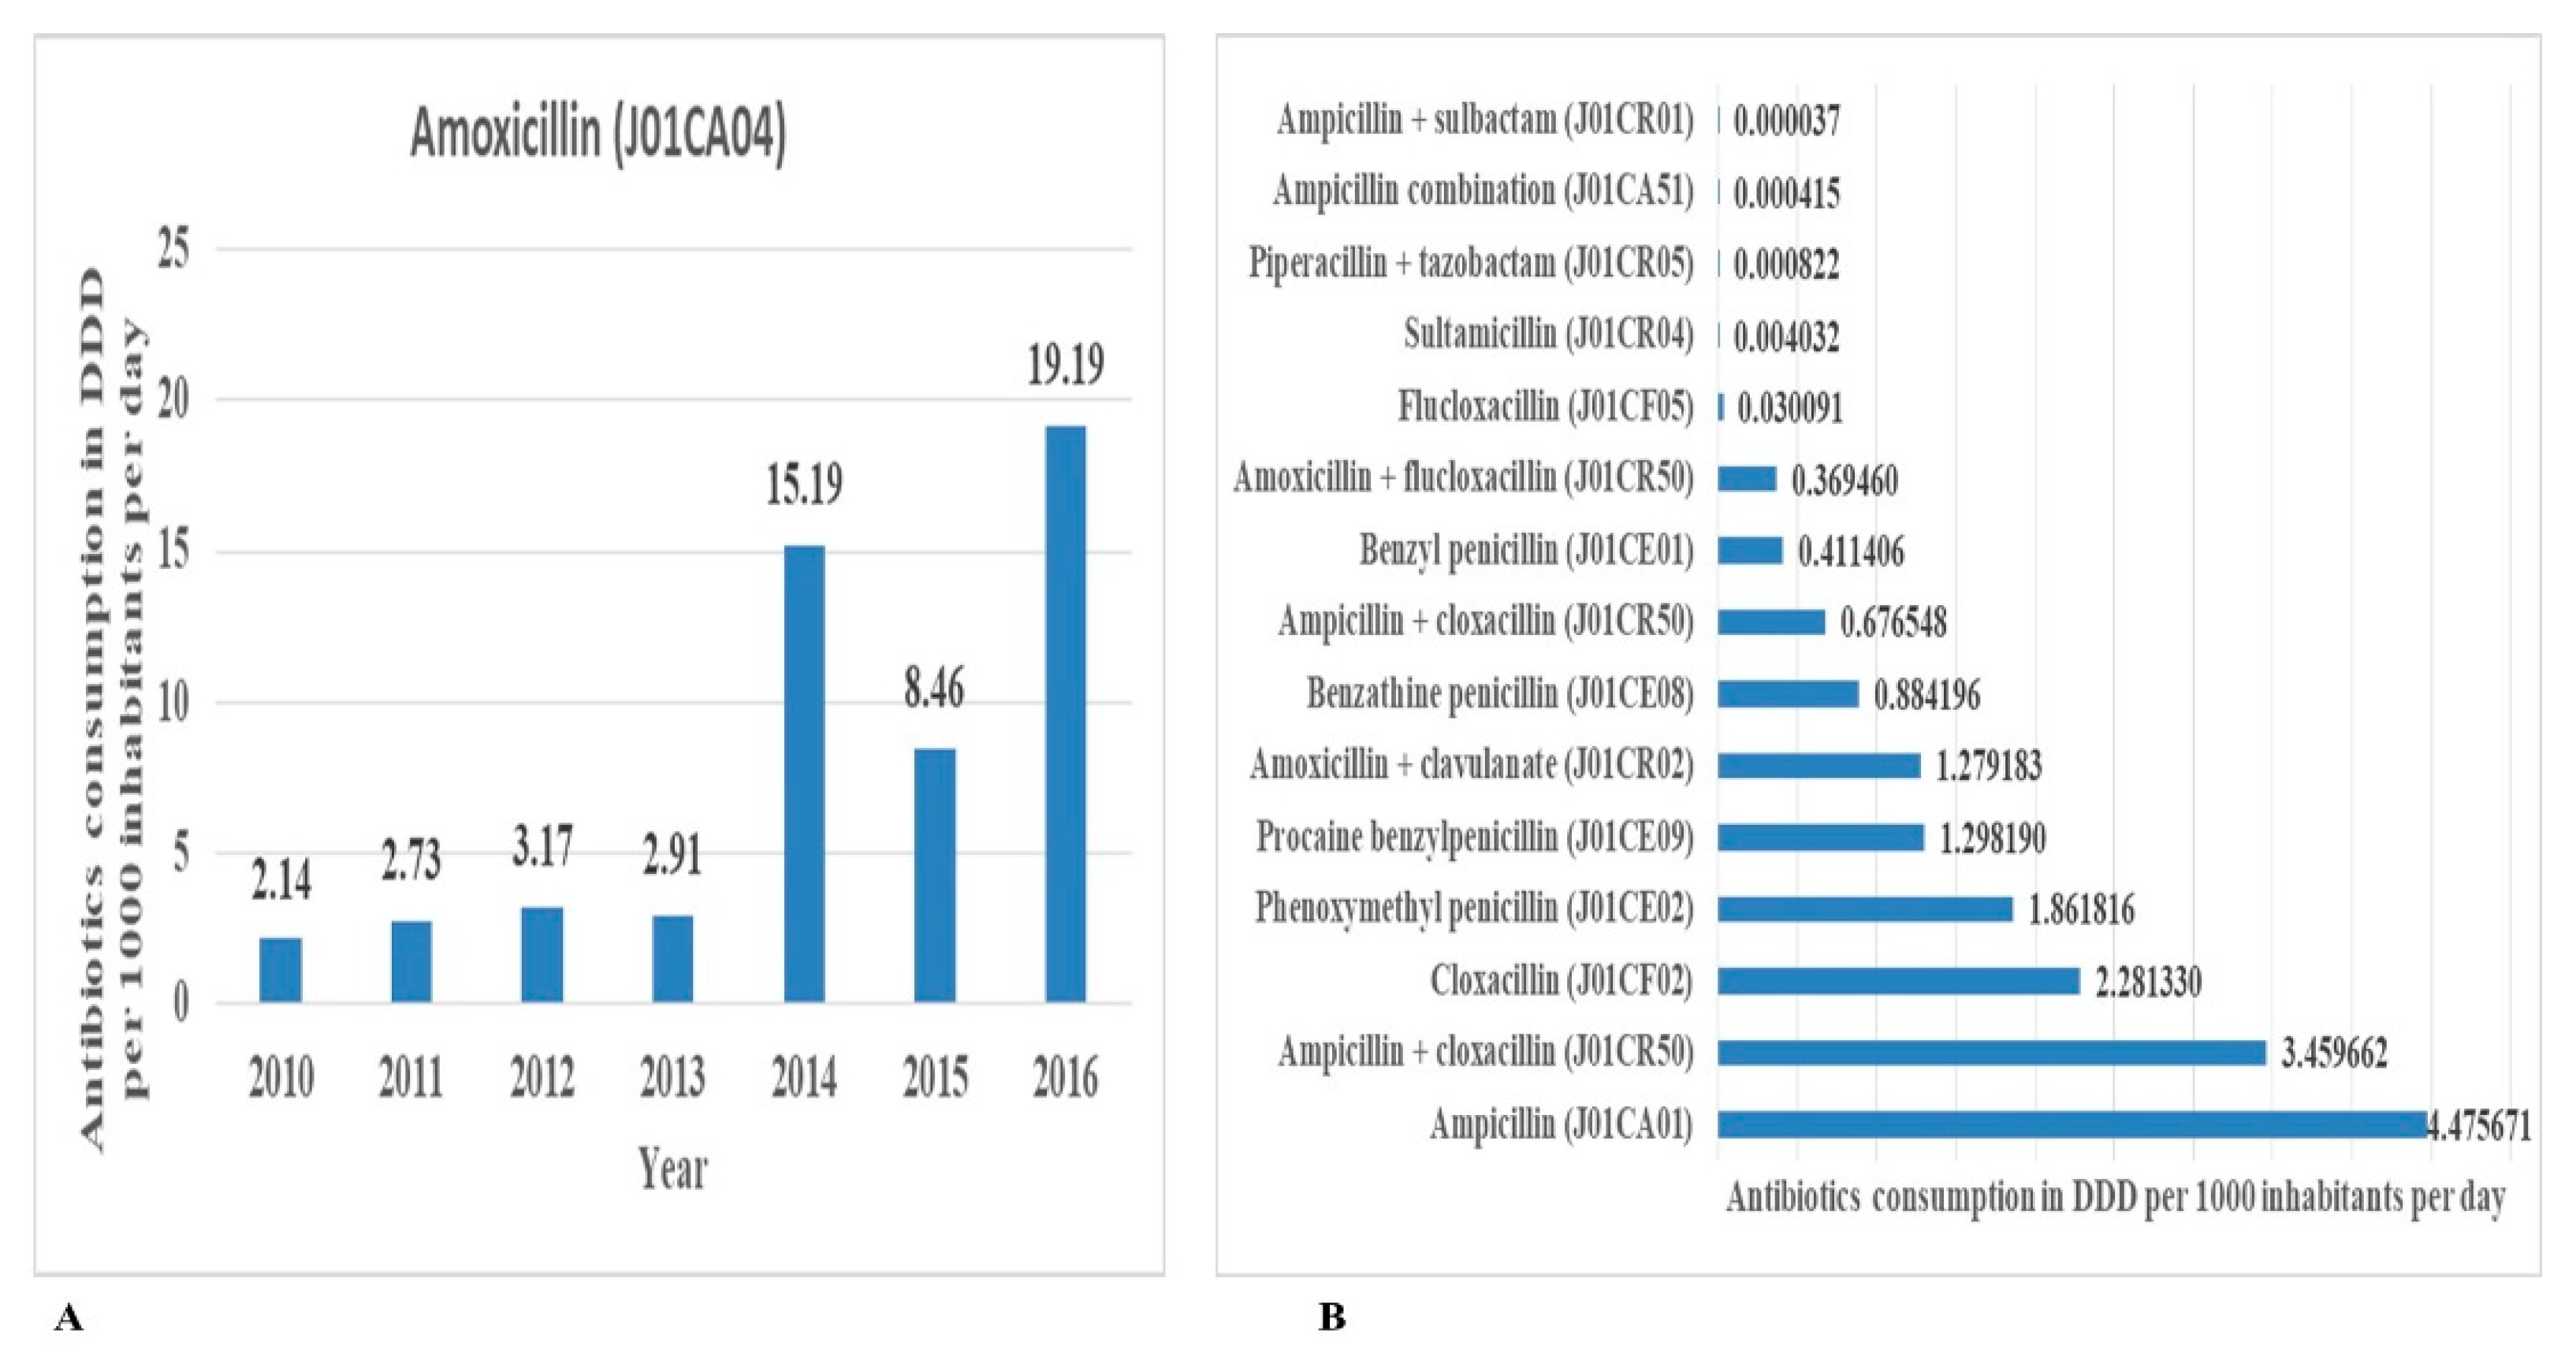
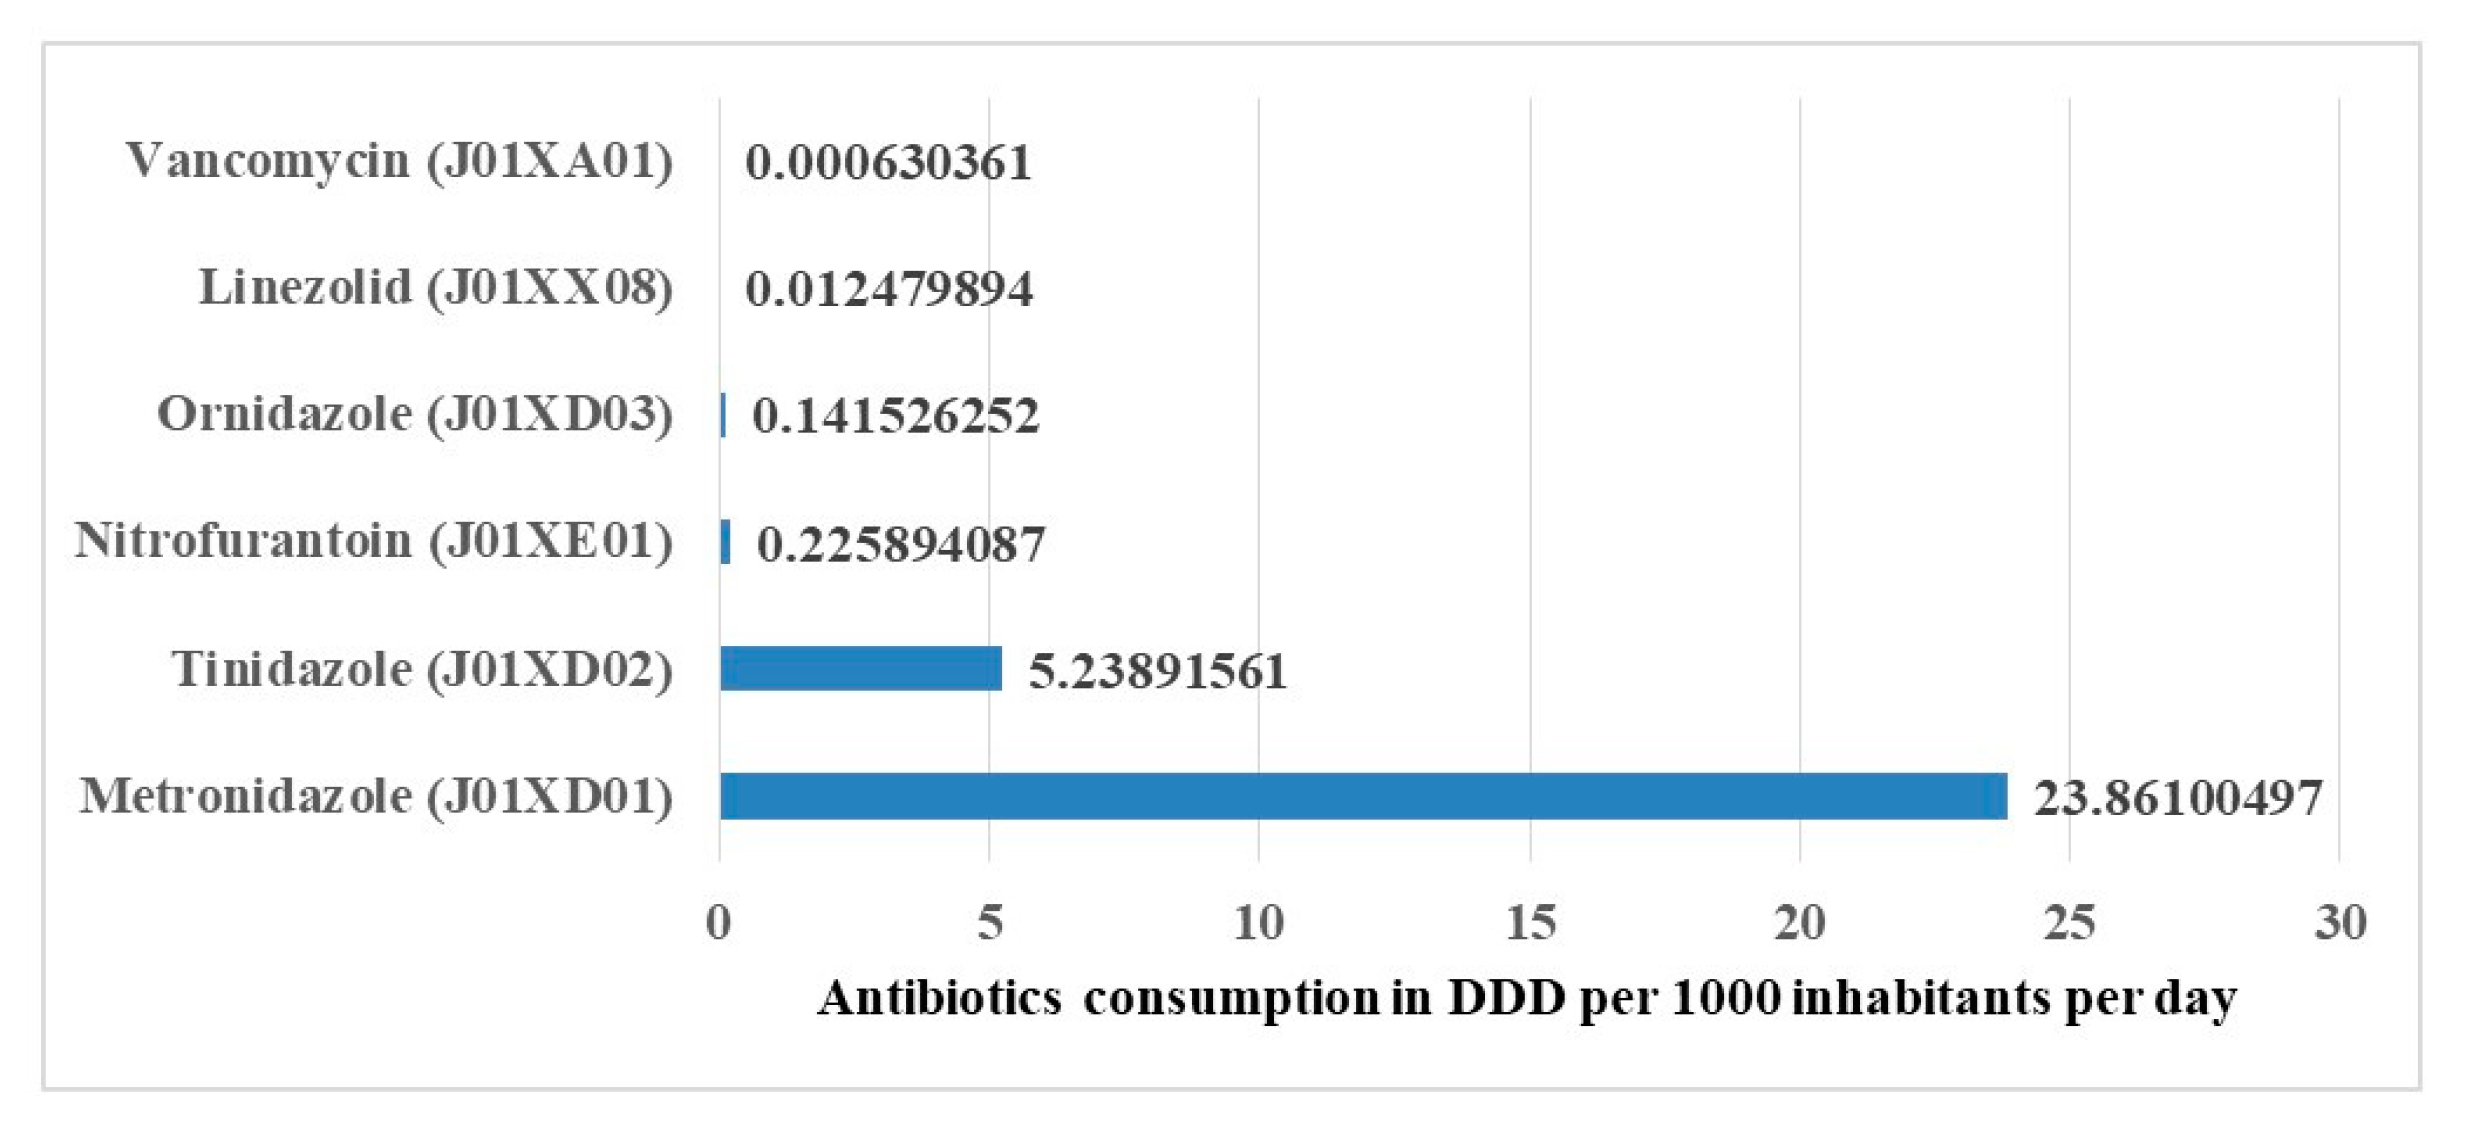
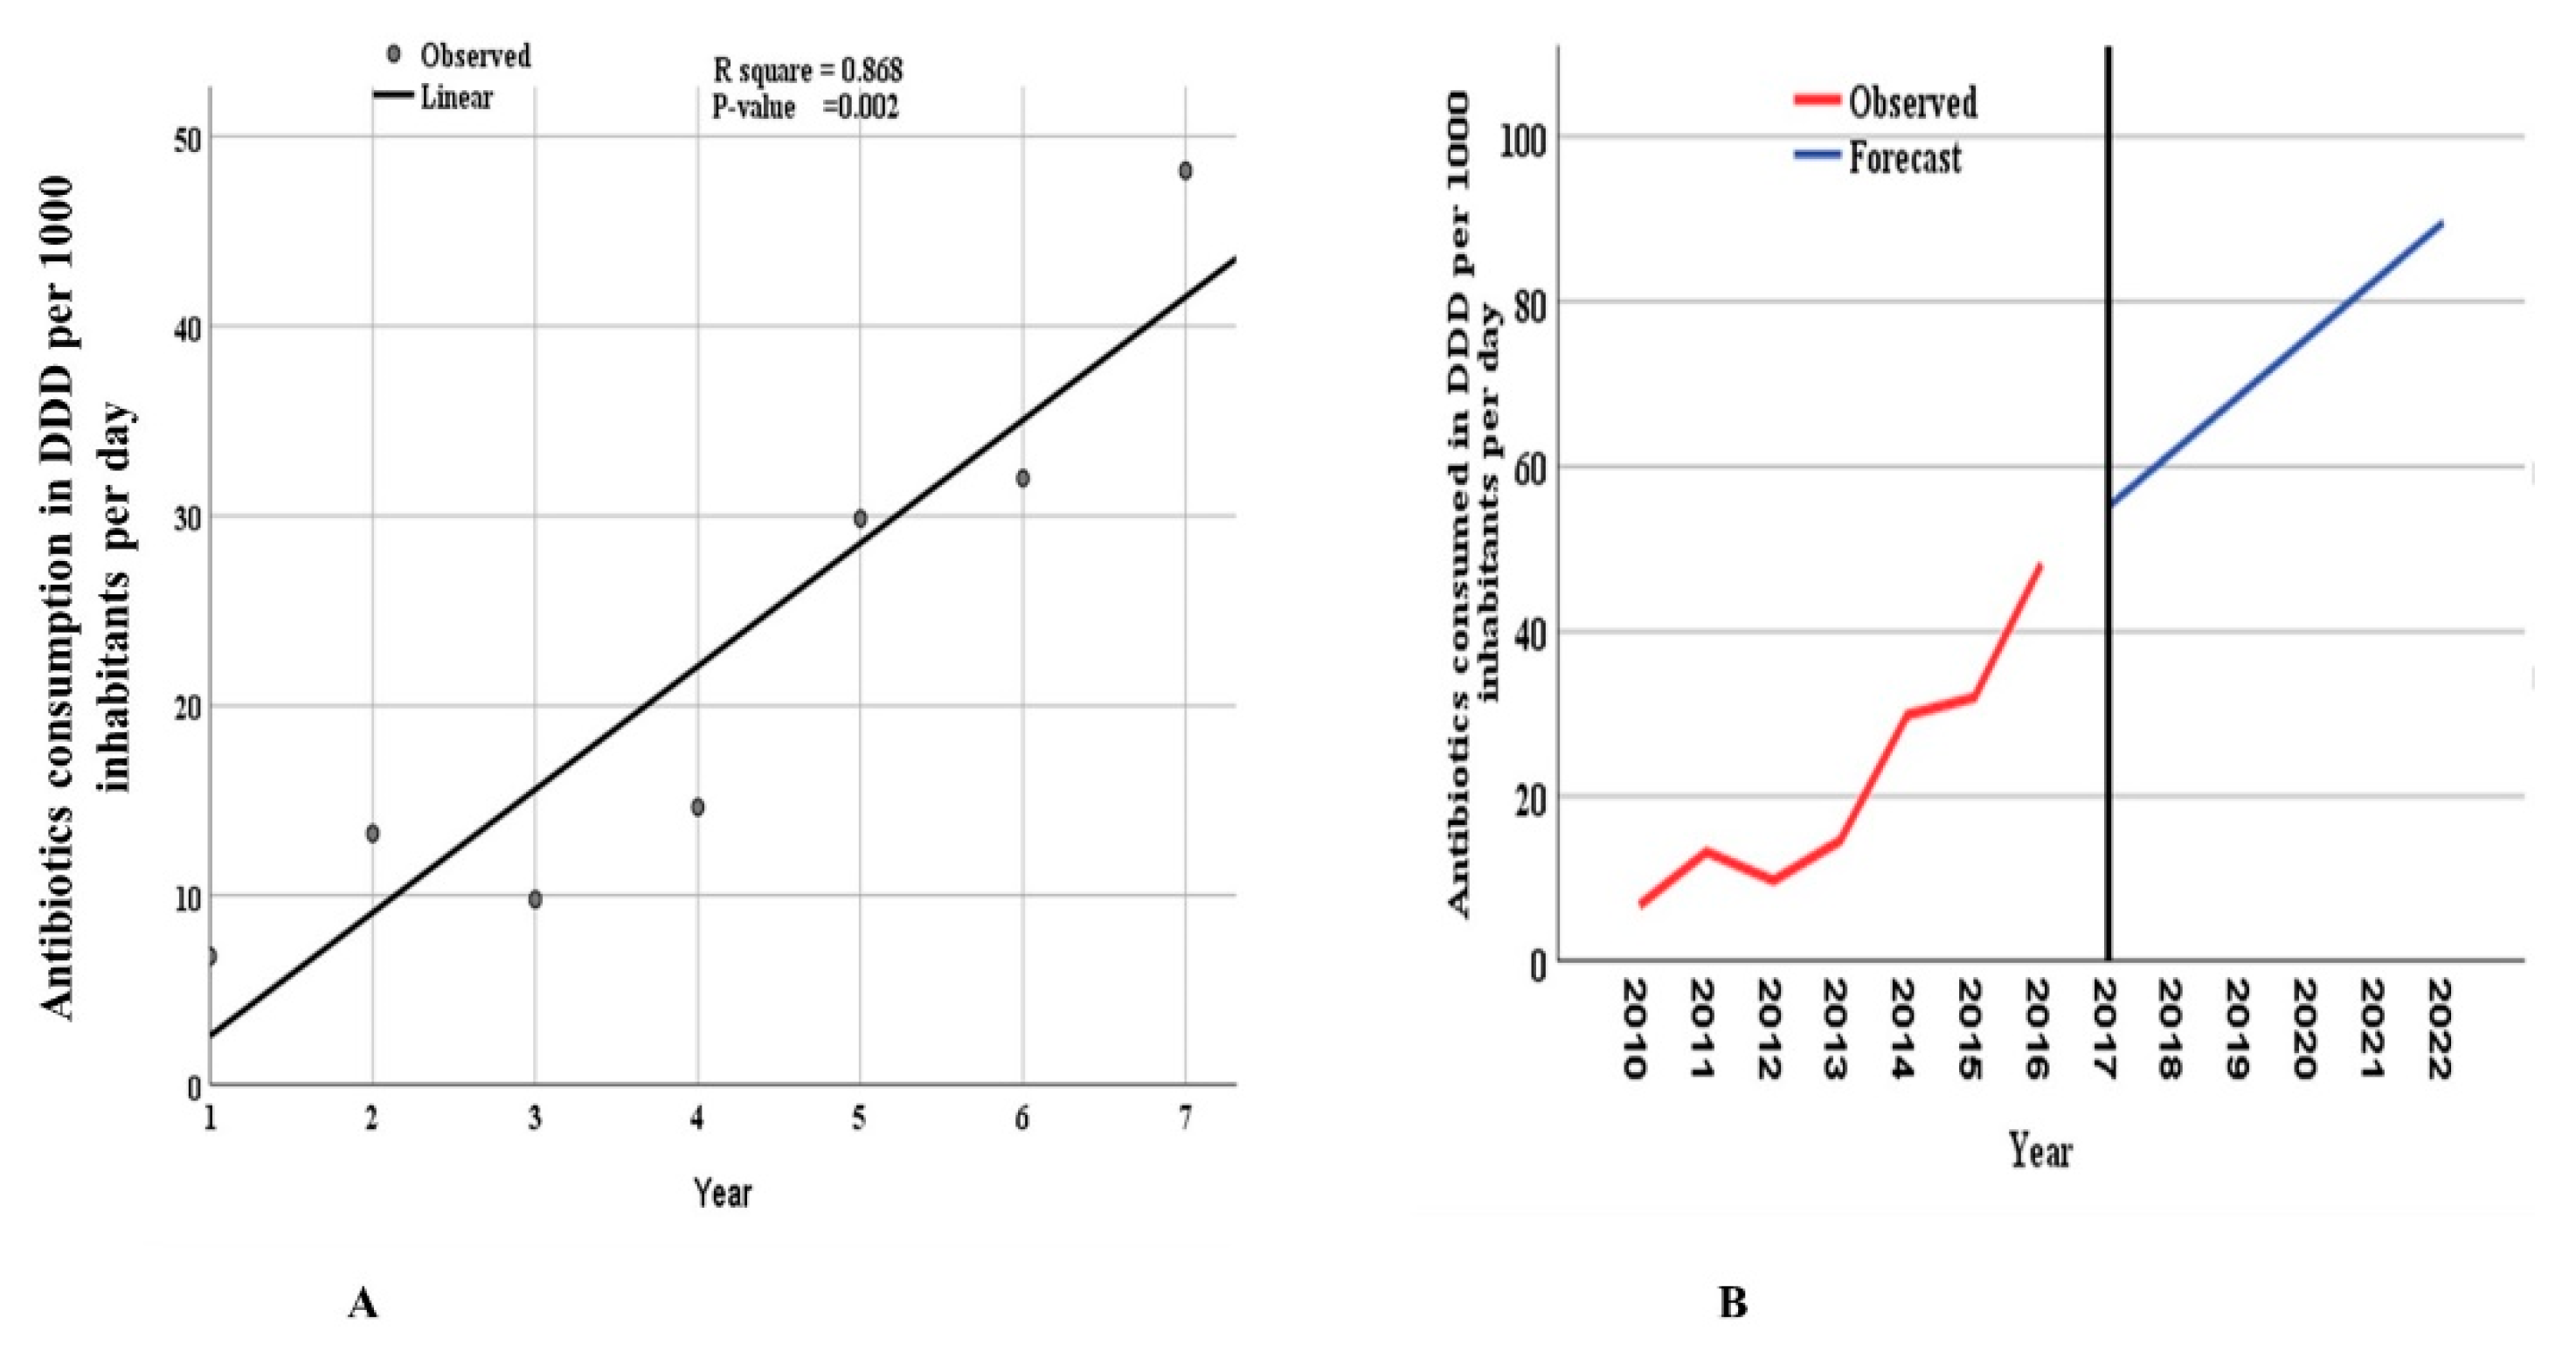
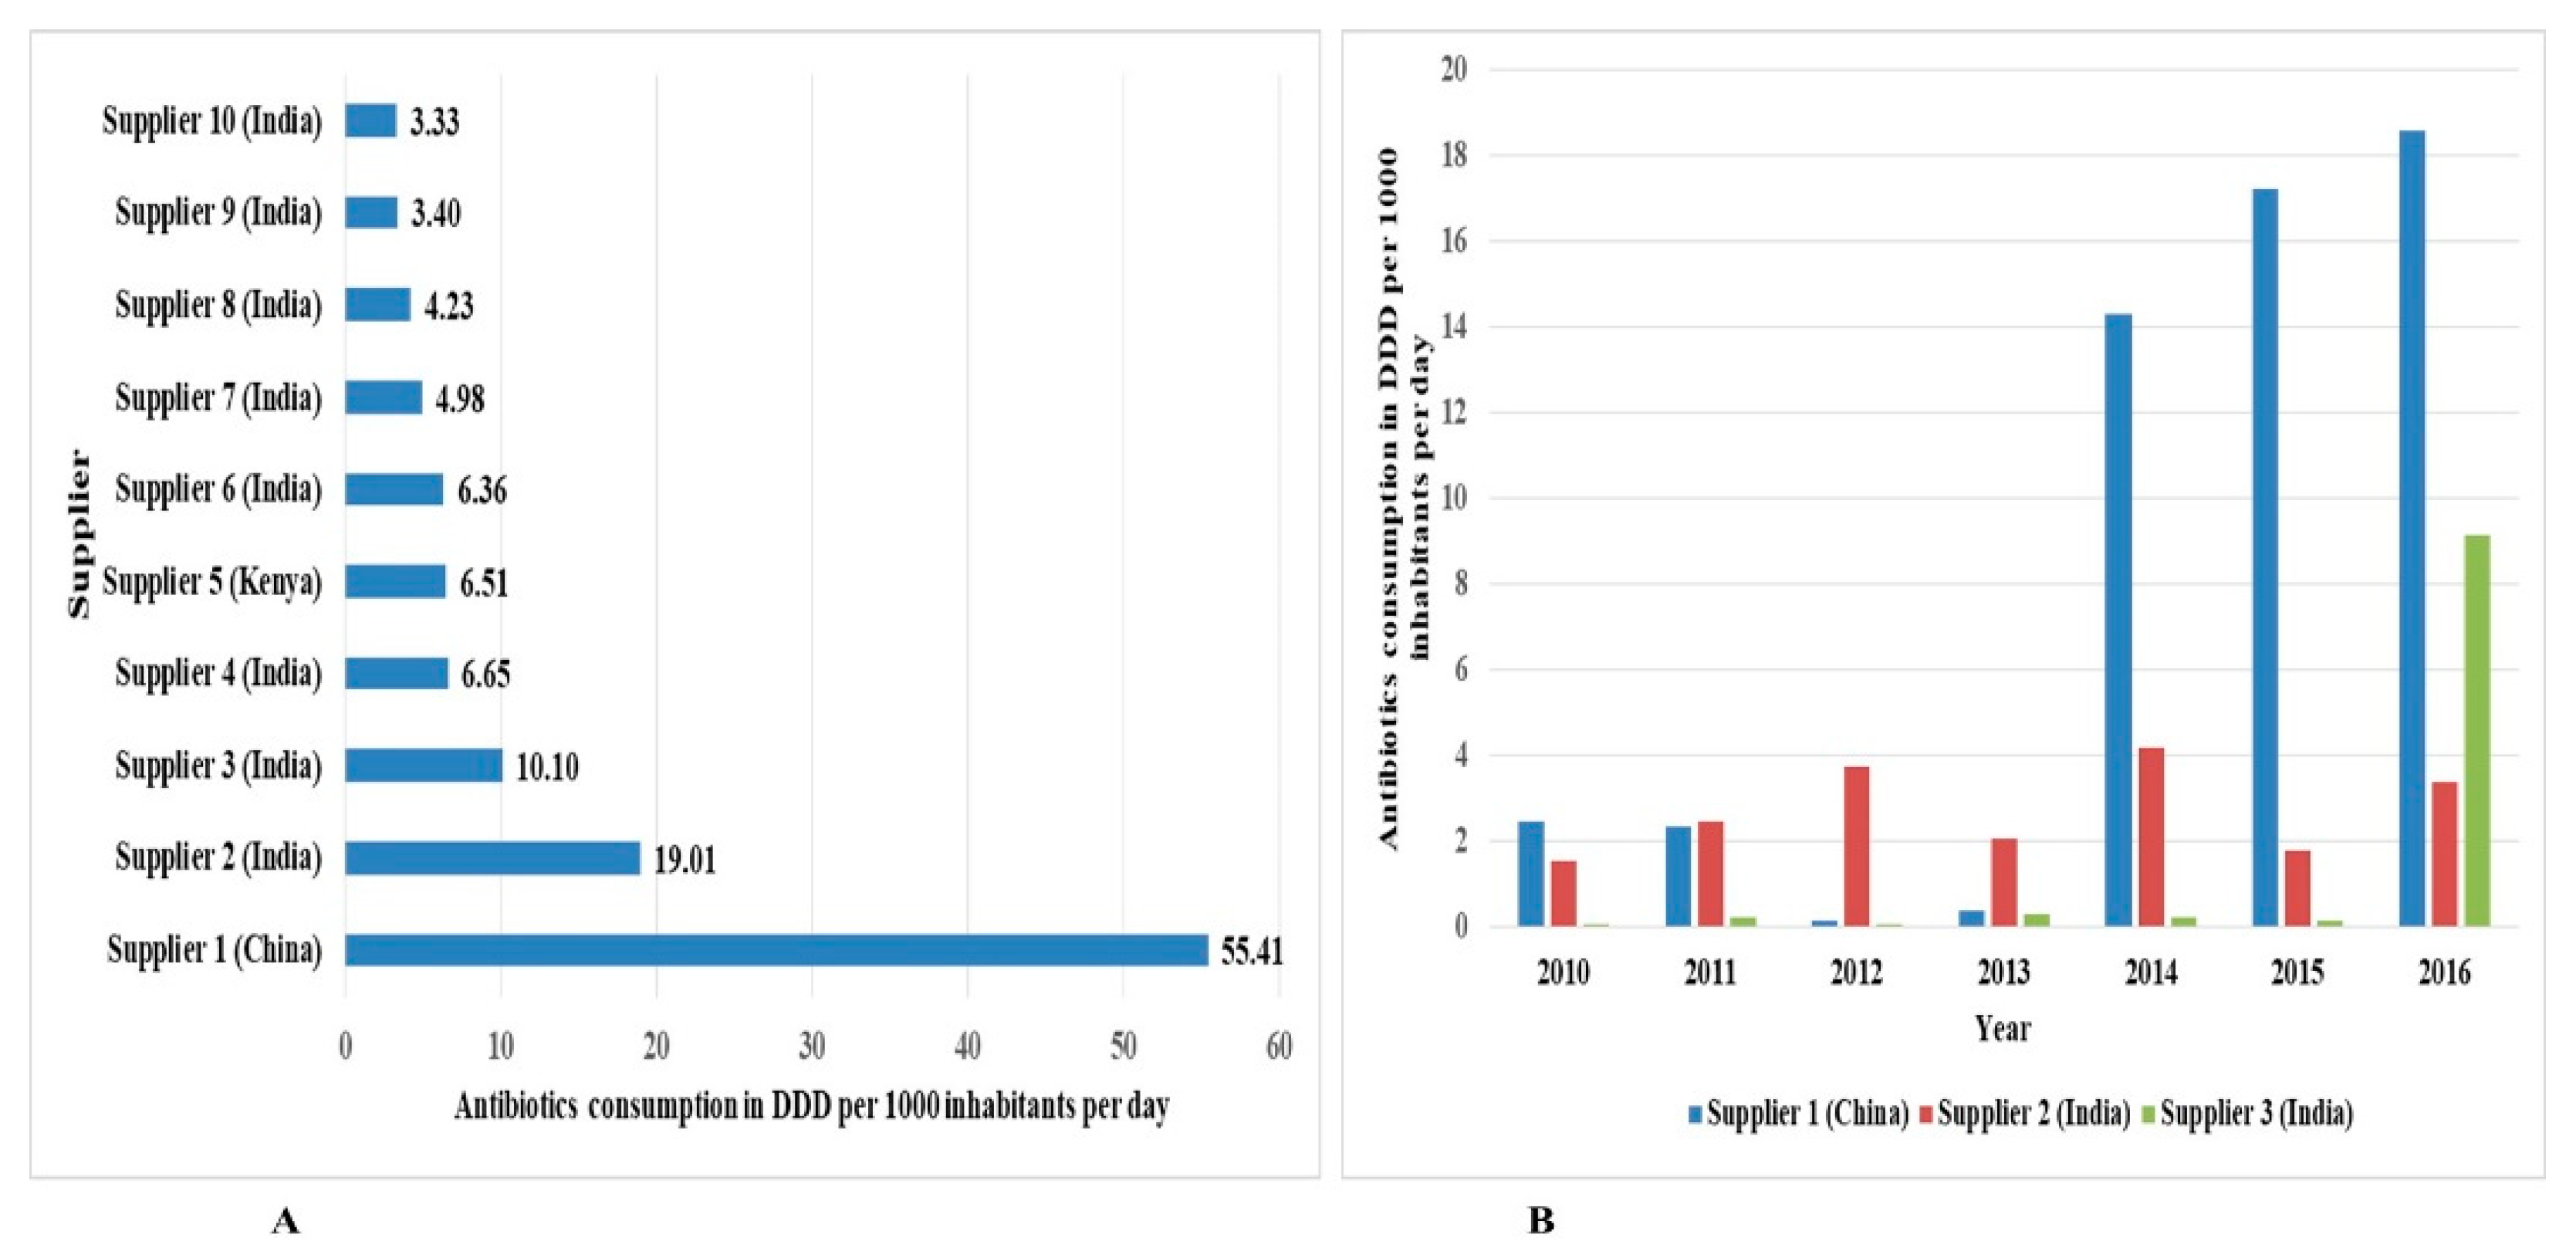
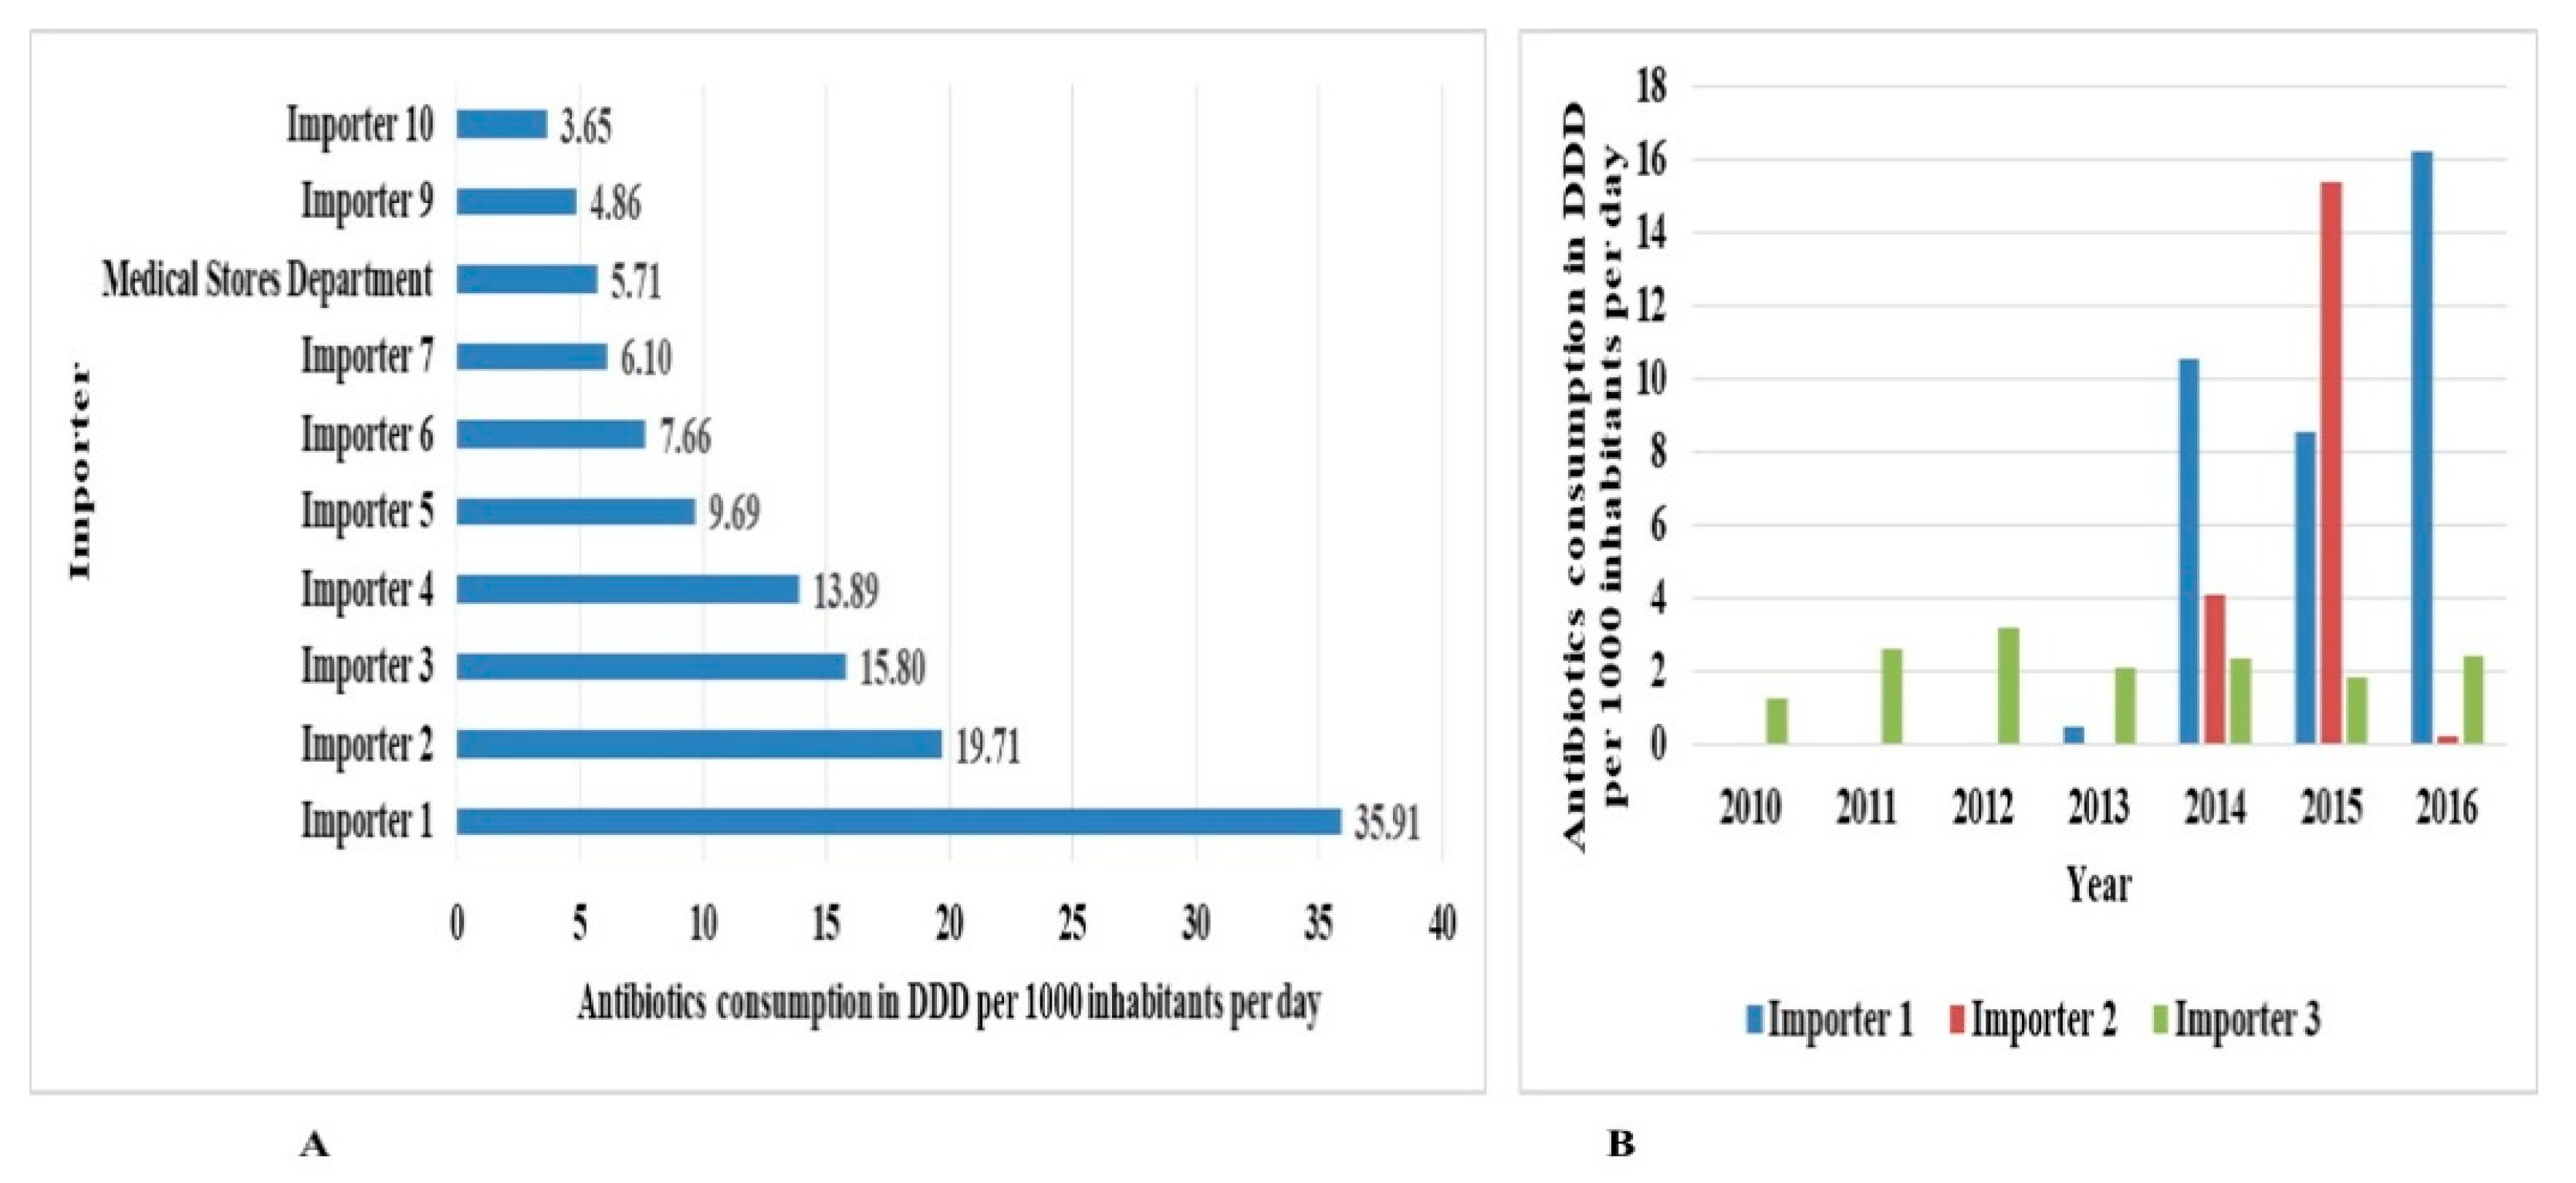
2. Results
3. Discussion
Limitation of the Study
4. Materials and Methods
4.1. Study Design
4.2. Study Setting
4.3. Data Sources
4.4. Exclusion Criteria
4.5. Data Collection
4.6. Data Cleaning
4.7. Data Analysis
5. Conclusions
Supplementary Materials
Author Contributions
Funding
Institutional Review Board Statement
Informed Consent Statement
Data Availability Statement
Conflicts of Interest
References
- Goossens, H. Antibiotic consumption and link to resistance. Clin. Microbiol. Infect. 2009, 15, 12–15. [Google Scholar] [CrossRef] [Green Version]
- Smith, R.A.; M’ikanatha, N.M.; Read, A.F. Antibiotic Resistance: A Primer and Call to Action. Health Commun. 2015, 30, 309–314. [Google Scholar] [CrossRef] [Green Version]
- Wise, R.; Hart, T.; Cars, O.; Streulens, M.; Helmuth, R.; Huovinen, P.; Sprenger, M. Antimicrobial resistance. Is a major threat to public health. BMJ 1998, 317, 609–610. [Google Scholar] [CrossRef] [Green Version]
- Van Boeckel, T.P.; Gandra, S.; Ashok, A.; Caudron, Q.; Grenfell, B.T.; Levin, S.A.; Laxminarayan, R. Global antibiotic consumption 2000 to 2010: An analysis of national pharmaceutical sales data. Lancet Infect. Dis. 2014, 14, 742–750. [Google Scholar] [CrossRef]
- Klein, E.Y.; Van Boeckel, T.P.; Martinez, E.M.; Pant, S.; Gandra, S.; Levin, S.A.; Goossens, H.; Laxminarayan, R. Global increase and geographic convergence in antibiotic consumption between 2000 and 2015. Proc. Natl. Acad. Sci. USA 2018, 115, E3463–E3470. [Google Scholar] [CrossRef] [Green Version]
- Laxminarayan, R.; Duse, A.; Wattal, C.; Zaidi, A.K.M.; Wertheim, H.F.L.; Sumpradit, N.; Vlieghe, E.; Hara, G.L.; Gould, I.M.; Goossens, H.; et al. Antibiotic resistance—The need for global solutions. Lancet Infect. Dis. 2013, 13, 1057–1098. [Google Scholar] [CrossRef] [Green Version]
- Mshana, S.E.; Matee, M.; Rweyemamu, M. Antimicrobial resistance in human and animal pathogens in Zambia, Democratic Republic of Congo, Mozambique and Tanzania: An urgent need of a sustainable surveillance system. Ann. Clin. Microbiol. Antimicrob. 2013, 12, 28. [Google Scholar] [CrossRef] [PubMed] [Green Version]
- Bywater, R.J. Veterinary Use of Antimicrobials and Emergence of Resistance in Zoonotic and Sentinel Bacteria in the EU. J. Vet. Med. Ser. B 2004, 51, 361–363. [Google Scholar] [CrossRef]
- Byrne, M.K.; Miellet, S.; McGlinn, A.; Fish, J.; Meedya, S.; Reynolds, N.; van Oijen, A.M. The drivers of antibiotic use and misuse: The development and investigation of a theory driven community measure. BMC Public Health 2019, 19, 1425. [Google Scholar] [CrossRef] [Green Version]
- Morgan, D.J.; Okeke, I.N.; Laxminarayan, R.; Perencevich, E.N.; Weisenberg, S. Non-prescription antimicrobial use worldwide: A systematic review. Lancet Infect. Dis. 2011, 11, 692–701. [Google Scholar] [CrossRef] [Green Version]
- Okeke, I.N.; Laxminarayan, R.; Bhutta, Z.A.; Duse, A.G.; Jenkins, P.; O’Brien, T.F.; Pablos-Mendez, A.; Klugman, K.P. Antimicrobial resistance in developing countries. Part I: Recent trends and current status. Lancet Infect. Dis. 2005, 5, 481–493. [Google Scholar] [CrossRef]
- Mboya, E.A.; Sanga, L.A.; Ngocho, J.S. Irrational use of antibiotics in the Moshi Municipality Northern Tanzania: A cross sectional study. Pan Afr. Med. J. 2018, 31, 1–10. [Google Scholar] [CrossRef]
- Mboya, E.A.; Davies, M.L.; Horumpende, P.G.; Ngocho, J.S. Inadequate knowledge on appropriate antibiotics use among clients in the Moshi municipality Northern Tanzania. PLoS ONE 2020, 15, e0239388. [Google Scholar] [CrossRef]
- Prestinaci, F.; Pezzotti, P.; Pantosti, A. Antimicrobial resistance: A global multifaceted phenomenon. Pathog. Glob. Health 2015, 109, 309–318. [Google Scholar] [CrossRef] [Green Version]
- Ilić, K.; Jakovljević, E.; Škodrić-Trifunović, V. Social-economic factors and irrational antibiotic use as reasons for antibiotic resistance of bacteria causing common childhood infections in primary healthcare. Eur. J. Pediatr. 2012, 171, 767–777. [Google Scholar] [CrossRef]
- Poyongo, B.P.; Sangeda, R.Z. Pharmacists’ Knowledge, Attitude and Practice Regarding the Dispensing of Antibiotics without Prescription in Tanzania: An Explorative Cross-Sectional Study. Pharmacy 2020, 8, 238. [Google Scholar] [CrossRef] [PubMed]
- Chalker, J.C.; Vialle-Valentin, C.; Liana, J.; Mbwasi, R.; Semali, I.A.; Kihiyo, B.; Shekalaghe, E.; Dillip, A.; Kimatta, S.; Valimba, R.; et al. What roles do accredited drug dispensing outlets in Tanzania play in facilitating access to antimicrobials? Results of a multi-method analysis. Antimicrob. Resist. Infect. Control 2015, 4, 33. [Google Scholar] [CrossRef] [Green Version]
- Dillip, A.; Embrey, M.; Shekalaghe, E.; Ross-Degnan, D.; Vialle-Valentin, C.; Kimatta, S.; Liana, J.; Rutta, E.; Valimba, R.; Chalker, J. What motivates antibiotic dispensing in accredited drug dispensing outlets in Tanzania? A qualitative study. Antimicrob. Resist. Infect. Control 2015, 4, 30. [Google Scholar] [CrossRef] [PubMed] [Green Version]
- Minzi, O.; Manyilizu, V.S. Application of basic pharmacology and dispensing practice of antibiotics in accredited drug-dispensing outlets in Tanzania. Drug Healthc. Patient Saf. 2013, 5, 5. [Google Scholar] [CrossRef] [PubMed] [Green Version]
- Chilongola, J.; Msoka, E.; Juma, A.; Kituma, E.; Kwigizile, E.; Nyombi, B. Antibiotics prescription practices for provisional malaria cases in three hospitals in Moshi, northern Tanzania. Tanzan. J. Health Res. 2015, 17, 1–10. [Google Scholar] [CrossRef]
- Reynolds, L.; McKee, M. Serve the people or close the sale? Profit-driven overuse of injections and infusions in China’s market-based healthcare system. Int. J. Health Plan. Manag. 2011, 26, 449–470. [Google Scholar] [CrossRef] [PubMed]
- Mikomangwa, W.P.; Bwire, G.M.; Kilonzi, M.; Mlyuka, H.; Mutagonda, R.; Kibanga, W.; Marealle, A.I.; Minzi, O.; Mwambete, K.D. The Existence of High Bacterial Resistance to Some Reserved Antibiotics in Tertiary Hospitals in Tanzania: A Call to Revisit Their Use. Infect. Drug Resist. 2020, 13, 1831–1838. [Google Scholar] [CrossRef] [PubMed]
- Moremi, N.; Claus, H.; Mshana, S.E. Antimicrobial resistance pattern: A report of microbiological cultures at a tertiary hospital in Tanzania. BMC Infect. Dis. 2016, 16, 756. [Google Scholar] [CrossRef] [Green Version]
- Mnyambwa, N.P.; Mahende, C.; Wilfred, A.; Sandi, E.; Mgina, N.; Lubinza, C.; Kahwa, A.; Petrucka, P.; Mfinanga, S.; Ngadaya, E.; et al. Antibiotic Susceptibility Patterns of Bacterial Isolates from Routine Clinical Specimens from Referral Hospitals in Tanzania: A Prospective Hospital-Based Observational Study. Infect. Drug Resist. 2021, 14, 869–878. [Google Scholar] [CrossRef] [PubMed]
- Tao, W.; Ivanovska, V.; Schweickert, B.; Muller, A. Proxy indicators for antibiotic consumption; surveillance needed to control antimicrobial resistance. Bull. World Health Organ. 2019, 97, 3. [Google Scholar] [CrossRef] [PubMed]
- Sangeda, R.Z.; Kibona, J.; Munishi, C.; Arabi, F.; Manyanga, V.P.; Mwambete, K.D.; Horumpende, P.G. Assessment of Implementation of Antimicrobial Resistance Surveillance and Antimicrobial Stewardship Programs in Tanzanian Health Facilities a Year After Launch of the National Action Plan. Front. Public Health 2020, 8, 454. [Google Scholar] [CrossRef]
- World Health Organization. Introduction to Drug Utilization Research Introduction to Drug Utilization Research. Available online: https://www.who.int/publications/i/item/8280820396 (accessed on 12 July 2021).
- Sataloff, R.T.; Johns, M.M.; Kost, K.M.; WHO Collaborating Centre for Drug Statistics Methodology. Guidelines for ATC Classification and DDD Assignment 2021. Available online: https://www.whocc.no/filearchive/publications/2021_guidelines_web.pdf (accessed on 16 January 2021).
- Munkholm, L.; Rubin, O. The global governance of antimicrobial resistance: A cross-country study of alignment between the global action plan and national action plans. Glob. Health 2020, 16, 109. [Google Scholar] [CrossRef]
- Frumence, G.; Mboera, L.E.G.; Sindato, C.; Katale, B.Z.; Kimera, S.; Metta, E.; Durrance-Bagale, A.; Jung, A.-S.; Mshana, S.E.; Clark, T.G.; et al. The Governance and Implementation of the National Action Plan on Antimicrobial Resistance in Tanzania: A Qualitative Study. Antibiotics 2021, 10, 273. [Google Scholar] [CrossRef] [PubMed]
- Sangeda, R.Z.; Baha, A.; Erick, A.; Mkumbwa, S.; Bitegeko, A.; Sillo, H.B.; Fimbo, A.M.; Chambuso, M.; Mbugi, E.V. Consumption Trends of Antibiotic for Veterinary Use in Tanzania: A Longitudinal Retrospective Survey From 2010–2017. Front. Trop. Dis. 2021, 2, 694082. [Google Scholar] [CrossRef]
- Mbwasi, R.; Mapunjo, S.; Wittenauer, R.; Valimba, R.; Msovela, K.; Werth, B.J.; Khea, A.M.; Nkiligi, E.A.; Lusaya, E.; Stergachis, A.; et al. National Consumption of Antimicrobials in Tanzania: 2017–2019. Front. Pharmacol. 2020, 11, 2017–2019. [Google Scholar] [CrossRef] [PubMed]
- Mitema, E.S.; Kikuvi, G.M. Surveillance of the overall use of antimicrobial drugs in humans over a 5 year period (1997–2001) in Kenya. J. Antimicrob. Chemother. 2004, 54, 966–967. [Google Scholar] [CrossRef]
- Abbasian, H.; Hajimolaali, M.; Yektadoost, A.; Zartab, S. Antibiotic utilization in Iran 2000–2016: Pattern analysis and benchmarking with organization for economic co-operation and development Countries. J. Res. Pharm. Pract. 2019, 8, 162. [Google Scholar] [CrossRef]
- Kanu, J.S.; Khogali, M.; Hann, K.; Tao, W.; Barlatt, S.; Komeh, J.; Johnson, J.; Sesay, M.; Vandi, M.A.; Tweya, H.; et al. National Antibiotic Consumption for Human Use in Sierra Leone (2017–2019): A Cross-Sectional Study. Trop. Med. Infect. Dis. 2021, 6, 77. [Google Scholar] [CrossRef]
- Kirua, R.B.; Temu, M.J.; Mori, A.T. Prices of medicines for the management of pain, diabetes and cardiovascular diseases in private pharmacies and the national health insurance in Tanzania. Int. J. Equity Health 2020, 19, 203. [Google Scholar] [CrossRef]
- Manyahi, J.; Matee, M.I.; Majigo, M.; Moyo, S.; Mshana, S.E.; Lyamuya, E.F. Predominance of multi-drug resistant bacterial pathogens causing surgical site infections in Muhimbili national hospital, Tanzania. BMC Res. Notes 2014, 7, 500. [Google Scholar] [CrossRef] [PubMed] [Green Version]
- Kiponza, R.; Balandya, B.; Majigo, M.V.; Matee, M. Laboratory confirmed puerperal sepsis in a national referral hospital in Tanzania: Etiological agents and their susceptibility to commonly prescribed antibiotics. BMC Infect. Dis. 2019, 19, 690. [Google Scholar] [CrossRef] [PubMed]
- Wande, D.P.; Sangeda, R.Z.; Tibalinda, P.; Mutta, I.K.; Mkumbwa, S.; Bitegeko, A.; Kaale, E. Pharmaceuticals imports in Tanzania: Overview of private sector market size, share, growth and projected trends to 2021. PLoS ONE 2019, 14, e0220701. [Google Scholar] [CrossRef] [Green Version]
- Mdegela, R.H.; Mwakapeje, E.R.; Rubegwa, B.; Gebeyehu, D.T.; Niyigena, S.; Msambichaka, V.; Nonga, H.E.; Antoine-Moussiaux, N.; Fasina, F.O. Antimicrobial Use, Residues, Resistance and Governance in the Food and Agriculture Sectors, Tanzania. Antibiotics 2021, 10, 454. [Google Scholar] [CrossRef]
- The United Republic of Tanzania Standard Treatment Guidelines & National Essential Medicines List Tanzania Mainland. Available online: http://www.tzdpg.or.tz/fileadmin/documents/dpg_internal/dpg_working_groups_clusters/cluster_2/health/Key_Sector_Documents/Tanzania_Key_Health_Documents/STANDARD_TREATMENT_GUIDELINES__CORRECT_FINAL_USE_THIS-1.pdf (accessed on 1 April 2021).
- Kimera, Z.I.; Mgaya, F.X.; Misinzo, G.; Mshana, S.E.; Moremi, N.; Matee, M.I.N. Multidrug-Resistant, Including Extended-Spectrum Beta Lactamase-Producing and Quinolone-Resistant, Escherichia coli Isolated from Poultry and Domestic Pigs in Dar es Salaam, Tanzania. Antibiotics 2021, 10, 406. [Google Scholar] [CrossRef]
- Kimera, Z.I.; Mgaya, F.X.; Mshana, S.E.; Karimuribo, E.D.; Matee, M.I.N. Occurrence of Extended Spectrum Beta Lactamase (ESBL) Producers, Quinolone and Carbapenem Resistant Enterobacteriaceae Isolated from Environmental Samples along Msimbazi River Basin Ecosystem in Tanzania. Int. J. Environ. Res. Public Health 2021, 18, 8264. [Google Scholar] [CrossRef] [PubMed]
- Kimera, Z.I.; Frumence, G.; Mboera, L.E.G.; Rweyemamu, M.; Mshana, S.E.; Matee, M.I.N. Assessment of Drivers of Antimicrobial Use and Resistance in Poultry and Domestic Pig Farming in the Msimbazi River Basin in Tanzania. Antibiotics 2020, 9, 838. [Google Scholar] [CrossRef] [PubMed]
- Kimera, Z.I.; Mshana, S.E.; Rweyemamu, M.M.; Mboera, L.E.G.; Matee, M.I.N. Antimicrobial use and resistance in food-producing animals and the environment: An African perspective. Antimicrob. Resist. Infect. Control 2020, 9, 37. [Google Scholar] [CrossRef] [PubMed] [Green Version]
- Hutchinson, J.M.; Patrick, D.M.; Marra, F.; Ng, H.; Bowie, W.R.; Heule, L.; Muscat, M.; Monnet, D.L. Measurement of Antibiotic Consumption: A Practical Guide to the Use of the Anatomical Therapeutic Chemical Classification and Defined Daily Dose System Methodology in Canada. Can. J. Infect. Dis. 2004, 15, 29–35. [Google Scholar] [CrossRef] [PubMed]
- World Health Organization ATC/DDD Index 2021. Available online: https://www.whocc.no/act_ddd_index (accessed on 1 July 2021).
- World Health Organization. The 2019 WHO AWaRe Classification of Antibiotics for Evaluation and Monitoring of Use. Available online: https://apps.who.int/iris/handle/10665/327957 (accessed on 17 July 2021).
- Kuster, S.P.; Ruef, C.; Ledergerber, B.; Hintermann, A.; Deplazes, C.; Neuber, L.; Weber, R. Quantitative antibiotic use in hospitals: Comparison of measurements, literature review, and recommendations for a standard of reporting. Infection 2008, 36, 549–559. [Google Scholar] [CrossRef] [PubMed] [Green Version]
- World Health Organization. WHO Regional Office for Europe Antimicrobial Medicines Consumption (AMC) Network. Available online: https://www.euro.who.int/en/publications/abstracts/who-regional-office-for-europe-antimicrobial-medicines-consumption-amc-network.-amc-data-20112017-2020 (accessed on 19 July 2021).
- Hsia, Y.; Lee, B.R.; Versporten, A.; Yang, Y.; Bielicki, J.; Jackson, C.; Newland, J.; Goossens, H.; Magrini, N.; Sharland, M.; et al. Use of the WHO Access, Watch, and Reserve classification to define patterns of hospital antibiotic use (AWaRe): An analysis of paediatric survey data from 56 countries. Lancet Glob. Health 2019, 7, e861–e871. [Google Scholar] [CrossRef] [Green Version]


| Year | Number of Permits | DID |
|---|---|---|
| 2010 | 1154 | 6.78 |
| 2011 | 1578 | 13.26 |
| 2012 | 2008 | 9.78 |
| 2013 | 2000 | 14.65 |
| 2014 | 2136 | 29.86 |
| 2015 | 1551 | 31.98 |
| 2016 | 1646 | 48.19 |
| Total | 12,073 | 154.51 |
| Defined Daily Dose (DDD Per 1000 Inhabitants Per Day (DID) | |||||||||
|---|---|---|---|---|---|---|---|---|---|
| AWaRe Class | 2010 | 2011 | 2012 | 2013 | 2014 | 2015 | 2016 | All Year’s Total | % of Class |
| Access | 5.060 | 11.238 | 6.307 | 10.049 | 25.382 | 28.879 | 41.456 | 128.371 | 83.083 |
| Watch | 1.253 | 1.454 | 2.445 | 2.000 | 2.655 | 2.020 | 3.729 | 15.554 | 10.067 |
| Other | 0.466 | 0.572 | 1.029 | 2.596 | 1.827 | 1.080 | 3.001 | 10.571 | 6.842 |
| Reserve | 0.0 | 0.010 | 0.002 | 0.001 | 0.012 | 0.008 | |||
| Total | 6.779 | 13.263 | 9.781 | 14.654 | 29.865 | 31.979 | 48.187 | 154.509 | 100.000 |
Publisher’s Note: MDPI stays neutral with regard to jurisdictional claims in published maps and institutional affiliations. |
© 2021 by the authors. Licensee MDPI, Basel, Switzerland. This article is an open access article distributed under the terms and conditions of the Creative Commons Attribution (CC BY) license (https://creativecommons.org/licenses/by/4.0/).
Share and Cite
Sangeda, R.Z.; Saburi, H.A.; Masatu, F.C.; Aiko, B.G.; Mboya, E.A.; Mkumbwa, S.; Bitegeko, A.; Mwalwisi, Y.H.; Nkiligi, E.A.; Chambuso, M.; et al. National Antibiotics Utilization Trends for Human Use in Tanzania from 2010 to 2016 Inferred from Tanzania Medicines and Medical Devices Authority Importation Data. Antibiotics 2021, 10, 1249. https://0-doi-org.brum.beds.ac.uk/10.3390/antibiotics10101249
Sangeda RZ, Saburi HA, Masatu FC, Aiko BG, Mboya EA, Mkumbwa S, Bitegeko A, Mwalwisi YH, Nkiligi EA, Chambuso M, et al. National Antibiotics Utilization Trends for Human Use in Tanzania from 2010 to 2016 Inferred from Tanzania Medicines and Medical Devices Authority Importation Data. Antibiotics. 2021; 10(10):1249. https://0-doi-org.brum.beds.ac.uk/10.3390/antibiotics10101249
Chicago/Turabian StyleSangeda, Raphael Zozimus, Habibu Ally Saburi, Faustine Cassian Masatu, Beatrice Godwin Aiko, Erick Alexander Mboya, Sonia Mkumbwa, Adonis Bitegeko, Yonah Hebron Mwalwisi, Emmanuel Alphonse Nkiligi, Mhina Chambuso, and et al. 2021. "National Antibiotics Utilization Trends for Human Use in Tanzania from 2010 to 2016 Inferred from Tanzania Medicines and Medical Devices Authority Importation Data" Antibiotics 10, no. 10: 1249. https://0-doi-org.brum.beds.ac.uk/10.3390/antibiotics10101249