Effects of Antibiotics on the Intestinal Microbiota of Mice

 , and
, and
Abstract
:1. Introduction
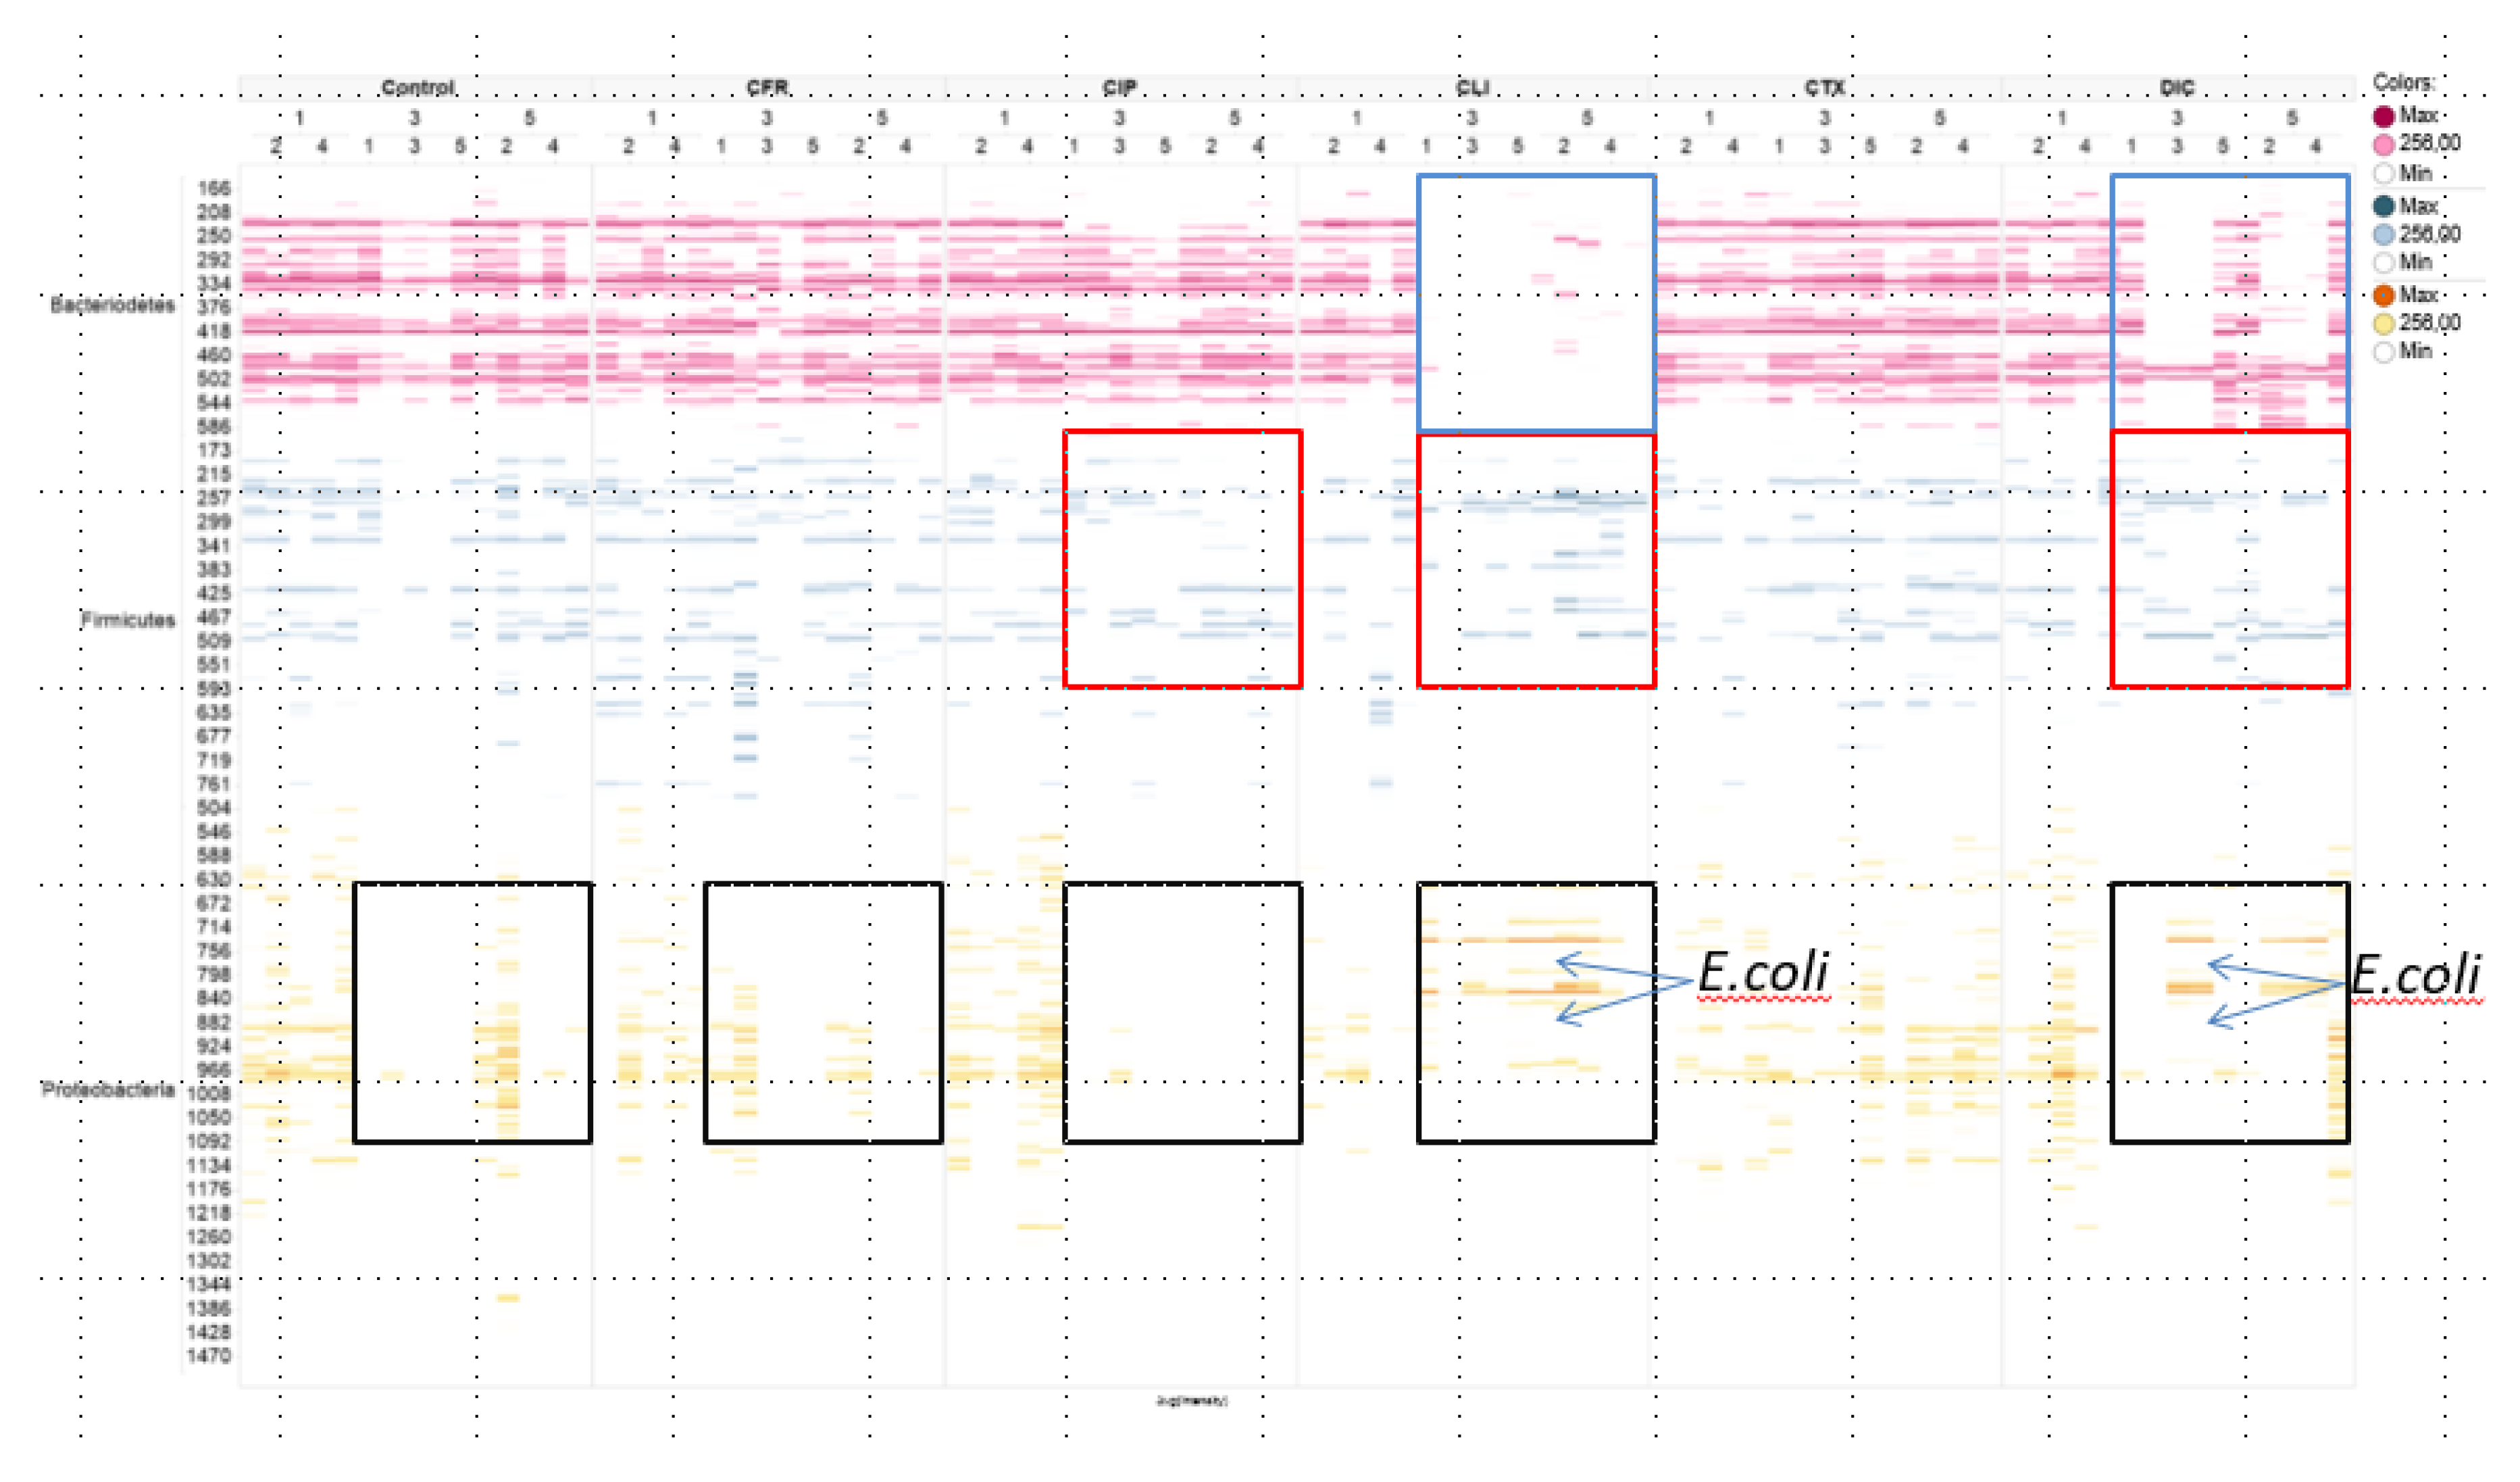
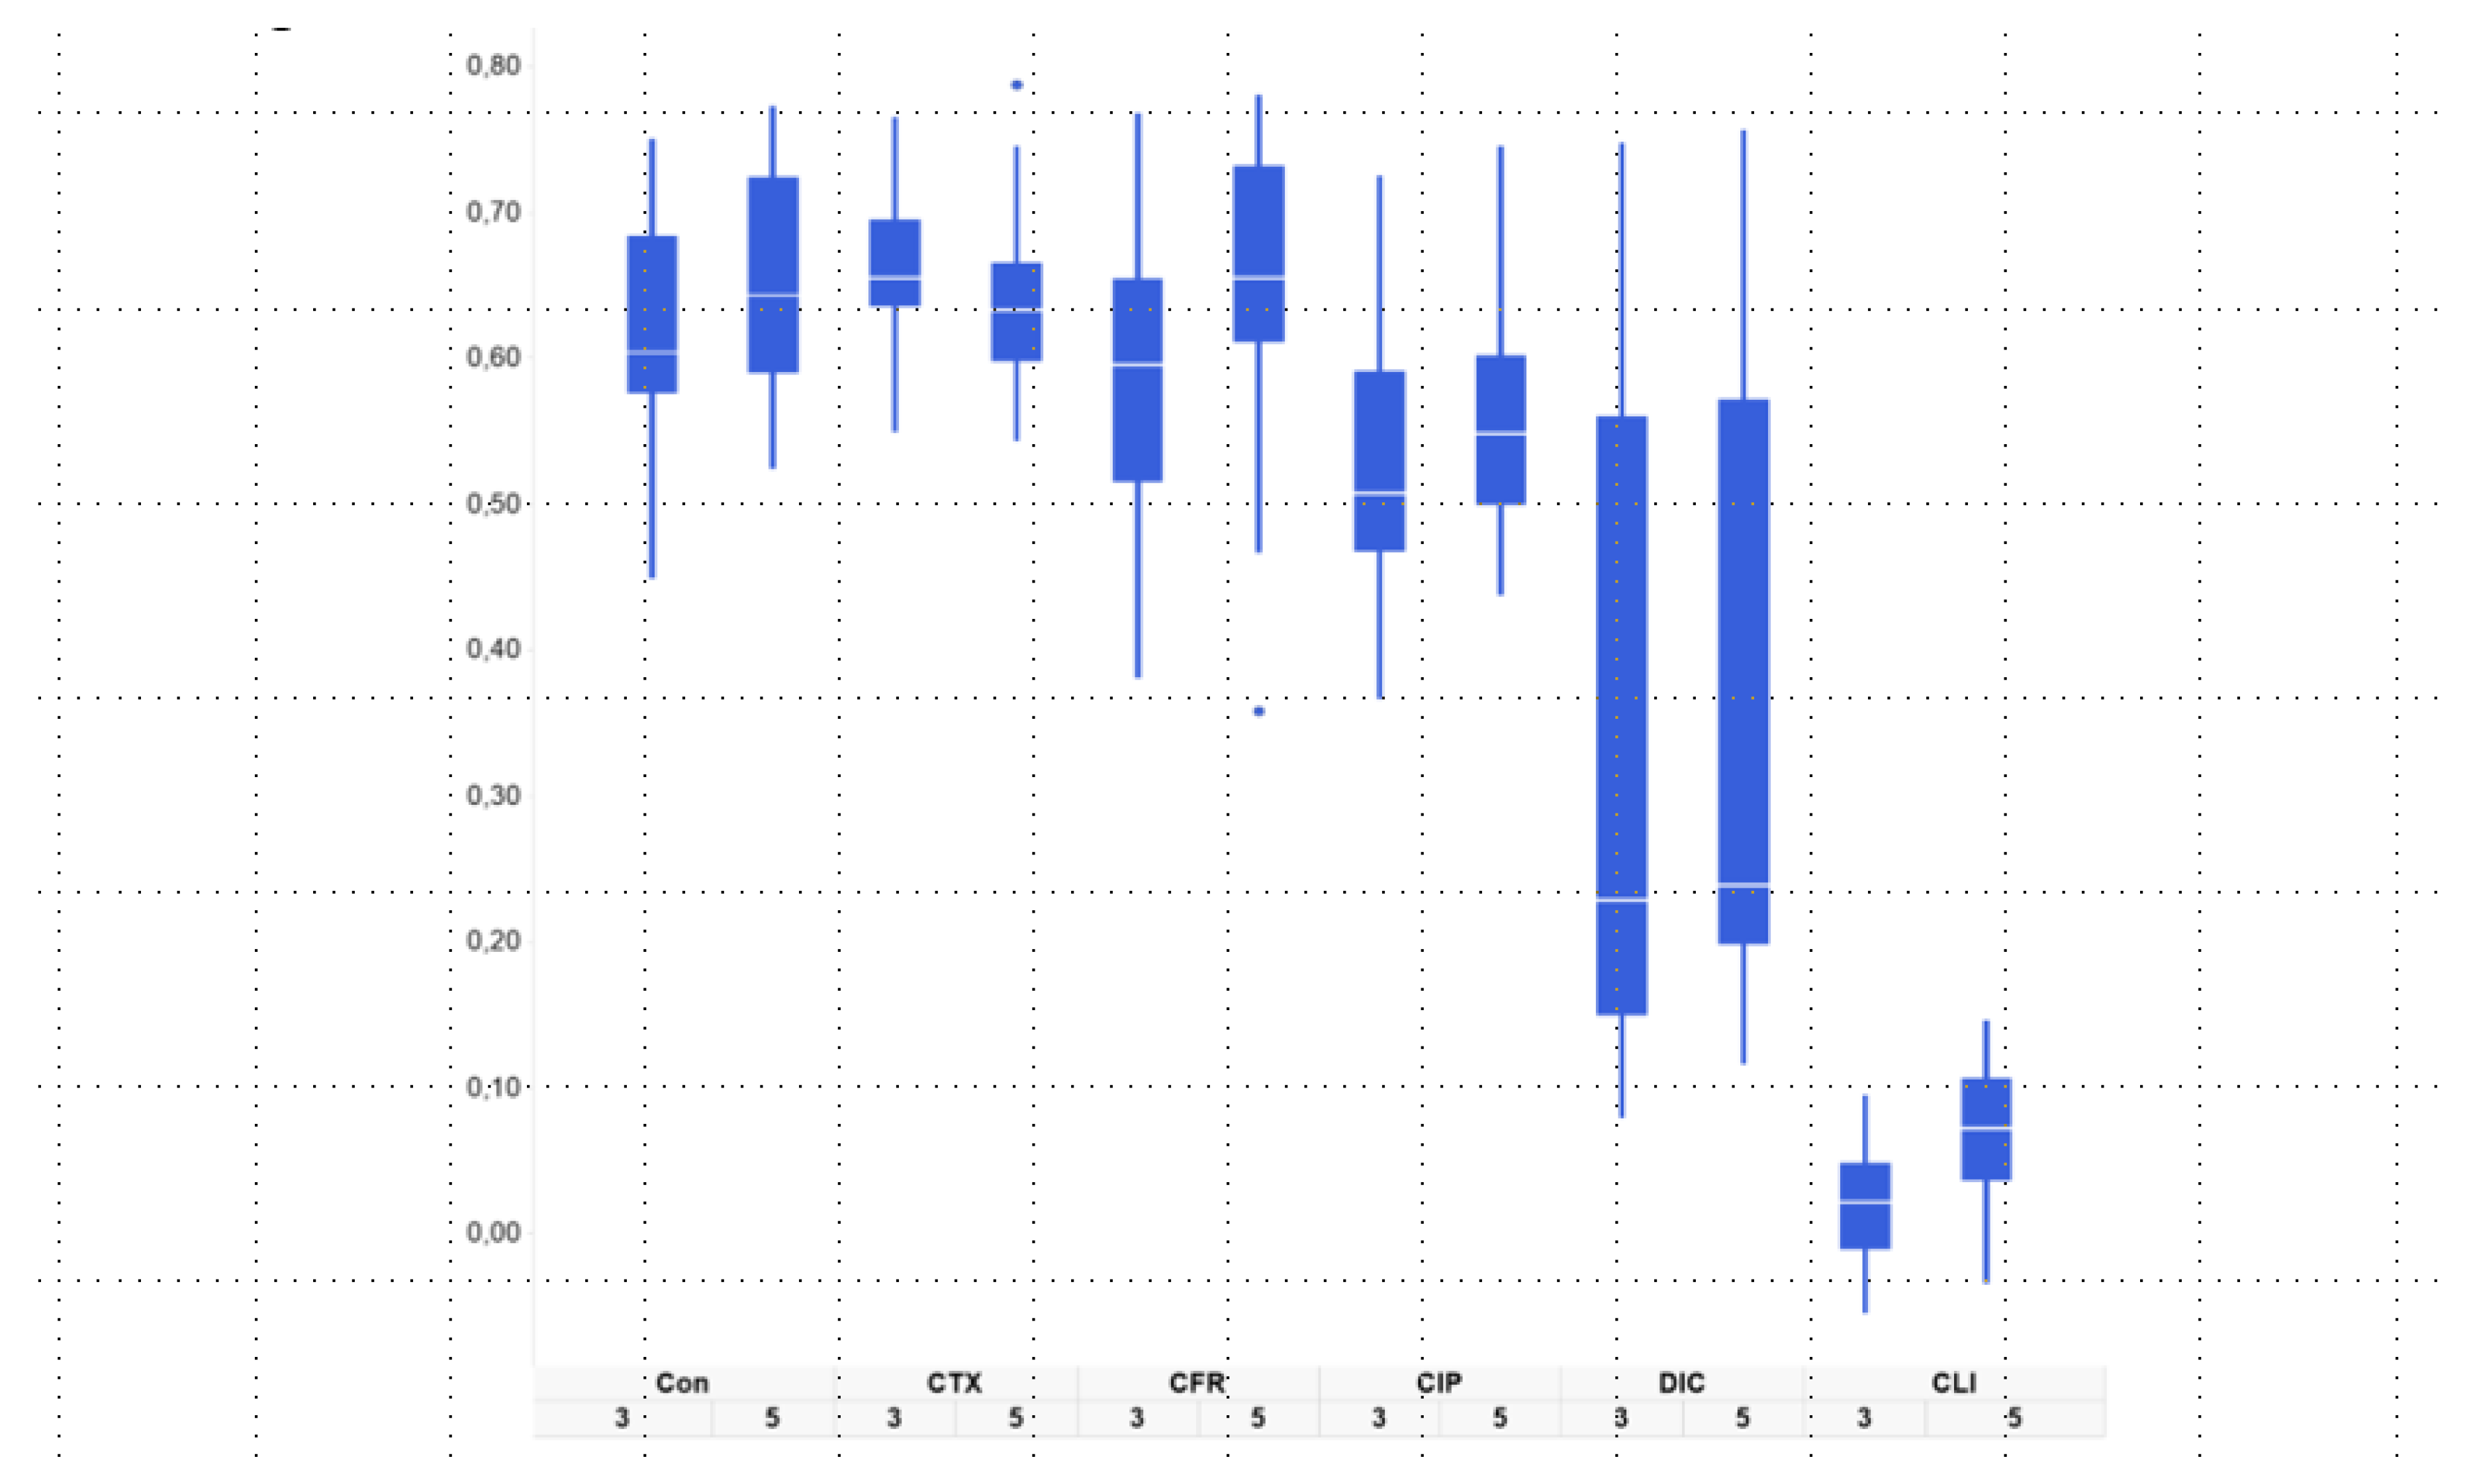
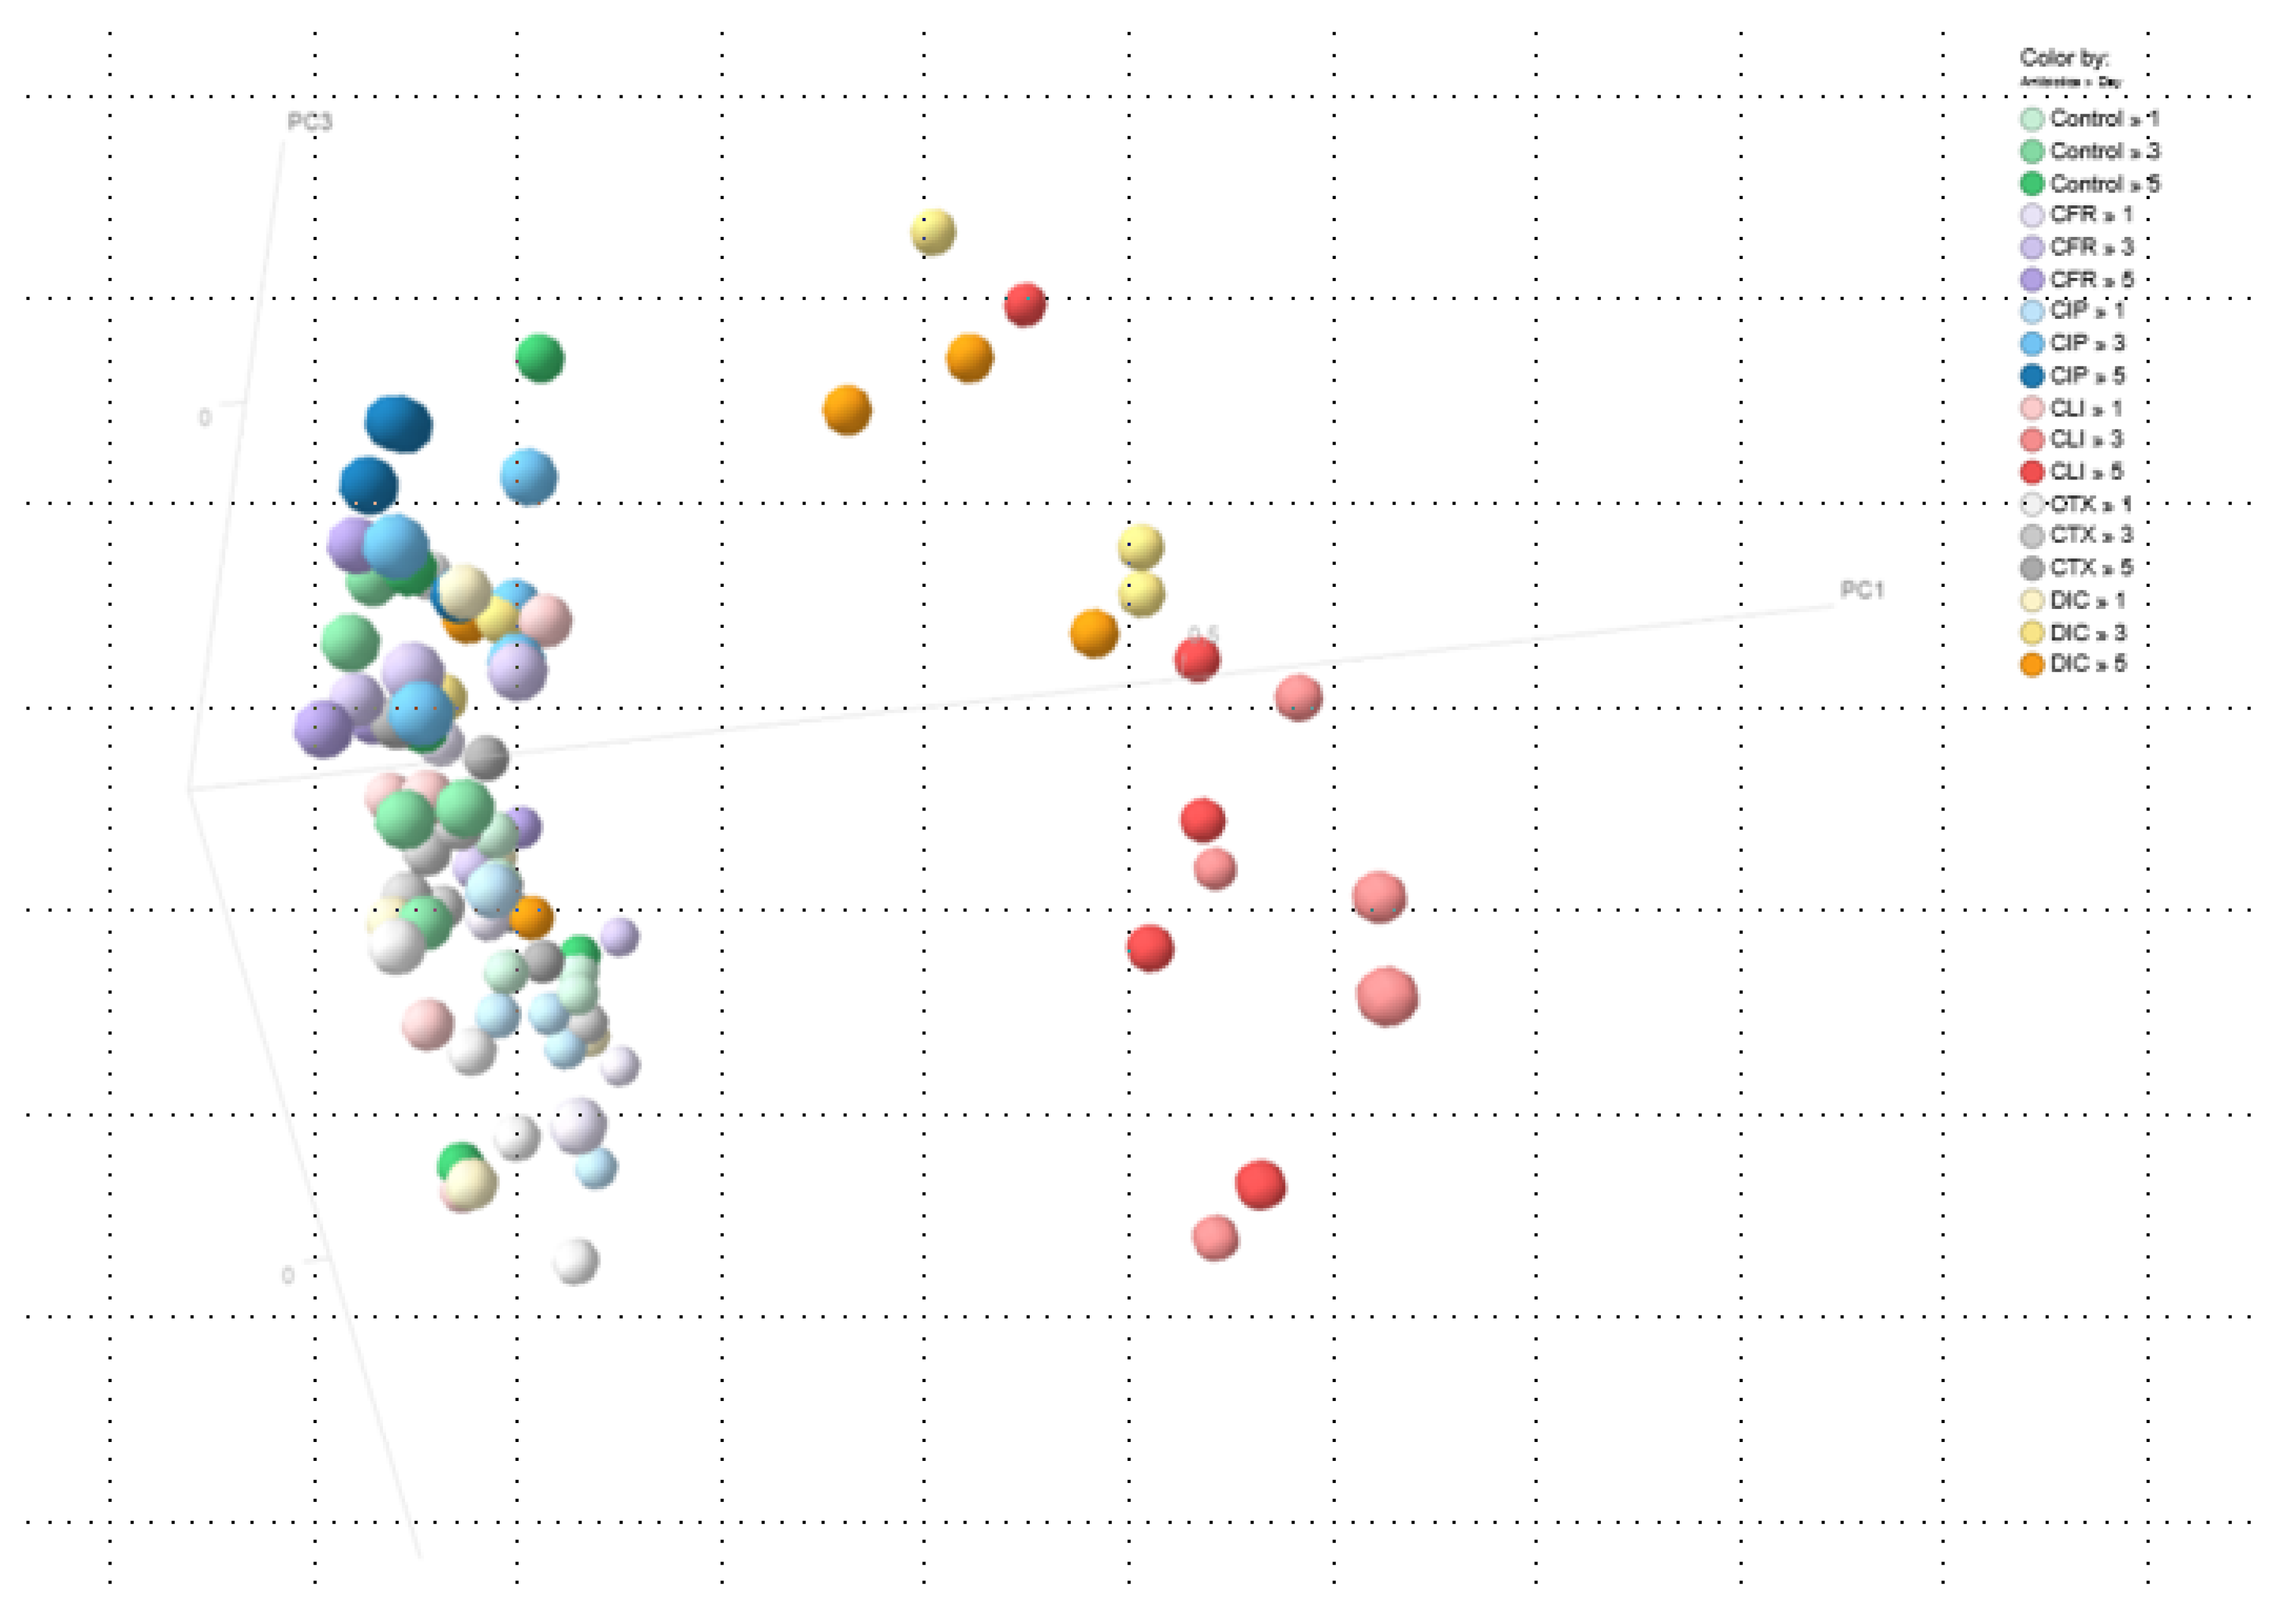
2. Results
3. Discussion
4. Materials and Methods
4.1. Mouse Model
4.2. IS-Profiling of the Intestinal Microbiome
4.3. Principal Coordinates Analysis (PCoA)
4.4. Statistical Analyses
5. Conclusions
Supplementary Materials
Author Contributions
Funding
Conflicts of Interest
References
- Keith, J.W.; Pamer, E.G. Enlisting commensal microbes to resist antibiotic- resistant pathogens. J. Exp. Med. 2019, 216, 10–19. [Google Scholar] [CrossRef] [PubMed] [Green Version]
- Kim, S.; Covington, A.; Pamer, E.G. The intestinal microbiota: Antibiotics, colonization resistance, and enteric pathogens. Immunol. Rev. 2017, 279, 90–105. [Google Scholar] [CrossRef] [PubMed]
- Buelow, E.; Fuentes, S.; de Steenhuijsen Piters, W.A.; Lahti, L.; Bayjanov, J.R.; Majoor, E.A.; Braat, J.C.; van Mourik, M.S.; Oostdijk, E.A.; Willems, R.J.; et al. Comparative gut microbiota and resistome profiling of intensive care patients receiving selective digestive tract decontamination and healthy subjects. Microbiome 2017, 5, 88. [Google Scholar] [CrossRef] [PubMed] [Green Version]
- Lewis, B.B.; Pamer, E.G. Microbiota Therapy for Clostridium difficile and Antibiotic Resistant Enteric Infections. Annu. Rev. Microbiol. 2017, 71, 157–178. [Google Scholar] [CrossRef]
- Ullmann, A.J.; Aguado, J.M.; Arikan-Akdagli, S.; Denning, D.W.; Groll, A.H.; Lagrou, K.; Lass-Flörl, C.; Lewis, R.E.; Munoz, P.; Verweij, P.E.; et al. Diagnosis and management of Aspergillus diseases: Executive summary of the 2017 ESCMID-ECMM-ERS guideline. Clin. Microbiol. Infect. 2018, 24, e1–e38. [Google Scholar] [CrossRef]
- Pietrucha-Dilanchian, P.; Hooton, T.M. Anatomy and Physiology of the Urinary Tract: Relation to Host Defense and Microbial Infection. Microbiol. Spectr. ASM 2016, 3. [Google Scholar] [CrossRef] [Green Version]
- Grazul, H.; Kanda, L.L.; Gondek, D. Impact of probiotic supplements on microbiome diversity following antibiotic treatment of mice. Gut Microbes 2016, 7, 101–114. [Google Scholar] [CrossRef] [Green Version]
- Lange, K.; Buerger, M.; Stallmach, A.; Bruns, T. Effects of Antibiotics on Gut Microbiota. Dig. Dis. 2016, 34, 260–268. [Google Scholar] [CrossRef] [PubMed]
- Hertz, F.B.; Lobner-Olesen, A.; Frimodt-Moller, N. Antibiotic Selection of Escherichia coli Sequence Type 131 in a Mouse Intestinal Colonization Model. Antimicrob. Agents Chemother. 2014, 58, 6139–6144. [Google Scholar] [CrossRef] [Green Version]
- Gillespie, S.H. Antibiotic resistance protocols. Methods Mol. Biol. 2011, 46, 820–821. [Google Scholar]
- Langdon, A.; Crook, N.; Dantas, G. The effects of antibiotics on the microbiome throughout development and alternative approaches for therapeutic modulation. Genome Med. 2016, 8, 39. [Google Scholar] [CrossRef] [PubMed] [Green Version]
- Reeves, A.E.; Theriot, C.M.; Bergin, I.L.; Huffnagle, G.B.; Schloss, P.D.; Young, V.B. The interplay between microbiome dynamics and pathogen dynamics in a murine model of Clostridium difficile infection. Gut Microbes 2011, 2, 145–158. [Google Scholar] [CrossRef] [PubMed] [Green Version]
- Choo, J.M.; Kanno, T.; Zain, N.M.M.; Leong, L.E.; Abell, G.C.; Keeble, J.E.; Bruce, K.D.; Mason, A.J.; Rogers, G.B. Divergent Relationships between Fecal Microbiota and Metabolome following Distinct Antibiotic-Induced Disruptions. mSphere 2017, 2, e00005-17. [Google Scholar] [CrossRef] [PubMed] [Green Version]
- Chakraborty, R.; Lam, V.; Kommineni, S.; Stromich, J.; Hayward, M.; Kristich, C.J.; Salzman, N.H. Ceftriaxone administration disrupts intestinal homeostasis, mediating noninflammatory proliferation and dissemination of commensal enterococci. Infect. Immun. 2018, 86, e00674-18. [Google Scholar] [CrossRef] [Green Version]
- Kanwal, S.; Joseph, T.P.; Owusu, L.; Xiaomeng, R.; Meiqi, L.; Yi, X. A polysaccharide isolated from Dictyophora indusiata promotes recovery from antibiotic-driven intestinal dysbiosis and improves gut epithelial barrier function in a mouse model. Nutrients 2018, 10, 1003. [Google Scholar] [CrossRef] [Green Version]
- Dantas, G.; Sommer, M.O.; Degnan, P.H.; Goodman, A.L. Experimental Approaches for Defining Functional Roles of Microbes in the Human Gut. Annu. Rev. Microbiol. 2013, 67, 157–176. [Google Scholar] [CrossRef] [Green Version]
- Busch, D.F.; Kureshi, L.A.; Sutter, V.L.; Finegold, S.M. Susceptibility of respiratory tract anaerobes to orally administered penicillins and cephalosporins. Antimicrob. Agents Chemother. 1976, 10, 713–720. [Google Scholar] [CrossRef] [Green Version]
- Grayson, M.L.; Crowe, S.M.; McCarthy, J.S.; Mills, J.; Mouton, J.W.; Norrby, S.R.; Paterson, D.L.; Pfaller, M.A. (Eds.) Kucers´ The Use of Antibiotics, 6th ed.; ASM Press: Washington, DC, USA, 2010. [Google Scholar]
- Stentz, R.; Horn, N.; Cross, K.; Salt, L.; Brearley, C. Cephalosporinases associated with outer membrane vesicles released by Bacteroides spp. protect gut pathogens and commensals against β-lactam antibiotics. J. Antimicrob. Chemother. 2015, 70, 701–709. [Google Scholar] [CrossRef] [Green Version]
- Hertz, F.B.; Schønning, K.; Rasmussen, S.C.; Littauer, P.; Knudsen, J.D.; Løbner-Olesen, A.; Frimodt-Møller, N. Epidemiological factors associated with ESBL- and non ESBL-producing E. coli causing urinary tract infection in general practice. Infect. Dis. (Auckl.) 2016, 48, 241–245. [Google Scholar] [CrossRef]
- Regionen. Antibiotika—Dosering, forholdsregler og behandlingsrekommandationer—Håndbog Udgiver. 2017. Available online: https://www.regionh.dk/hospitalsinfektioner/nyheder/Sider/region-hovedstaden-har-f%C3%A5et-ny-f%C3%A6lles-antibiotikavejledning.aspx (accessed on 23 October 2015).
- Krych, L.; Hansen, C.H.F.; Hansen, A.K.; van den Berg, F.W.J.; Nielsen, D.S. Quantitatively Different, yet Qualitatively Alike: A Meta-Analysis of the Mouse Core Gut Microbiome with a View towards the Human Gut Microbiome. PLoS ONE 2013, 8, e62578. [Google Scholar] [CrossRef] [Green Version]
- Leatham, M.P.; Stevenson, S.J.; Gauger, E.J.; Krogfelt, K.A.; Lins, J.J.; Haddock, T.L.; Autieri, S.M.; Conway, T.; Cohen, P.S. Mouse Intestine Selects Nonmotile flhDC Mutants of Escherichia coli MG1655 with Increased Colonizing Ability and Better Utilization of Carbon Sources. Infect. Immun. 2005, 73, 8039–8049. [Google Scholar] [CrossRef] [PubMed] [Green Version]
- Donskey, C.J.; Helfand, M.S.; Pultz, N.J.; Rice, L.B. Effect of Parenteral Fluoroquinolone Administration on Persistence of Vancomycin-Resistant Enterococcus faecium in the Mouse Gastrointestinal Tract. Society 2004, 48, 326–328. [Google Scholar] [CrossRef] [PubMed] [Green Version]
- Flückiger, U.; Segessenmann, C.; Gerber, U. Integration of pharmacokinetics and pharmacodynamics of imipenem in a human-adapted mouse model. Antimicrob. Agents Chemother. 1991, 35, 1905–1910. [Google Scholar] [CrossRef] [PubMed] [Green Version]
- Perez, F.; Pultz, M.J.; Endimiani, A.; Bonomo, R.A.; Donskey, C.J. Effect of antibiotic treatment on establishment and elimination of intestinal colonization by KPC-producing Klebsiella pneumoniae in mice. Antimicrob. Agents Chemother. 2011, 55, 2585–2589. [Google Scholar] [CrossRef] [PubMed] [Green Version]
- Erlendsdottir, H.; Knudsen, J.D.; Odenholt, I.; Cars, O.; Espersen, F.; Frimodt-Møller, N.; Fuursted, K.; Kristinsson, K.G.; Gudmundsson, S. Penicillin Pharmacodynamics in Four Experimental Pneumococcal Infection Models. Antimicrob. Agents Chemother. 2001, 45, 1078–1085. [Google Scholar] [CrossRef] [Green Version]
- Knudsen, J.D.; Fuursted, K.; Frimodt-Møller, N.; Espersen, F. Comparison of the effect of cefepime with four cephalosporins against pneumococci with various susceptibilities to penicillin, in vitro and in the mouse peritonitis model. J. Antimicrob. Chemother. 1997, 40, 679–686. [Google Scholar] [CrossRef] [Green Version]
- Jakobsen, L.; Cattoir, V.; Jensen, K.S.; Hammerum, A.M.; Nordmann, P.; Frimodt-Møller, N. Impact of low-level fluoroquinolone resistance genes qnrA1, qnrB19 and qnrS1 on ciprofloxacin treatment of isogenic Escherichia coli strains in a murine urinary tract infection model. J. Antimicrob. Chemother. 2012, 67, 2438–2444. [Google Scholar] [CrossRef]
- Sandberg, A.; Hessler, J.H.R.; Skov, R.L.; Blom, J.; Frimodt-Møller, N. Intracellular activity of antibiotics against Staphylococcus aureus in a mouse peritonitis model. Antimicrob. Agents Chemother. 2009, 53, 1874–1883. [Google Scholar] [CrossRef] [Green Version]
- Kerrn, M.B.; Frimodt-Møller, N.; Espersen, F. Effects of Sulfamethizole and Amdinocillin against Escherichia coli Strains (with Various Susceptibilities) in an Ascending Urinary Tract Infection Mouse Model. Antimicrob. Agents Chemother. 2003, 47, 1002–1009. [Google Scholar] [CrossRef] [Green Version]
- Asahi, Y.; Miyazaki, S.; Yamaguchi, K. In vitro and in vivo antibacterial activities of BO-2727, a new carbapenem. Antimicrob. Agents Chemother. 1995, 39, 1030–1037. [Google Scholar] [CrossRef] [Green Version]
- Frimodt-Møller, N.; Thomsen, V. The pneumococcus and the mouse protection test: Correlation of in vitro and in vivo activity for betalactam antibiotics, vancomycin, erythromycin and gentamicin. Acta Path Microbiol. Immunol. Scand. 1987, 95, 159–165. [Google Scholar] [CrossRef]
- Budding, A.E.; Grasman, M.E.; Lin, F.; Bogaards, J.A.; Soeltan-Kaersenhout, D.J.; Vandenbroucke-Grauls, C.M.J.E.; Van Bodegraven, A.A.; Savelkoul, P.H.M. IS-pro: High-throughput molecular fingerprinting of the intestinal microbiota. FASEB J. 2010, 24, 4556–4564. [Google Scholar] [CrossRef]
- Goodrich, J.K.; Di Rienzi, S.C.; Poole, A.C.; Koren, O.; Walters, W.A.; Caporaso, J.G.; Knight, R.; Ley, R.E. Conducting a microbiome study. Cell 2014, 158, 250–262. [Google Scholar] [CrossRef] [Green Version]


| Groups Receiving Antibiotics vs. Controls | T1–T3 | T1–T5 |
|---|---|---|
| CFR | 0.47194285 | 0.79228912 |
| CIP | 0.00086195 | 7.16 × 10⁻⁵ |
| CLI | 5.12 × 10⁻³⁵ | 1.72 × 10⁻³⁴ |
| CTX | 0.00590382 | 0.43879666 |
| DIC | 1.45 × 10⁻⁶ | 9.86 × 10⁻⁸ |
| Antibiotic | Dose Human | Cmax, Human µg/mL | Needed Dose Per Mice mg/kg | Cmax, Mouse µg/mL | Dose Given. Calculated by Weight Per Mouse in mg/day |
|---|---|---|---|---|---|
| Cefuroxime | 1.5 g iv | 65 | 120 | 50–60 | 4 |
| Cefotaxime | 1 g iv | 40 | 60 | 100 | 2 |
| Dicloxacillin | 1 g iv | 30–40 | 60 | 90 | 2 |
| Clindamycin | 1.8 g iv | 6 | 36 | 8 | 1.4 |
| Ciprofloxacin | 0.4 g iv | 4 | 15 | 2 | 0.5 |
© 2020 by the authors. Licensee MDPI, Basel, Switzerland. This article is an open access article distributed under the terms and conditions of the Creative Commons Attribution (CC BY) license (http://creativecommons.org/licenses/by/4.0/).
Share and Cite
Hertz, F.B.; Budding, A.E.; van der Lugt-Degen, M.; Savelkoul, P.H.; Løbner-Olesen, A.; Frimodt-Møller, N. Effects of Antibiotics on the Intestinal Microbiota of Mice. Antibiotics 2020, 9, 191. https://0-doi-org.brum.beds.ac.uk/10.3390/antibiotics9040191
Hertz FB, Budding AE, van der Lugt-Degen M, Savelkoul PH, Løbner-Olesen A, Frimodt-Møller N. Effects of Antibiotics on the Intestinal Microbiota of Mice. Antibiotics. 2020; 9(4):191. https://0-doi-org.brum.beds.ac.uk/10.3390/antibiotics9040191
Chicago/Turabian StyleHertz, Frederik Boetius, Andries E. Budding, Malieka van der Lugt-Degen, Paul H. Savelkoul, Anders Løbner-Olesen, and Niels Frimodt-Møller. 2020. "Effects of Antibiotics on the Intestinal Microbiota of Mice" Antibiotics 9, no. 4: 191. https://0-doi-org.brum.beds.ac.uk/10.3390/antibiotics9040191