Analysis of the DC Bias Effects on the UHV Autotransformer with Rated Load Based on a Reduced-Scale Model Experiment


State Key Laboratory of Alternate Electrical Supply System with Renewable Energy Sources, North China Electric Power University, Beijing 102206, China
*
Author to whom correspondence should be addressed.
Appl. Sci. 2020, 10(4), 1529; https://0-doi-org.brum.beds.ac.uk/10.3390/app10041529
Submission received: 28 January 2020
/
Revised: 15 February 2020
/
Accepted: 20 February 2020
/
Published: 24 February 2020
(This article belongs to the Section Electrical, Electronics and Communications Engineering)
Abstract
:Featured Application
This paper proposes a new equivalent technique, the DC bias current equivalent relationship between the UHV transformer and the reduced-scale model (RSM) is established by means of the identical saturation degree, the proposed RSM is capable to reflect the actual operation of the UHV transformer under DC bias.
Abstract
The DC bias of transformers as a result of geomagnetically induced currents (GIC), monopole operation of high voltage direct current (HVDC) transmission and the increasing power electronic devices in the power grid, creates a high magnitude of fundamental and harmonic components in winding currents, reactive power, and vibro-acoustic noise. For transformers with large capacity, it is very expensive and difficult to carry out an in-depth DC bias effects investigation on a practical equipment, especially for the ultra-high voltage (UHV) transformer. In this paper, a reduced-scale model (RSM) based on the principle of identical saturation degree is proposed, and the equivalent relationship of DC bias current is obtained. Furthermore, the DC bias platform with the RSM is established, experiments have been conducted to analyze the characteristics of the transformer under DC bias. It turns out from the experiments that the current of high voltage side and excitation are less tolerated to the DC bias current, the distortion occurs during the first half of the cycle and peaking at the quarter. Besides, the no-load loss and total harmonic distortion (THD) increase significantly with an increasing DC bias. The results of the characteristics of RSM with load under DC bias may provide great services in protecting and reducing the DC bias effects on the UHV transformer in actual operation.
1. Introduction
Due to the geomagnetically induced current (GIC) caused by periodic solar storms, monopole operation of the large-scale construction of high voltage direct current (HVDC) transmission and harmonics caused by the increasing nonlinear loads in the power grid, the direct current (DC) flows through the earthed neutrals of the transformer and cause a DC bias to the magnetizing current of the transformer [1,2,3,4,5]. This results in the asymmetric magnetic core saturation during a sinusoidal half-period, the serious distortion of excitation current, increased reactive power absorption, partial overheating and increase of vibration and noise [6,7,8,9,10,11,12]. Because of depletion of fossil fuel reserves and increasing demand for energy consumption, the ultra-high voltage UHV transmission projects have been put into service for solving the energy crisis. The (UHV) autotransformer is the key equipment of the UHV transmission systems, mostly with self-coupling structure, which has less tolerance to the DC bias [13]. Thus, precise and in-depth analysis of DC bias for UHV autotransformers is necessary for the safe operation of equipment and transmission systems.
Much in-depth research and analysis have been carried out on the transformer DC bias problem by simulation and experiment. The finite element method (FEM) is widely used in the precise analysis of simulations for its ability to obtain the excitation current waveform, the local flux and losses distribution under DC bias [14,15,16,17,18,19,20]. Nevertheless, the results obtained only through simulation are not convincing enough. Some no-load experiments of large capacity transformer have been carried out to verify their FEM and discuss the excitation current, reactive power absorption, vibration and noise characteristics under DC bias [21,22,23]. However, the no-load experimental data do not reflect the actual operation condition of UHV autotransformer, and the research about the winding current distortion of UHV transformer with load under DC bias is significant and urgent, which is rare in the literature. The UHV autotransformer is very expensive and it is difficult to carry out an in-depth investigation on the practical equipment and the DC bias effects on the UHV autotransformer with rated load is impossible to carry out due to the insufficient capacity of the generator, the unaffordable economic cost and the damage to UHV autotransformer. Therefore, the reduced-scale model is a significant method to implement the experiment which cannot be carried out in the practical condition. In [24,25] some reduced-scale models (RSMs) are proposed to equivalent the practical situation based on the similarity theory and structure characteristics. A reduced-scale model of UHV autotransformer is built and the no-load experiment is carried out based on the magnetic circuit method [26]. However, this reduced-scale model has a very restricted limits of identical core structure, steel sheet material type and the flux density, which is not suitable for general transformer and other operation.
For the purpose of discussing the DC bias characteristics of UHV autotransformer with load condition, the RSM has its own unique design theory, based on the theory of identical saturation degree, rather than a simple size reduction ratio is proposed. Its core structure, connection mode and relationship of turns and capacity among each side are consistent with the UHV autotransformer. This paper proposes a new RSM technique, which overcomes the aforementioned difficulties. Firstly, the saturation degree is characterized by the ratio of the second harmonic to the fundamental of the excitation current, which are calculated by a field-circuit coupling FEM. Afterwards, the DC bias current equivalent relationship between the UHV transformer and the reduced-scale model is established by means of the identical saturation degree. Finally, the experiment of the reduced-scale model is conducted with and without DC bias current. The current waveform, the harmonics spectrum and the distortion of the excitation and winding current with and without load under various DC bias current are analyzed.
2. Experiment Setup
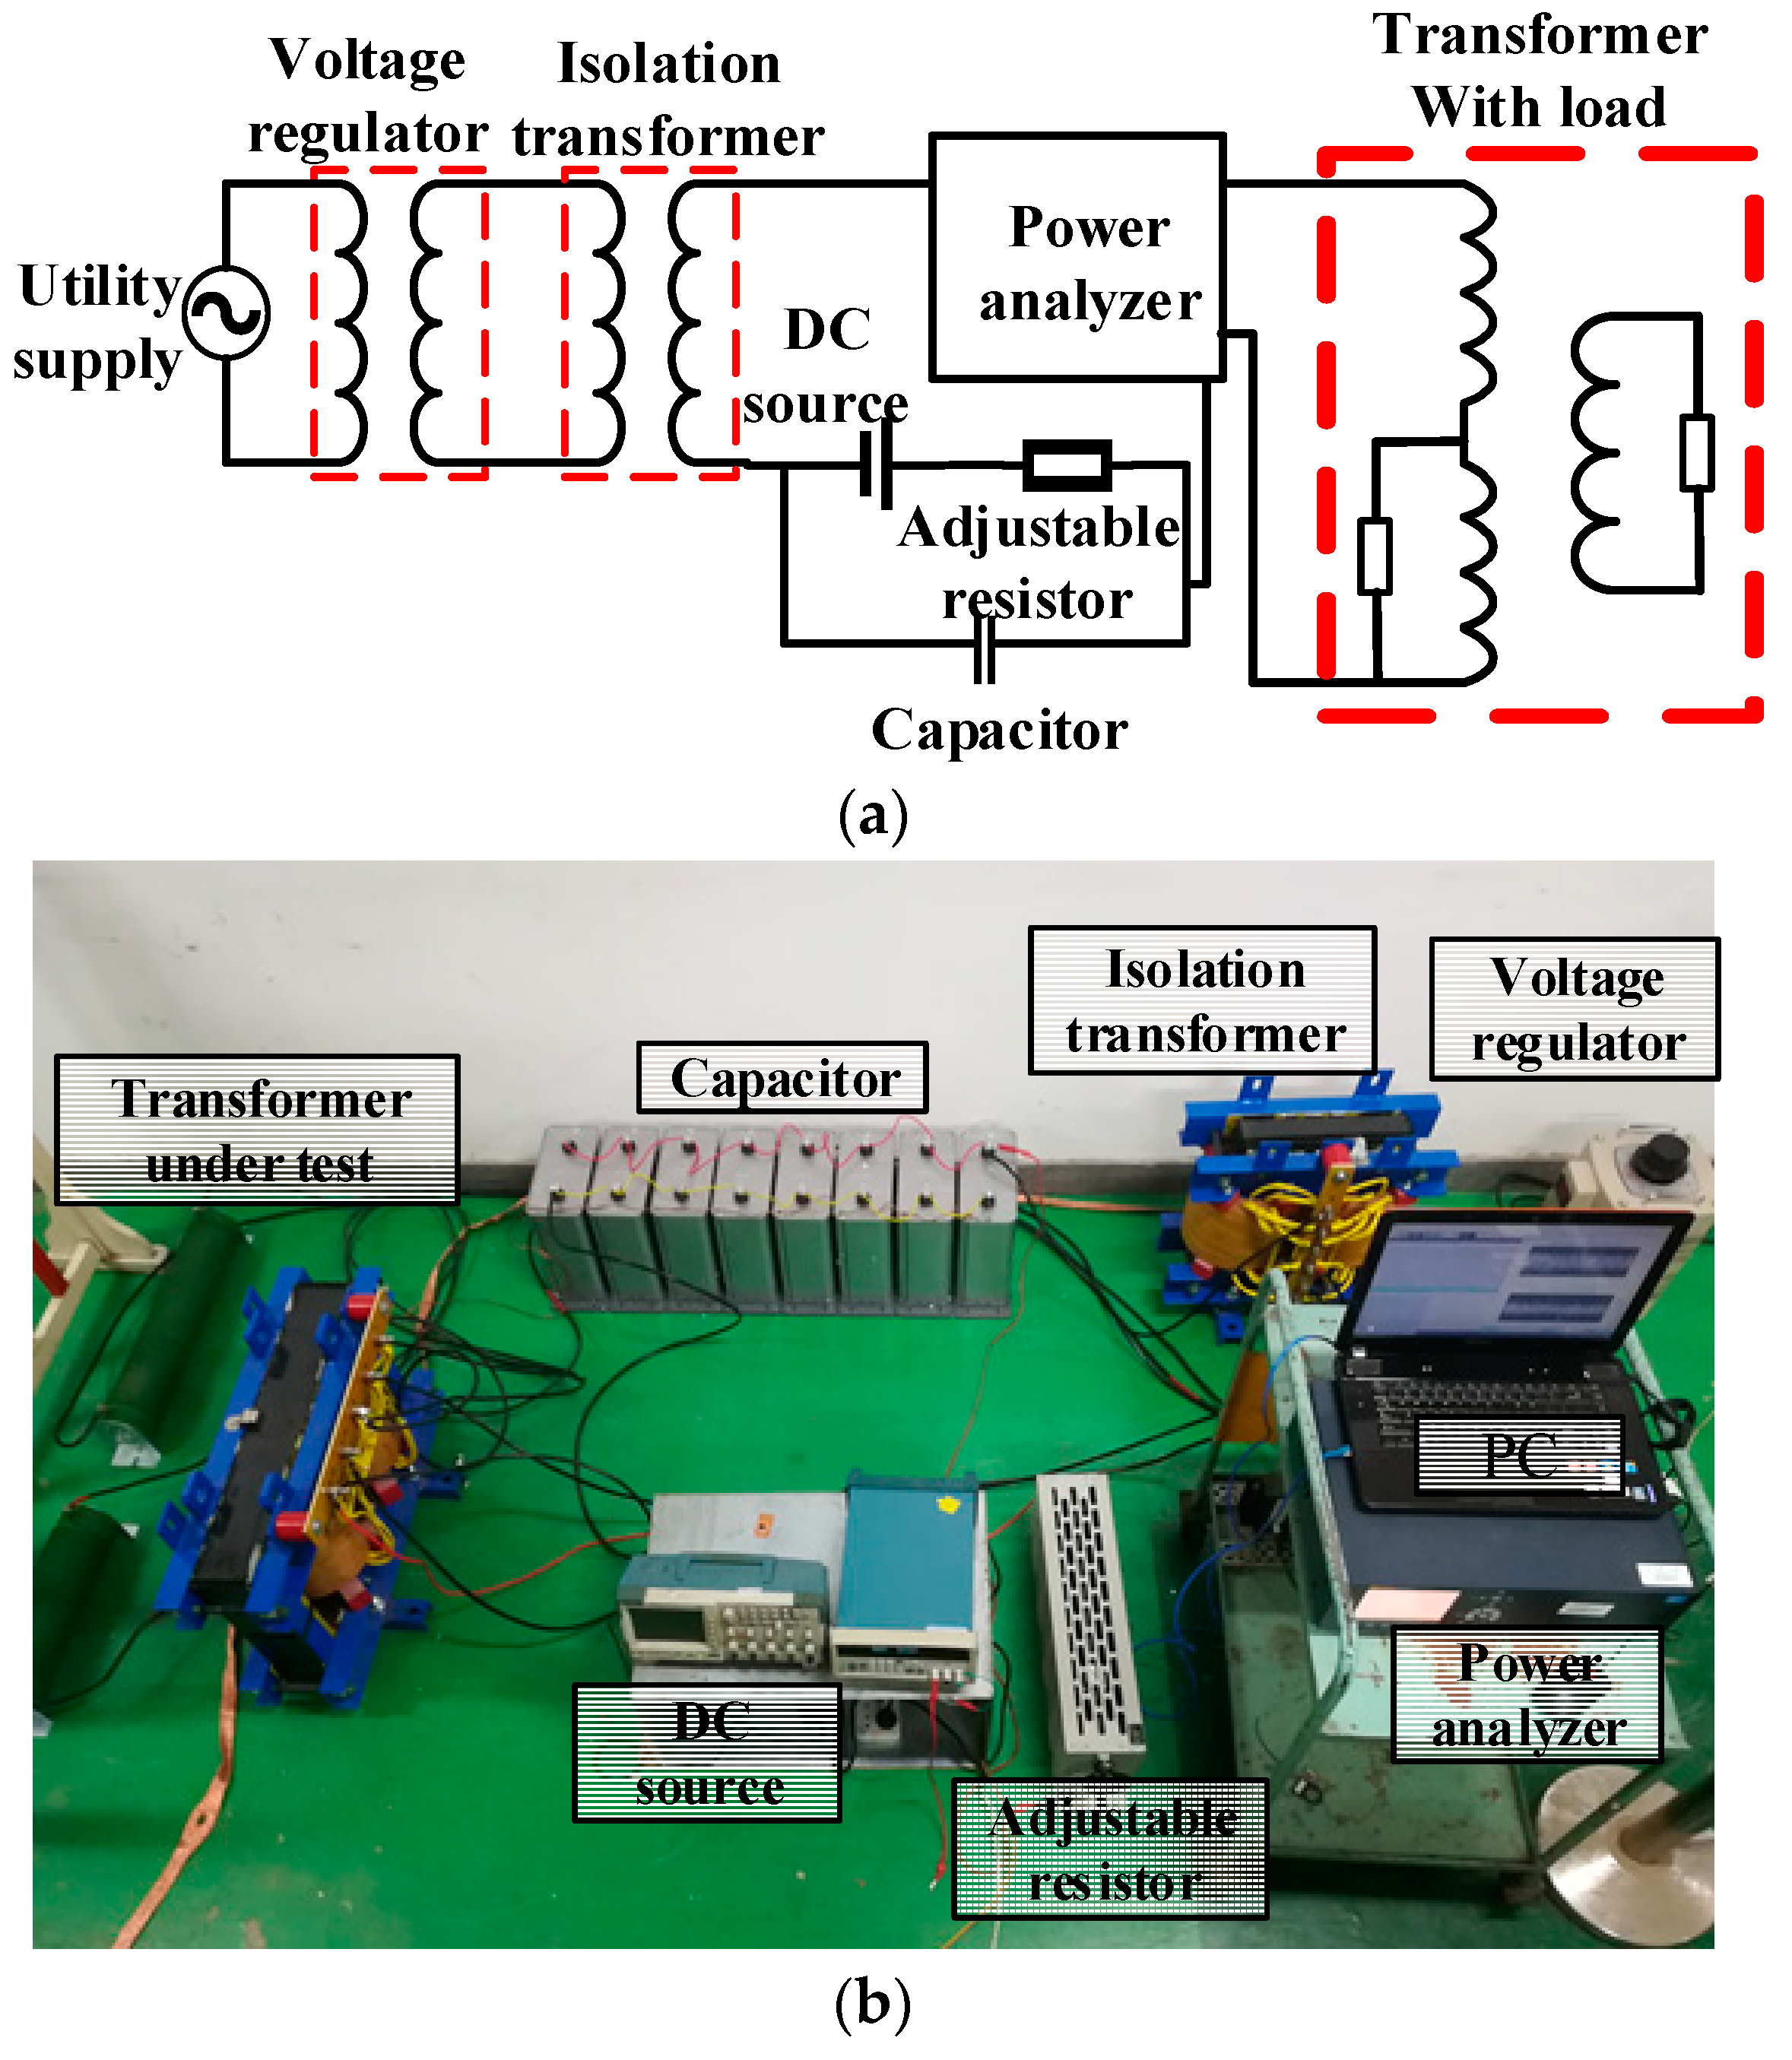
The DC bias test platform is shown in Figure 1. The voltage regulator is connected to a voltage source, providing a 360 V 50 Hz sinusoidal excitation to the arrangement. The isolation transformer is utilized for avoiding the DC current effects on the supply source. The DC source with adjustable resistance are used to obtain various DC current while the eight parallel capacitors of 1194 μF are used to reduce the AC current passing through the DC source. The electrical quantities are measured by the power analyzer. The equipment parameters in the test platform are shown in Table 1.
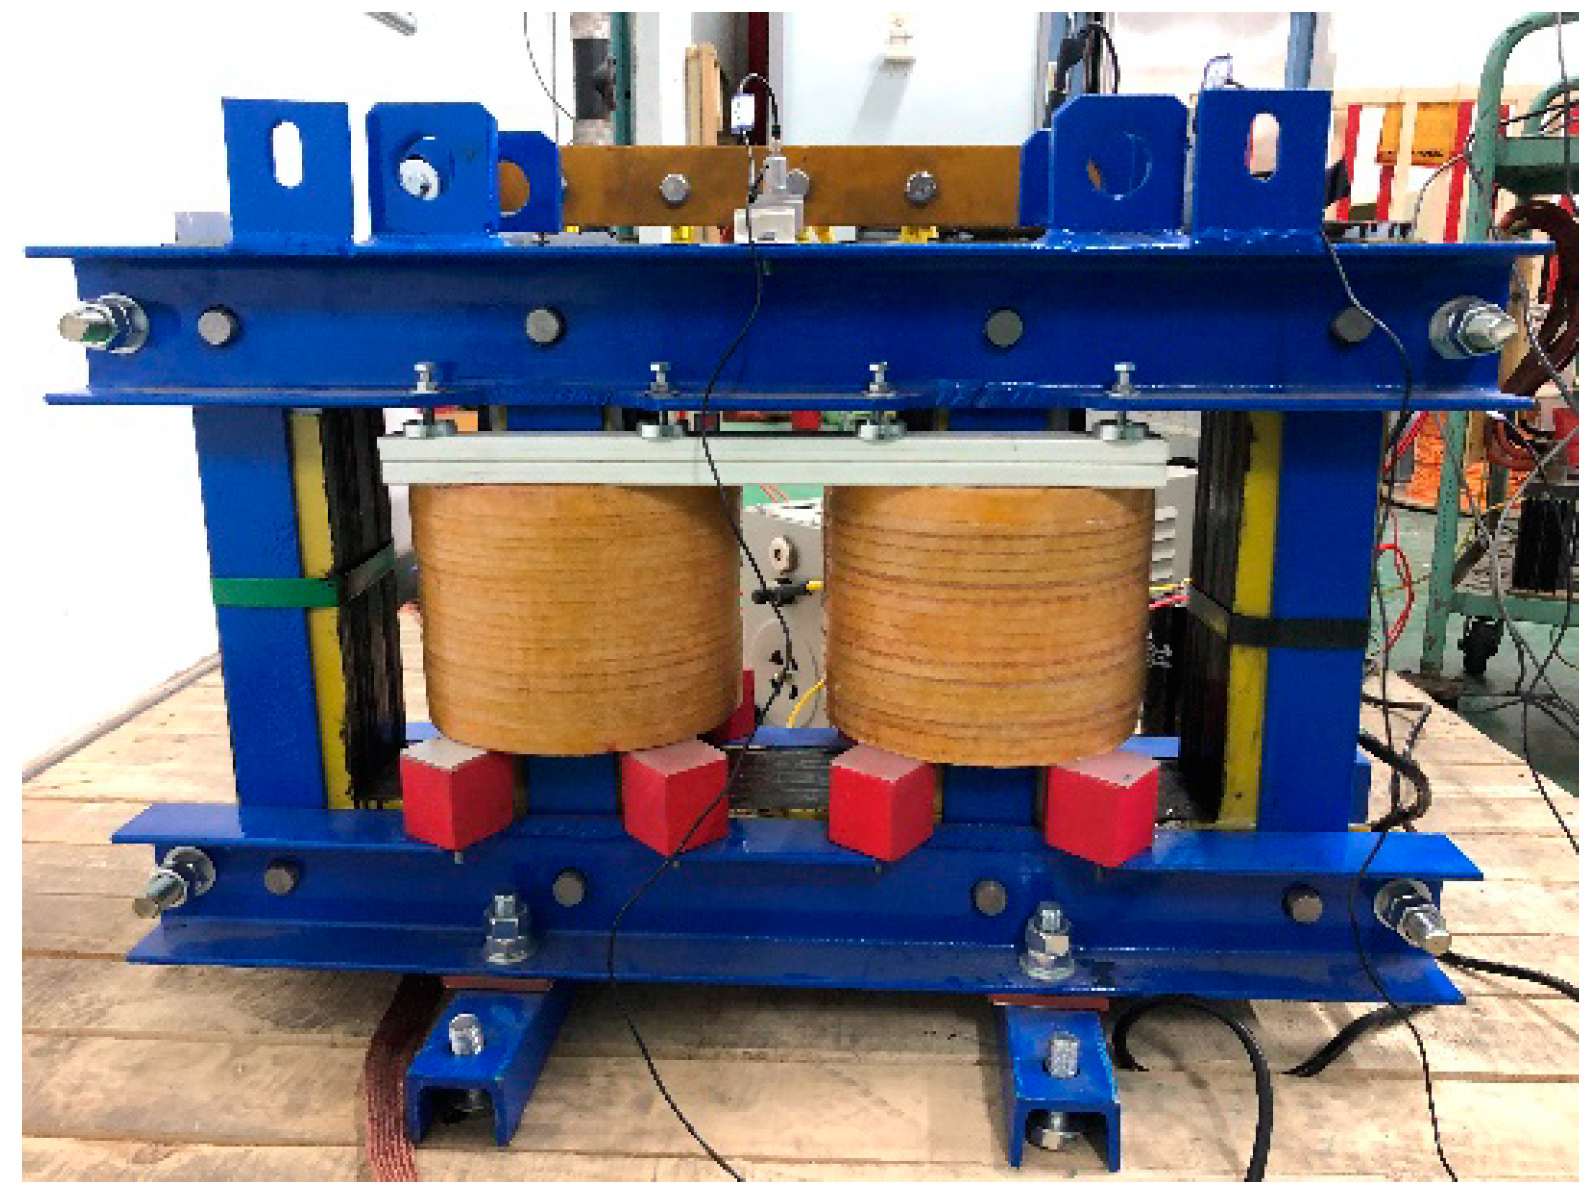
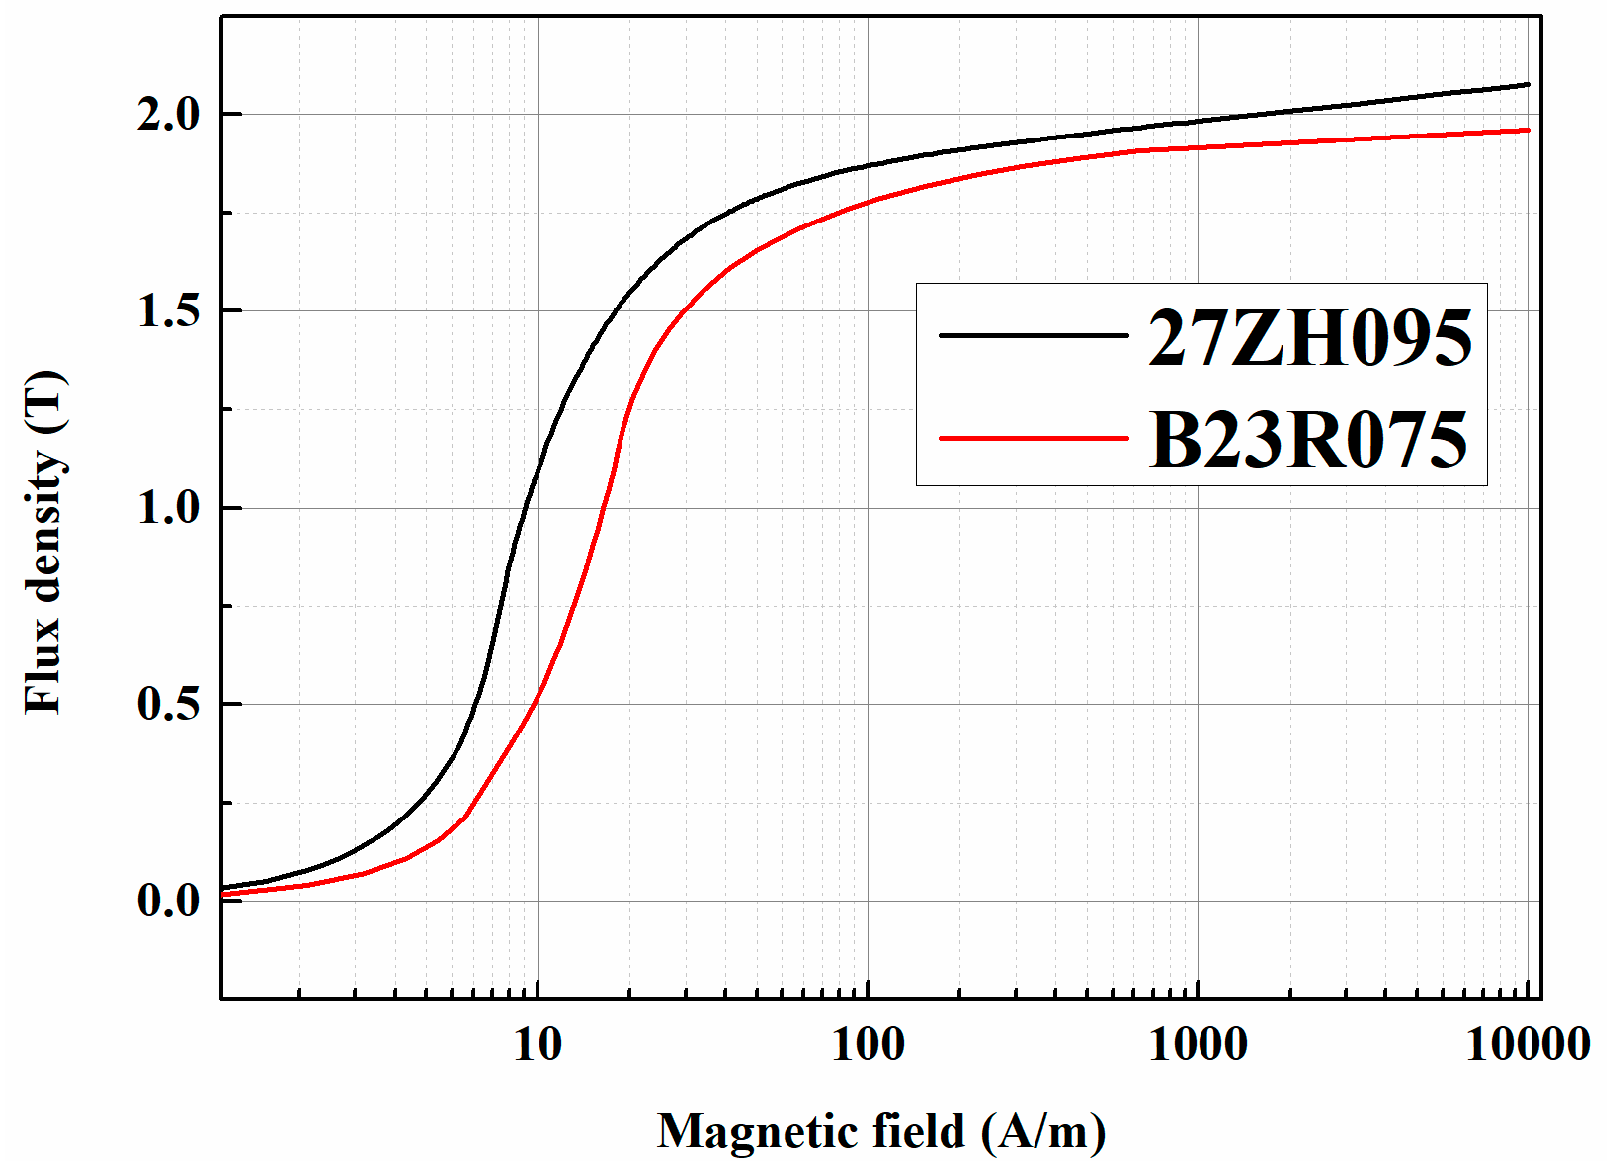
In order to build the equivalent relationship with the UHV transformer, the core structure and winding connection mode of RSM are consistent with the UHV transformer, as shown in Figure 2. The RSM is a single-phase four-column three-winding autotransformer built with an approximate scale of 1/12 relative to the UHV transformer. The capacity and rated voltage of the RSM are 5 kVA and 360 V, whose length, width and height are 661 mm, 100 mm and 356 mm, respectively. The flux density at rated voltage is 1.65 T, which is consistent with the UHV transformer. Figure 3 shows the silicon steel type of UHV transformer and reduced-scale model, which are 27 ZH095 and B23R075, respectively. It has to be noted that the measured B-H data are only provided to 1.91 T, the linear curve fitting method is used to extend the curve. The parameters of the UHV transformer and the RSM are presented in Table 2.
3. Theory of Reduced-Scale Model
The principle to establish the relationship of RSM to UHV transformer under DC bias is to obtain the identical saturation degree of the core. How to accurately reflect the saturation degree of the transformer is the key to building the RSM.
It is generally known that even harmonics occur with the introduction of the DC bias current and rise greatly with the increase of the DC bias current. Besides, the second harmonic is a significant indicator to detect the DC bias current flowing into the transformers. In order to establish the equivalent saturation degree under DC bias of the UHV transformer and RSM, the ratio of the second harmonic to the fundamental was selected. In this paper, a time-domain field-circuit coupling FEM was utilized to calculate the electromagnetic quantities of UHV transformer and RSM. The ratio of second harmonic to fundamental was selected to show the saturation degree of the core. By means of this ratio index, the equivalent relationship of the reduced-scale model to the UHV transformer was established. The field-circuit coupling FEM was utilized to obtain this ratio indicator. Afterwards, the equivalent relationship of DC bias current of RSM to UHV transformer was obtained.
3.1. Time-Domain Field-Circuit Coupling FEM
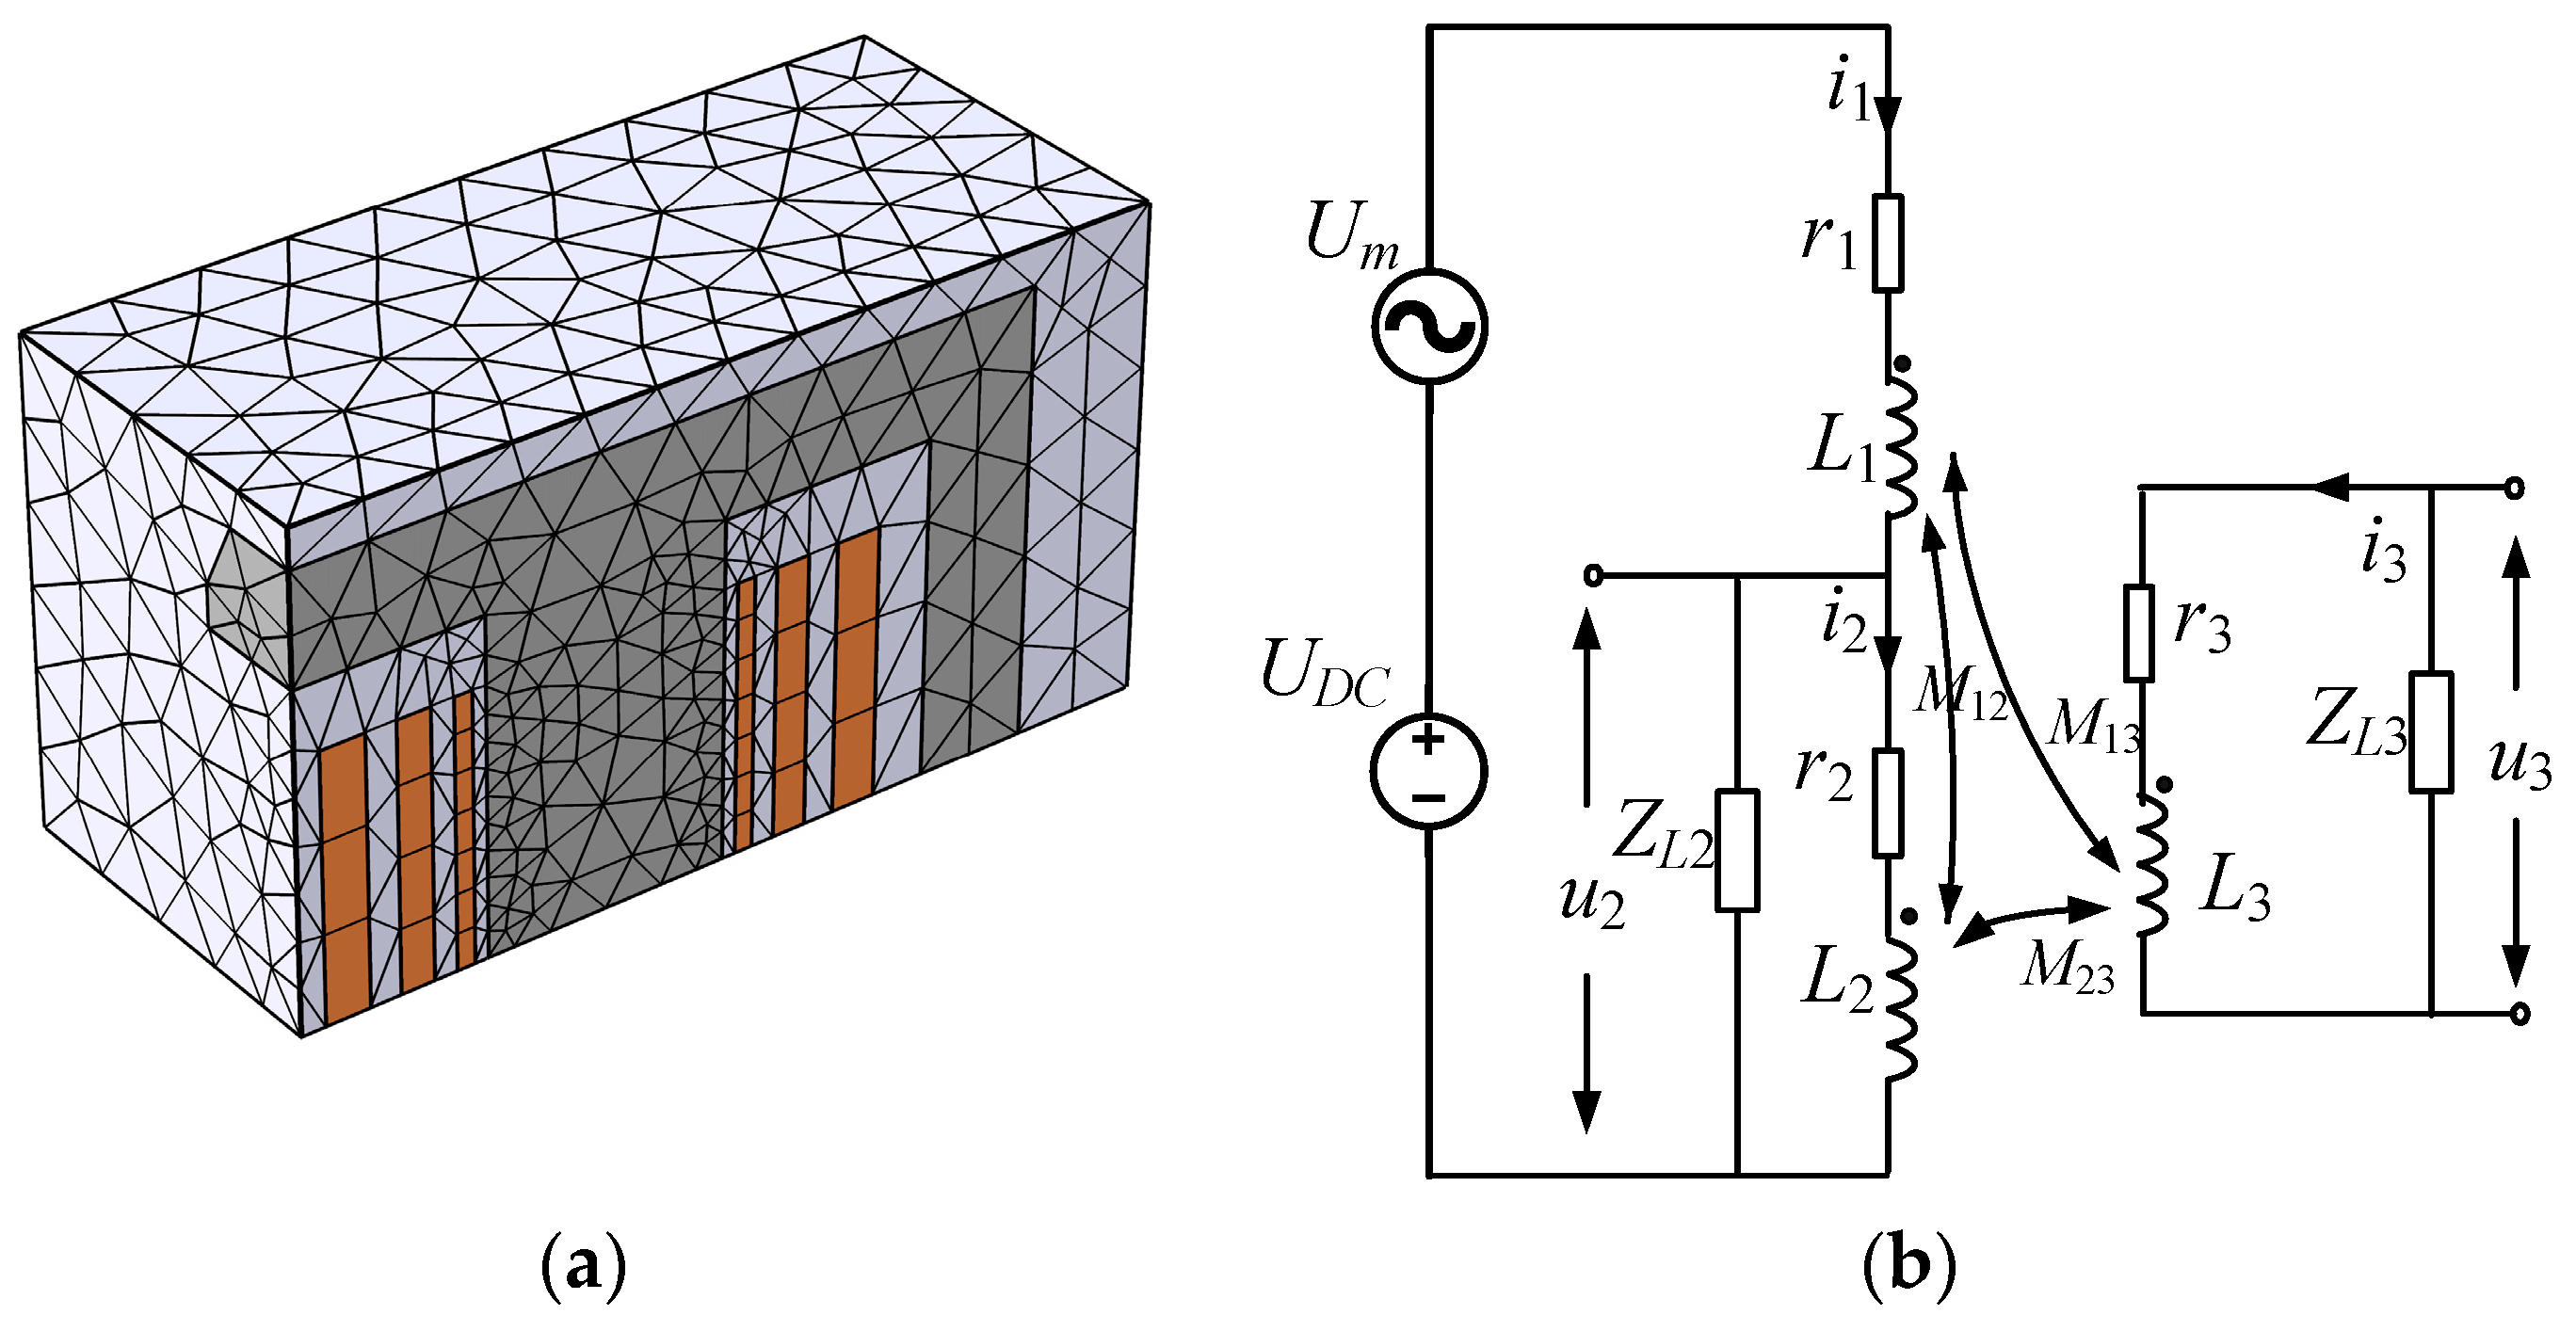
The field-circuit coupling 3-D FEM was utilized to calculate the ratio of second harmonic to fundamental of UHV transformer and RSM, which was used to establish their equivalent relationship. The number of turns and geometry of the FEM model of the UHV and RSM are exactly followed by their own parameters, respectively. The core structure and windings of RSM were at an approximate scale of 1/12 relative to a UHV transformer’s full size. There were low voltage winding, common winding and series winding from inside to outside, respectively. It has to be noted that the tank, the tie bars and the clamping plate which were made of massive steel and carry eddy currents were neglected. The core and the tank shielding were laminated and were assumed to be free of eddy currents. The eighth magnetic model of RSM and UHV transformer is shown in Figure 4a.
The FEM differential equation uses vector magnetic potential A and field equation according to Maxwell [13] is as follows
where μ is permeability of magnetic material, A is vector magnetic potential, J is current density.
The circuit diagram is shown in Figure 4b, and the transient differential equations of the circuit model is shown as follows
where Um and UDC are AC and DC voltage, respectively. r, L and M present the resistance, dynamic self and mutual inductance, respectively. RL is the load resistance. The subscript 1, 2, 3 present the series, common and low voltage winding, respectively.
3.2. Equivalent Relationship of Reduced-Scale Model to UHV Transformer
By utilizing the field-circuit coupling model mentioned above, the electromagnetic quantities of the UHV transformer and RSM can be calculated, as shown in Figure 5, Figure 6, Figure 7 and Figure 8.
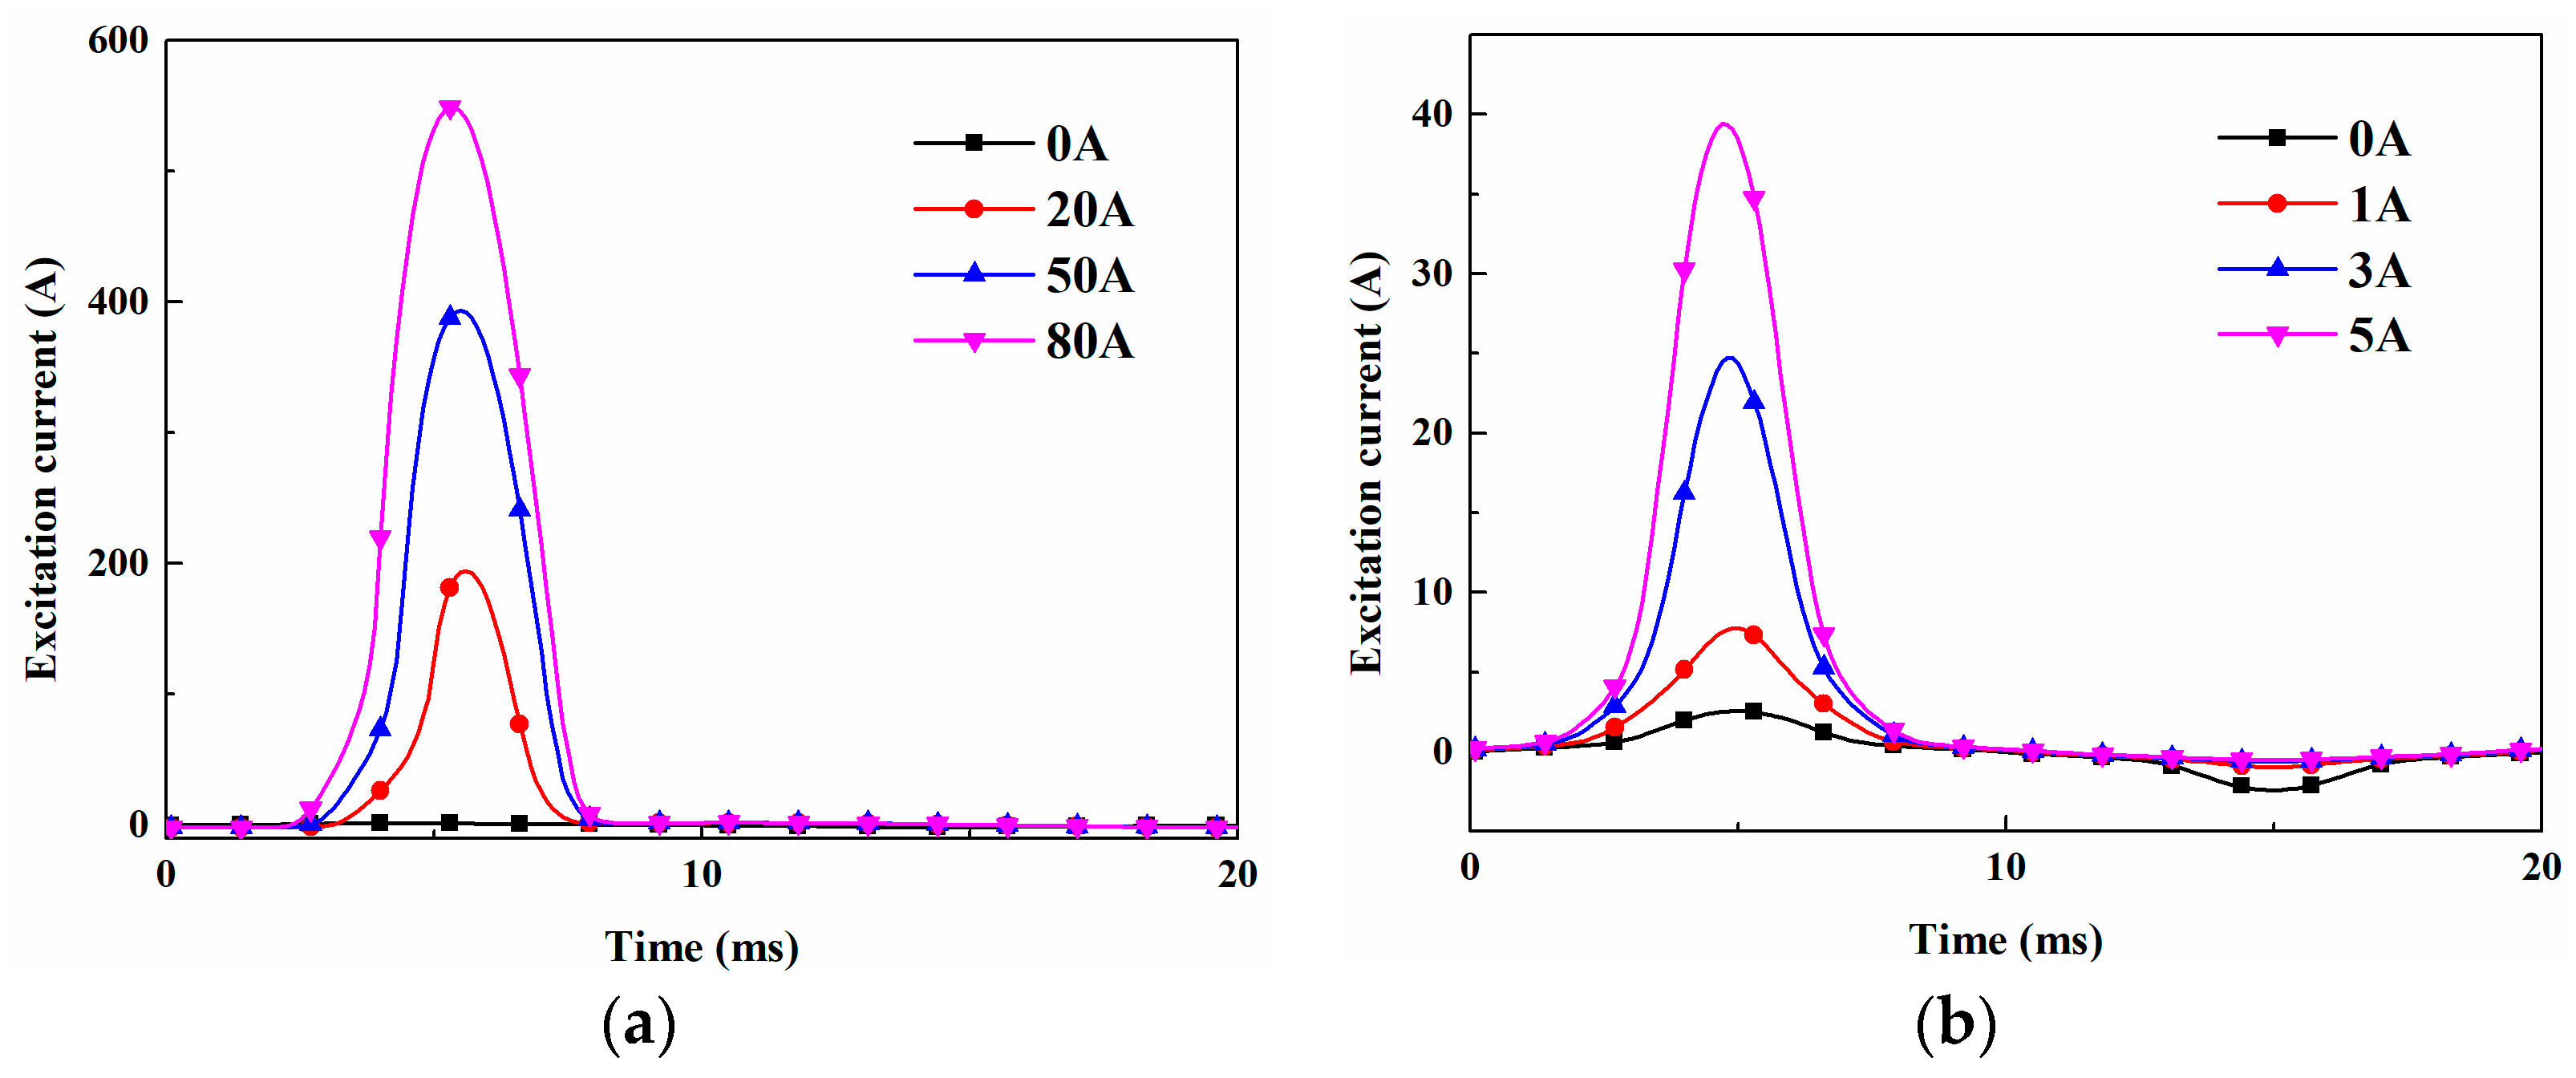
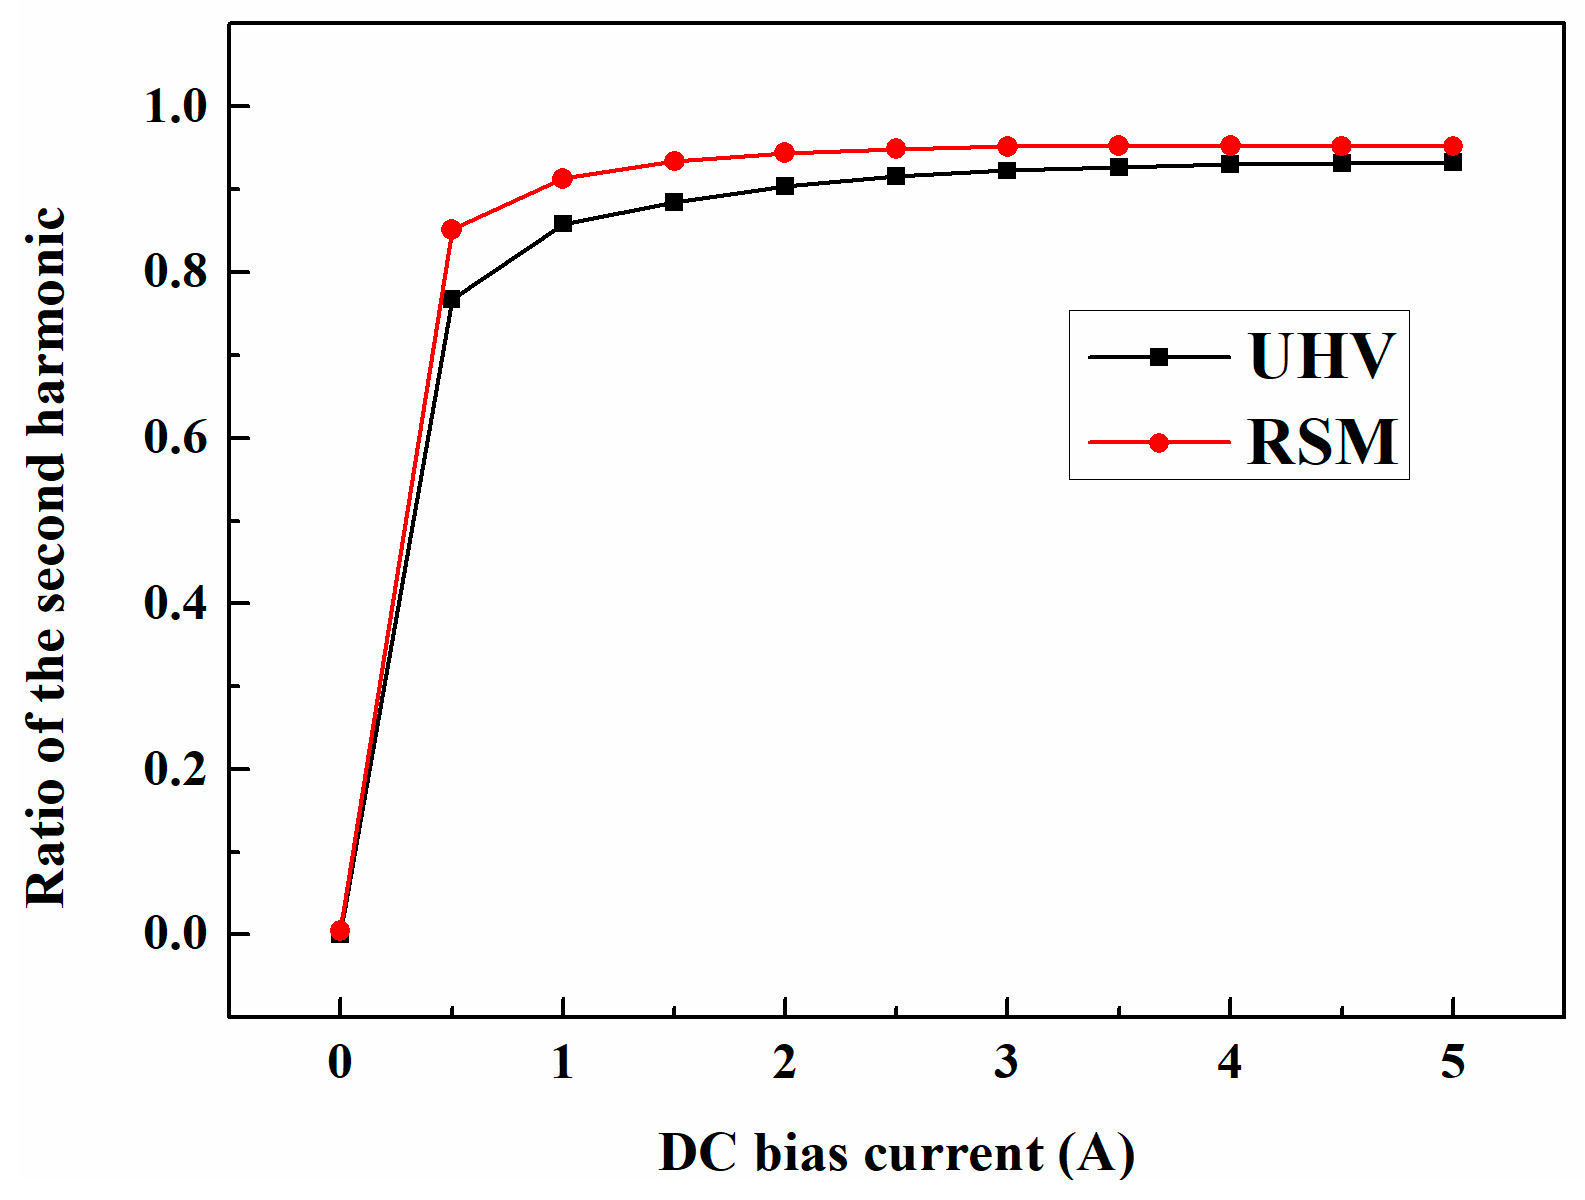
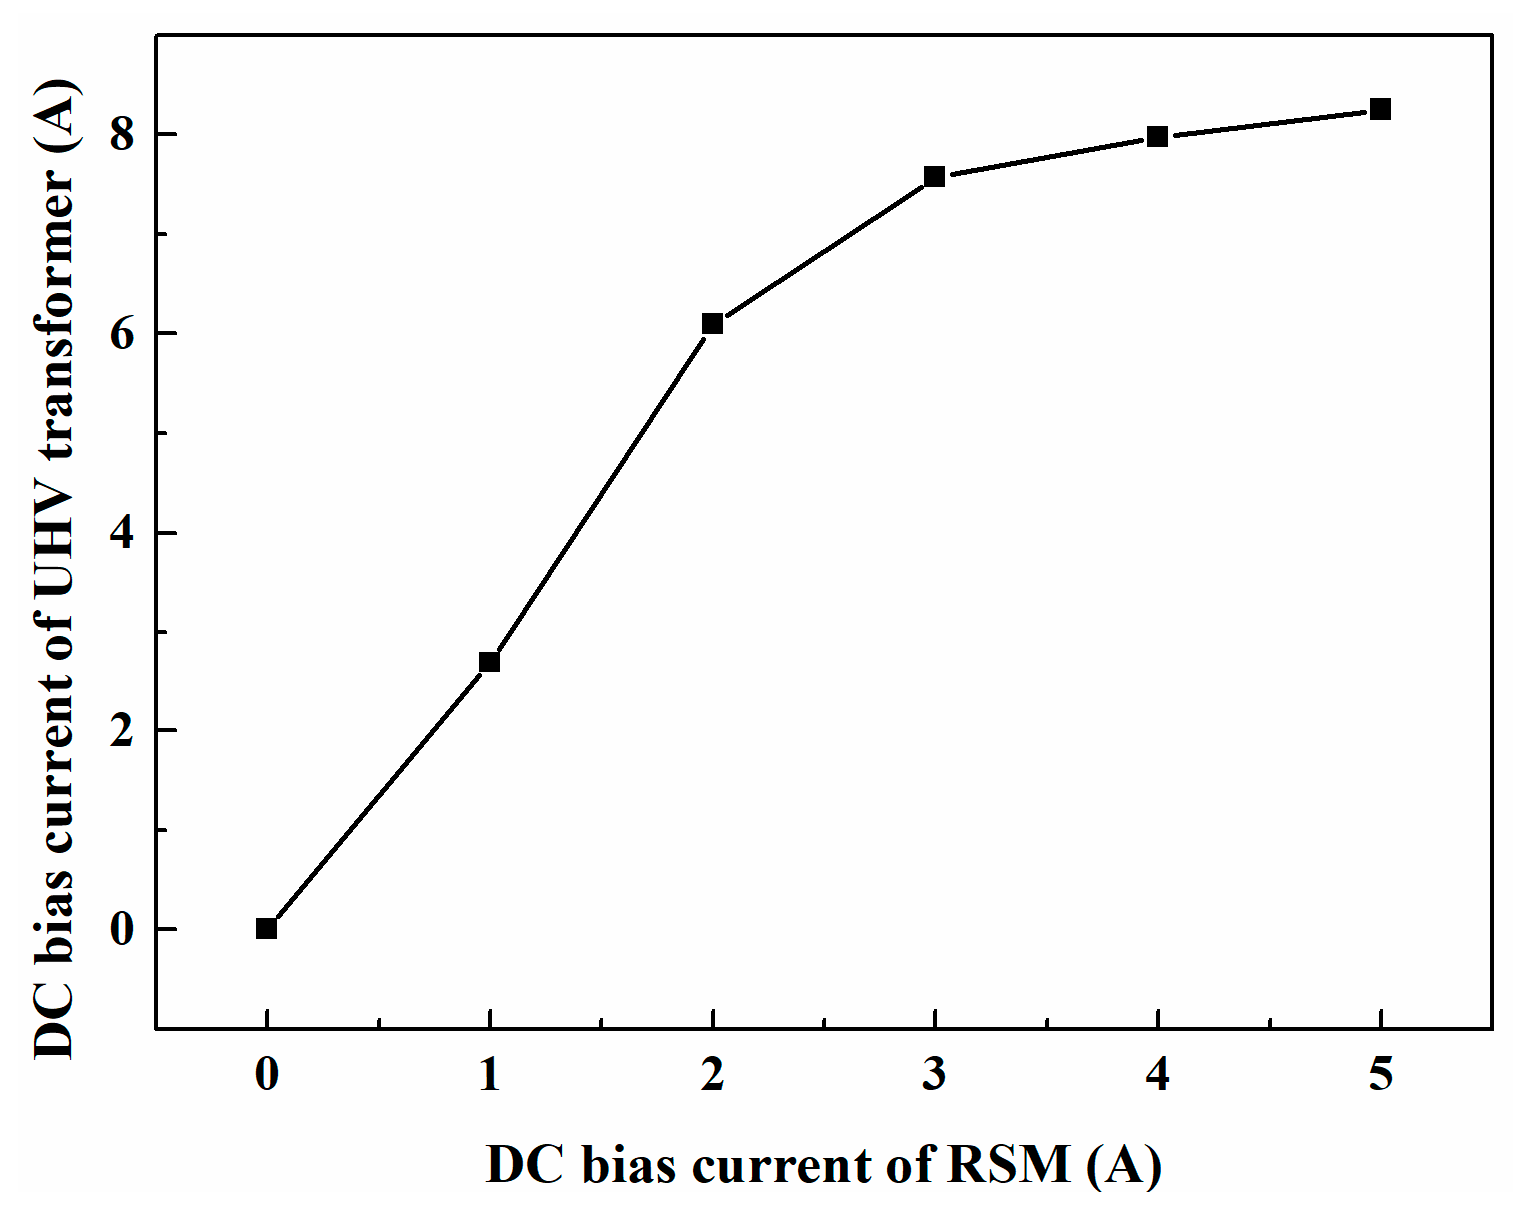
Figure 5 show the excitation current waveform of the UHV and RSM under various DC bias current, respectively. Discrete Fourier transform (DFT) is applied to the waveform of the excitation current of the UHV transformer under DC bias. The harmonic magnitudes of excitation current under various DC bias currents are shown in Figure 6. Due to the distortion mainly concentrated below the 6th harmonic and less sensitive of high order harmonics to DC bias current, the figure only shows the harmonics under 6th order. As can be seen from Figure 6, the fundamental and second harmonic rose almost linearly with the DC bias current, whereas, the growth of higher harmonics slowed down gradually. Figure 7 shows the ratio of the second harmonic to the fundamental of excitation current with various DC bias current of the UHV transformer and RSM. By means of the same ratio, the equivalent relationship of DC bias current of the UHV transformer and RSM was obtained, as can be seen in Figure 8. Table 3 presents the results of the equivalent relationship of DC bias current under the same saturation degree.
4. Experimental Data and Simulation Results
4.1. Experimental Data
A series of DC bias test of the RSM was carried out, which is presented in Table 4. The DC bias effects on the RSM with and without load are presented, respectively. Figure 9a shows five cycles of the no-load excitation current without the DC bias current, Figure 9b–d show five cycles of the no-load excitation current with 1 A, 3 A and 5 A DC bias current, respectively. As can be seen from the figure, the distortion of excitation current rose sharply as the DC bias current increased. The distortion occurred mainly in the first half of the cycle, peaking in the quarter cycle. For instance, the peak value of excitation current without DC bias current was 2.5 A, and the peak value increased to 8.5 A, 25.8 A, and 42.6 A with 1 A, 3 A and 5 A DC bias current, respectively. The distortion under 5 A DC bias current was 17 times higher than the rated excitation current. By contrast, the excitation current in last half of the cycle decreased with the DC bias current due to the opposite direction.
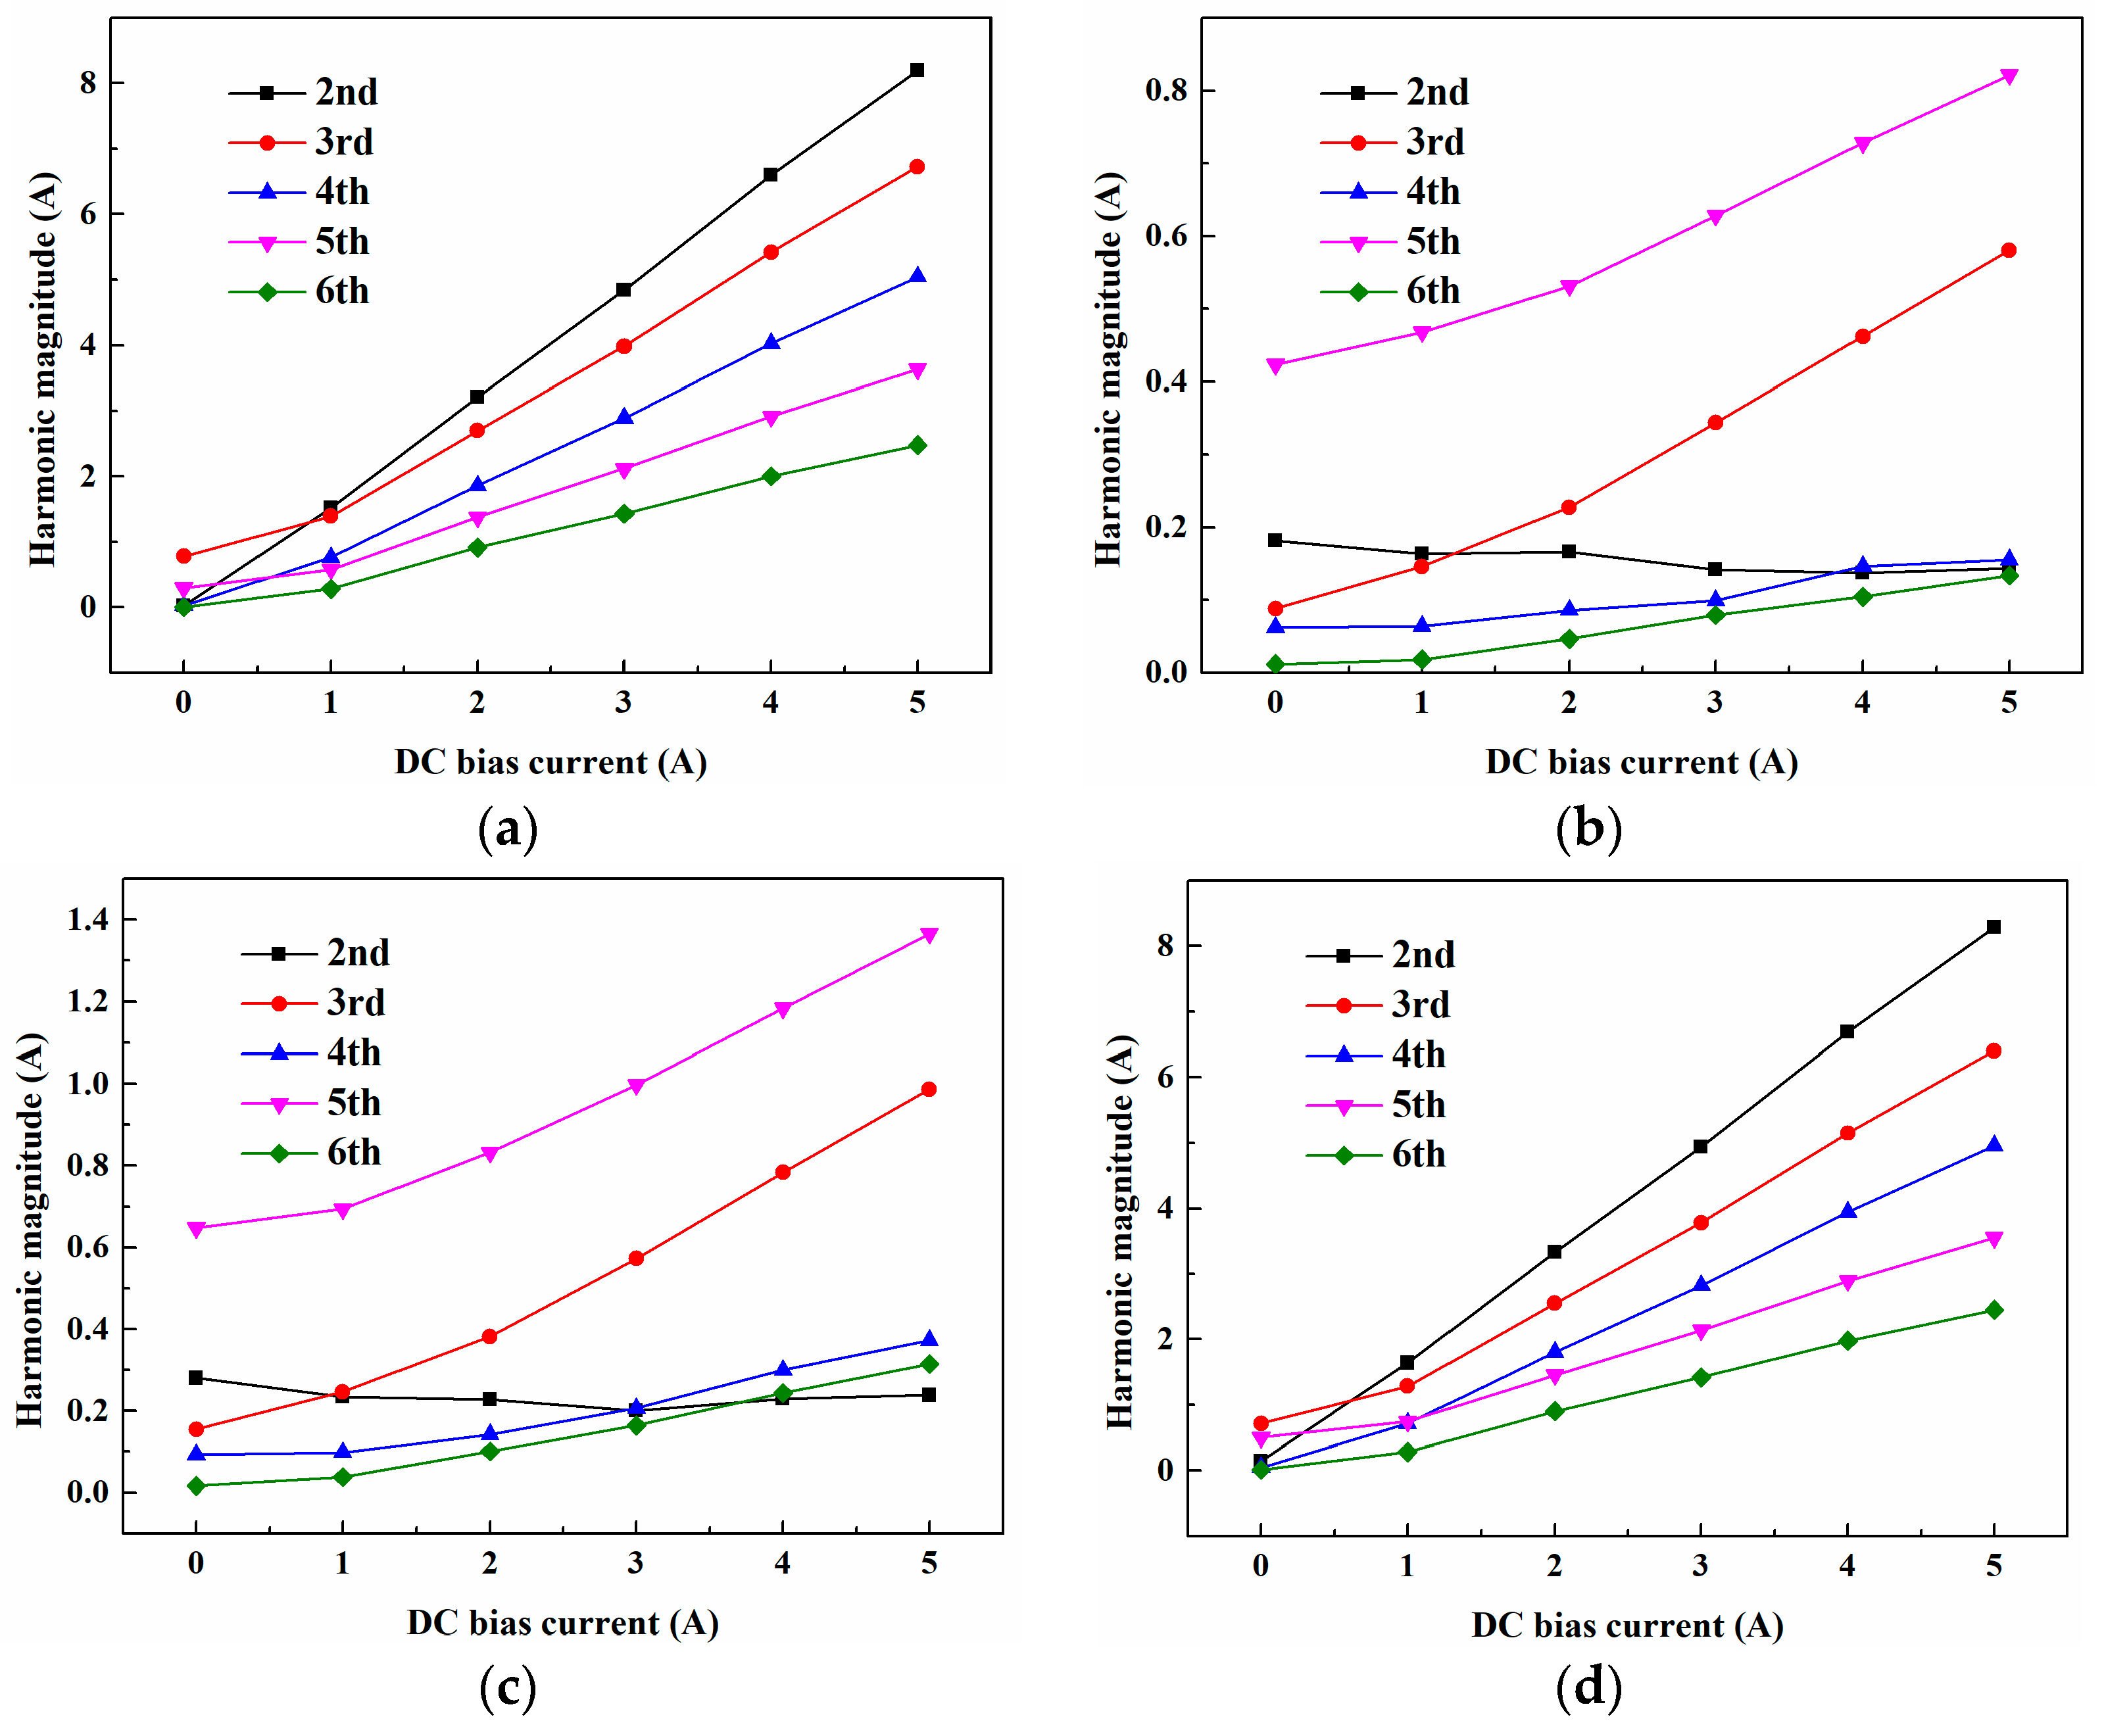
DFT was then applied to the waveform of excitation and winding currents, respectively. Figure 10 show that the harmonics increased obviously as the DC bias current increased. Although the DC bias current brought distortion to all the current waveform, the cause of these current distortions was not the same. The harmonics magnitudes of excitation current and the high voltage side current showed an identical tendency. The even harmonics occurred due to the DC bias current, especially the second harmonic, which turned into the biggest harmonic component. The occurrence of even harmonics caused the distortion of the waveform of the excitation current and high voltage side current. Whereas the middle and low voltage side current showed identical tendency, the DC bias effects on even harmonic was small, the main reason for distortion of the common and low voltage current was the odd harmonics.
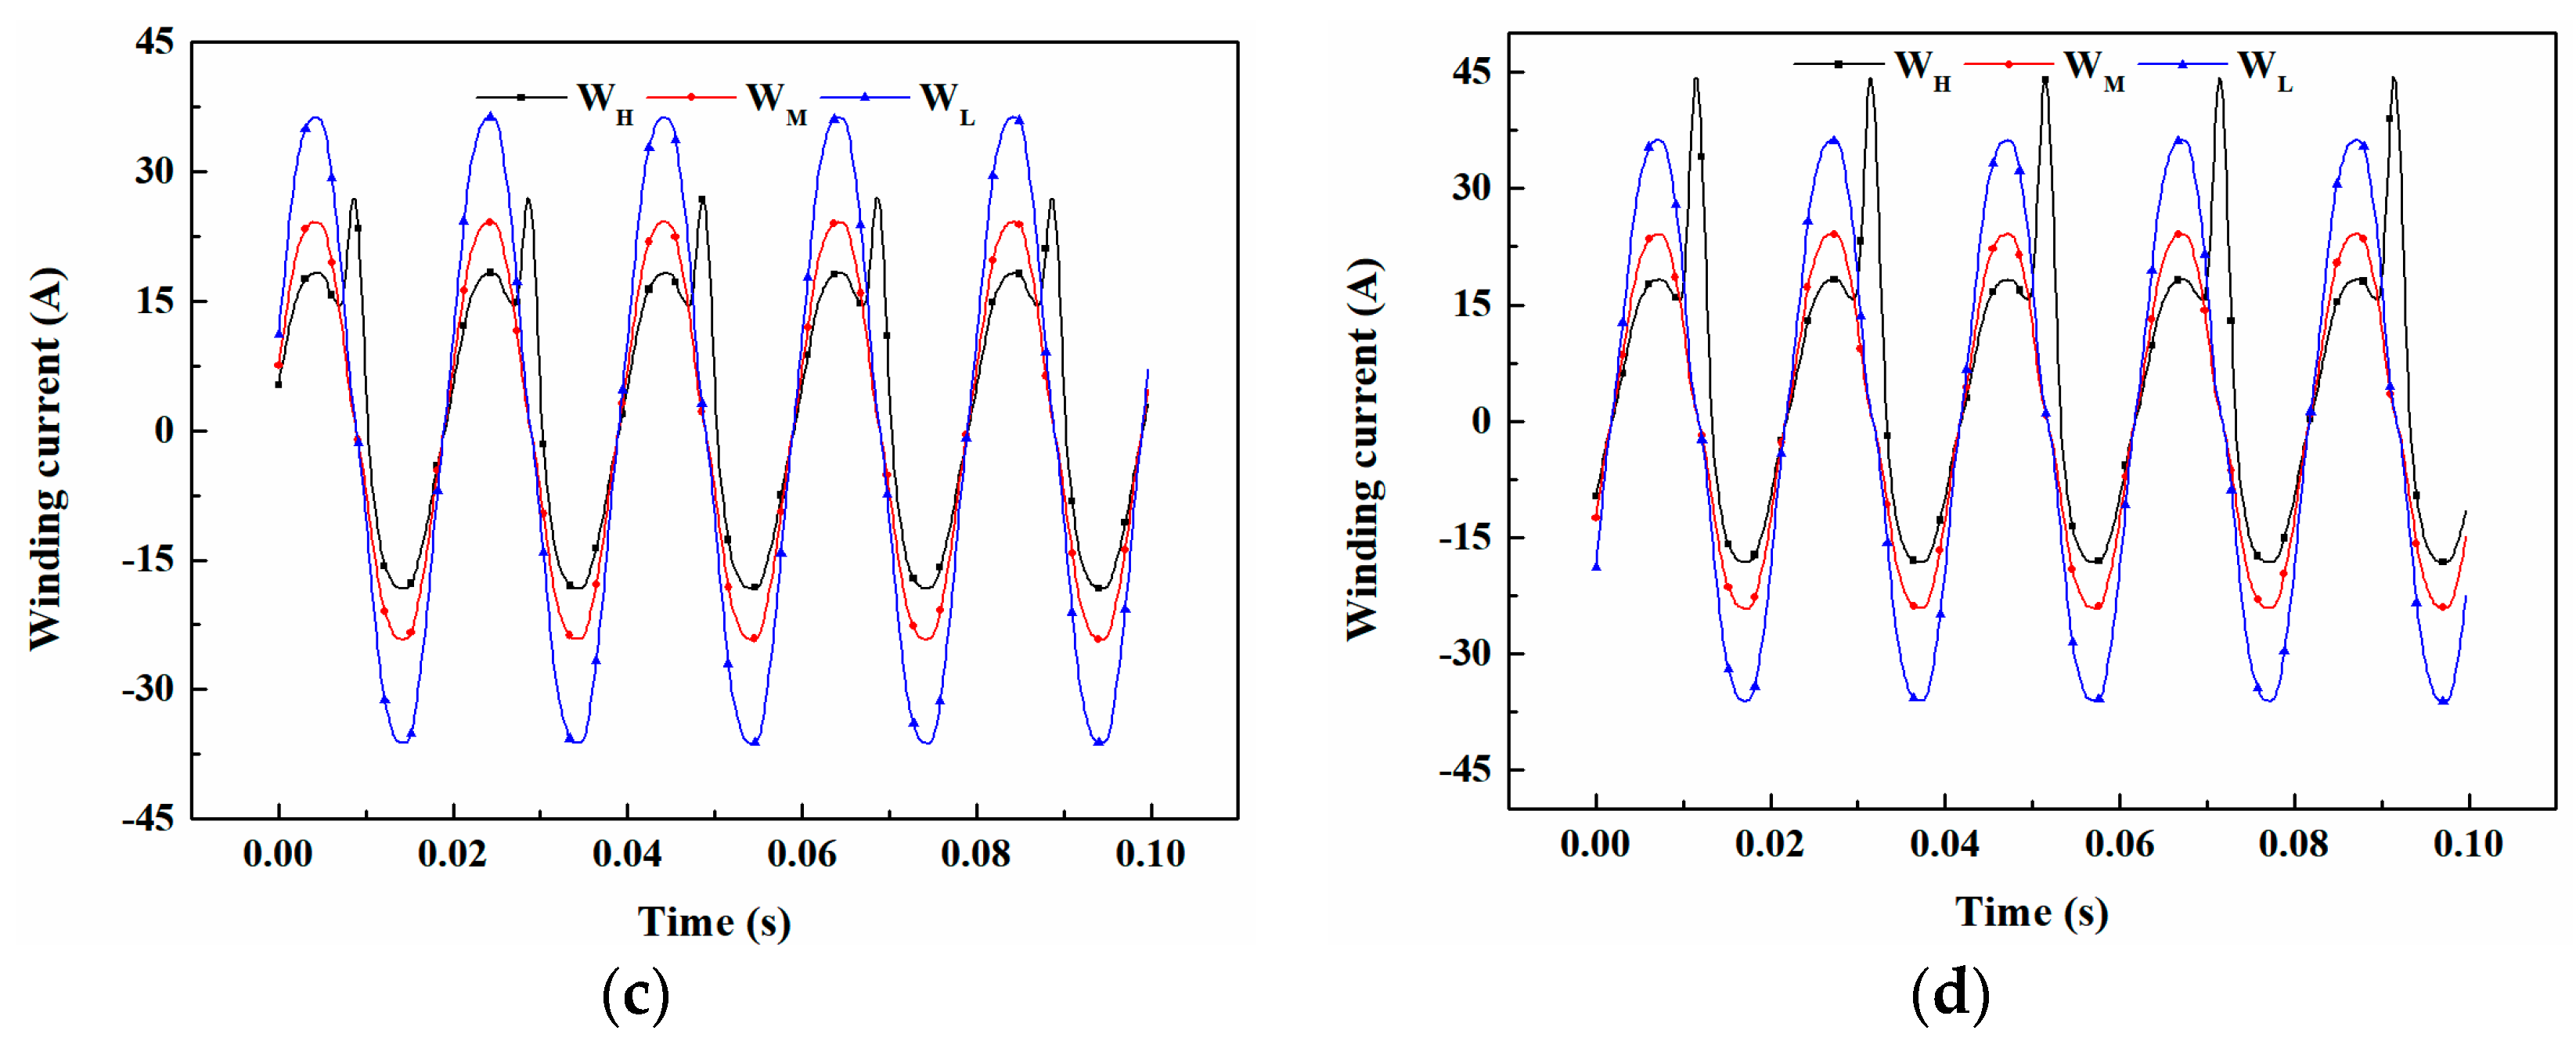
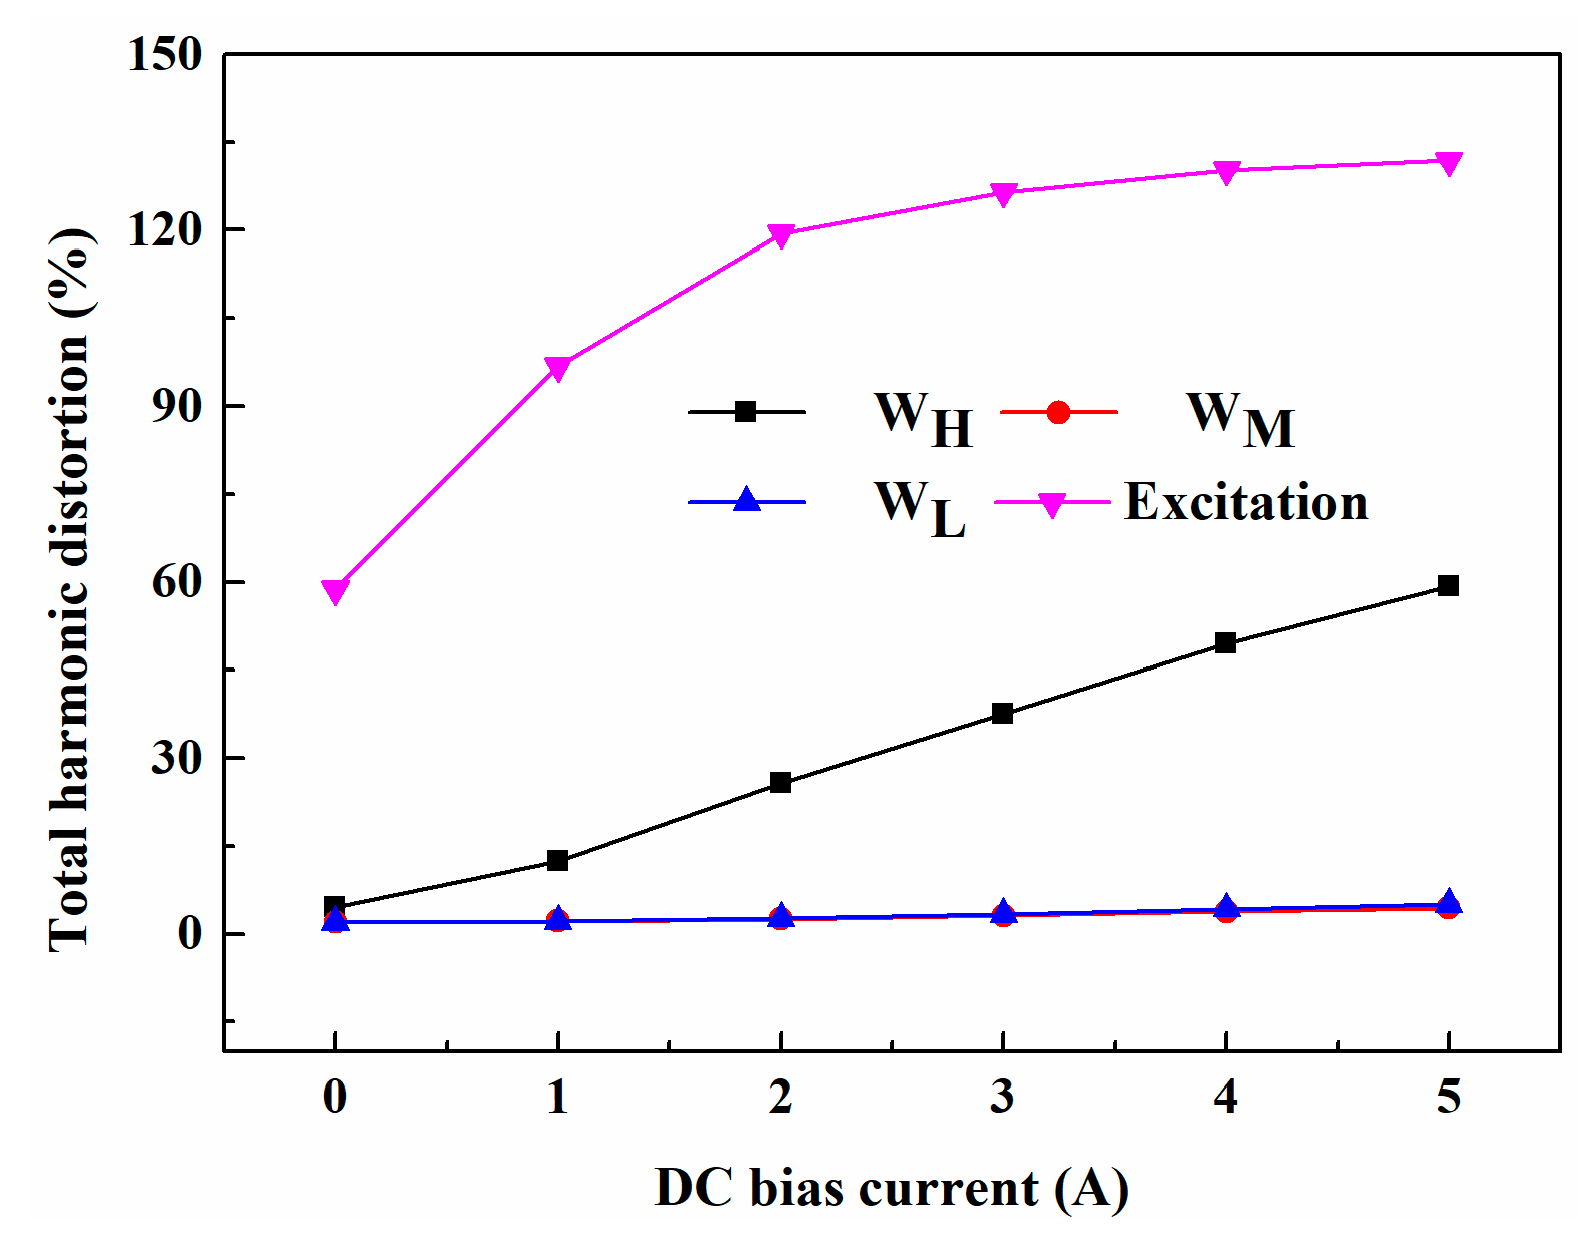
The winding current at each side of the RSM with load under various DC bias are shown in Figure 11. As can be seen from figure, the distortion of the waveform increased obviously as the DC bias current increased. The distortion occurred when DC bias current flowed into the windings and the distortion showed the same tendency as the excitation current, which mainly occurred in the first half cycle, the current maximum was located close to the moment of a quarter. Besides, the middle and low voltage side current seemed less affected by the DC bias, whereas the high voltage side current waveform showed an obvious distortion. The total harmonic distortion (THD) was utilized to present the distortion degree of current under DC bias current, which is defined as the ratio of the root mean square (RMS) amplitude of a set of higher harmonic frequencies to the fundamental [8], expressed by
The THD of the current at each side are shown in Figure 12. The excitation and high voltage wingding current were less tolerant of DC bias current, the distortion degree increased obviously as the DC bias current increased, whereas, the current of the middle and low voltage side remained almost the same under DC bias current.
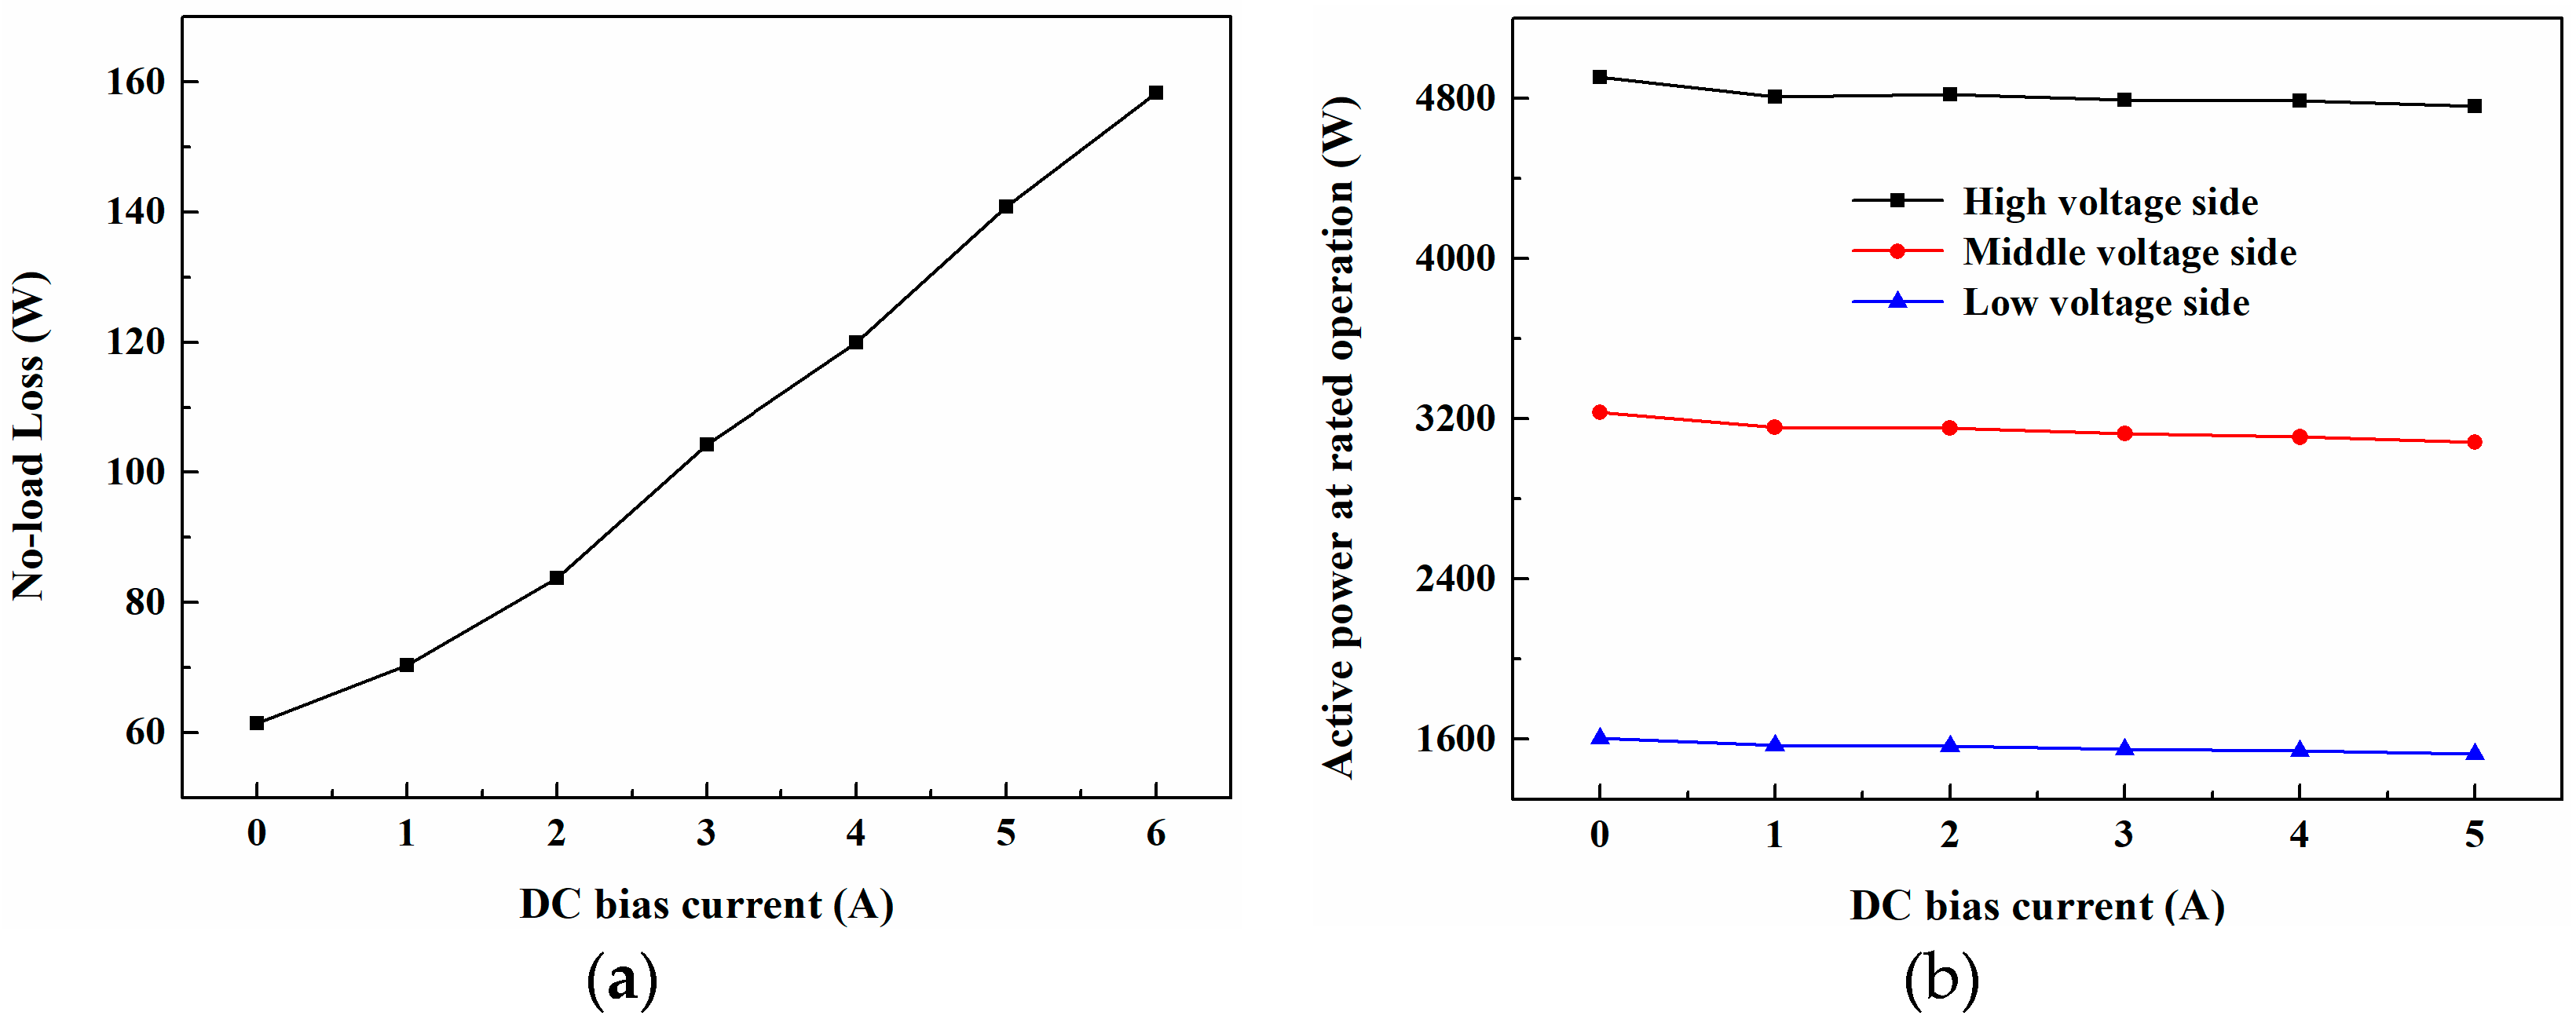
The no-load loss and the active power at rated operation were measured by a power analyzer, as shown in Figure 13. The DC bias current caused a significant increase in no-load loss. Therefore, active power of each side decreased as the DC bias current increased.
4.2. Simulation Results
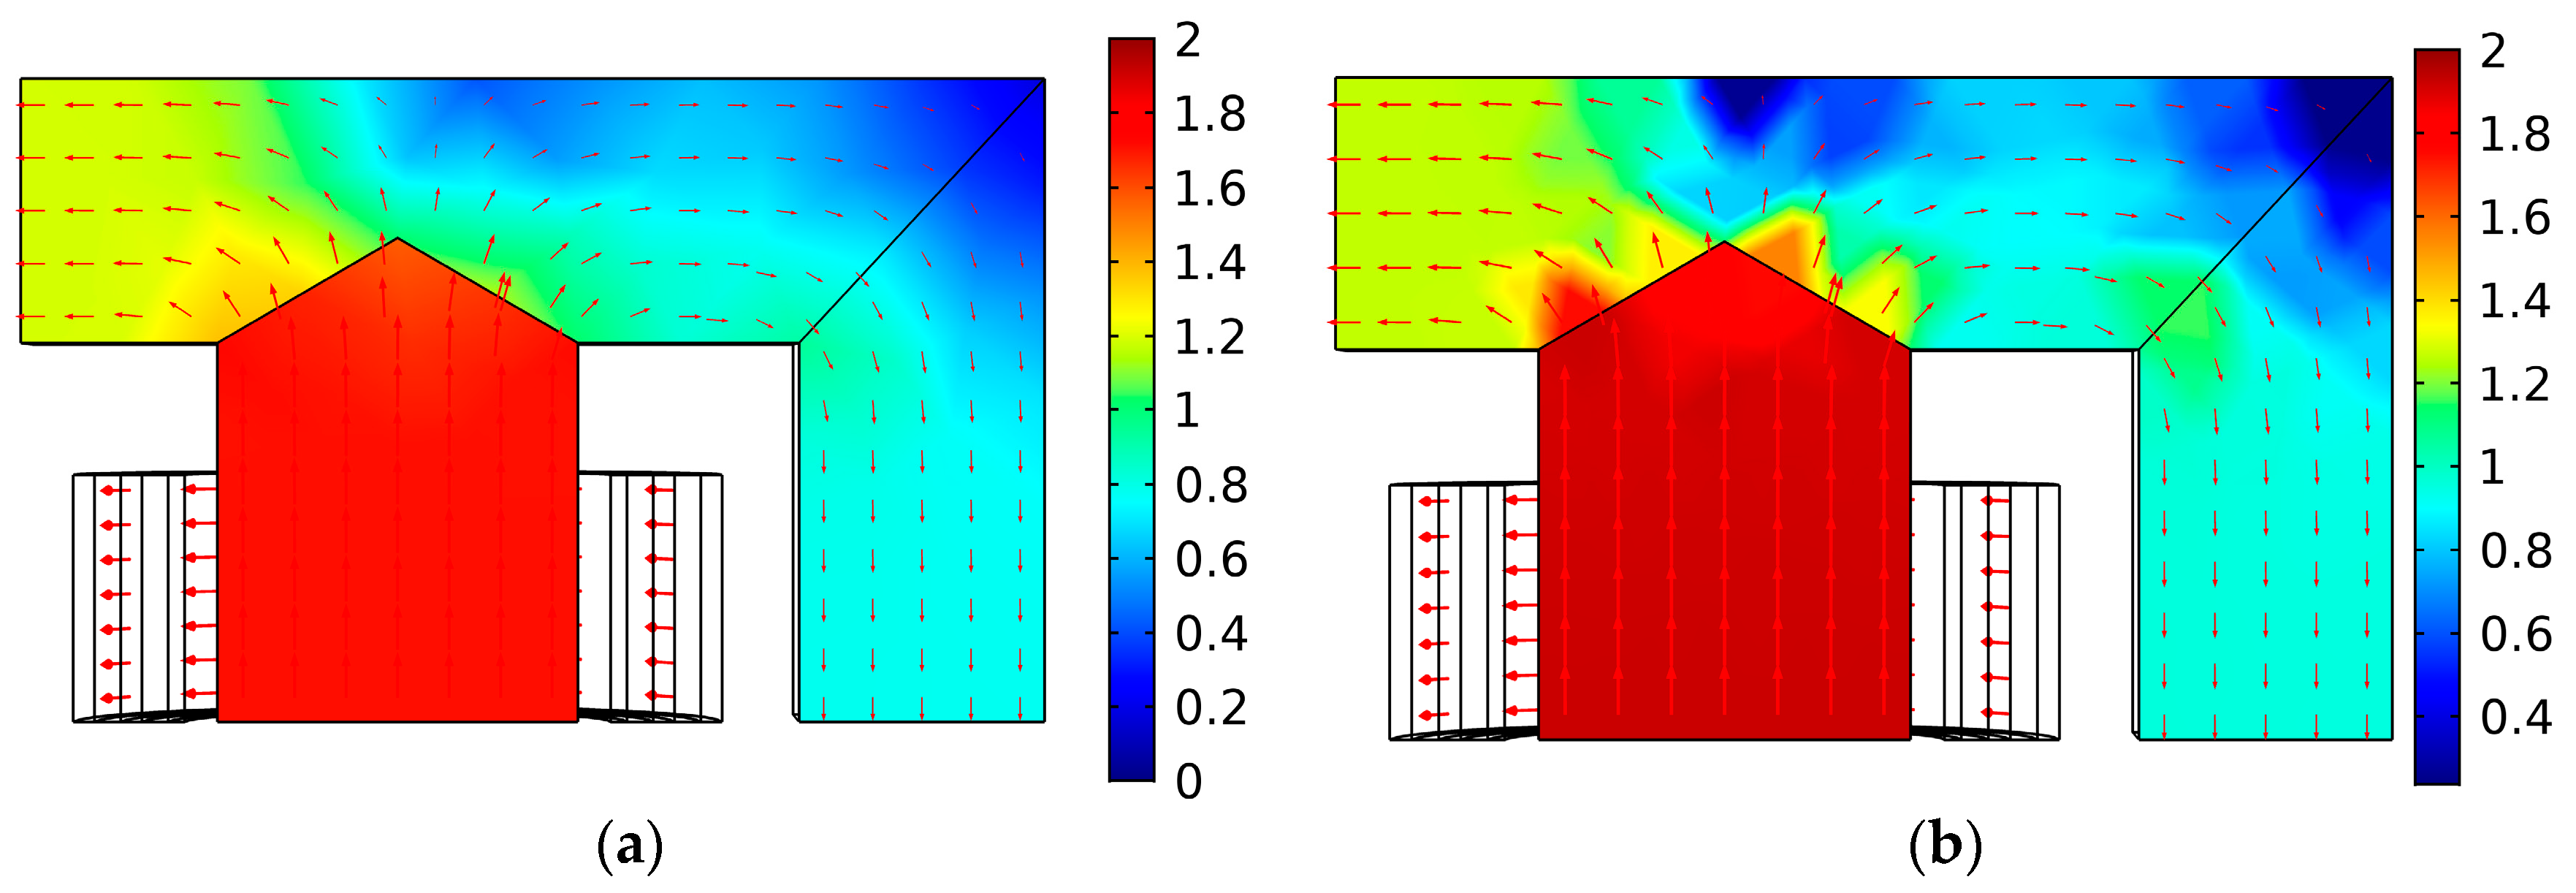
This paper conducted simulation analysis for the RSM. The no-load excitation current and the winding current with load under various DC bias currents were calculated by the time domain field-circuit coupling FEM and these results will be presented in Section 4.3 for making a comparison with the experimental data. The flux distribution in Figure 14 clearly shows that the core was severely saturated under DC bias current, especially in the main leg and the T-joint area.
4.3. Comparison between Experiment and Simulation
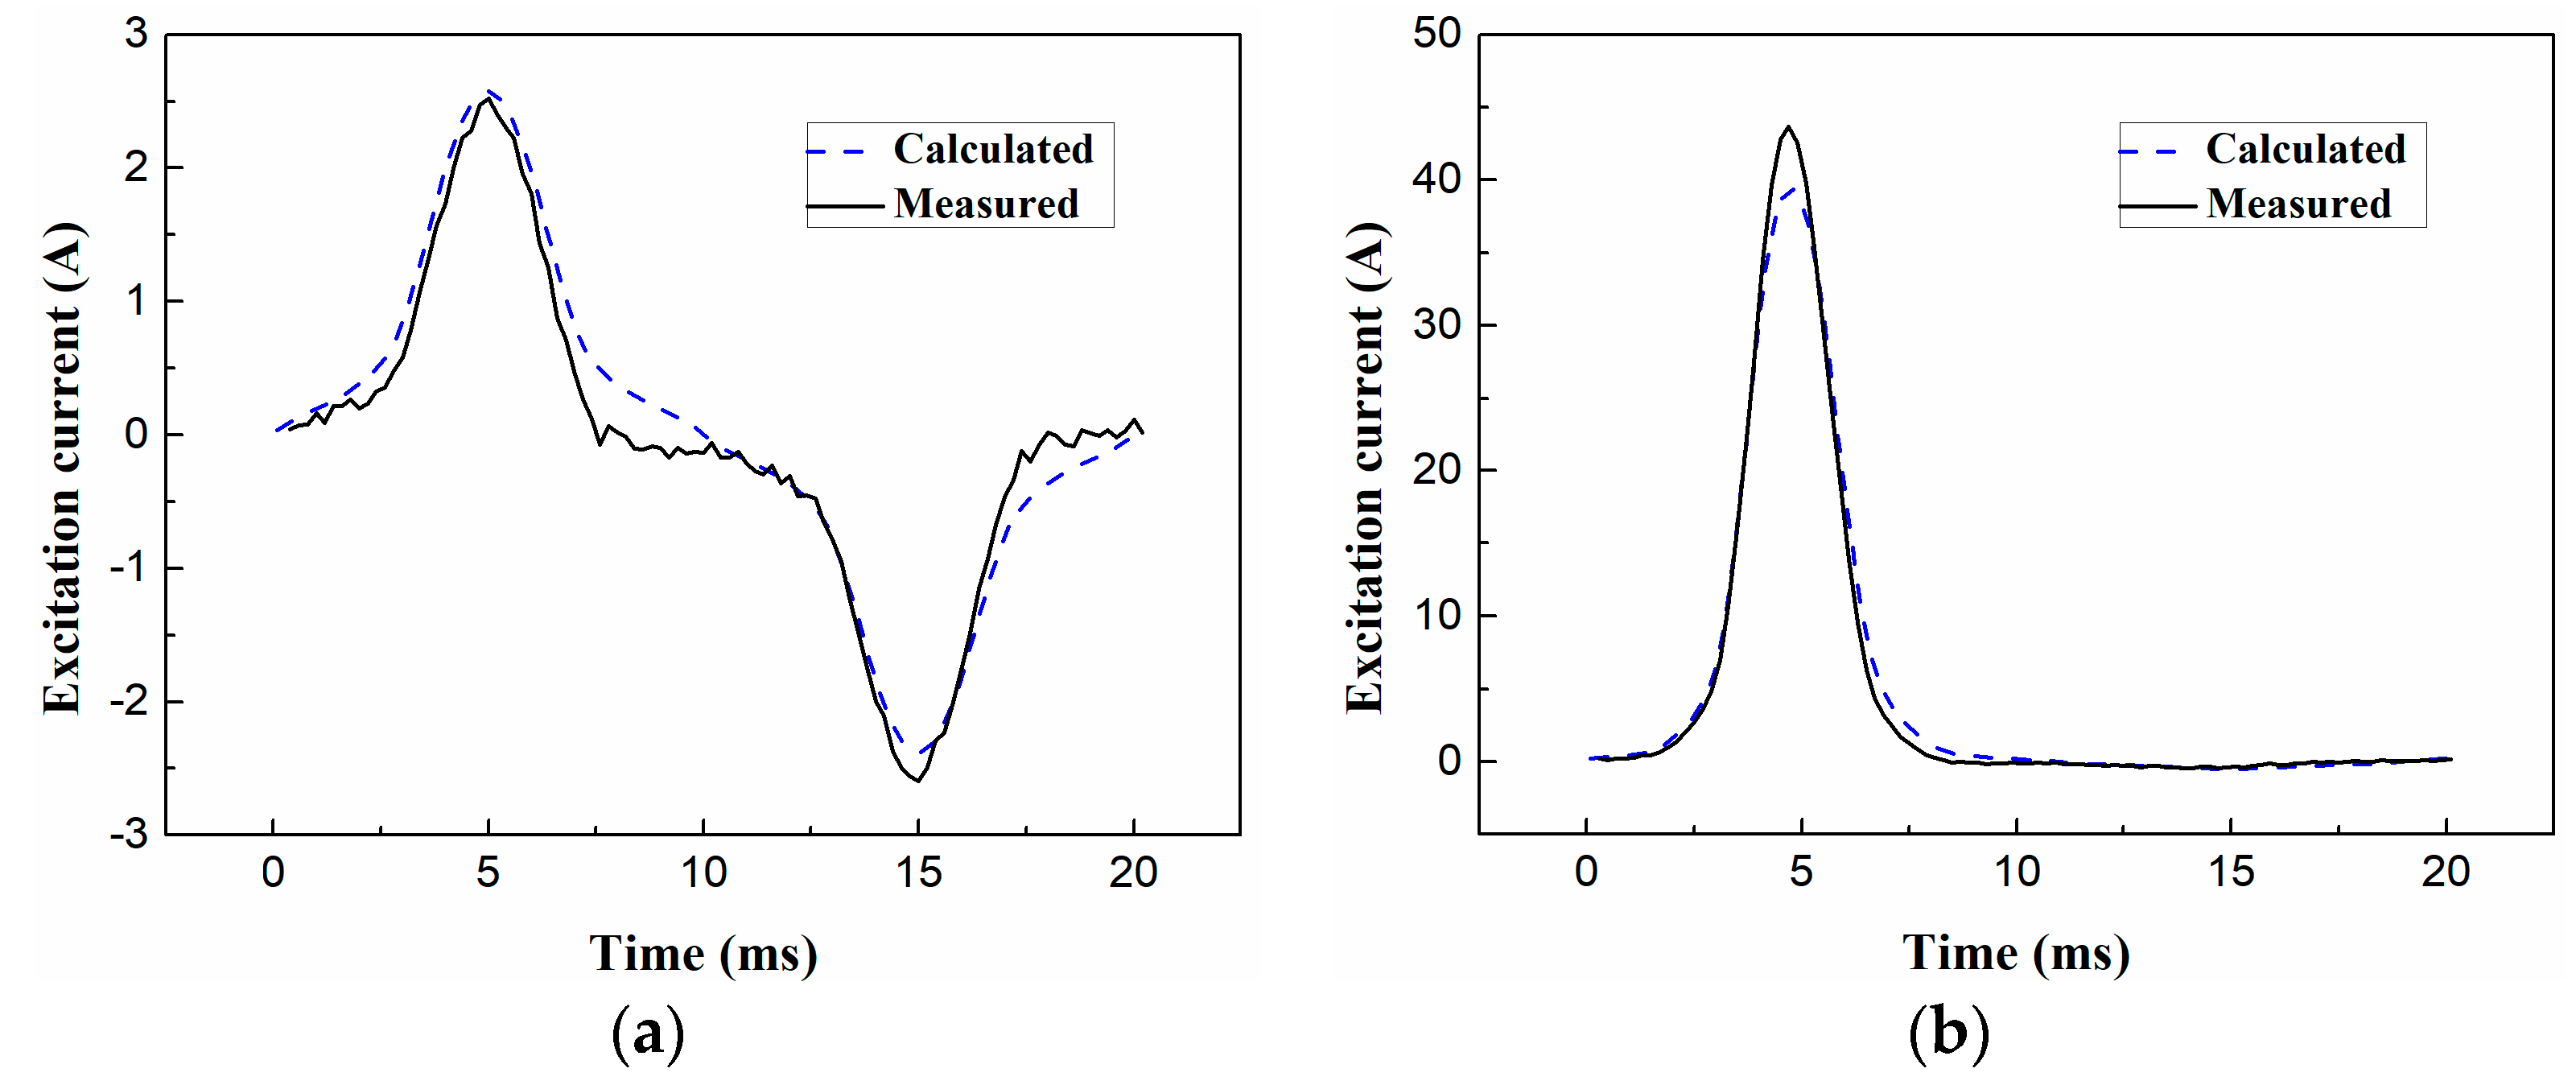
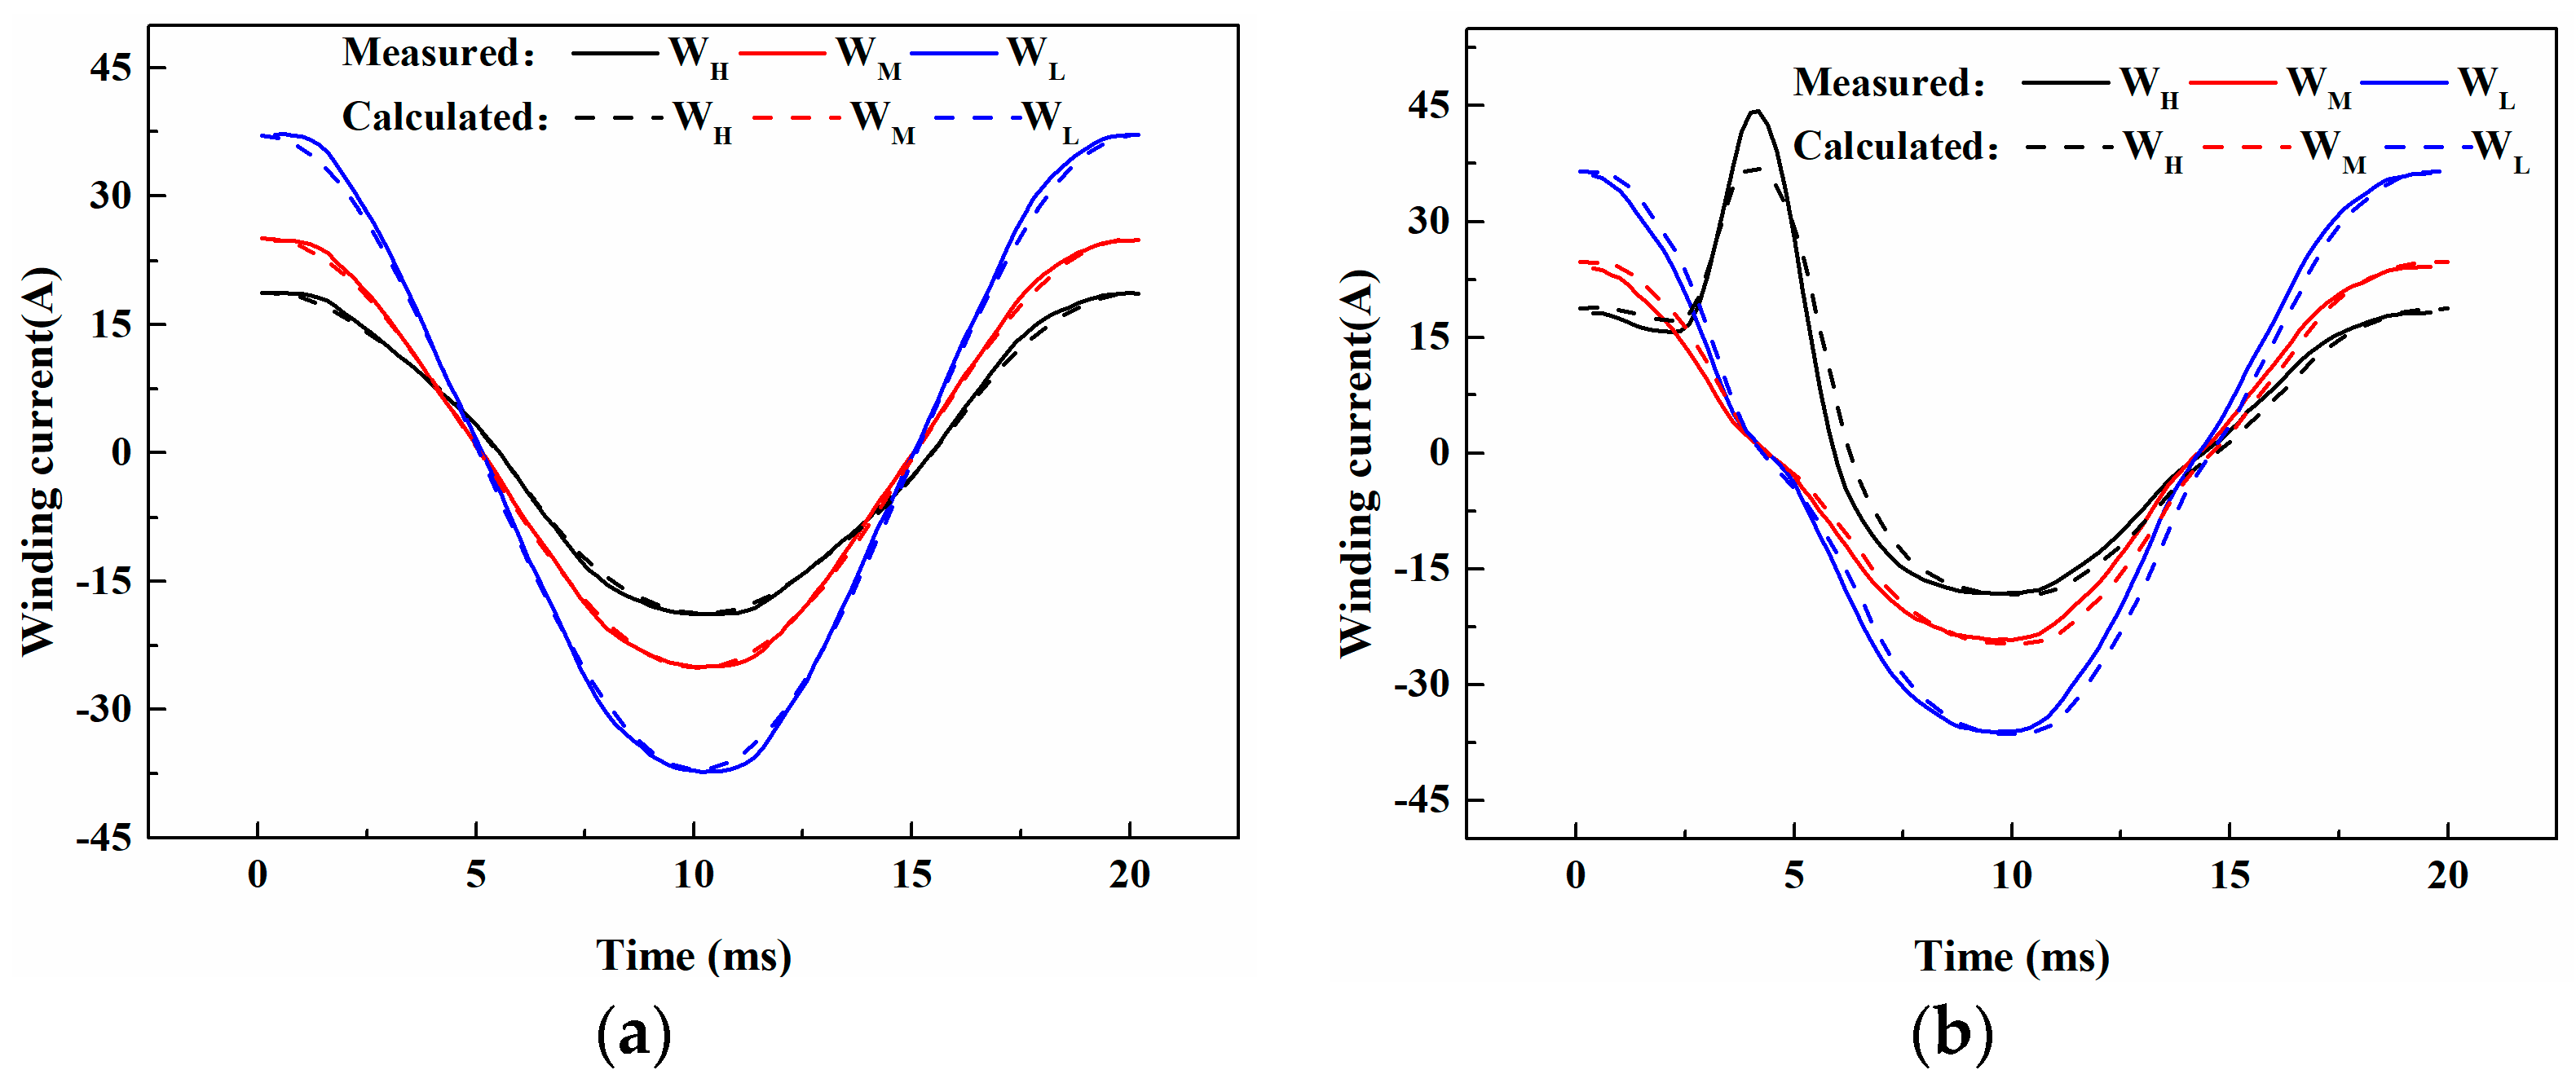
The measured value of no-load excitation current without DC bias current was compared with simulation results, as shown in Figure 15. Figure 16 shows the comparison between the simulated and measured values of winding current with rated operation under various DC bias currents.
As can be seen from Figure 15 and Figure 16, the measured data showed a good accuracy with the calculated by field-circuit coupling FEM.
It should be noted that two errors can be noticed easily in Figure 15 and Figure 16b, which are mainly caused by: neglecting the hysteresis effects, which caused the error when excitation current was close to 0, as shown in Figure 15a.
Due to the actual data provided only to 1.9 T, linear curve fitting was utilized for the deep saturation situation of BH curve, therefore the actual saturation condition was more severe than the simulated one, which caused the calculation error about peak value, as shown in Figure 15b and Figure 16b.
However, the relative deviations of peak value and effective value of excitation current without DC bias were 2.2% and 4.2% respectively. The relative deviations of peak excitation current and effective value under 5 A DC bias were 7.9% and 3.7%, respectively. These errors are within the acceptable range in engineering.
5. Conclusions
In this paper, a novel reduced-scale model based on an identical saturation degree is proposed to reflect the actual operation condition of the UHV autotransformer under DC bias. The proposed equivalent technique is applicable for all the reduced-scale model only if they shared the same structure and identical saturation degree. The load test results of the RSM under various DC bias current have been presented at rated operation. The experimental results show that the distortion of excitation current rises sharply as the DC bias current increases, and mainly occurs on the first half cycle. The even harmonics occur due to the DC bias current, the second harmonic almost grows linearly with DC bias current, whereas high harmonics growth rate decreases with the deepening of DC bias. The high voltage side current shows less tolerance to the DC bias, the THD is much higher than the middle and low voltage side current. As the DC bias current increases, the flux distribution cloud map shows the main leg and T-joints are highly saturated, which causes the increases of no-load loss. By good use of the proposed equivalent reduced-scale model, the rated load operation of the UHV transformer under DC bias can be predicted, and the experimental data of the RSM can play a significant role in guiding the protection of the UHV transformer under DC bias.
Author Contributions
Conceptualization, B.L.; methodology, S.G.; software, M.L.; writing—review and editing, B.L.; supervision, Z.W. All authors have read and agreed to the published version of the manuscript.
Funding
This research was funded by the National Key R&D Program of China, grant number 2016YFC0800100; And this work was also supported by the China Scholarship Council (CSC), grant number 201906730078.
Conflicts of Interest
The authors declare no conflict of interest.
References
- Picher, P.; Bolduc, L.; Dutil, A.; Pham, V.Q. Study of the Acceptable DC Current Limit in Core-form Power Transformers. IEEE Trans. Power Deliv. 1997, 12, 257–265. [Google Scholar] [CrossRef]
- He, J.; Zhou, Y.; Li, Z.; Yuan, J. Feasibility of Using One-Column-Varistor Arresters in 1000-kV UHV Substations. IEEE Trans. Power Deliv. 2016, 31, 1533–1541. [Google Scholar] [CrossRef]
- Liu, G.; Hou, D.; Zhao, X.; Yuan, D.; Li, L.; Sun, Y. Power Transformer’s Electrostatic Ring Optimization Based on ANSYS Parametric Design Language and Response Surface Methodology. Appl. Sci. 2019, 9, 4286. [Google Scholar] [CrossRef] [Green Version]
- Buticchi, G.; Lorenzani, E. Detection Method of the DC Bias in Distribution Power Transformers. IEEE Trans. Ind. Electron. 2013, 60, 3539–3549. [Google Scholar] [CrossRef]
- Almaguer, J.; Cárdenas, V.; Espinoza, J.; Aganza-Torres, A.; González, M. Performance and Control Strategy of Real-Time Simulation of a Three-Phase Solid-State Transformer. Appl. Sci. 2019, 9, 789. [Google Scholar] [CrossRef] [Green Version]
- Marti, L.; Rezaei-Zare, A.; Narang, A. Simulation of Transformer Hotspot Heating due to Geomagnetically Induced Currents. IEEE Trans. Power Deliv. 2013, 28, 320–327. [Google Scholar] [CrossRef]
- Banaszak, S.; Gawrylczyk, K.M.; Trela, K.; Bohatyrewicz, P. The Influence of Capacitance and Inductance Changes on Frequency Response of Transformer Windings. Appl. Sci. 2019, 9, 1024. [Google Scholar] [CrossRef] [Green Version]
- Kefalas, T.D.; Kladas, A.G. Harmonic Impact on Distribution Transformer No-Load Loss. IEEE Trans. Ind. Electr. 2010, 57, 193–200. [Google Scholar] [CrossRef]
- He, J.; Yu, Z.; Zeng, R.; Zhang, B. Vibration and Audible Noise Characteristics of AC Transformer Caused by HVDC System under Monopole Operation. IEEE Trans. Power Deliv. 2012, 27, 1835–1842. [Google Scholar] [CrossRef]
- Baguley, C.A.; Madawala, U.K.; Carsten, B. The Impact of Vibration Due to Magnetostriction on the Core Losses of Ferrite Toroidals under DC Bias. IEEE Trans. Magn. 2011, 47, 2022–2028. [Google Scholar] [CrossRef]
- Danish, S.M.S.; Shigenobu, R.; Kinjo, M.; Mandal, P.; Krishna, N.; Hemeida, A.M.; Senjyu, T. A Real Distribution Network Voltage Regulation Incorporating Auto-Tap-Changer Pole Transformer Multiobjective Optimization. Appl. Sci. 2019, 9, 2813. [Google Scholar] [CrossRef] [Green Version]
- Pfützner, H.; Shilyashki, G.; Bengtsson, C.; Trenner, G.; Gerstbauer, E. Effects of DC Bias on Regional Flux and Magnetostriction of a Single-Phase Transformer Core Modeled by 3-D MACC. IEEE Trans. Magn. 2018, 54, 1–6. [Google Scholar] [CrossRef]
- Wang, Z.; Tan, R.; Zang, Y. DC-Bias Calculation for UHV Transformer in No-Load by Series Resistance. Trans. China Electrotech. Soc. 2017, 32, 129–137. [Google Scholar]
- Chen, D.; Hou, B.; Feng, Z.; Bai, B. Study of Magnetostriction Influence of Electrical Sheet Steel under Different DC Biases. IEEE Trans. Magn. 2019, 55, 1–5. [Google Scholar] [CrossRef]
- Liu, Z.; Lan, Z.; Guo, J.; Zhang, J.; Xie, Y.; Cao, X.; Duan, Z. A New Hybrid Reciprocating Compressor Model Coupled with Acoustic FEM Characterization and Gas Dynamics. Appl. Sci. 2019, 9, 1179. [Google Scholar] [CrossRef] [Green Version]
- Bíró, O.; Koczka, G.; Leber, G.; Preis, K.; Wagner, B. Finite Element Analysis of Three-Phase Three-Limb Power Transformers Under DC Bias. IEEE Trans. Magn. 2012, 50, 565–568. [Google Scholar] [CrossRef]
- Zhao, X.; Zhong, Y.; Biro, O.; Li, L.; Cheng, Z.; Guan, D.; Meng, F. Computation and Analysis of DC-Biased Eddy Current Problems by an Efficient Fixed-Point Technique in the Harmonic Domain. IEEE Trans. Magn. 2015, 51, 1–4. [Google Scholar] [CrossRef]
- Malowany, K.; Piekarczuk, A.; Malesa, M.; Kujawińska, M.; Więch, P. Application of 3D Digital Image Correlation for Development and Validation of FEM Model of Self-Supporting Arch Structures. Appl. Sci. 2019, 9, 1305. [Google Scholar] [CrossRef] [Green Version]
- Wang, Z.; Pan, C.; Zhou, S.; Liu, L. Transient Magnetic Circuit Coupled Model of Transformer Based on Edge Finite Element Method. Trans. China Electrotech. Soc. 2012, 27, 146–152. [Google Scholar]
- Bhowmick, S.; Liu, G.R. Three Dimensional CS-FEM Phase-Field Modeling Technique for Brittle Fracture in Elastic Solids. Appl. Sci. 2018, 8, 2488. [Google Scholar] [CrossRef] [Green Version]
- Ding, D.; Zhao, D.; Zhang, X.; Lan, X.; Li, C.; Cui, B. Investigation of vibration impacts on HVAC transformer from HVDC system under monopole operation. IEEE Trans. Dielectr. Electr. Insul. 2016, 23, 1386–1392. [Google Scholar] [CrossRef]
- Li, X.; Wen, X.; Markham, P.N.; Liu, Y. Analysis of Nonlinear Characteristics for a Three-Phase, Five-Limb Transformer under DC Bias. IEEE Trans. Power Deliv. 2010, 25, 2504–2510. [Google Scholar] [CrossRef]
- Pan, Z.; Wang, X.; Tan, B.; Zhu, L.; Liu, Y.; Liu, Y.; Wen, X. Potential Compensation Method for Restraining the DC Bias of Transformers During HVDC Monopolar Operation. IEEE Trans. Power Deliv. 2016, 31, 103–111. [Google Scholar] [CrossRef]
- Pu, Z.H.; Ruan, J.J.; Du, Z.Y.; Zhang, Y.D.; Li, J.L.; Xie, Q.J.; Tan, D. Analysis of Voltage Distribution Characteristics in UHVDC Converter Transformer Winding Based on the Reduced-Scale Model. IEEE Trans. Magn. 2014, 50, 1–5. [Google Scholar] [CrossRef]
- Takami, J.; Tsuboi, T.; Yamamoto, K.; Okabe, S.; Baba, Y. Lightning surge characteristics on inclined incoming line to substation based on reduced-scale model experiment. IEEE Trans. Dielectr. Electr. Insul. 2013, 20, 739–746. [Google Scholar] [CrossRef]
- Zhang, S. Assessment on Applied Magnetic Properties of Silicon Steel Sheet in UHV Transformer. Proc. CSEE 2017, 37, 5511–5518. [Google Scholar]
Figure 1.
Experimental platform with load under DC bias. (a) Schematic diagram. (b) Photo of the experimental platform.
Figure 1.
Experimental platform with load under DC bias. (a) Schematic diagram. (b) Photo of the experimental platform.

Figure 2.
Reduced-scale autotransformer.

Figure 3.
B-H curve of UHV transformer as 27ZH095 and RSM as B23R075.

Figure 4.
Field-circuit coupling model. (a) Eighth magnetic field model. (b) Circuit model.

Figure 5.
Excitation current waveform under DC bias current. (a) UHV transformer. (b) reduced-scale model.
Figure 5.
Excitation current waveform under DC bias current. (a) UHV transformer. (b) reduced-scale model.

Figure 6.
Harmonic magnitude of UHV transformer under DC bias current.

Figure 7.
Ratio of the second harmonic to the fundamental under DC bias of the UHV and RSM.

Figure 8.
The equivalent relationship of DC bias current of the UHV and RSM.

Figure 9.
No-load excitation current waveform with and without DC bias current. (a) without DC bias current. (b) under 1 A DC bias current. (c) under 3 A DC bias current. (d) under 5 A DC bias current.
Figure 9.
No-load excitation current waveform with and without DC bias current. (a) without DC bias current. (b) under 1 A DC bias current. (c) under 3 A DC bias current. (d) under 5 A DC bias current.

Figure 10.
Magnitudes of harmonics of each winding current under various DC bias current. (a) series winding current. (b) common winding current. (c) low voltage winding current. (d) excitation current.
Figure 10.
Magnitudes of harmonics of each winding current under various DC bias current. (a) series winding current. (b) common winding current. (c) low voltage winding current. (d) excitation current.

Figure 11.
Winding current waveforms with load under various DC bias current. (a) without DC bias current. (b) under 1 A DC bias current. (c) under 3 A DC bias current. (d) under 5 A DC bias current.
Figure 11.
Winding current waveforms with load under various DC bias current. (a) without DC bias current. (b) under 1 A DC bias current. (c) under 3 A DC bias current. (d) under 5 A DC bias current.


Figure 12.
THD of excitation and winding currents.

Figure 13.
The measured losses and active power under various DC bias current. (a) no load loss. (b) active power of each side at rated operation.
Figure 13.
The measured losses and active power under various DC bias current. (a) no load loss. (b) active power of each side at rated operation.

Figure 14.
The flux distribution with and without DC bias current. (a) without DC bias current. (b) with 5 A DC bias current.
Figure 14.
The flux distribution with and without DC bias current. (a) without DC bias current. (b) with 5 A DC bias current.

Figure 15.
The excitation current of calculated and measured with and without DC bias current. (a) without DC bias current. (b) with 5 A DC bias current.
Figure 15.
The excitation current of calculated and measured with and without DC bias current. (a) without DC bias current. (b) with 5 A DC bias current.

Figure 16.
The winding current of calculated and measured with and without DC bias current. where WH presents high voltage winding, WM presents middle voltage winding, WL presents low voltage winding. (a) without DC bias current. (b) with 5 A DC bias current.
Figure 16.
The winding current of calculated and measured with and without DC bias current. where WH presents high voltage winding, WM presents middle voltage winding, WL presents low voltage winding. (a) without DC bias current. (b) with 5 A DC bias current.


Table 1.
Equipment configuration of experimental platform.
| Equipment | Parameter |
|---|---|
| Voltage | Rated capacitor: 10 kVA |
| Regulator | Output voltage: 0 V~300 V |
| Isolation | Rated capacitor:10 kVA, |
| Transformer | Input voltage: 220 V, Output voltage: 360 V |
| DC Source | Tektronix PWS 2326, Output DC current: 0 A~6 A, voltage: 0 V~32 V |
| Capacitor | BSMJ-0.4-60-1, Capacitance: 8*1194 μF (8 capacitors in parallel, impedance is 0.3 Ω) |
| Power Analyzer | Fluke Norma 5000 |
| Rated Load | Resistor at middle voltage side: 6.72 Ω Resistor at low voltage side: 2.16 Ω |
Table 2.
Parameters of the ultra-high voltage (UHV) transformer and reduced scale model (RSM).
| Parameters | UHV | RSM |
|---|---|---|
| Type | ODFPS-1000000/1000 | DG-5/0.36 |
| Rated capacity (kVA) | 1 × 10⁶/1 × 106/3.34 × 105 | 5/5/1.67 |
| Frequency (Hz) | 50 | 50 |
| Rated voltage (kV) | 0.36/0.18/0.06 | |
| Rated current (A) | 1649.57/3299.14/3036.3 | 13.89/27.78/27.78 |
| High/middle/low voltage winding turns | 1356/678/246 | 120/60/20 |
| Core structure | Two main columns, two side columns | Two main columns, two side columns |
Table 3.
Equivalent relationship of DC bias current of RSM to UHV.
| RSM | Ratio of 2nd to 1st | UHV |
|---|---|---|
| 0 | 0 | 0 |
| 1 | 0.91277 | 2.6862 |
| 2 | 0.94365 | 6.013 |
| 3 | 0.95092 | 7.5070 |
| 4 | 0.9524 | 7.9731 |
| 5 | 0.95144 | 8.2497 |
© 2020 by the authors. Licensee MDPI, Basel, Switzerland. This article is an open access article distributed under the terms and conditions of the Creative Commons Attribution (CC BY) license (http://creativecommons.org/licenses/by/4.0/).
Share and Cite
MDPI and ACS Style
Li, B.; Wang, Z.; Li, M.; Guo, S. Analysis of the DC Bias Effects on the UHV Autotransformer with Rated Load Based on a Reduced-Scale Model Experiment. Appl. Sci. 2020, 10, 1529. https://0-doi-org.brum.beds.ac.uk/10.3390/app10041529
AMA Style
Li B, Wang Z, Li M, Guo S. Analysis of the DC Bias Effects on the UHV Autotransformer with Rated Load Based on a Reduced-Scale Model Experiment. Applied Sciences. 2020; 10(4):1529. https://0-doi-org.brum.beds.ac.uk/10.3390/app10041529
Chicago/Turabian StyleLi, Bing, Zezhong Wang, Mingyang Li, and Suxin Guo. 2020. "Analysis of the DC Bias Effects on the UHV Autotransformer with Rated Load Based on a Reduced-Scale Model Experiment" Applied Sciences 10, no. 4: 1529. https://0-doi-org.brum.beds.ac.uk/10.3390/app10041529
Note that from the first issue of 2016, this journal uses article numbers instead of page numbers. See further details here.