Numerical Investigations on the Blade Tip Clearance Excitation Forces in an Unshrouded Turbine

School of Energy and Power Engineering, Xi’an Jiaotong University, Shaanxi Engineering Laboratory of Turbomachinery and Power Equipment, Xi’an 710049, Shaanxi, China
*
Author to whom correspondence should be addressed.
Appl. Sci. 2020, 10(4), 1532; https://0-doi-org.brum.beds.ac.uk/10.3390/app10041532
Submission received: 5 February 2020
/
Revised: 19 February 2020
/
Accepted: 20 February 2020
/
Published: 24 February 2020
(This article belongs to the Special Issue Computational Fluid Mechanics and Heat Transfer)
Abstract
:The purpose of this study was to investigate the characteristics of the blade tip excitation forces represented as the rotordynamic coefficients (stiffness and damping coefficients) in an unshrouded turbine using the three-dimensional computational fluid dynamic (CFD) numerical method. The blade geometrical parameters were based on a SNECMA transonic experimental rig. The simulations were performed by solving the compressible Reynolds-averaged Navier–Stokes (RANS) equations. The multi-frequency elliptical whirling orbit model and an improved mesh deformation method based on the transient analysis were utilized. The effects of operating conditions on the rotordynamic coefficients and the unsteady flow were also found. The results show that the positive direct stiffness, which confirmed the direct force contribution in the tip excitation forces and the cross-coupling stiffness, were dependent on the whirling frequencies. Damping effects were shown to be negligible. The rotational speed, inlet flow angle, eccentric ratio (ER), and mean tip clearance had impacts on the stiffness, and some effects of these variables on the rotordynamic coefficients were found to be frequency dependent. Additionally, increasing the rotor eccentricity and the mean tip clearance led to the nonuniformity of the circumferential pressure distributions.
1. Introduction
In an unshrouded turbine with an eccentric rotor, tip clearance excitation forces are generated owing to the variation of blade efficiency with the tip clearance in the circumferential direction. These forces, also known as the “Thomas–Alford forces,” could result in self-excited vibration and severe rotordynamic instabilities since they increase with the turbine load. Therefore, to ensure the stability of a rotor-bearing system, it is of great significance to investigate the characteristics of the excitation forces in the unshrouded turbine.
As mentioned above, these forces were first founded by Thomas [1] and Alford [2]. They both theoretically analyzed the mechanism of these forces and proposed respective models. Alford indicated that these forces are related to the stage torque T and mean tip clearance tm as described in Equation (1):
where Rm is the mean radius, h is the blade height, and β is a correction factor, which is related to the blade efficiency. Based on their theory, several experimental and theoretical analyses were performed to investigate these forces. Urlichs [3] and Wohlrab [4] measured the excitation forces in a low-power test turbine and found a direct force contribution that was not mentioned by Alford. Also, it was found that the excitation forces increased significantly as the mean tip clearance decreased. Martinez-Sanchez et al. [5] conducted an experiment in a relatively higher-power turbine with five different unshrouded configurations and one shrouded configuration. They found that the forces increase as the hub gap between the stator and rotor decreases, and the force coefficient decreases with the operation flow coefficient. Vance and Laudadio [6] verified Alford’s mathematical prediction model through a small high-speed axial flow test fan and found that the force is speed-dependent and easily affected by inlet flow conditions. Storace et al. [7] experimentally and theoretically investigated the effects of rotor eccentricity, which causes circumferentially nonuniform tip clearance, unsteady flow, and destabilizing aerodynamic forces, and proposed a simplified method for predicting the stability of aerodynamically excited turbomachinery. Song and Martinez-Sanchez [8,9] studied the force generation mechanism and proposed an actuator disk model that describes the flow response to a finite clearance at the rotor tip. Kanki and Tanitsuji [10] presented experimental results from a scale model of the steam turbine and analyzed the destabilizing forces by considering a partial admission condition. In addition, Aus der Wiesche et al. [11,12] recently proposed a semi-empirical model for the predictions of steam turbine excitation forces and discussed the effect of an additional tip leakage injection on the resulting Thomas–Alford forces.
In recent years, extensive studies on the destabilizing fluid forces in seals have been performed [13,14,15]. However, there are few studies on the blade tip clearance excitation fluid forces, except for the studies mentioned above. Hence, there is still a need to study the characteristics of these forces. Meanwhile, quite few of these existing studies were based on computational fluid dynamic (CFD) analysis, which is a reliable way to reveal more details of the complex flow and also a popular method for studying the tip leakage flow and the forces in seals. Moreover, many recent studies have experimentally and numerically investigated the effects of unshrouded blade tip leakage flow on the blade efficiency and heat transfer characteristics [16,17,18]. However, few of them focused on the blade tip clearance excitation forces. Therefore, this paper utilized the three-dimensional CFD numerical method to investigate the tip clearance excitation forces in an unshrouded turbine. The numerical method was based on the multi-frequency elliptical whirling orbit model and an improved mesh deformation method. The transient solution was utilized to solve the flow characteristics and the tip clearance forces, which in this paper are represented as the rotordynamic coefficients, including the stiffness and damping coefficients. Moreover, the effects of different variables, including the whirling frequency, rotational speed, inlet flow angle, mean tip clearance, and rotor eccentricity on the rotordynamic coefficients were studied in detail. The circumferential nonuniform pressure distributions caused by the rotor eccentricity were also investigated.
2. Numerical Setup
2.1. Computational Model
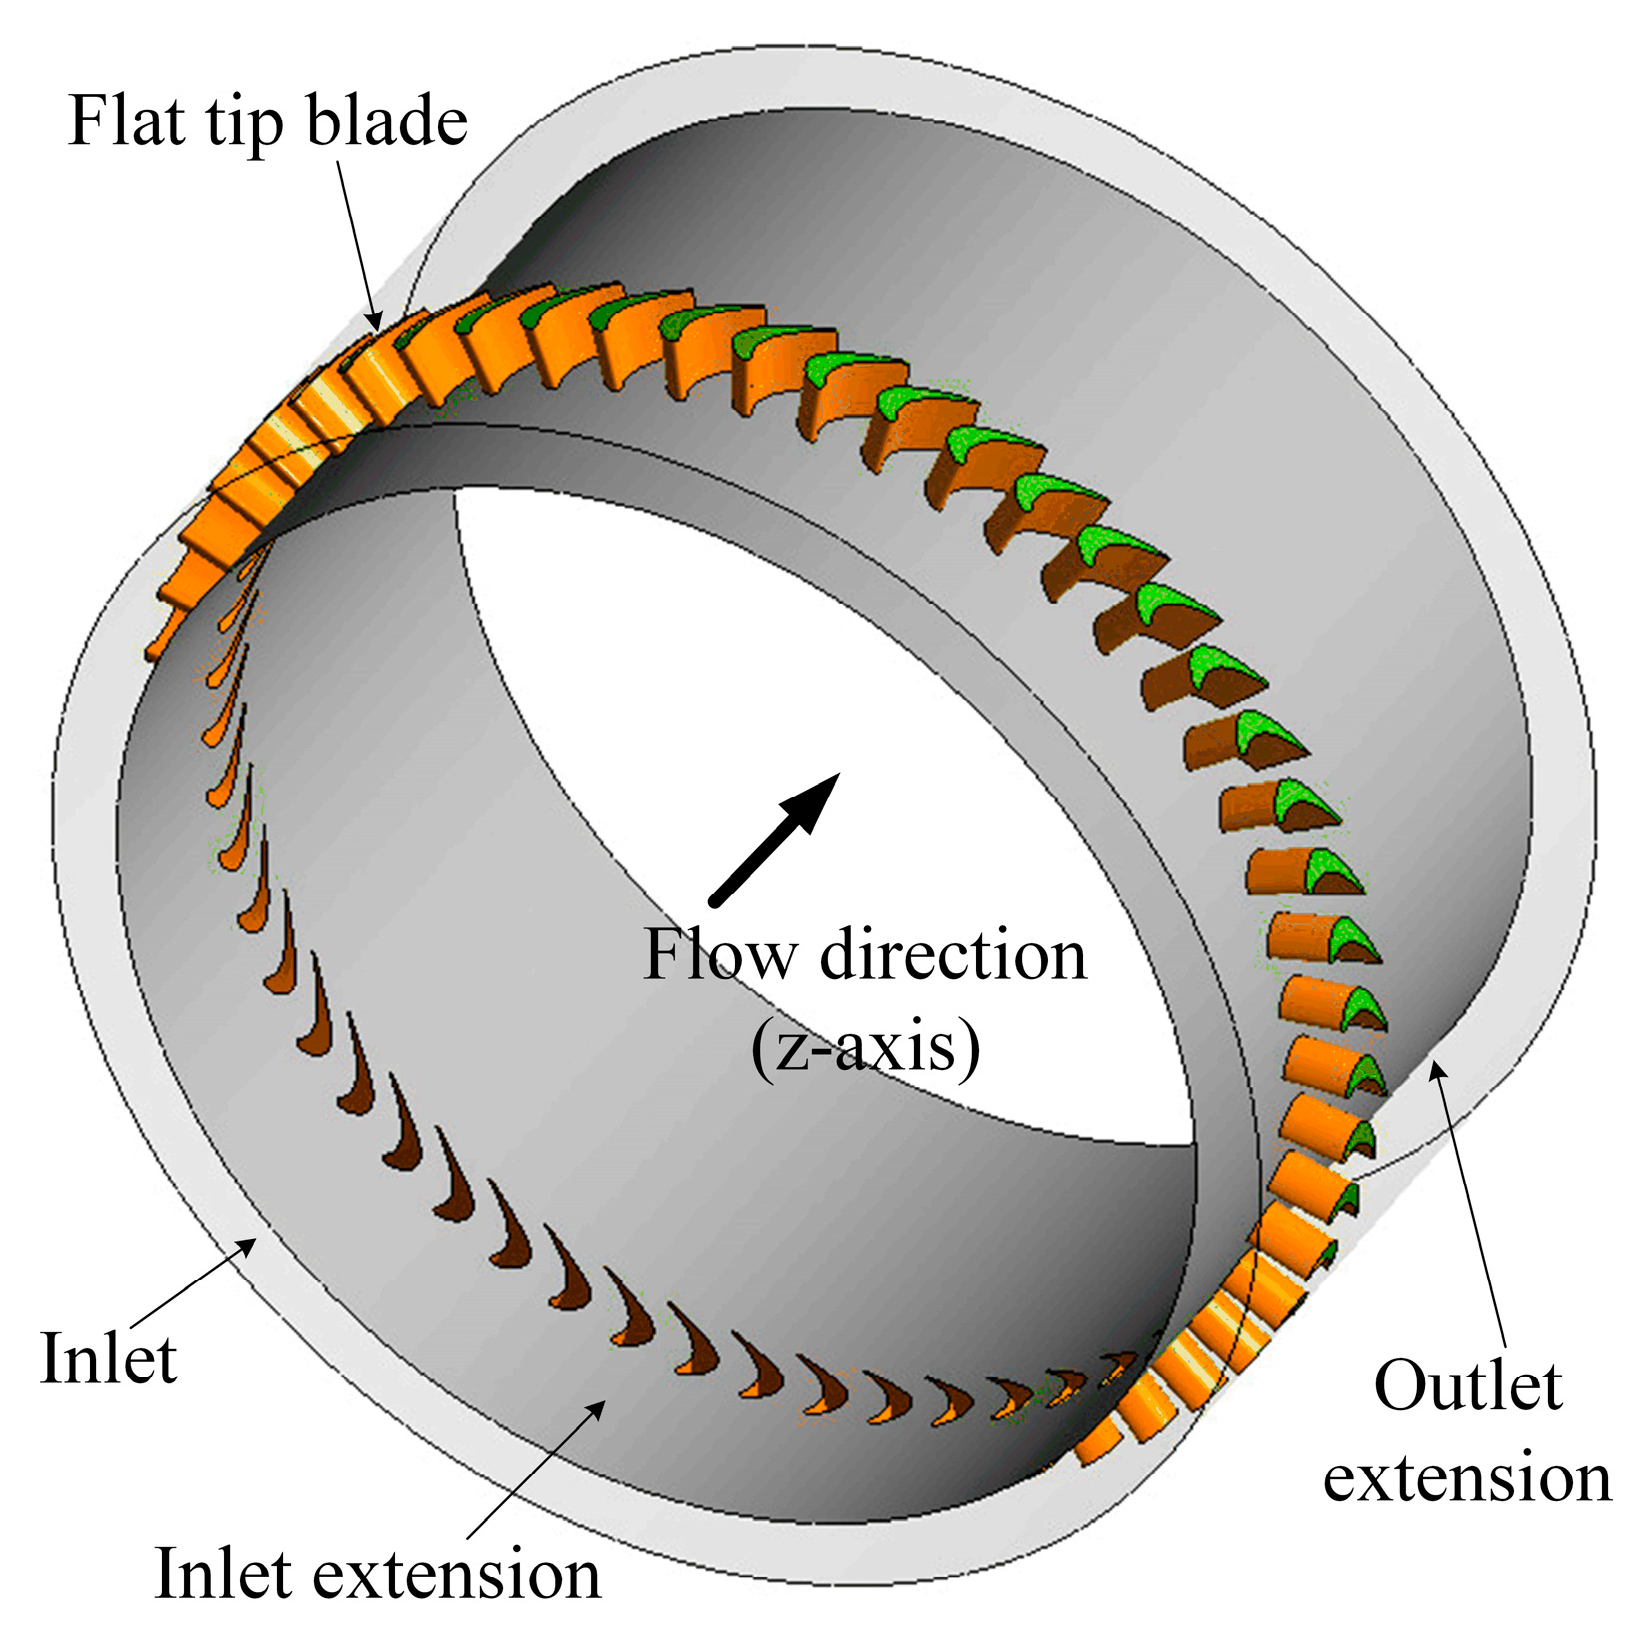
Figure 1 shows the full 360°, three-dimensional computational model with an unshrouded concentric rotor geometry. The blade geometrical parameters were based on a SNECMA transonic experimental rig [19] and the detailed information is illustrated in Table 1. The outlet Reynolds number based on the outlet velocity and rotor blade chord was 2.5 × 10⁵. In addition, it can be seen that the inlet extension (200% axial chord length) and outlet extension (500% axial chord length) were constructed to prevent the boundary influence. Different eccentricities and rotor motions were achieved by using the improved mesh deformation method, which is introduced in detail below.
2.2. Computational Method and Boundary Conditions
The commercial software ANSYS-CFX 16.1 was applied to solve the compressible Reynolds-averaged Navier–Stokes (RANS) equations. To obtain the full set of the frequency-dependent rotordynamic coefficients, transient analysis along with the multi-frequency elliptical whirling model were performed. The corresponding steady solutions were also found using the initial flow fields of the transient solutions. The convective terms and turbulence were found using high-order discretization. The desired converged target was the root mean square (RMS) residuals of each variable reaching a value of 10−4 or lower, the imbalance of the mass and momentum being less than 0.1%, the response forces caused by the rotor motion approaching periodic vibration, and the difference of results between two adjacent vibration periods being lower than 0.1%. The RNG (Re-Normalization Group) k-ε turbulence model, as well as the scalable wall function, were used to solve the turbulence characteristics. On one hand, RNG k-ε model has a higher precision and a faster convergence speed compared to the standard k-ε model, and it has been validated in many studies [20,21]. On the other hand, it demands a relatively high y+ value compared to the SST (Shear Stress Transfer) model, which is more suitable for mesh movement.
As for the boundary conditions, the absolute total pressure and total temperature were given at the inlet and the static pressure was applied at the outlet. The fixed temperature and no-slip wall conditions were applied. It should be noted that Arts et al. [19] did not take the rotational effects into consideration in their experiment. Therefore, the inlet total pressure (16.613 kPa) with no rotational speed was applied to simulate the experiment for the validation part. For the rest of the analysis, the inlet total pressure (243.5 kPa) and rotational speed (10000 rpm) was applied to keep the mass flow rate same as that in the experiment. Other detailed information is listed in Table 2.
2.3. Mesh Verification and Validation
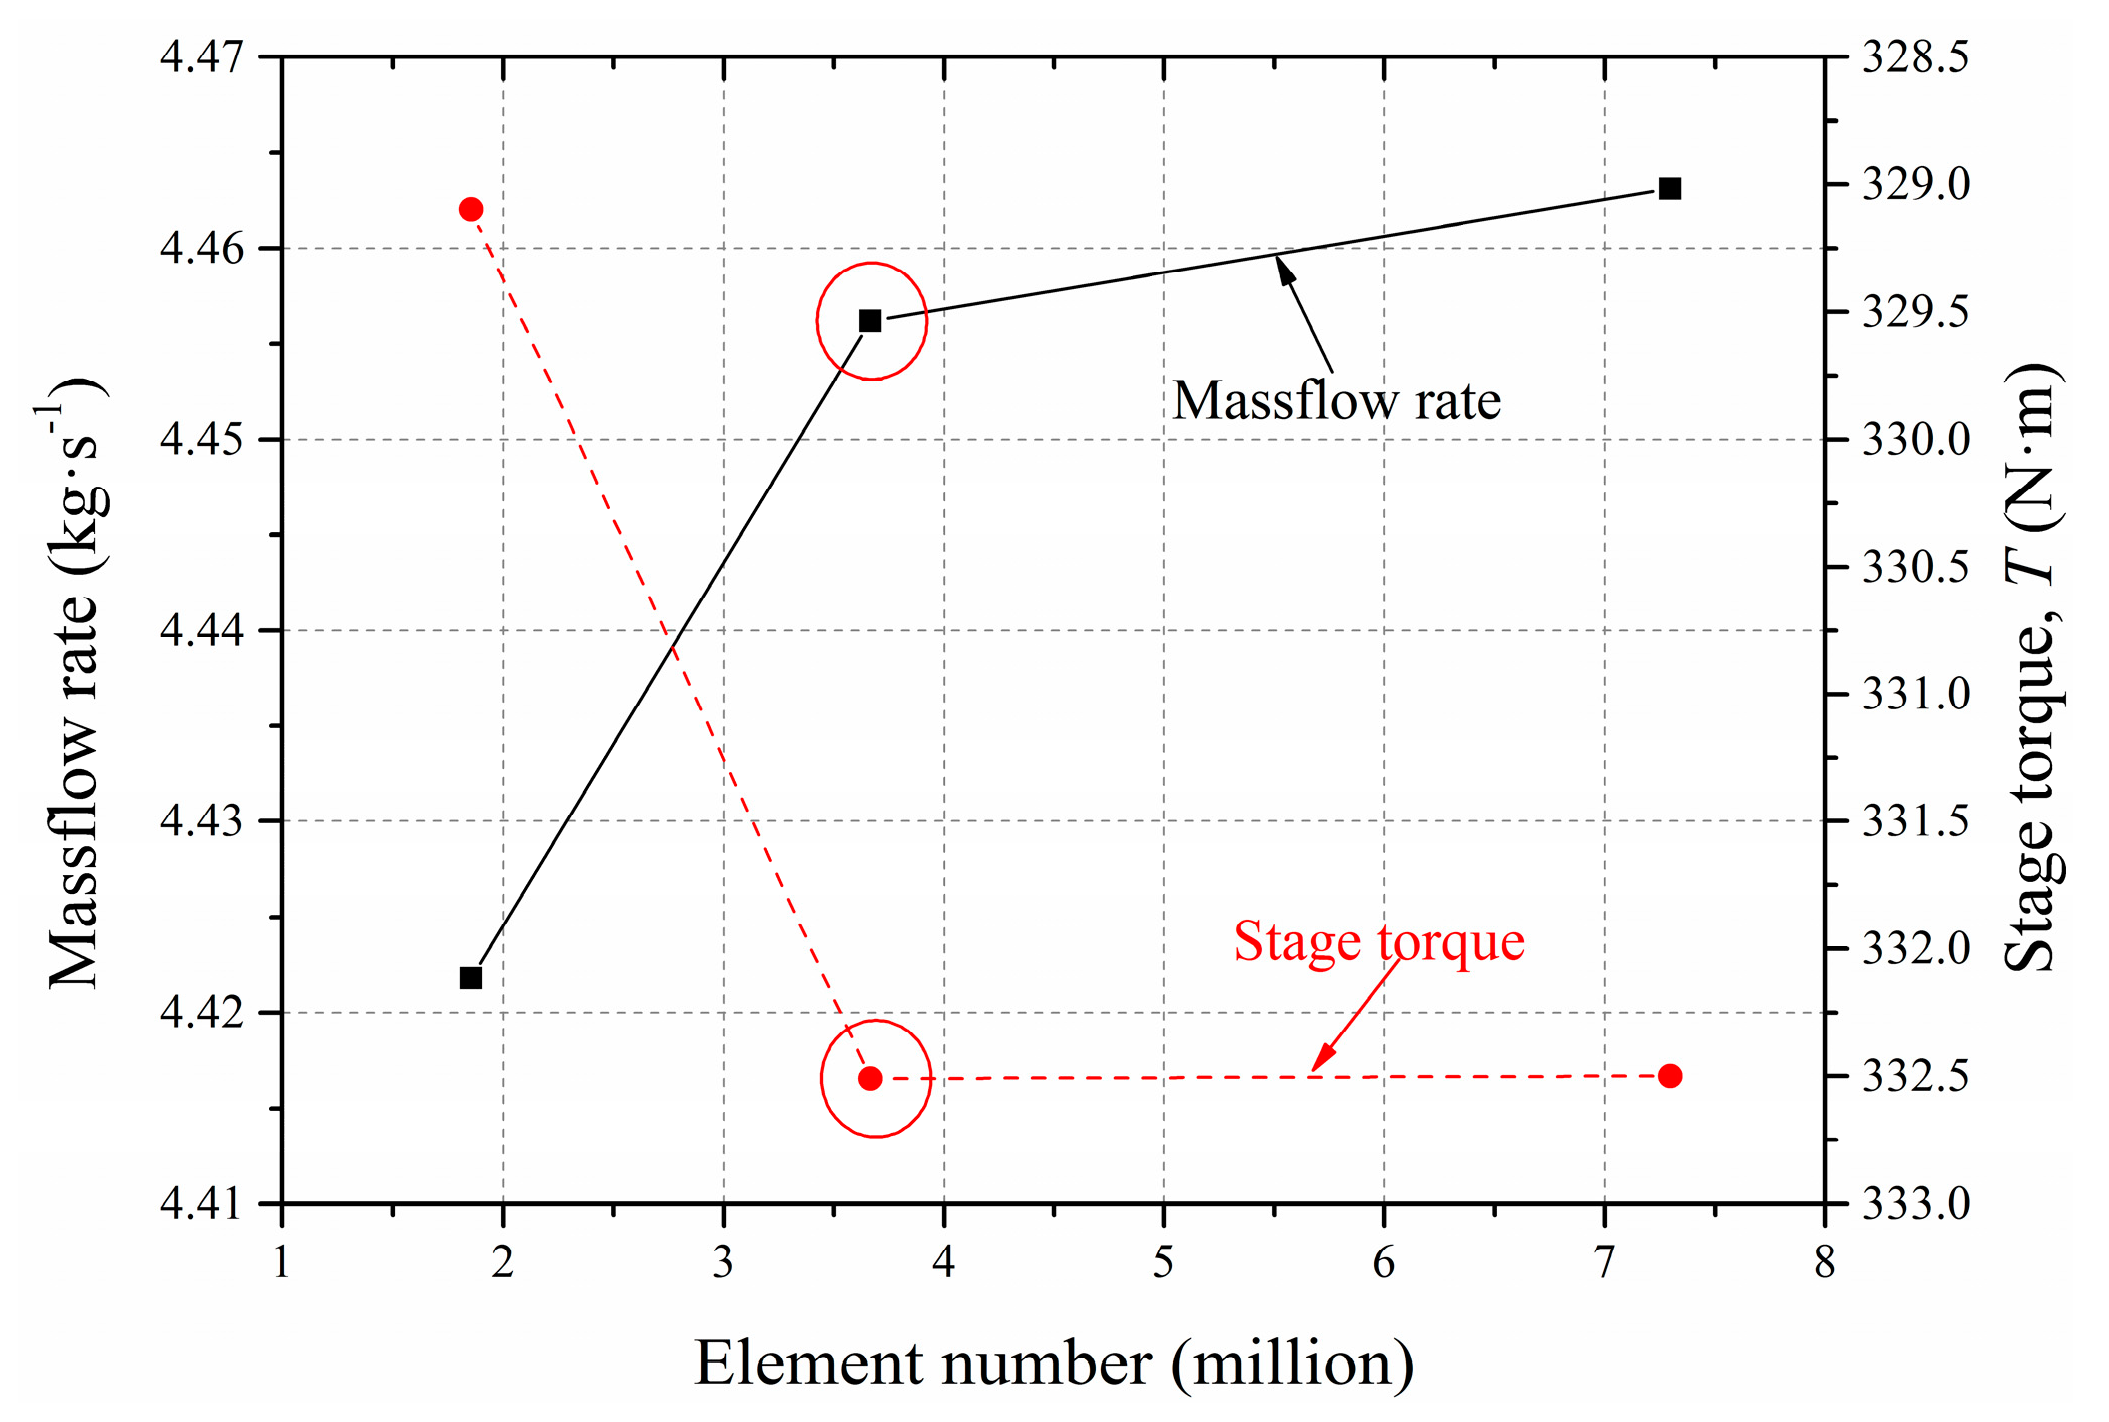
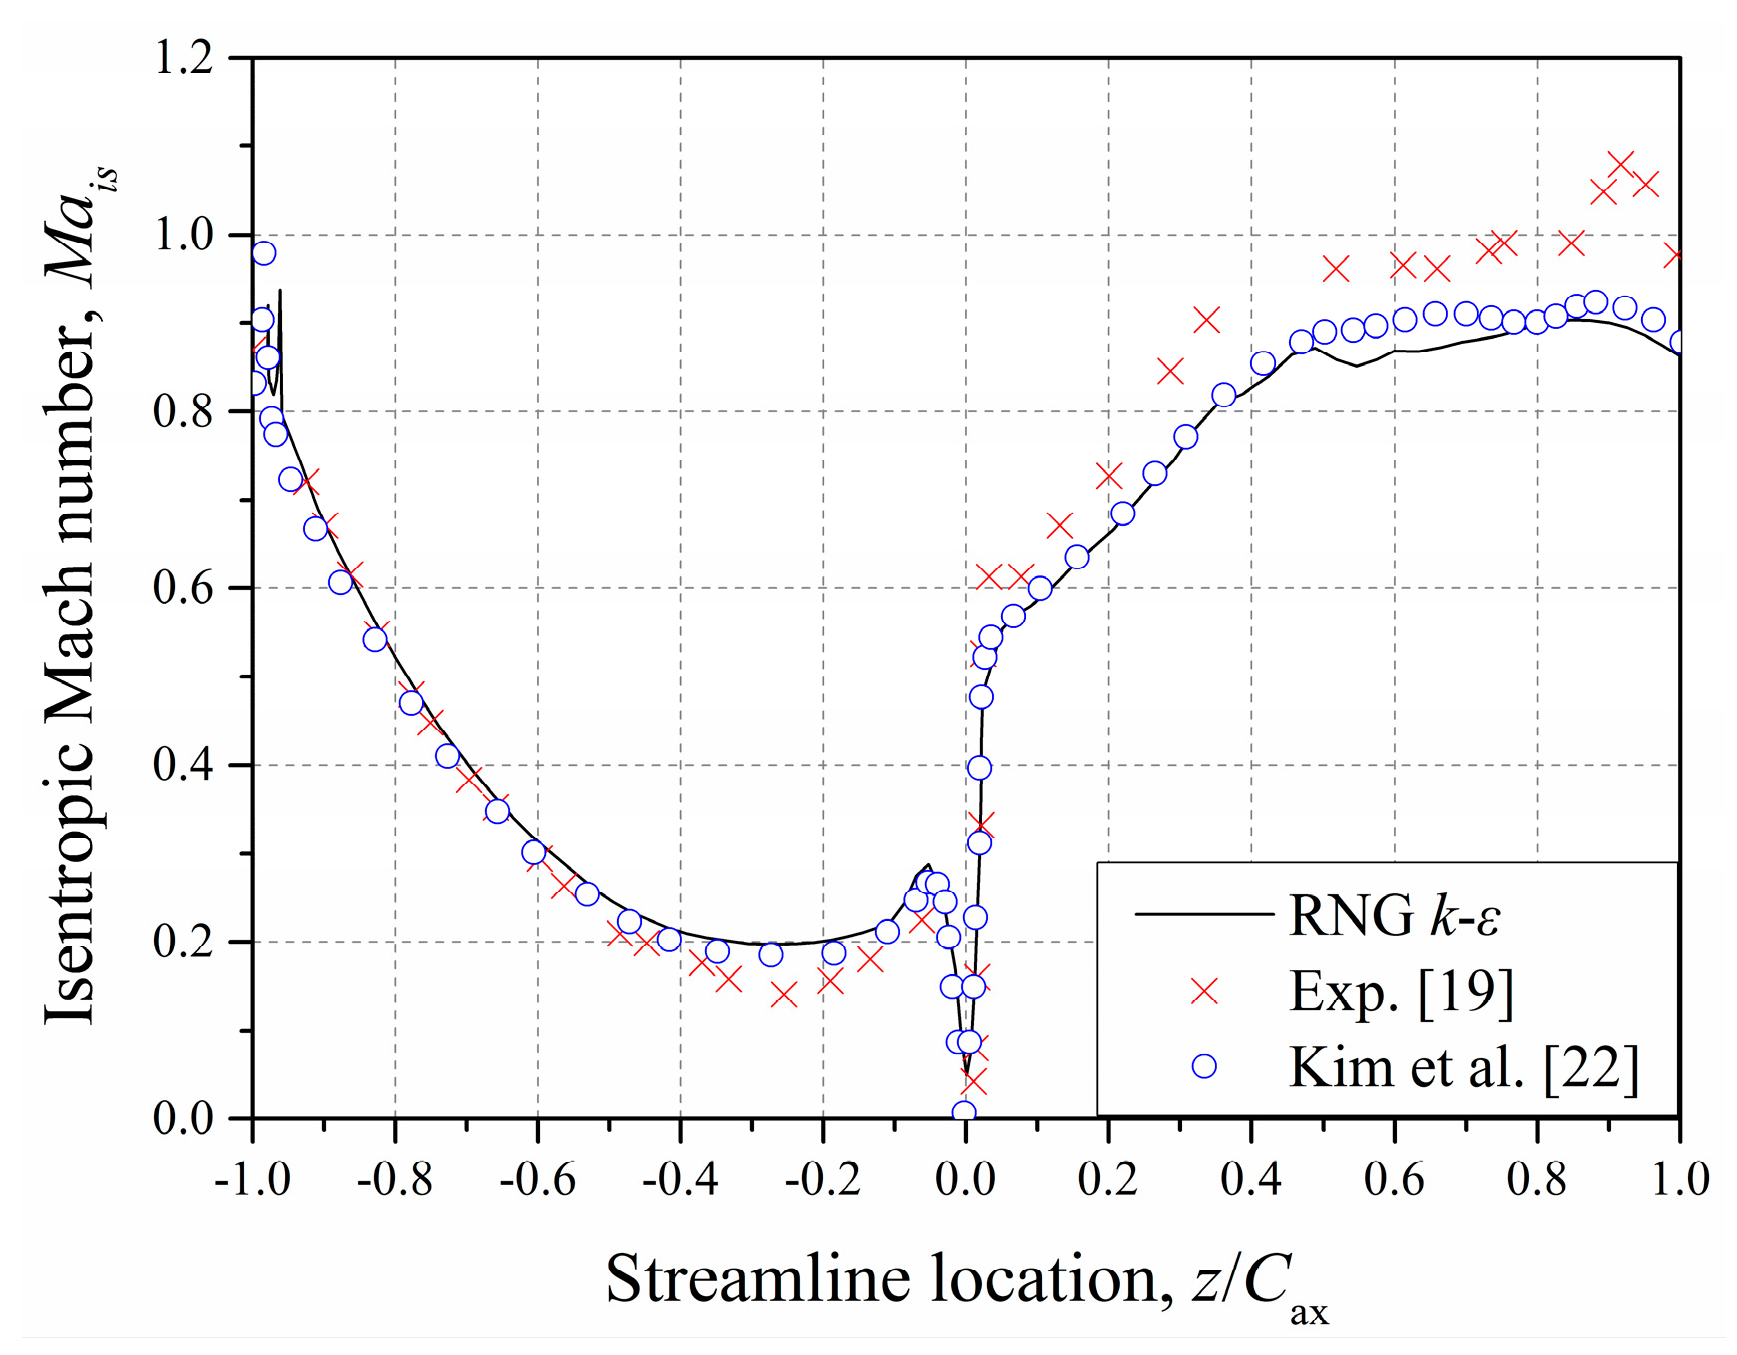
Figure 2 presents the mesh details of the rotor stage. A multi-block structural grid was generated for the computational domain using the commercial software ICEM CFD 16.1. The grids near the wall were refined to meet the requirements of the RNG k-ε turbulence model. Three kinds of mesh density in all were used to carry out the mesh sensitivity study and confirm that the results were not dependent on the mesh size. Figure 3 shows the variation of the mass flow rate and stage torque with the element number. It can be seen that the results with 3.67 million elements coincided with the results with 7.30 million elements. Therefore, the rest of the computations were conducted with 3.67 million elements. Furthermore, Figure 4 shows the comparison of the isentropic Mach number distribution between the numerical results using the RNG k-ε turbulence model and the experimental data. The isentropic Mach number Mais is defined as:
where Ps is the static pressure at each location and γ is the ratio of specific heats (γ = 1.4).
It can be seen that the numerical results agree well with the experimental data at most streamwise locations. Additionally, the results here are consistent with that in Kim et al. [22], which is also based on the same turbine rig. Therefore, the numerical method with the RNG k-ε model is validated as reliable.
2.4. Rotor Motion and Improved Mesh Deformation Method
The multi-frequency elliptical orbit whirling model was used in this paper to obtain the entire set of the frequency-dependent rotordynamic coefficients. This model has been validated in Li et al. [23]. The rotor motion Equations (3) and (4) are defined as harmonic functions with specific vibration amplitudes. Table 3 presents the details of the rotor motion parameters. The vibration amplitudes were obtained based on the small motion theory [24].
For x-direction excitation:
and for the y-direction excitation:
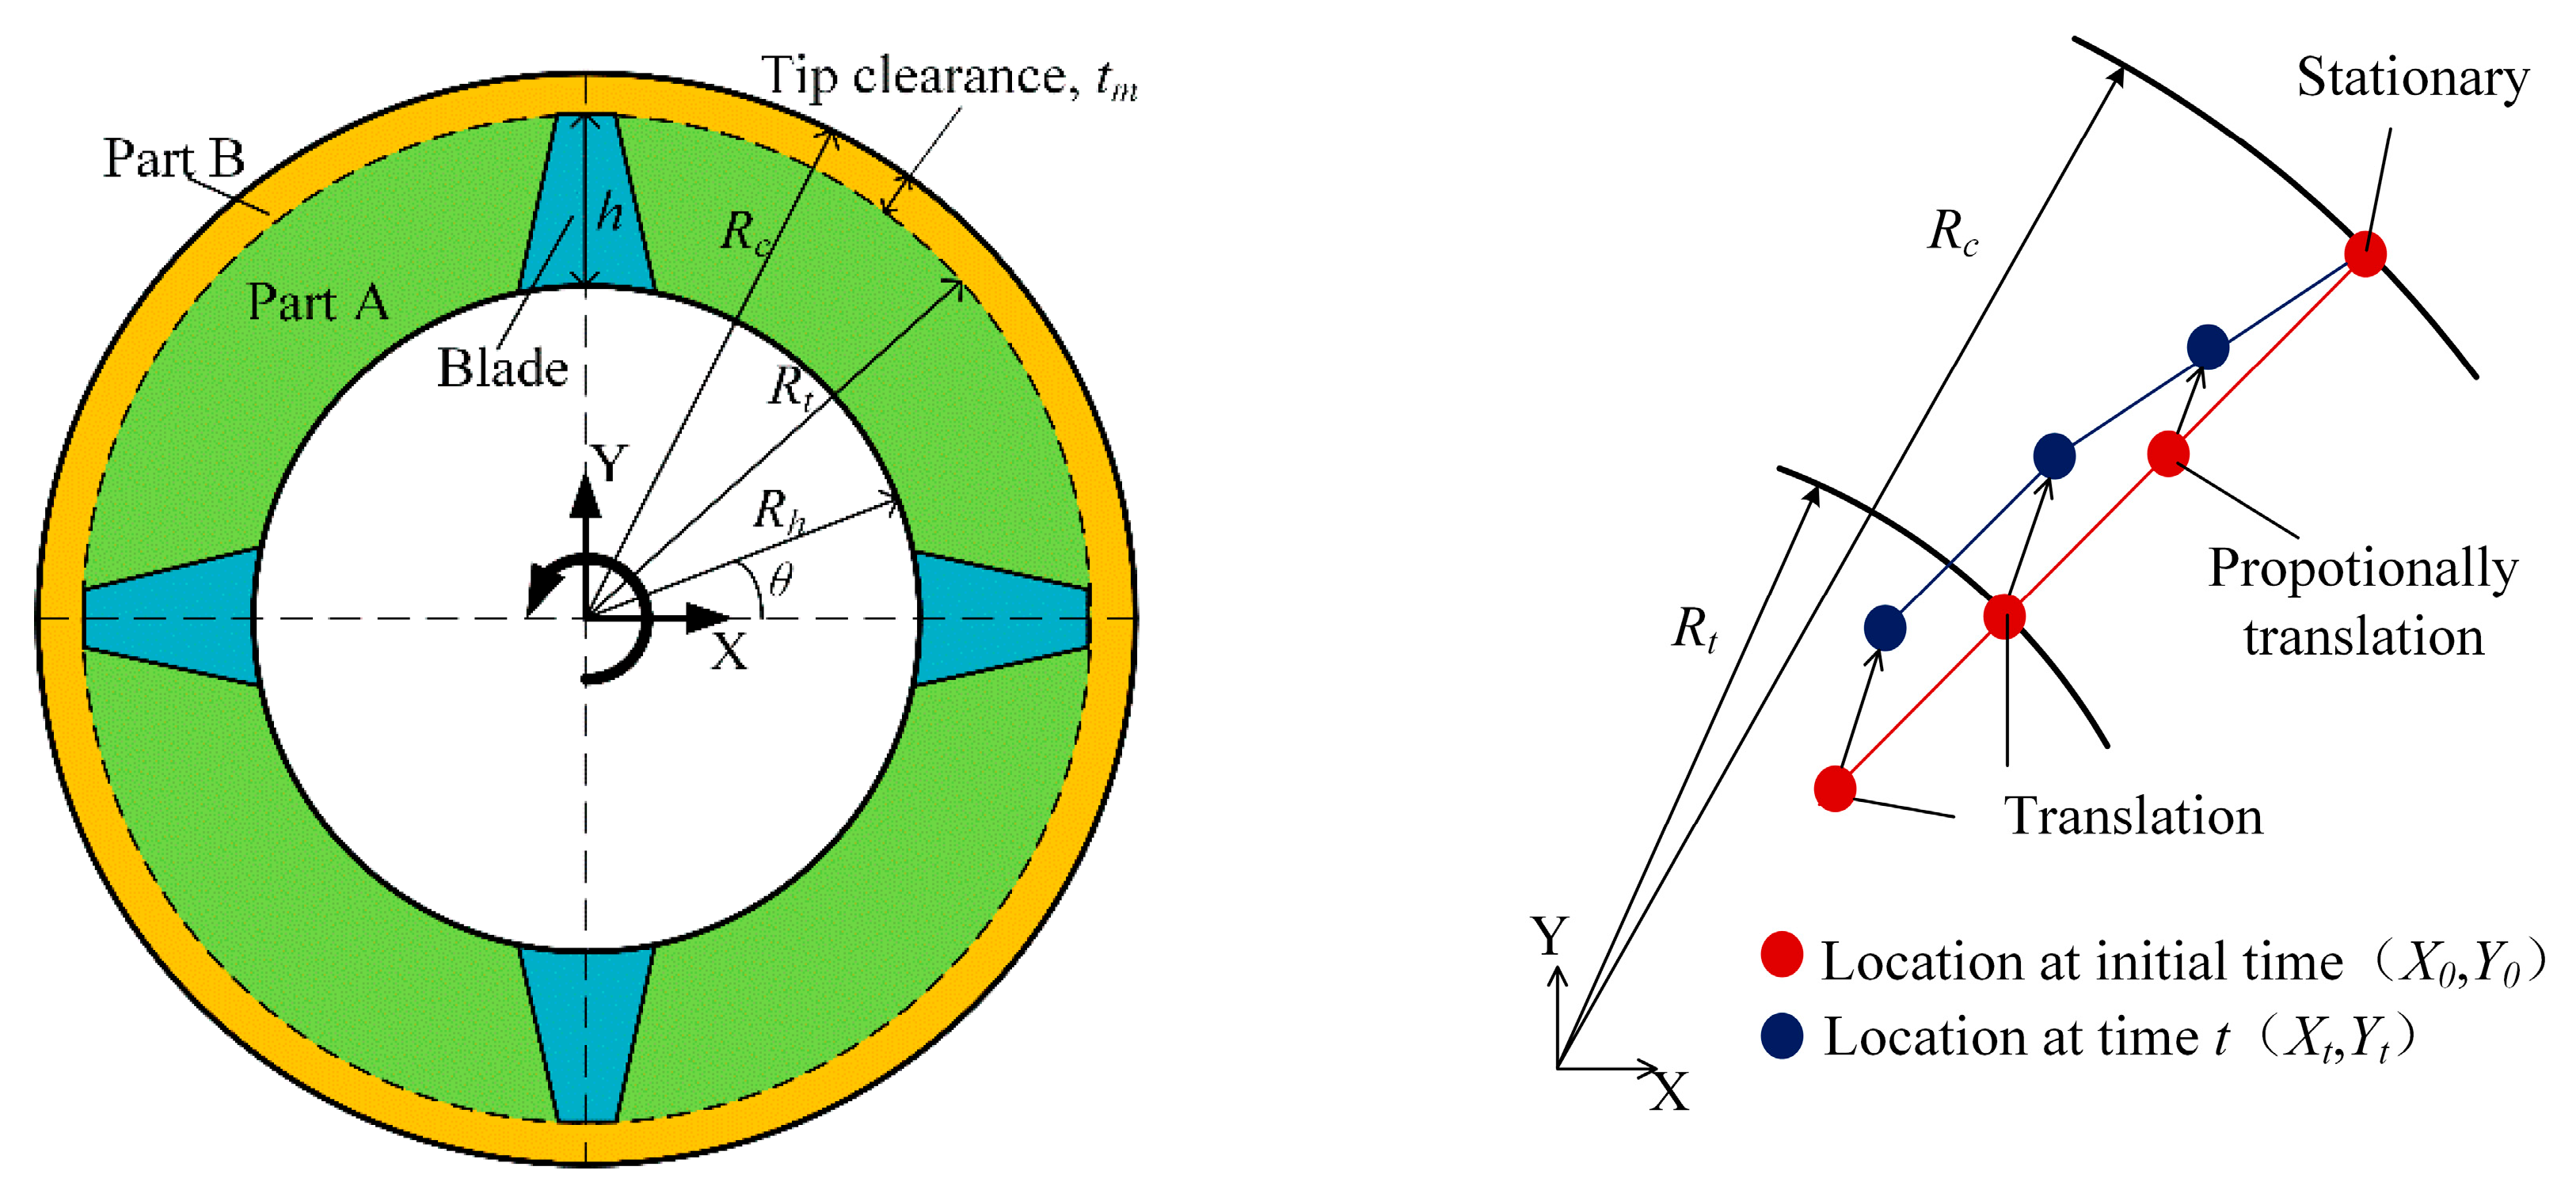
As mentioned above, the model we used was one of a concentric unshrouded rotor. Therefore, to realize the specific rotor motion, a mesh deformation method [25], which can dynamically control the movement of the mesh nodes, was needed. It should be noted that the mesh quality, especially for grids of boundary layers, is likely to become worse during the mesh deformation procedure. Moreover, compared to the seal model in Li et al. [23], the unshrouded turbine model was more complicated. Hence, to guarantee the mesh quality, an improved mesh deformation method that could precisely set specific locations of every node at every moment was proposed. Figure 5 presents the two partitions of the cross-section and the illustration of the node movement.
For the nodes in part A (green area, Rh < R0 < Rt), the specific locations of the nodes at the time t (Xt, Yt) could be described using:
and for the nodes in part B (yellow area, Rt < R0 < Rc), the specific locations could be described using:
where (X0, Y0) depict the locations of nodes at the initial time, R0 can be calculated using , and (x, y) can be obtained via Equations (3) and (4). Additionally, the mesh deformation method could also be used to alter the mean tip clearance without building a new model, which dramatically improved the computing efficiency. For an unshrouded turbine with a new mean tip clearance , the specific locations of the nodes in part A (green area, Rh < R0 < Rt) could be described using:
where is the correction factor of the vibration amplitude. The specific locations of the nodes in part B (yellow area, Rt < R0 < Rc) could be described using:
where the first items to the right of the equal sign are the new coordinates of nodes in this part caused by the mean tip clearance change.
2.5. Rotordynamic Coefficients Solution
Based on the small motion theory, Childs [24] presented a response-force model, as defined in Equation (9):
The rotordynamic coefficients Kij and Cij, including the direct stiffness (Kxx, Kyy), the cross coupling stiffness (Kxy, Kyx), the direct damping (Cxx, Cyy), and the cross coupling damping (Cxy, Cyx), could be calculated using the response forces and the corresponding rotor displacements and velocities. For Kij and Cij, the first subscript (i) represents the direction of the response force and the second one (j) represents the direction of the rotor motion. The response forces in this paper are the excitation forces on the rotor blades caused by the rotor eccentricity, which are also known as the “Thomas–Alford” forces. By using the Fast Fourier Transform (FFT), Equation (9) can be transformed into the frequency domain expression as follows,
where Dij and Gij are the frequency-domain components of the rotor displacement and response forces, respectively. For Dij and Gij, the first subscript (i) represents the excitation direction and the second one (j) represents the direction of response forces.
Then, the corresponding impedances (Hij) could be solved using Equation (11):
Finally, the stiffness and damping coefficients could be solved using Equation (12):
3. Results and Discussion
3.1. Monitored Data and Dynamic Coefficients
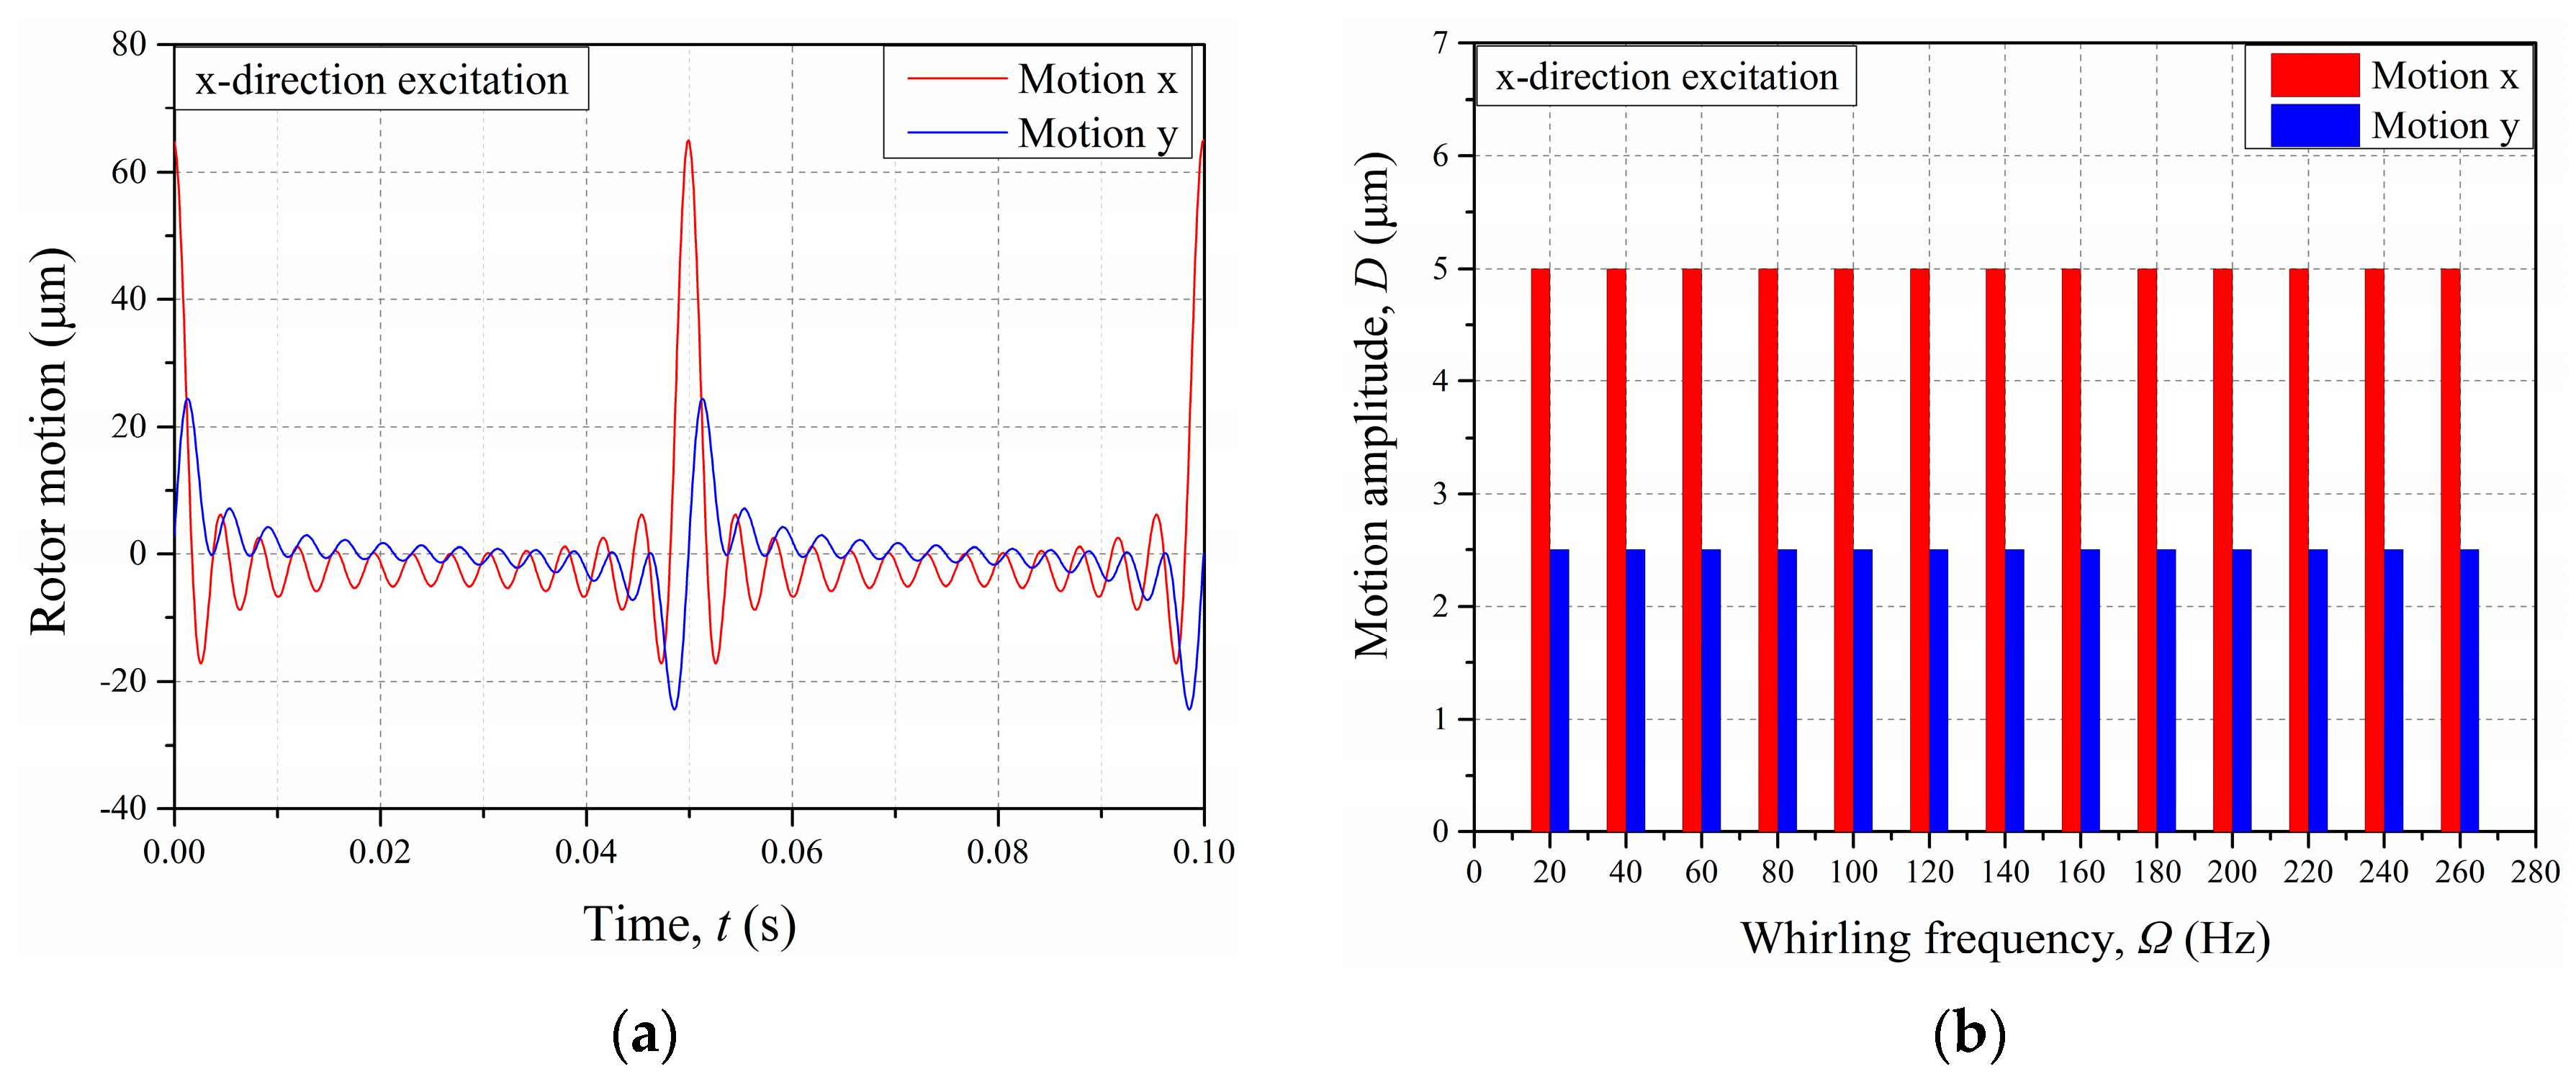
Figure 6 presents the monitored rotor motion data of two cycles in the time domain during the transient calculation process and the corresponding transformed results in the frequency domain with the x-direction excitation. According to the results in the frequency domain, the motion amplitude in the x-direction of each frequency was 5 μm and that in the y-direction was 2.5 μm, which were exactly the target values in Table 3. This indicates that the rotor movement followed Equation (3) as expected.
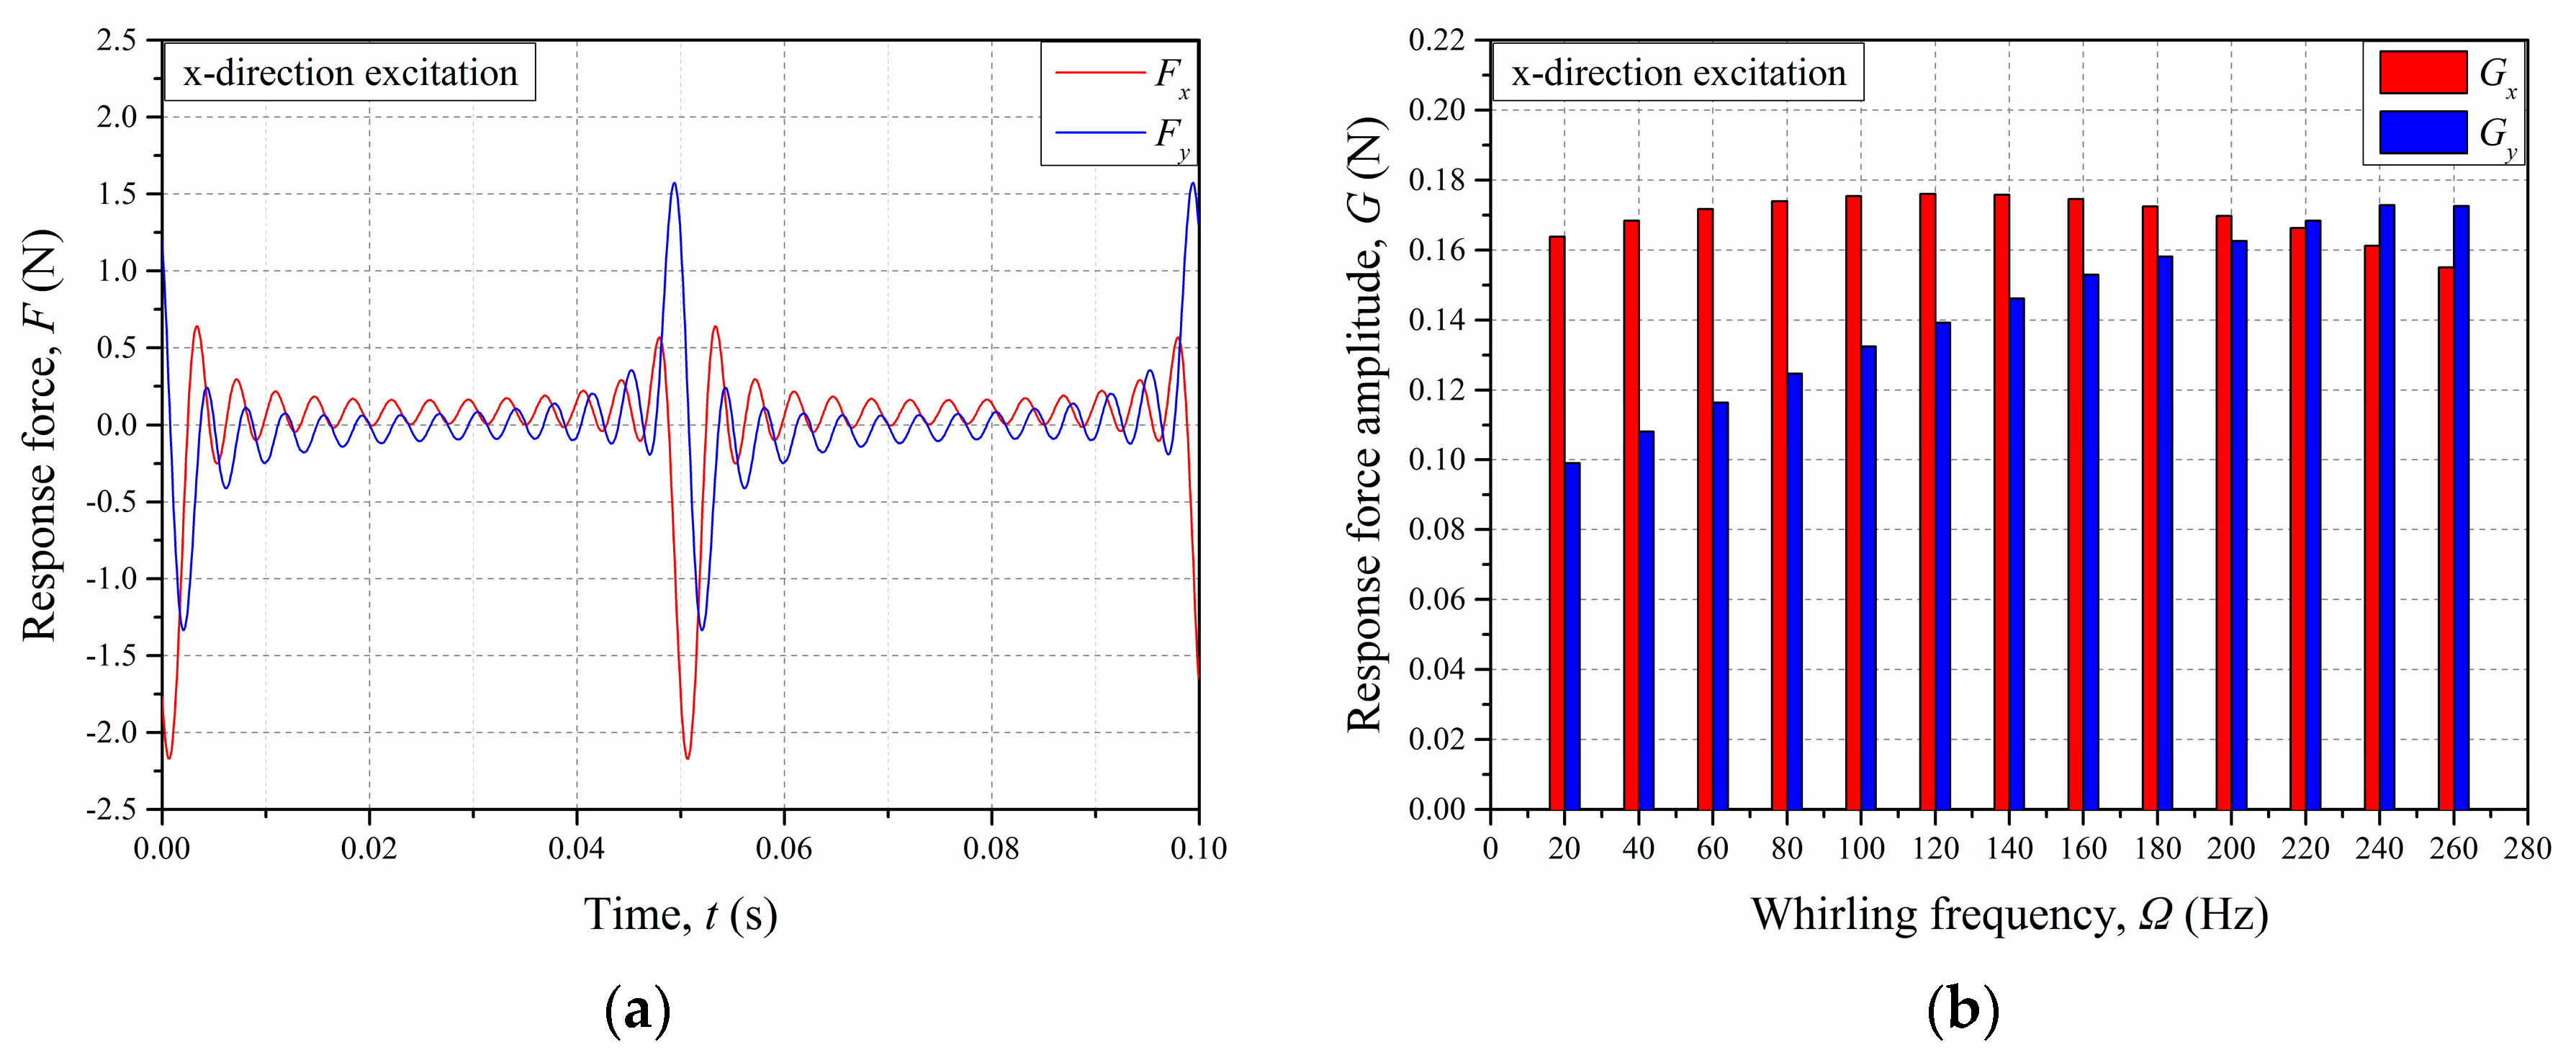
Figure 7 shows the response forces in the time and frequency domains with the x-direction excitation. It is shown that the direct response force (Gx) increased first and decreased afterward with the frequency in a small range, where the frequency of the maximum direct force amplitude was about 100–120 Hz. The cross-response force (Gy) increased with frequency in a relatively larger range, where the maximum amplitude appeared at a frequency of 260 Hz. The variations of the direct and cross-response forces with the whirling frequency indicates that the rotordynamic coefficients were dependent on the whirling frequency.
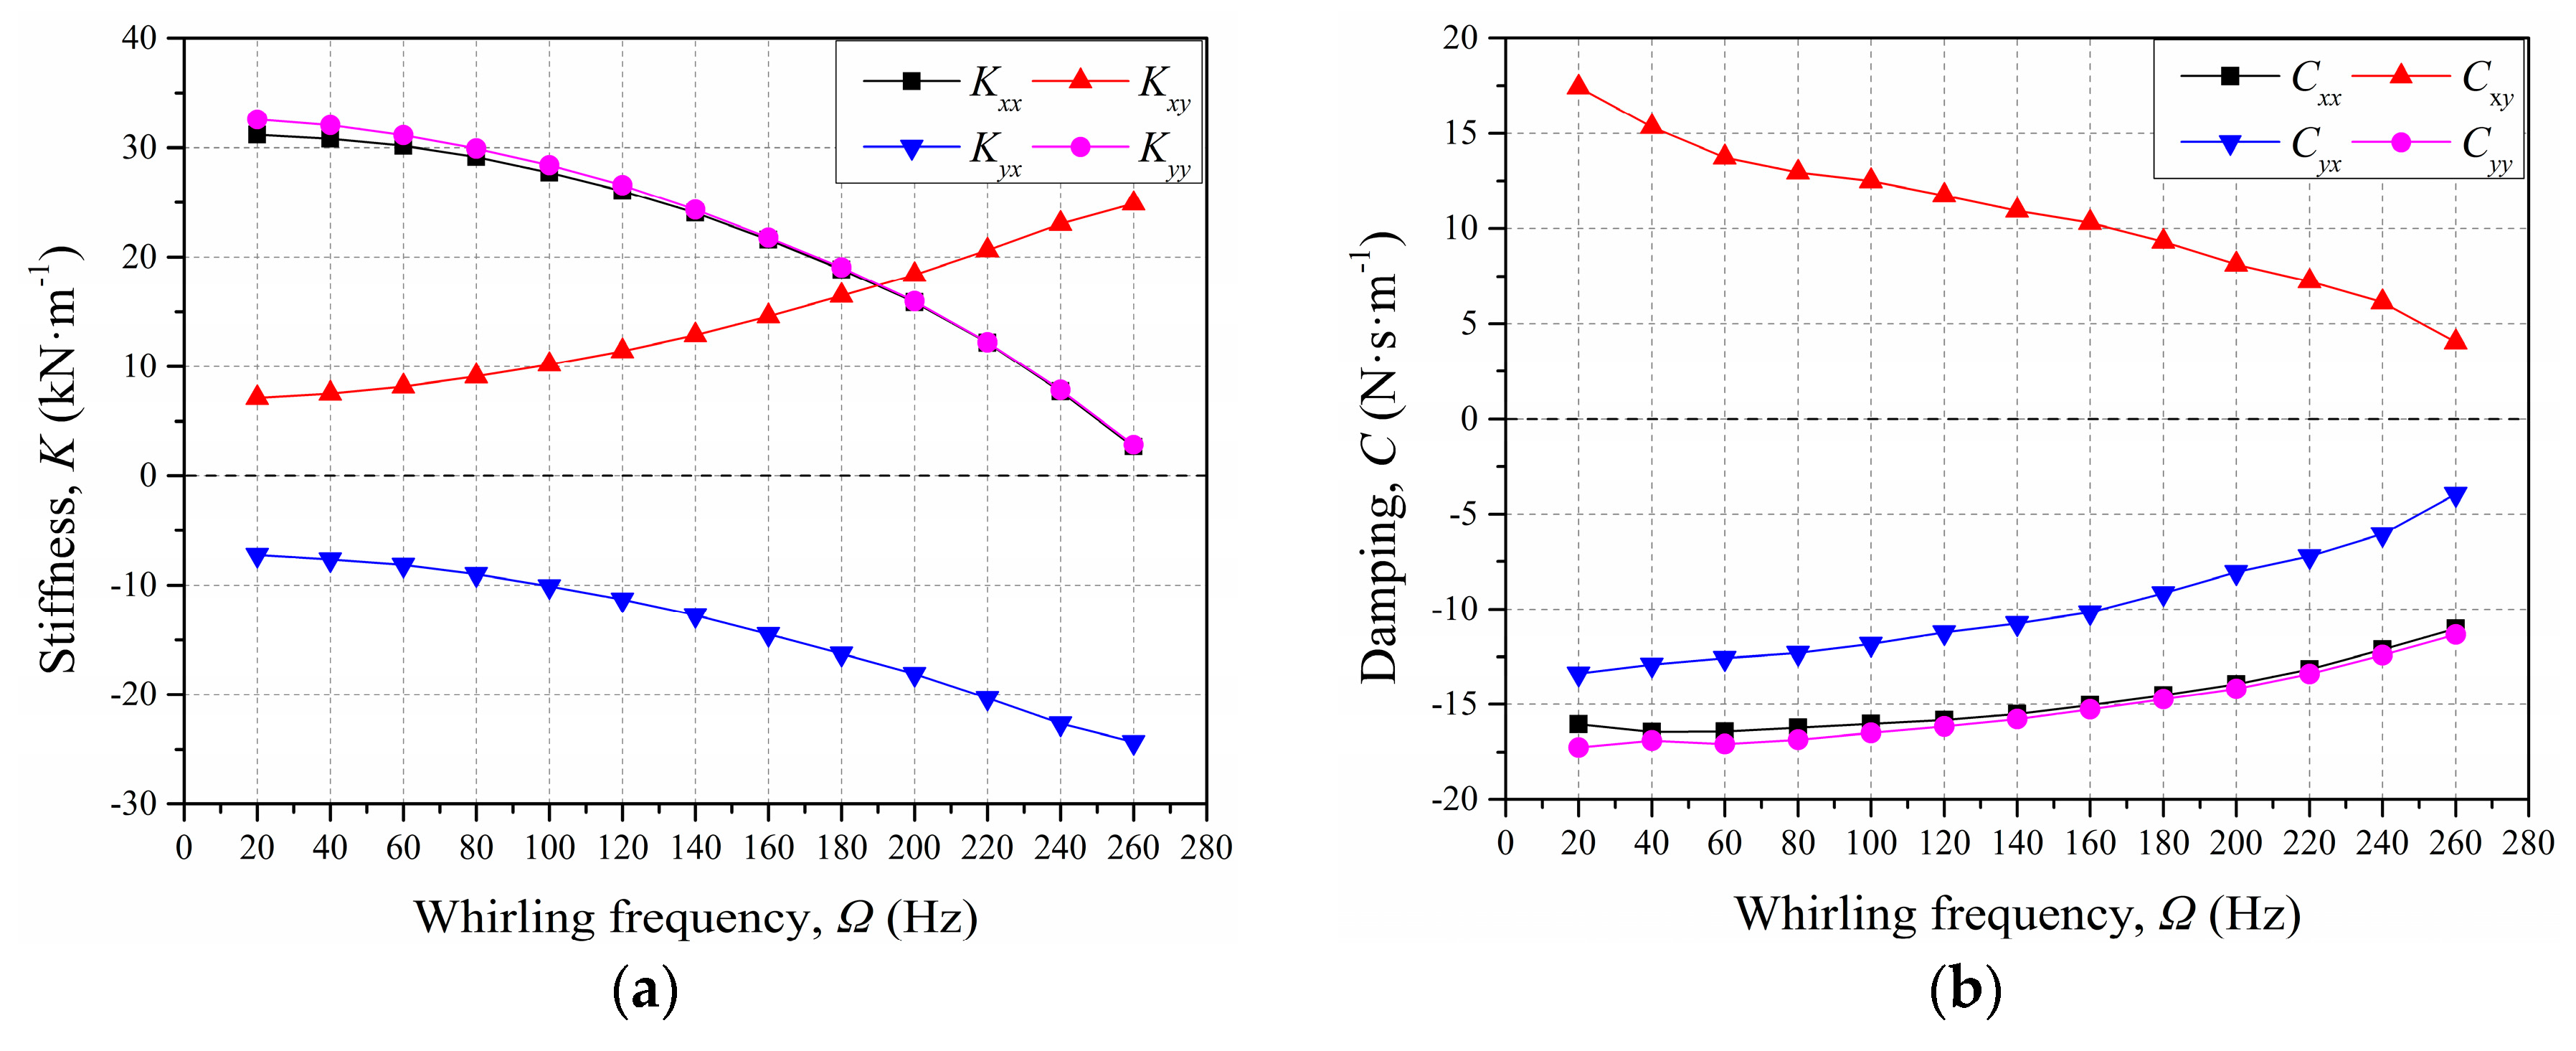
Using the monitored data above, the rotordynamic coefficients were solved. Figure 8 presents the variation of the rotordynamic coefficients with frequency. It was shown that the rotordynamic coefficients were dependent on frequency. Moreover, the direct stiffness and damping coefficients were the same (Kxx = Kyy, Cxx = Cyy) and the cross-coefficients were equal in magnitude with opposite sign (Kxy = −Kyx, Cxy = −Cyx). The direct stiffness coefficients Kxx and Kyy were positive at all selected frequencies, which indicates the direct force contributions in the tip clearance excitation forces. Thomas and Alford did not predict the direct forces in their model; instead, these forces were confirmed in later experiments. It also should be noted that since the direct stiffness coefficients decreased with the frequency, the direct stiffness might be zero at a frequency around 270 Hz. Moreover, the cross-stiffness coefficient Kxy was positive at all frequencies and it increased with the frequency, which indicates that the tip clearance excitation forces could promote forward rotor whirl. Compared to the stiffness coefficients, the damping coefficients were quite small, which indicates that there was no damping effect. Hence, the damping coefficients are not discussed in the following sections.
3.2. Effects of the Operating Conditions
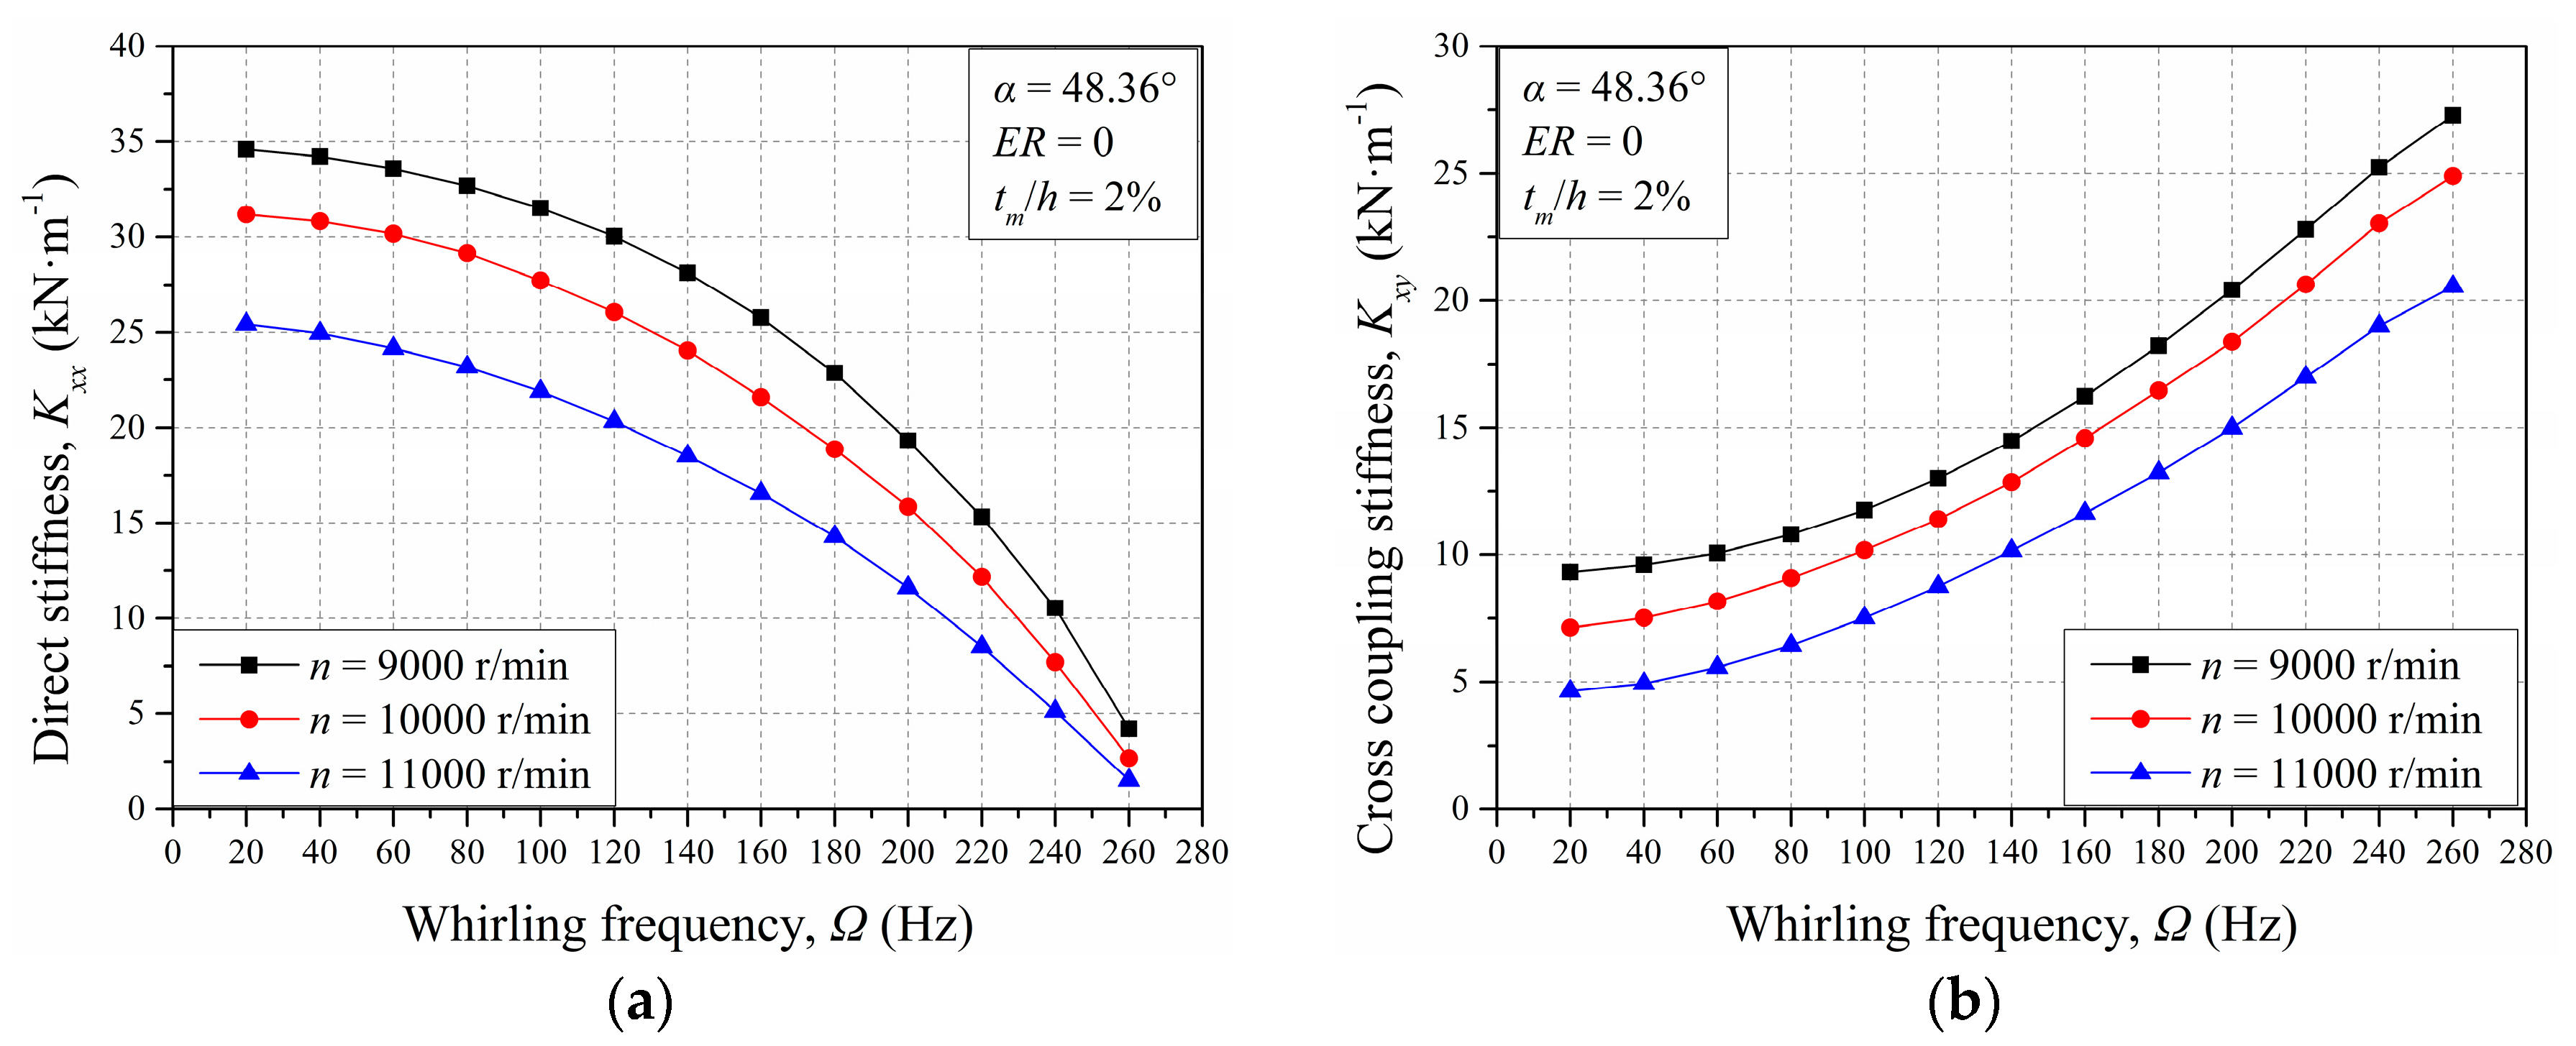
In this section, the effects of the operating conditions on the stiffness coefficients are presented. Figure 9 shows the variation of stiffness coefficients with frequency at different rotational speeds. Both the direct and cross-coupling stiffness coefficients decreased with the rotational speed, which indicates that the increase of rotational speed caused a decrease of the tip clearance excitation effect. This was because the torque on the rotor decreased with increasing rotational speed and hence caused a decrease in the response forces in accordance with Equation (1). Moreover, the direct stiffness coefficients at lower frequencies were more easily affected compared to the results at high frequencies, while the decreases of the cross-coupling stiffness coefficients appeared independent of the frequency.
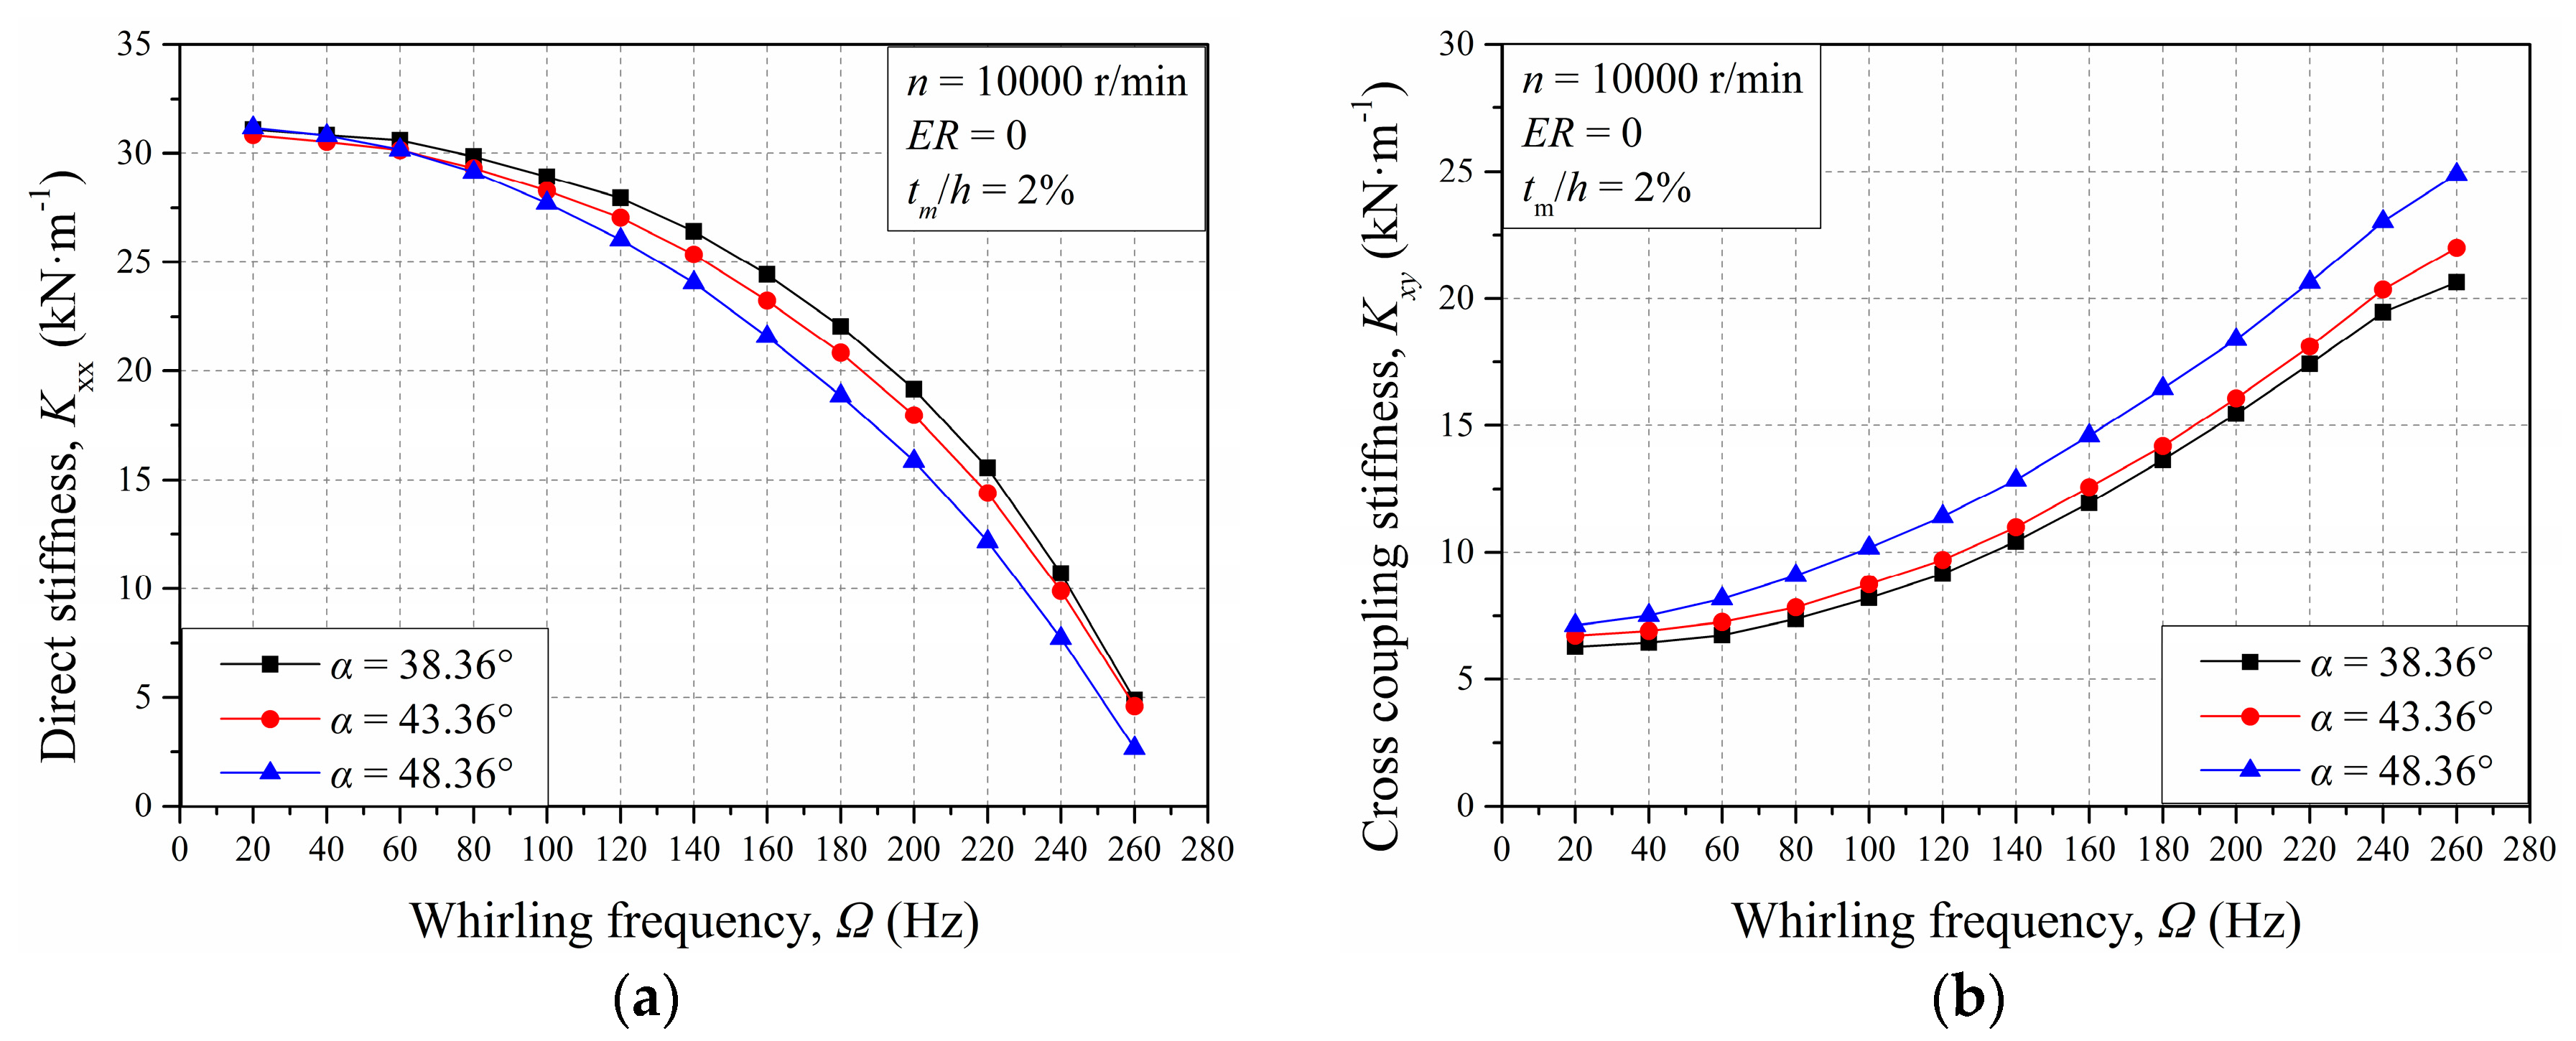
Figure 10 shows the effects of the inlet flow angle on the stiffness coefficients. It was shown that a higher inlet flow angle led to lower direct stiffness coefficients and higher cross-coupling stiffness coefficients. This was because changing the inlet flow angle only caused a slight change in the blade efficiency and had little impact on the rotor torque. Hence, the effect of the inlet flow angle was much smaller than that of the rotational speed, which indicates that the tip clearance excitation could not be reduced by altering the inlet flow angle. In addition, the results at lower frequencies showed less dependency on the inlet flow angle.
Figure 11 presents the variation of the stiffness coefficients with frequency with different rotor eccentricities in the y-direction. The eccentricity could be introduced using a mesh deformation. For an unshrouded turbine with a specific rotor eccentric ratio (ER) in the y-direction, the locations of nodes in part A were:
The locations of the nodes in part B were:
According to the results, the eccentricity had little impact on the direct stiffness coefficient, especially for the result at low frequencies. When the rotor eccentric ratio (ER) increased, the direct stiffness coefficient showed an accelerated decreasing trend from ER = 0−0.3 and then a decelerated decreasing trend from ER = 0.3−0.7. For the cross-coupling stiffness coefficients, the results at low frequencies increased with the eccentricity from ER = 0−0.3 and decreased rapidly from ER = 0.3−0.7. However, the results at high frequencies decreased continually with the eccentricity from ER = 0−0.7. These results indicate that the tip clearance excitation effect reduced when the unshrouded turbine rotor was at a high eccentricity.
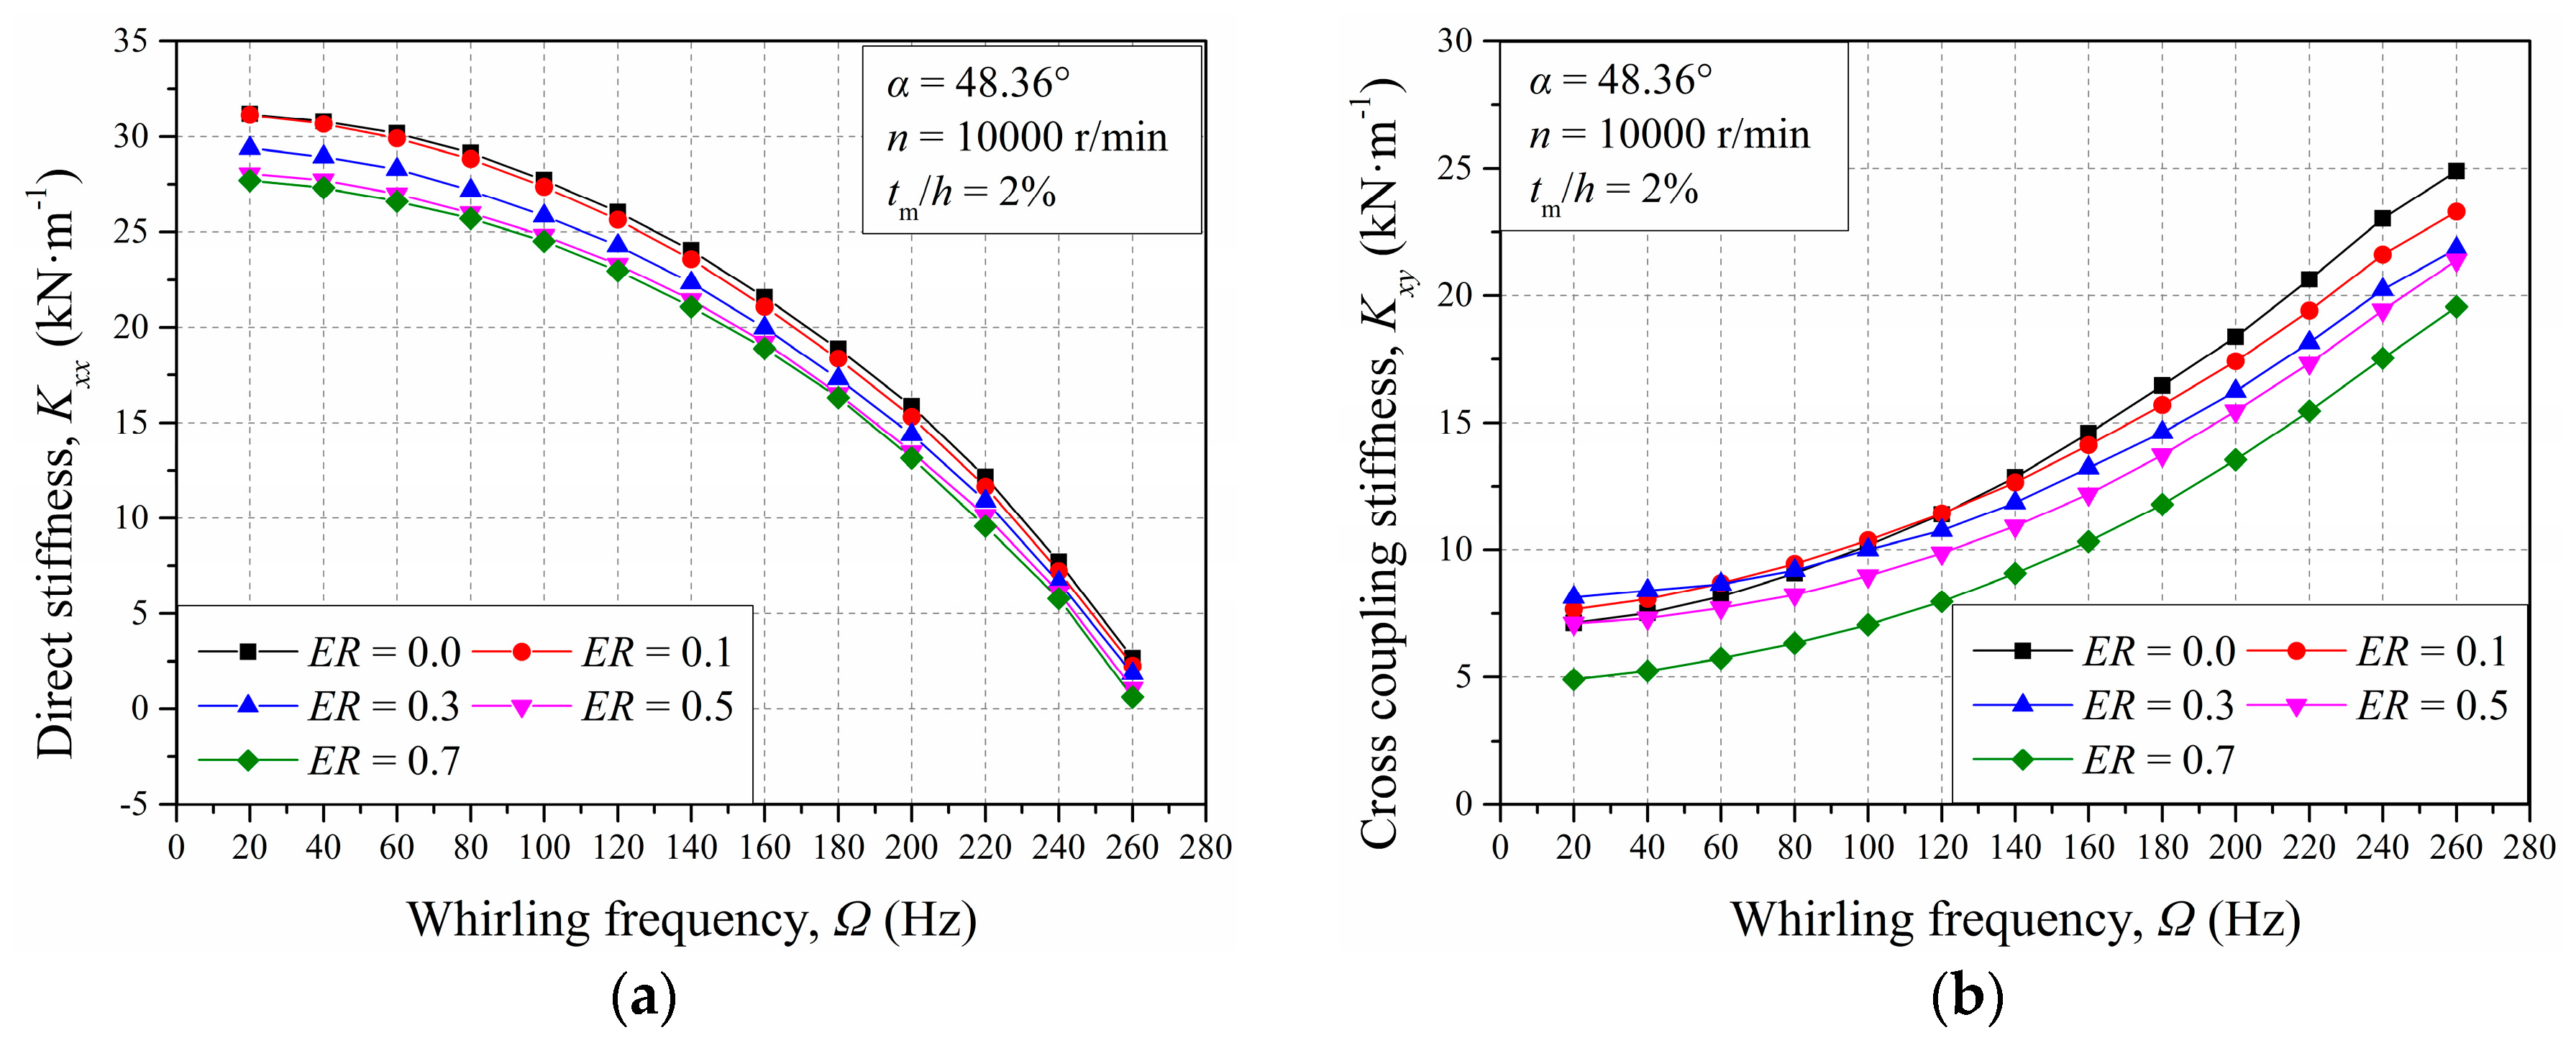
Figure 12 shows the rotordynamic coefficient with different mean tip clearances. It was shown that the direct stiffness at selected frequencies decreased dramatically with the mean tip clearance, especially for the results with tm/h = 2%–3%. In addition, the results at low frequencies were more easily affected by the mean tip clearance than at high frequencies. Moreover, it should be noted that the direct stiffness coefficients became negative at frequencies over 220 Hz for tm/h = 3%−4%. The variation of the cross-coupling stiffness showed a different pattern compared to that of the direct stiffness. When tm/h increased from 1% to 2%, the cross-coupling stiffness coefficients increased for all frequencies, which indicates increased instability forces on the rotor. This was because too small of a tip clearance leads to a change of tip leakage and hence causes a change of torque on the blades. When tm/h continued to increase from 2%–3%, the cross-coupling stiffness at low frequency (Ω < 160 Hz) increased and that at high frequency (Ω > 160 Hz) decreased. Meanwhile, the dependency of the cross-coupling stiffness with the whirling frequency reduced a lot. As tm/h increased further from 3% to 4%, the cross-coupling stiffness decreased for all frequencies. Therefore, when the mean tip clearance was too small (tm/h = 1%), reducing the tip clearance excitation forces by increasing the mean tip clearance may not be feasible. However, when the mean tip clearance was relatively large (tm/h = 3%), increasing the mean tip clearance would be a useful way to reduce the instability forces caused by a fluid.
3.3. Static Pressure Distributions
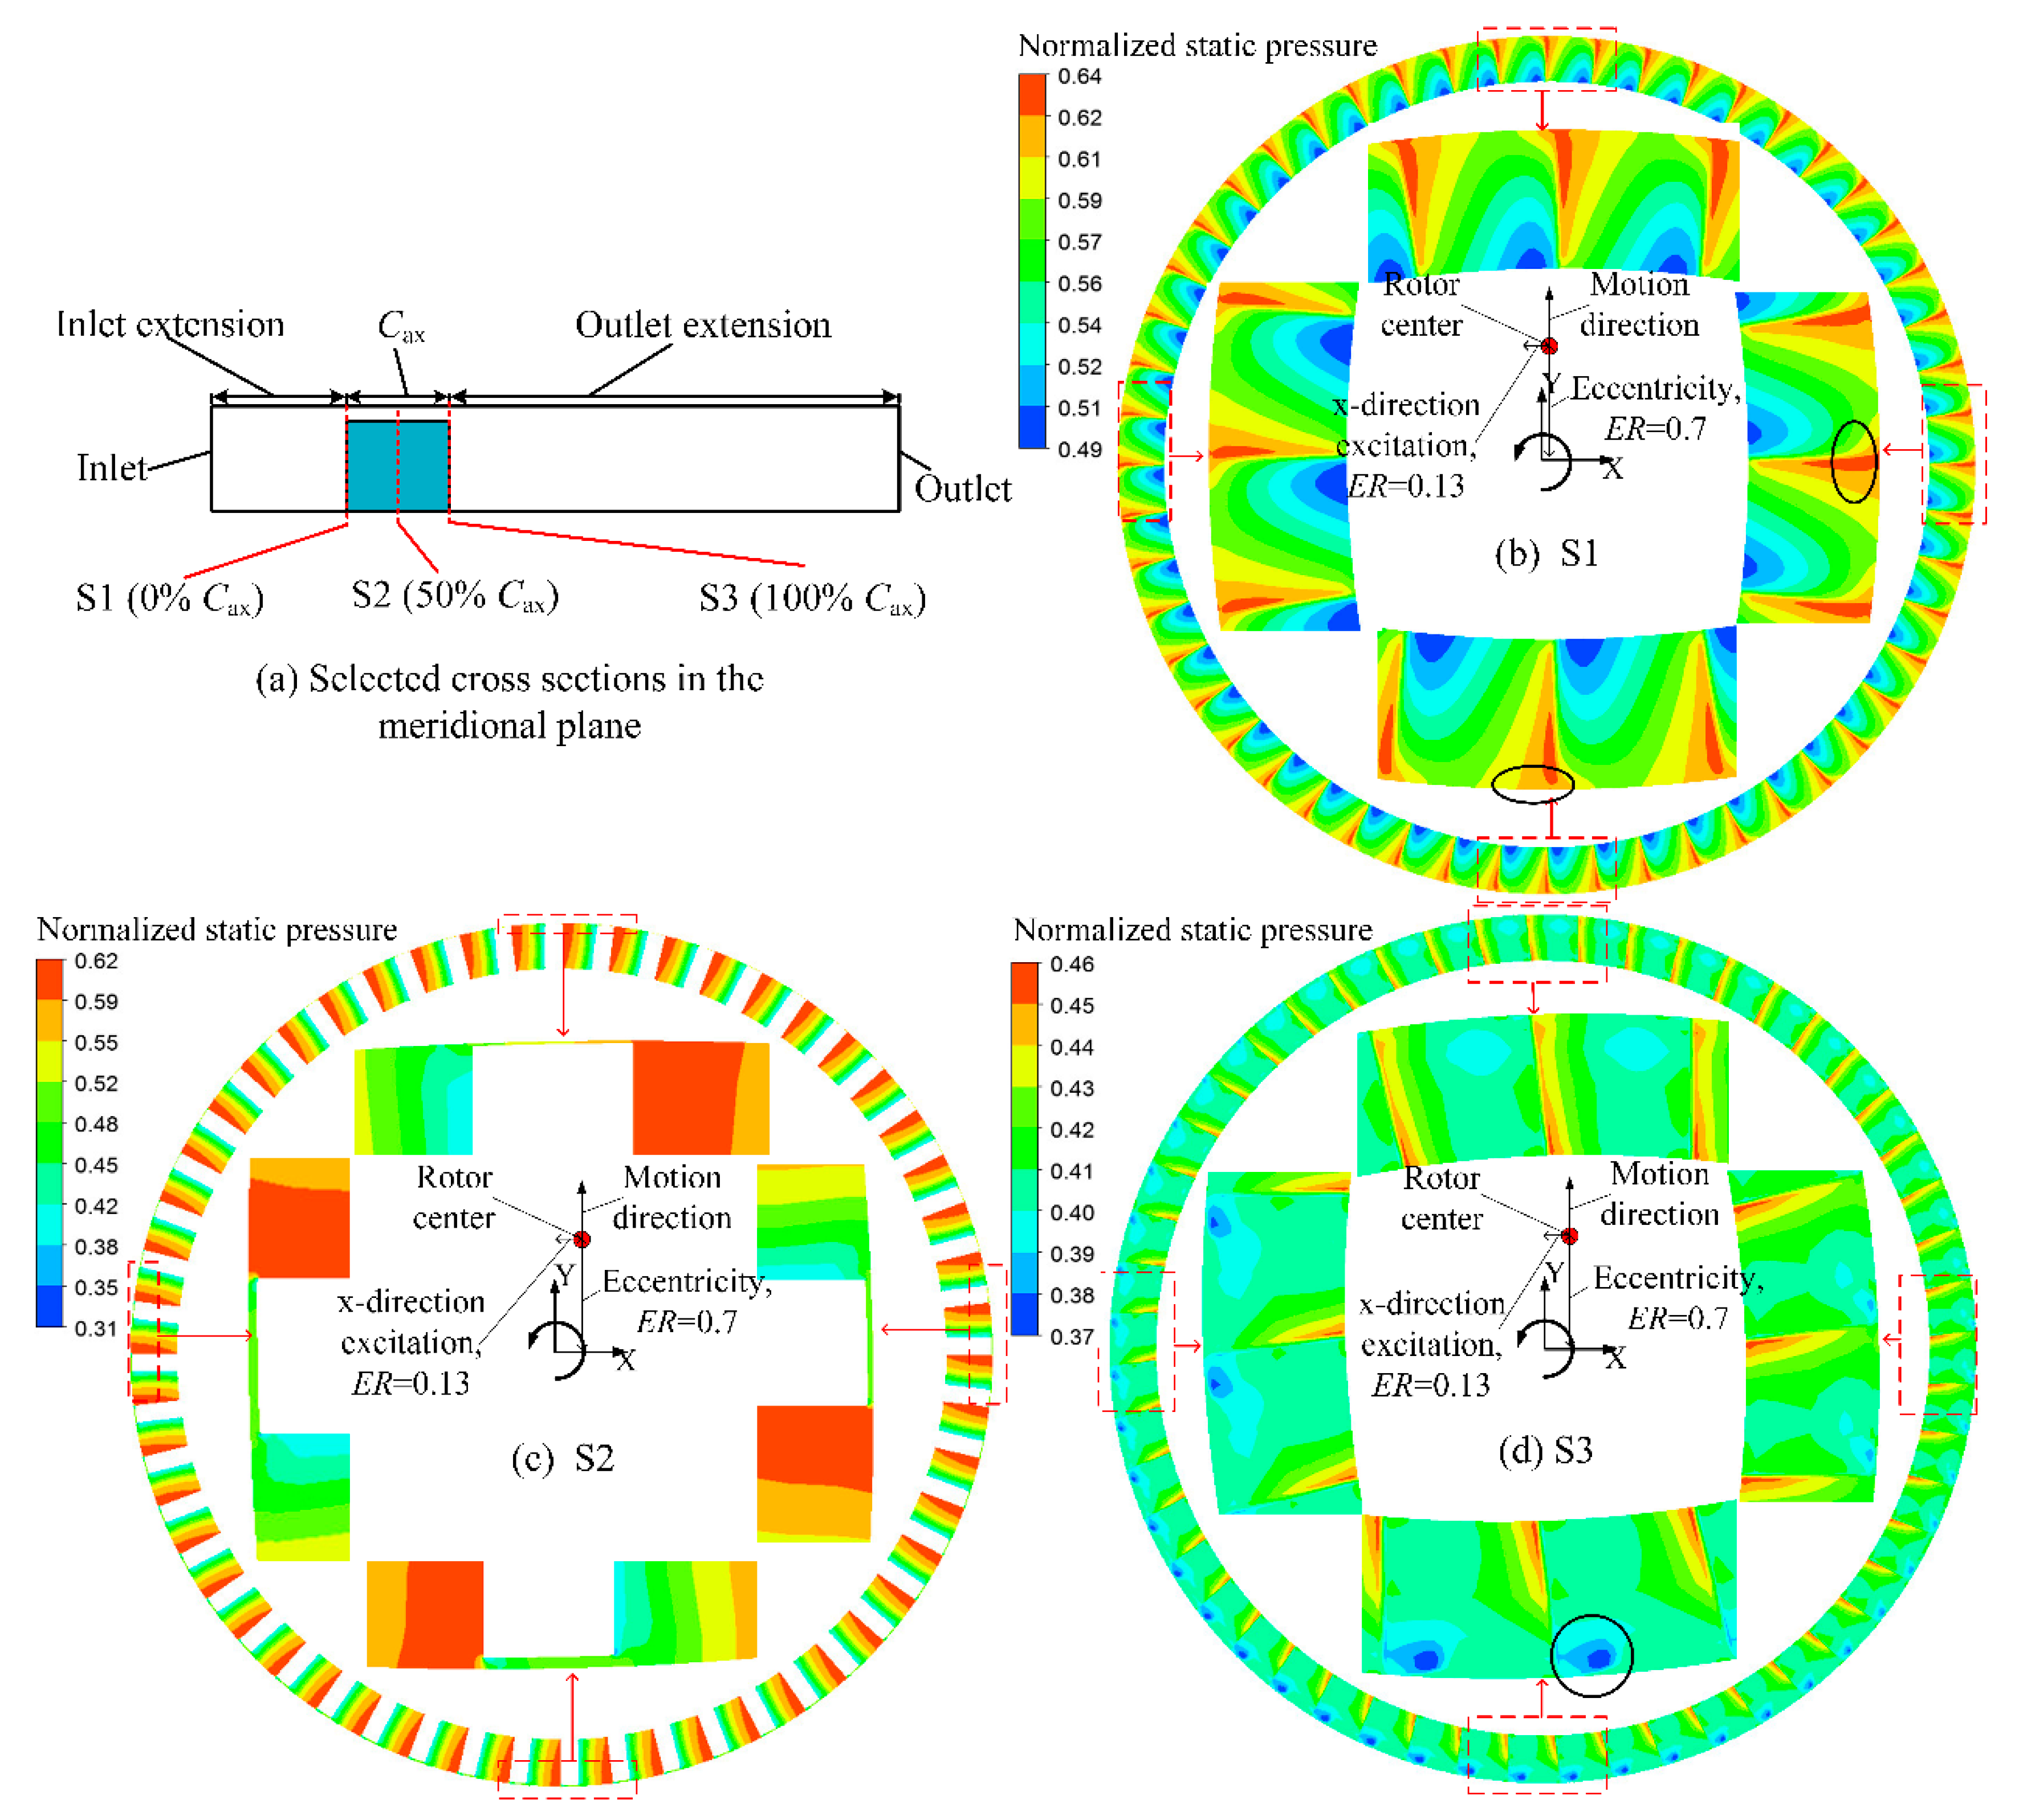
To better understand the flow characteristics in this turbine and the cause of the tip clearance excitation forces, the cross-sections are illustrated in Figure 13a, while Figure 13b–d shows the normalized static pressure contours on the selected cross-sections. At this moment, the rotor displacement in the x-direction caused by the excitation was at the maximum (x = 65 μm, ER = 0.13, shown in Figure 6a) and that in the y-direction was about 350 μm (ER = 0.7) due to the rotor eccentricity. Meanwhile, the rotor was moving in the positive y-direction.
According to Figure 13b, the eccentricity had an impact on the pressure distributions of upstream flow, which validates the hypothesis in Song and Martinez-Sanchez [8]. The static pressure at the smaller tip gap was relatively higher than that at the larger tip gap when comparing the result on the upper and right surfaces with that on the lower and left surfaces. According to Figure 13c, a larger tip gap led to a larger tip leakage flow, and therefore caused a decrease of static pressure at the tip gap. Due to the circumferentially uneven upstream flow and tip leakage flow, the torque on the blade was also circumferentially non-uniform, and hence caused the tip clearance excitation forces. According to Figure 13d, at the larger tip gap region, a low-pressure area caused by a larger tip leakage flow can be seen.
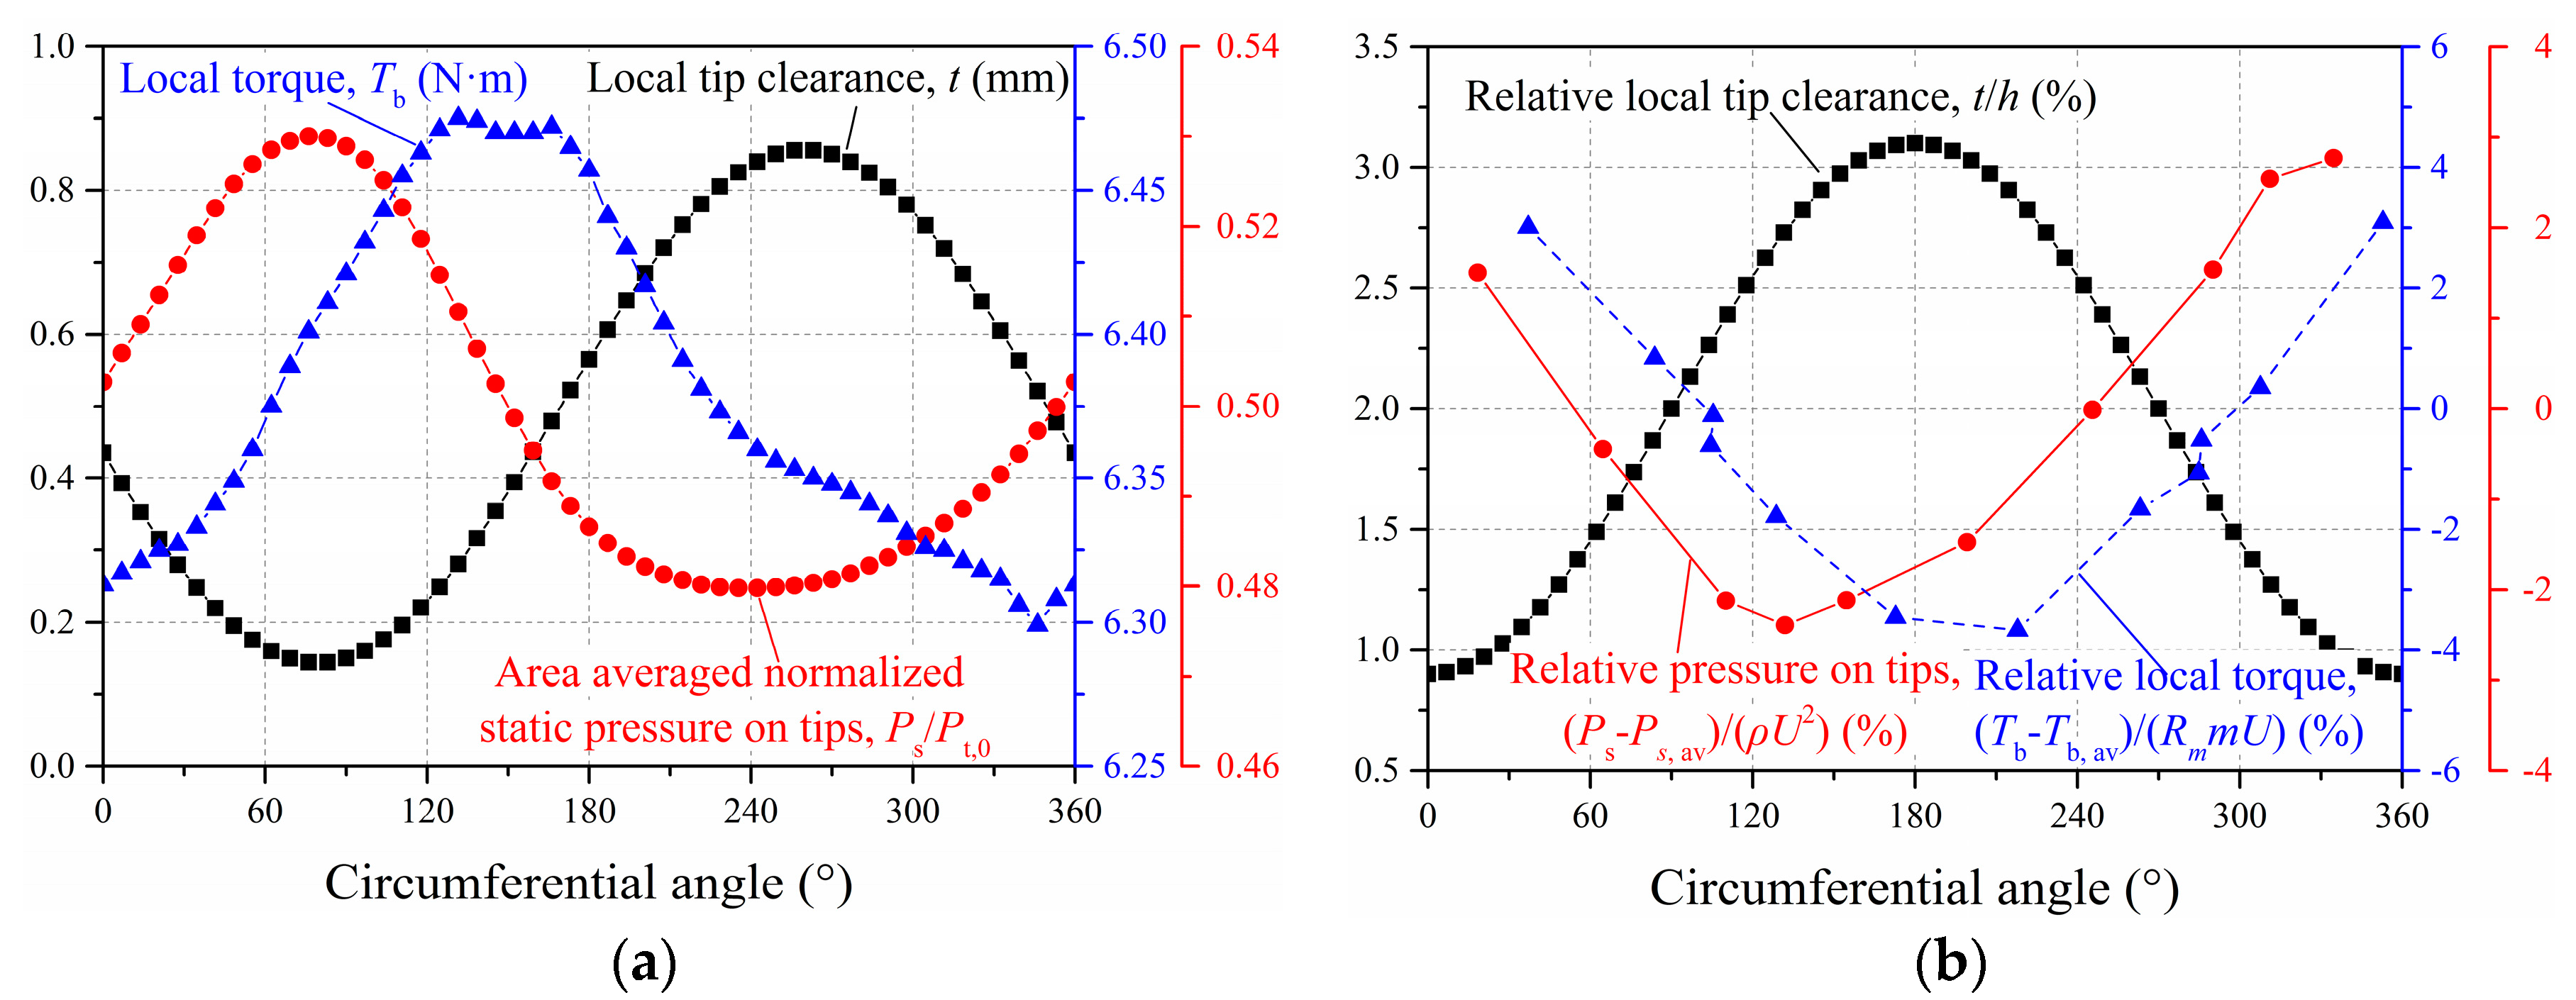
Figure 14 shows the distributions of selected variables of numerical results (left) and experimental results in Song [9] (right). In the right figure, ρ is the density, m is the mass flow rate, U is the linear velocity at the average radius, and the subscript av indicates circumferential averaged value. Comparing these two figures showing the phase differences between the local torque and the local tip clearance, the local pressure and the local tip clearance were quite similar. According to the numerical results, the static pressure on the tip basically decreased with the local tip clearance. However, it should be noted that the phase difference between the local tip clearance and the local torque on the blade was not 180°, but instead approximately 120°, which indicates that the lowest local tip clearance could not lead to the highest local torque on the blade. Based on this, a positive direct stiffness, which indicates the direct force contribution in the tip excitation forces, was generated.
4. Conclusions
A three-dimensional CFD numerical method, along with an improved mesh deformation technique based on the transient analysis and multi-frequency elliptical orbit whirling model, was proposed to investigate the tip clearance excitation forces in an unshrouded turbine. The tip clearance excitation forces were represented as the rotordynamic coefficients (stiffness and damping coefficients) in this paper. The effects of several variables, including the whirling frequency, rotational speed, inlet flow angle, eccentricity, and the mean tip clearance, on the rotordynamic coefficients and aerodynamic performance were analyzed in detail. The conclusions are as follows:
(1) Positive direct stiffness coefficients confirmed the existence of a direct force contribution in the tip clearance excitation forces. The damping effects were found to be quite small and could be ignored. Both the stiffness and damping showed a dependency on the rotor whirling frequency. Specifically, the direct stiffness increased with the frequency, while the cross-coupling stiffness decreased with the whirling frequency.
(2) The increase of the rotational speed caused a considerable decrease of the direct stiffness and cross-coupling stiffness due that the torque on the rotor decreasing with the rotational speed, which indicates a decreasing tip clearance excitation effect. The increase of the mean tip clearance led to a decreasing direct stiffness and a complicated change of the cross-coupling stiffness. For turbines with a small mean tip clearance (tm/h = 1%), increasing the mean tip clearance caused the increase of cross-coupling stiffness, which led to rotor instability. For a turbine with a higher mean tip clearance (tm/h = 3%), the cross-coupling stiffness decreased with the increase of the mean tip clearance, which enhanced the rotor stability. The effects of the inlet flow angle and eccentricity on the rotordynamic coefficients were relatively smaller.
(3) The rotor eccentricity caused a pressure redistribution of both upstream and downstream flow. A higher eccentricity and higher mean tip clearance resulted in a greater nonuniformity of the circumferential static pressure distribution. The characteristics of leakage flow changed with the local tip clearance. The phase difference between the local tip clearance and the local torque on the blade was about 120°, which led to the direct force contribution.
Author Contributions
Conceptualization, Y.P. and Q.Y.; methodology, Y.P.; software, G.H.; validation, J.G.; formal analysis, Y.P.; investigation, Y.P. and G.H.; resources, Y.P.; data curation, J.G.; writing—original draft preparation, Y.P. and Q.Y.; writing—review and editing, Y.P.; visualization, G.H.; supervision, P.L. and G.Z.; project administration, Q.Y.; funding acquisition, Q.Y. All authors have read and agreed to the published version of the manuscript.
Funding
This research was funded by the National Natural Science Foundation of China (grant number 11872289) and the Key Project of Natural Science Foundation of Xi’an Jiao Tong University (grant number ZRZD2017025).
Conflicts of Interest
The authors declare no conflict of interest.
References
- Thomas, H.J. Unstable Oscillations of turbine Rotors Due to Steam Leakage in the Clearance of the sealing Glands and the Bucket. Bull. Sci. AJM 1958, 71, 1039–1063. [Google Scholar]
- Alford, J.S. Protecting turbomachinery from self-excited rotor whirl. J. Eng. Power 1965, 87, 333–343. [Google Scholar] [CrossRef]
- Urlichs, K. Clearance Flow-Generated Transverse Forces at the Rotors of Thermal Turbomachines; National Aeronautics and Space Administration: Washington, DC, USA, 1983.
- Wohlrab, R. Experimental Determination of Gap Flow Conditioned Forces at the Rotors of Thermal Turbomachines. NASA TM-77293. Ph.D. Thesis, Munich Technical University, München, Germany, 1975. [Google Scholar]
- Martinez-Sanchez, M.; Jaroux, B.; Song, S.J.; Yoo, S. Measurement of Turbine Blade-Tip Rotordynamic Excitation Forces. J. Turbomach. 1995, 117, 384–392. [Google Scholar] [CrossRef]
- Vance, J.M.; Laudadio, F.J. Experimental measurement of Alford’s force in axial flow turbomachinery. J. Eng. Gas Turbines Power 1984, 106, 585–590. [Google Scholar] [CrossRef]
- Storace, A.F.; Wisler, D.C.; Shin, H.-W.; Beacher, B.F.; Ehrich, F.F.; Spakovszky, Z.S.; Martinez-Sanchez, M.; Song, S.J. Unsteady Flow and Whirl-Inducing Forces in Axial-Flow Compressors: Part I—Experiment. J. Turbomach. 2001, 123, 433–445. [Google Scholar] [CrossRef] [Green Version]
- Song, S.J. Martinez-Sanchez, M. Rotordynamic forces due to turbine tip leakage: Part I—Blade scale effects. J. Turbomach. 1997, 119, 695–703. [Google Scholar] [CrossRef]
- Song, S.J.; Martinez-Sanchez, M. Rotordynamic forces due to turbine tip leakage: Part II—Radius scale effects and experimental verification. J. Turbomach. 1997, 119, 704–713. [Google Scholar] [CrossRef]
- Kanki, H.; Tanitsuji, A. Stability of high pressure turbine under partial admission condition. In Proceedings of the ASME IDET/CIE 2008, New York, NY, USA, 3–6 August 2005; pp. 1123–1128. [Google Scholar]
- Aus der Wiesche, S.; Passmann, M.; Willinger, R. Reduction of Turbine Blade Tip Leakage Losses and Excitation Forces by Passive Tip Injection. In Proceedings of the ASME IMECE 2015, Houston, TX, USA, 13–19 November 2015; p. V001T01A041. [Google Scholar]
- Aus der Wiesche, S.; Passmann, M. Analysis of Steam Turbine Blade Tip Excitation Forces by Means of Computational Fluid Dynamics and Experimental Cascade Results. In Proceedings of the ASME Turbo Expo 2018, Oslo, Norway, 11–15 June 2018. GT2018-75179. [Google Scholar]
- Pugachev, A.O.; Kleinhans, U.; Gaszner, M. Prediction of rotordynamic coefficients for short labyrinth gas seals using computational fluid dynamics. J. Eng. Gas Turbines Power 2012, 134, 062501. [Google Scholar] [CrossRef]
- Li, Z.; Li, J.; Feng, Z. Numerical Investigation on the Leakage and Static Stability Characteristics of Pocket Damper Seals at High Eccentricity Ratios. J. Eng. Gas Turbines Power 2018, 140, 042503. [Google Scholar] [CrossRef]
- Cao, L.H.; Wang, J.X.; Li, P.; Hu, P.F.; Li, Y. Numerical Analysis on Steam Exciting Force Caused by Rotor Eccentricity. Shock Vib. 2017, 2017, 8602965. [Google Scholar] [CrossRef] [Green Version]
- Meng, F.; Zheng, Q.; Gao, J.; Fu, W. Effect of tip clearance on flow field and heat transfer characteristics in a large meridional expansion turbine. Energies 2019, 12, 162. [Google Scholar] [CrossRef] [Green Version]
- Fu, Y.; Chen, F.; Liu, H.; Song, Y. Experimental and Numerical Study of Honeycomb Tip on Suppressing Tip Leakage Flow in Turbine Cascade. In Proceedings of the ASME Turbo Expo 2017, Charlotte, NC, USA, 26–30 June 2017. GT2017-64942. [Google Scholar]
- Mansouri, Z.; Settar, A.; Khamane, H. Computational investigation of heat load and secondary flows near tip region in a transonic turbine rotor with moving shroud. Appl. Therm. Eng. 2018, 136, 141–151. [Google Scholar] [CrossRef]
- Arts, T.; Duboue, J.M.; Rollin, G. Aerothermal performance measurements and analysis of a two-dimensional high turning rotor blade. J. Turbomach. 1998, 120, 494–499. [Google Scholar] [CrossRef]
- Gao, K.; Xie, Y.; Zhang, D. Effects of rotor solidity and leakage flow on the unsteady flow in axial turbine. Appl. Therm. Eng. 2018, 128, 926–939. [Google Scholar] [CrossRef]
- Hushmandi, N.B.; Fridh, J.E.; Fransson, T.H. Unsteady forces of rotor blades in full and partial admission turbines. J. Turbomach. 2011, 133, 041017. [Google Scholar] [CrossRef]
- Kim, J.H.; Lee, S.Y.; Chung, J.T. Numerical analysis of the aerodynamic performance & heat transfer of a transonic turbine with a partial squealer tip. Appl. Therm. Eng. 2019, 152, 878–889. [Google Scholar]
- Li, Z.; Li, J.; Yan, X. Multiple frequencies elliptical whirling orbit model and transient RANS solution approach to rotordynamic coefficients of annual gas seals prediction. J. Vib. Acoust. 2013, 135, 031005. [Google Scholar] [CrossRef]
- Childs, D. Turbomachinery Rotordynamics: Phenomena, Modeling, and Analysis; John Wiley & Sons: Hoboken, NJ, USA, 1993; ISBN 978-0-471-53840-0. [Google Scholar]
- ANSYS. ANSYS CFX-Solver Theory Guide; Release 11.0; ANSYS Inc.: Canonsburg, PA, USA, 2006. [Google Scholar]
Figure 1.
Three-dimensional computational model.

Figure 2.
Mesh details of the computational domain.

Figure 3.
Variations of the mass flow rate and stage torque with element number.

Figure 4.
Comparison of the isentropic Mach number between the numerical results and reference data.
Figure 4.
Comparison of the isentropic Mach number between the numerical results and reference data.

Figure 5.
Illustration of the two partitions and node movement.

Figure 6.
Rotor motion in the time and frequency domains with the x-direction excitation: (a) time domain and (b) frequency domain.
Figure 6.
Rotor motion in the time and frequency domains with the x-direction excitation: (a) time domain and (b) frequency domain.

Figure 7.
Response forces in the time and frequency domains with the x-direction excitation: (a) time domain and (b) frequency domain.
Figure 7.
Response forces in the time and frequency domains with the x-direction excitation: (a) time domain and (b) frequency domain.

Figure 8.
Variation of the rotordynamic coefficients with frequency: (a) stiffness coefficient and (b) damping coefficient.
Figure 8.
Variation of the rotordynamic coefficients with frequency: (a) stiffness coefficient and (b) damping coefficient.

Figure 9.
Variation of stiffness coefficient with rotational speed: (a) direct stiffness coefficient; (b) cross coupling stiffness coefficient.
Figure 9.
Variation of stiffness coefficient with rotational speed: (a) direct stiffness coefficient; (b) cross coupling stiffness coefficient.

Figure 10.
Variation of the rotordynamic coefficient with the inlet flow angle: (a) direct stiffness coefficient and (b) cross-coupling stiffness coefficient.
Figure 10.
Variation of the rotordynamic coefficient with the inlet flow angle: (a) direct stiffness coefficient and (b) cross-coupling stiffness coefficient.

Figure 11.
Variation of the rotordynamic coefficient with rotor eccentricity: (a) direct stiffness coefficient and (b) cross-coupling stiffness coefficient.
Figure 11.
Variation of the rotordynamic coefficient with rotor eccentricity: (a) direct stiffness coefficient and (b) cross-coupling stiffness coefficient.

Figure 12.
Variation of the rotordynamic coefficient with mean tip clearance: (a) direct stiffness coefficient and (b) cross-coupling stiffness coefficient.
Figure 12.
Variation of the rotordynamic coefficient with mean tip clearance: (a) direct stiffness coefficient and (b) cross-coupling stiffness coefficient.

Figure 13.
Illustrations of the selected cross-sections and normalized static pressure contour (Ps/Pt,0) on the cross-sections (ER = 0.7, t = 0.05s, n = 10000 r/min, α = 48.36°, tm/h = 2%, x-direction excitation).
Figure 13.
Illustrations of the selected cross-sections and normalized static pressure contour (Ps/Pt,0) on the cross-sections (ER = 0.7, t = 0.05s, n = 10000 r/min, α = 48.36°, tm/h = 2%, x-direction excitation).

Figure 14.
Distributions of selected variables: (a) numerical result under ER = 0.7, t = 0.05s, n = 10,000 r/min, α = 48.36°, tm/h = 2%, and x-direction excitation, and (b) experimental results in Song [9].
Figure 14.
Distributions of selected variables: (a) numerical result under ER = 0.7, t = 0.05s, n = 10,000 r/min, α = 48.36°, tm/h = 2%, and x-direction excitation, and (b) experimental results in Song [9].


Table 1.
Blade geometrical parameters.
| Parameters | Units | Values |
|---|---|---|
| Blade number | - | 52 |
| Average radius, Rm | mm | 225.44 |
| Axial chord, Cax | mm | 35.91 |
| Pitch | mm | 27.24 |
| Blade height, h | mm | 24.97 |
| Stagger angle | ° | 58.38 |
| Inlet flow angle, α | ° | 48.36 |
| Normalized mean tip clearance, tm/h | % | 2.0 |
Table 2.
Details of the boundary conditions.
| Parameters | Units | Values |
|---|---|---|
| Solution type | - | Transient |
| Working fluid | - | Air ideal gas |
| Inlet total pressure, Pt,0 | kPa | 243.5 |
| Inlet total temperature | K | 420 |
| Outlet static pressure, Ps,1 | kPa | 101.325 |
| Turbulence intensity | % | 4 |
| Wall temperature | K | 302 |
| Rotational speed, n | r/min | 10000 |
| Eccentric ratio (y-direction), e/tm | - | 0.1, 0.3, 0.5, 0.7 |
| Timestep | s | 0.0001 |
Table 3.
Details of rotor motion parameters.
| Parameters | Units | Values |
|---|---|---|
| Vibration amplitudes, a | mm | 0.005 |
| Vibration amplitudes, b | mm | 0.0025 |
| Number of frequency, N | - | 13 |
| Frequency, Ωi | Hz | 20, 40, …, 240, 260 |
© 2020 by the authors. Licensee MDPI, Basel, Switzerland. This article is an open access article distributed under the terms and conditions of the Creative Commons Attribution (CC BY) license (http://creativecommons.org/licenses/by/4.0/).
Share and Cite
MDPI and ACS Style
Pan, Y.; Yuan, Q.; Huang, G.; Gu, J.; Li, P.; Zhu, G. Numerical Investigations on the Blade Tip Clearance Excitation Forces in an Unshrouded Turbine. Appl. Sci. 2020, 10, 1532. https://0-doi-org.brum.beds.ac.uk/10.3390/app10041532
AMA Style
Pan Y, Yuan Q, Huang G, Gu J, Li P, Zhu G. Numerical Investigations on the Blade Tip Clearance Excitation Forces in an Unshrouded Turbine. Applied Sciences. 2020; 10(4):1532. https://0-doi-org.brum.beds.ac.uk/10.3390/app10041532
Chicago/Turabian StylePan, Yang, Qi Yuan, Gongge Huang, Jiawei Gu, Pu Li, and Guangyu Zhu. 2020. "Numerical Investigations on the Blade Tip Clearance Excitation Forces in an Unshrouded Turbine" Applied Sciences 10, no. 4: 1532. https://0-doi-org.brum.beds.ac.uk/10.3390/app10041532
Note that from the first issue of 2016, this journal uses article numbers instead of page numbers. See further details here.