Short-Term Measurement of Indoor Radon Concentration in Northern Croatia


Faculty of Geotechnical Engineering, University of Zagreb, Hallerova aleja 7, 42000 Varaždin, Croatia
*
Author to whom correspondence should be addressed.
Appl. Sci. 2020, 10(7), 2341; https://0-doi-org.brum.beds.ac.uk/10.3390/app10072341
Submission received: 24 February 2020
/
Revised: 22 March 2020
/
Accepted: 27 March 2020
/
Published: 29 March 2020
(This article belongs to the Special Issue Air Pollution—Measurement Methods, Exposure, and Health Determinants)
Abstract
:(1) Background: Radon concentrations in the environment are generally very low. However, radon concentrations can be high indoors and can cause some serious health issues. The main source of indoor radon (homes, buildings and other residential objects) can be soil under the house, while other sources can be construction materials, groundwater and natural gas. Radon accumulates mainly in the lower levels of the buildings (especially low-ventilated underground levels and basements). (2) Methods: in this paper, we have measured the indoor radon concentrations at 15 locations in various objects (basements and ground floor/1st floor rooms) in the area of northern Croatia. (3) Results: the results show a higher concentration of radon in the basement area in comparison to values measured in the ground floor and first-floor rooms. The arithmetic mean (AM) and geometric mean (GM) of basement rooms were 70.9 ± 38.8 Bq/m3 and 61.2 ± 2.2 Bq/m3 compared to ground floor and first-floor rooms 42.5 ± 30.8 Bq/m3 and 32.8 ± 2.9 Bq/m3, respectively. (4) Conclusions: results obtained (AM and GM values) are within the maximal allowed values (300 Bq/m3) according to the Euroatom Directive. However, there are periods when maximum radon concentration exceeds 300 Bq/m3. Indoor radon concentrations vary with the occupancy of the rooms and it is evident that the ventilation has significant effect on the reduction of concentration.
1. Introduction
Radon is a natural, colorless, odorless radioactive gas with three natural isotopes, actinone 219Rn, thoron 220Rn and radon 222Rn, and it is the main natural source of radiation on Earth. Rocks, soil and water naturally contain radon due to presence of uranium in trace concentrations as well as its immediate parent and because of the radioactive decay of radium.
It can be found everywhere in the Earth’s crust and it easily crosses from the ground into the air. According to the literature [1], indoor radon concentrations mostly depend on local geology, hygrometry, meteorological conditions as well as level of ventilation and occupancy [2,3,4]. Radon is an unstable radionuclide that disintegrates through short-lived decay products before eventually reaching the end product of stable lead. The short-lived decay products of radon are responsible for most of the hazards posed by inhalation. The concentration of radon in the open air is quite low (between 5 and 15 Bq/m3) and generally does not cause any health problem, but it can be high indoors (from 10 to several thousand Bq/m3) where human can be the most exposed to the radon concentration. The average value of radon concentration in houses in the Republic of Croatia is about 70 Bq/m3 [5,6]. According to the European Union (EU) Directive, establishing basic safety standards for protection against the dangers that may result of exposure to ionizing radiation, radon concentrations in houses less than 300 Bq/m3 are considered acceptable and the individual risk of some illness is negligible [5]. Generally, radioactive elements enter the respiratory system where radioactive decay can damage DNA and potentially can cause lung cancer [6,7,8]. Radon gas enters houses from the ground through cracks in concrete floors and walls, through gaps between floors and slabs, around drains and pipes, and through small pores of hollow-block walls. Consequently, radon levels are usually higher in basements, cellars and ground floors. Depending on a number of factors, the concentration of radon indoors varies with the time of the year, from day to day, and from hour to hour [7,8].
Radon is most concentrated in the air in a building containing many enclosed and unventilated rooms. When radon enters the room or, to a lesser extent, the building material itself, it is difficult to escape outside [6,9,10,11]. The concentration of radon in residential buildings is influenced by geological composition and soil structure, climatic parameters, number and size of micro-cracks that are in direct contact with the soil and life routine of people (e.g., frequency of room ventilations). Due to large number of different parameters affecting the concentration of radon in residential buildings, it is actually impossible to produce a satisfactory model to predict the concentration of radon in a closed facility. Therefore, direct measurement is essential for qualitatively declaring radon risk and the mapping of different radon phenomena is an important task in a scientific and regulatory context [2,3]. Considering the aspect of radon effects on health, identifying areas with increased radon levels is the key step to monitor radon and prevent negative effects on the population and the environment.
The main aim of this paper was short-term indoors radon concentration measurement at different locations in northern Croatia as well as updating previous measurements of radon levels in this part of Croatia. In 2006, Radolić et al. [5] performed a one-year national survey of indoor radon measurement in the Republic of Croatia in a single room of a building. The results of radon concentration measurements in public and residential spaces are available on line in map format [5,6] provided by Croatian State Office for Radiological and Nuclear Safety. In this work, radon concentrations were measured in randomly selected occupancy objects: residential and office buildings, family house and weekend cottages/wine cellar houses in different types of rooms and floors (basements vs. ground/first floors) to observe how indoor radon concentrations vary with the occupancy and ventilation of the rooms. This work provides valuable new datasets for the current literature body [5,6], since exposure to indoor radon is a potential threat to public health, and similar measurements were conducted over a decade ago.
2. Materials and Methods
Radon concentration measurements were performed using an Airthings Corentium Pro airborne instrument. Corentium Pro contains four high-precision radon chambers operating in parallel for maximum reliability, accuracy and speed. Instrument samples indoor air through a passive diffusion chamber, using alpha spectrometry to accurately calculate radon concentration. Radon is detected using silicon photodiodes to both count and measure the energy of alpha particles resulting from the decay chain of radon gas. The instrument is calibrated to reference instruments in accredited laboratories and is American Association of Radon Scientists and Technologists-National Radon Proficiency Program (AARST-NRPP) certified. The standard deviation from the exact radon level is less than 7% + 5 Bq/m3 after 24 hours and less than 5% + 2 Bq/m3 after 7 days [12]. The instrument is also equipped with sensors for temperature (0.2 °C resolution, accuracy ±0.5 °C), relative humidity (0.5% resolution, accuracy ±4.5%), atmospheric pressure (0.06 kPa resolution, accuracy ±1kPa).
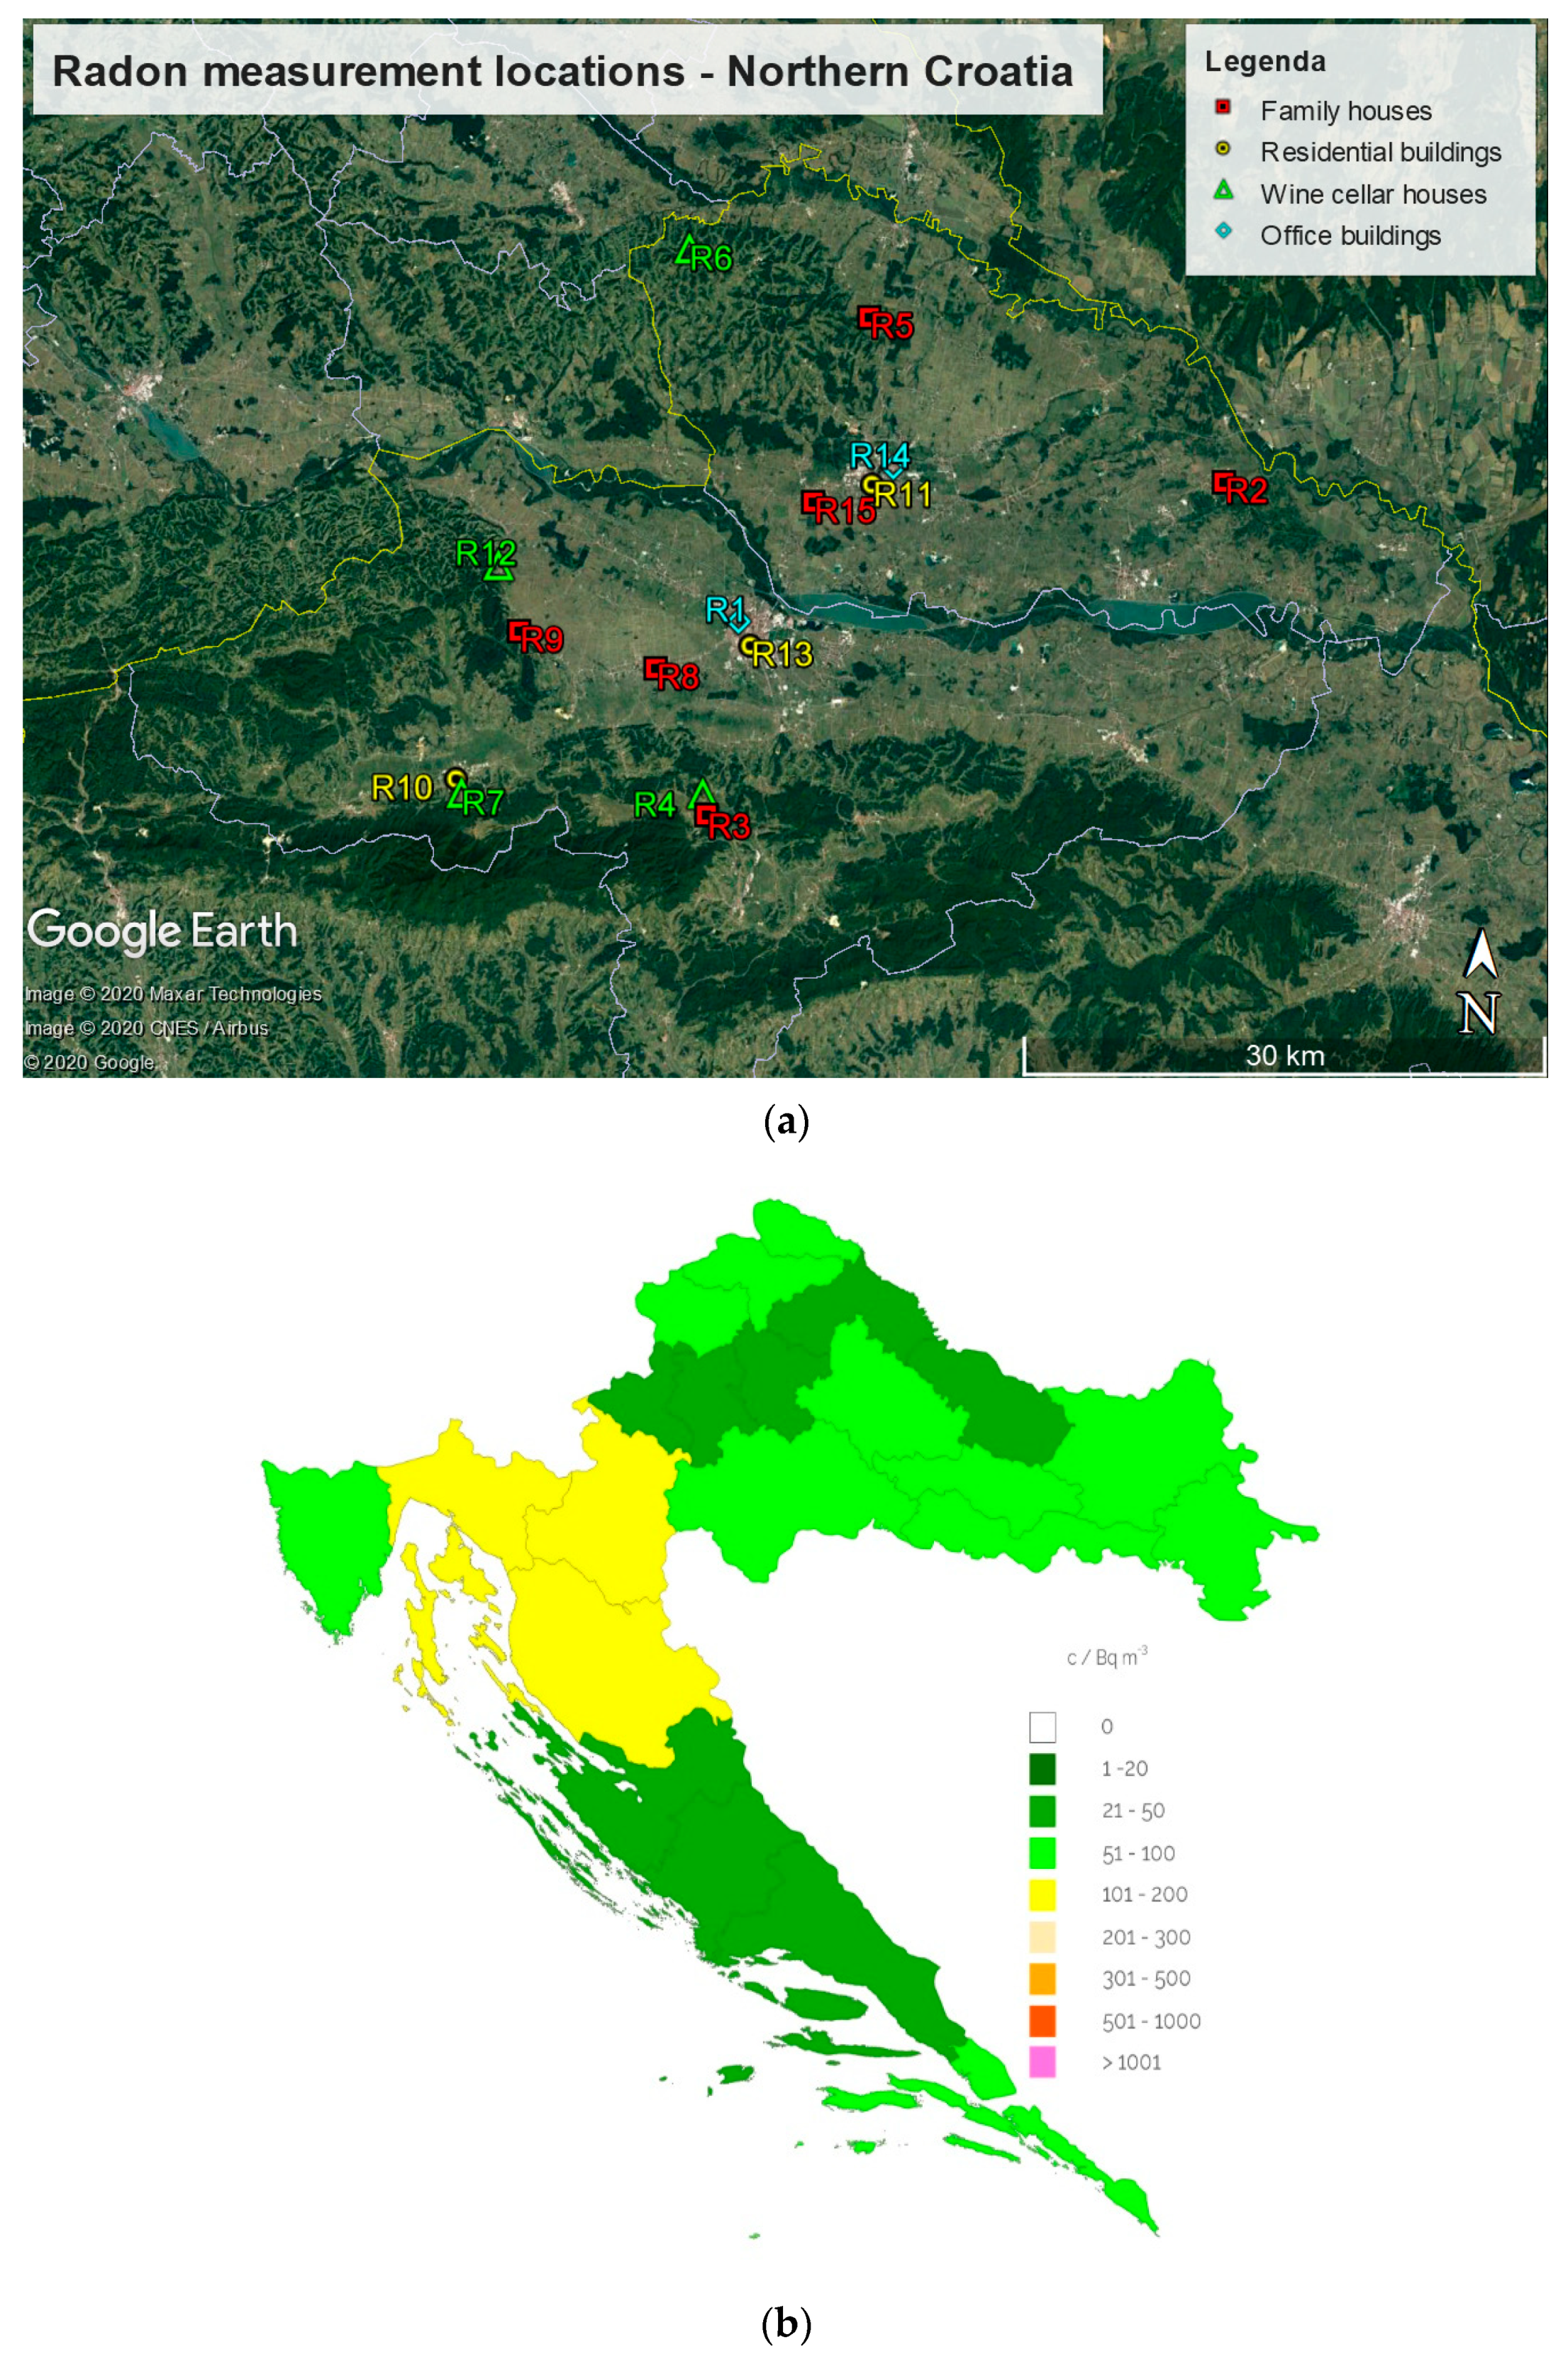
Measurement of indoor radon concentration was performed continuously at 15 randomly selected locations in the area of northern Croatia (Figure 1a) from July 2018 to July 2019. Figure 1b shows the results of previous radon concentration measurements in Croatia [5,6]. In this work, radon concentration measurement was performed in objects separated into four categories: residential buildings and family houses as the most occupied, office buildings that are occupied during week (working hours), as well as weekend cottage and small family wine cellar houses that are occupied mainly at weekends. Short-term measurements were used to provide an indication of actual radon concentrations, mainly at intervals of four to eight days at two places (basement room and the ground floor/first-floor room) with one-hour resolution. Instrument was positioned away from doors and windows as well away from radiation sources, in order to catch radon in air in these places without interference. A single measurement was performed in basement where radon is expected to reach its highest concentration and in one room that is often most occupied with the least airflow in the whole building. Room ventilation is reported by occupants. For buildings that are only occupied for part of the day (office buildings), radon is measured during occupied periods and weekends to determine if there are significant diurnal radon variations. The studied samples with description of locations and object are summarized in Table 1.
3. Results and Discussion
Indoor radon concentration values can vary on daily basis, depending on several factors: thermo-hygrometric conditions, time of season, soil types, strength of the radon source in the underlying bedrock, pressure changes created by the building as well as level of ventilation and occupancy itself also contribute significantly [6,7,8,9,10,11]. Since indoor radon concentrations vary with diurnal and seasonal variations, we consider these when performing short-term radon measurements. In Figure 2, Figure 3 and Figure 4, results were presented with 4 sublots to differentiate possible radon variations with temperature, humidity and air pressure. Furthermore, for the radon concentration values, arithmetic and geometric mean were shown. The arithmetic mean (AM) is the most common way of calculating an average. However, the geometric mean (GM) is a better measure of average radon data. The distribution of radon concentrations is asymmetrical around the average as can be seen from Figure 2, Figure 3 and Figure 4. As a result of this asymmetry, the higher concentrations have a disproportionately greater weight than the lower ones in the calculation of the arithmetic mean. This problem is largely avoided by the geometric mean and, thus, this statistic is the one recommended generally by radon experts for estimating the average radon concentration in an area [1,14]. The maximum (max) concentration is based on the single most extreme value in a distribution and the minimum (min) concentration is usually reported only for the zip code areas because it is always close to zero where there are large numbers of measurements [14].
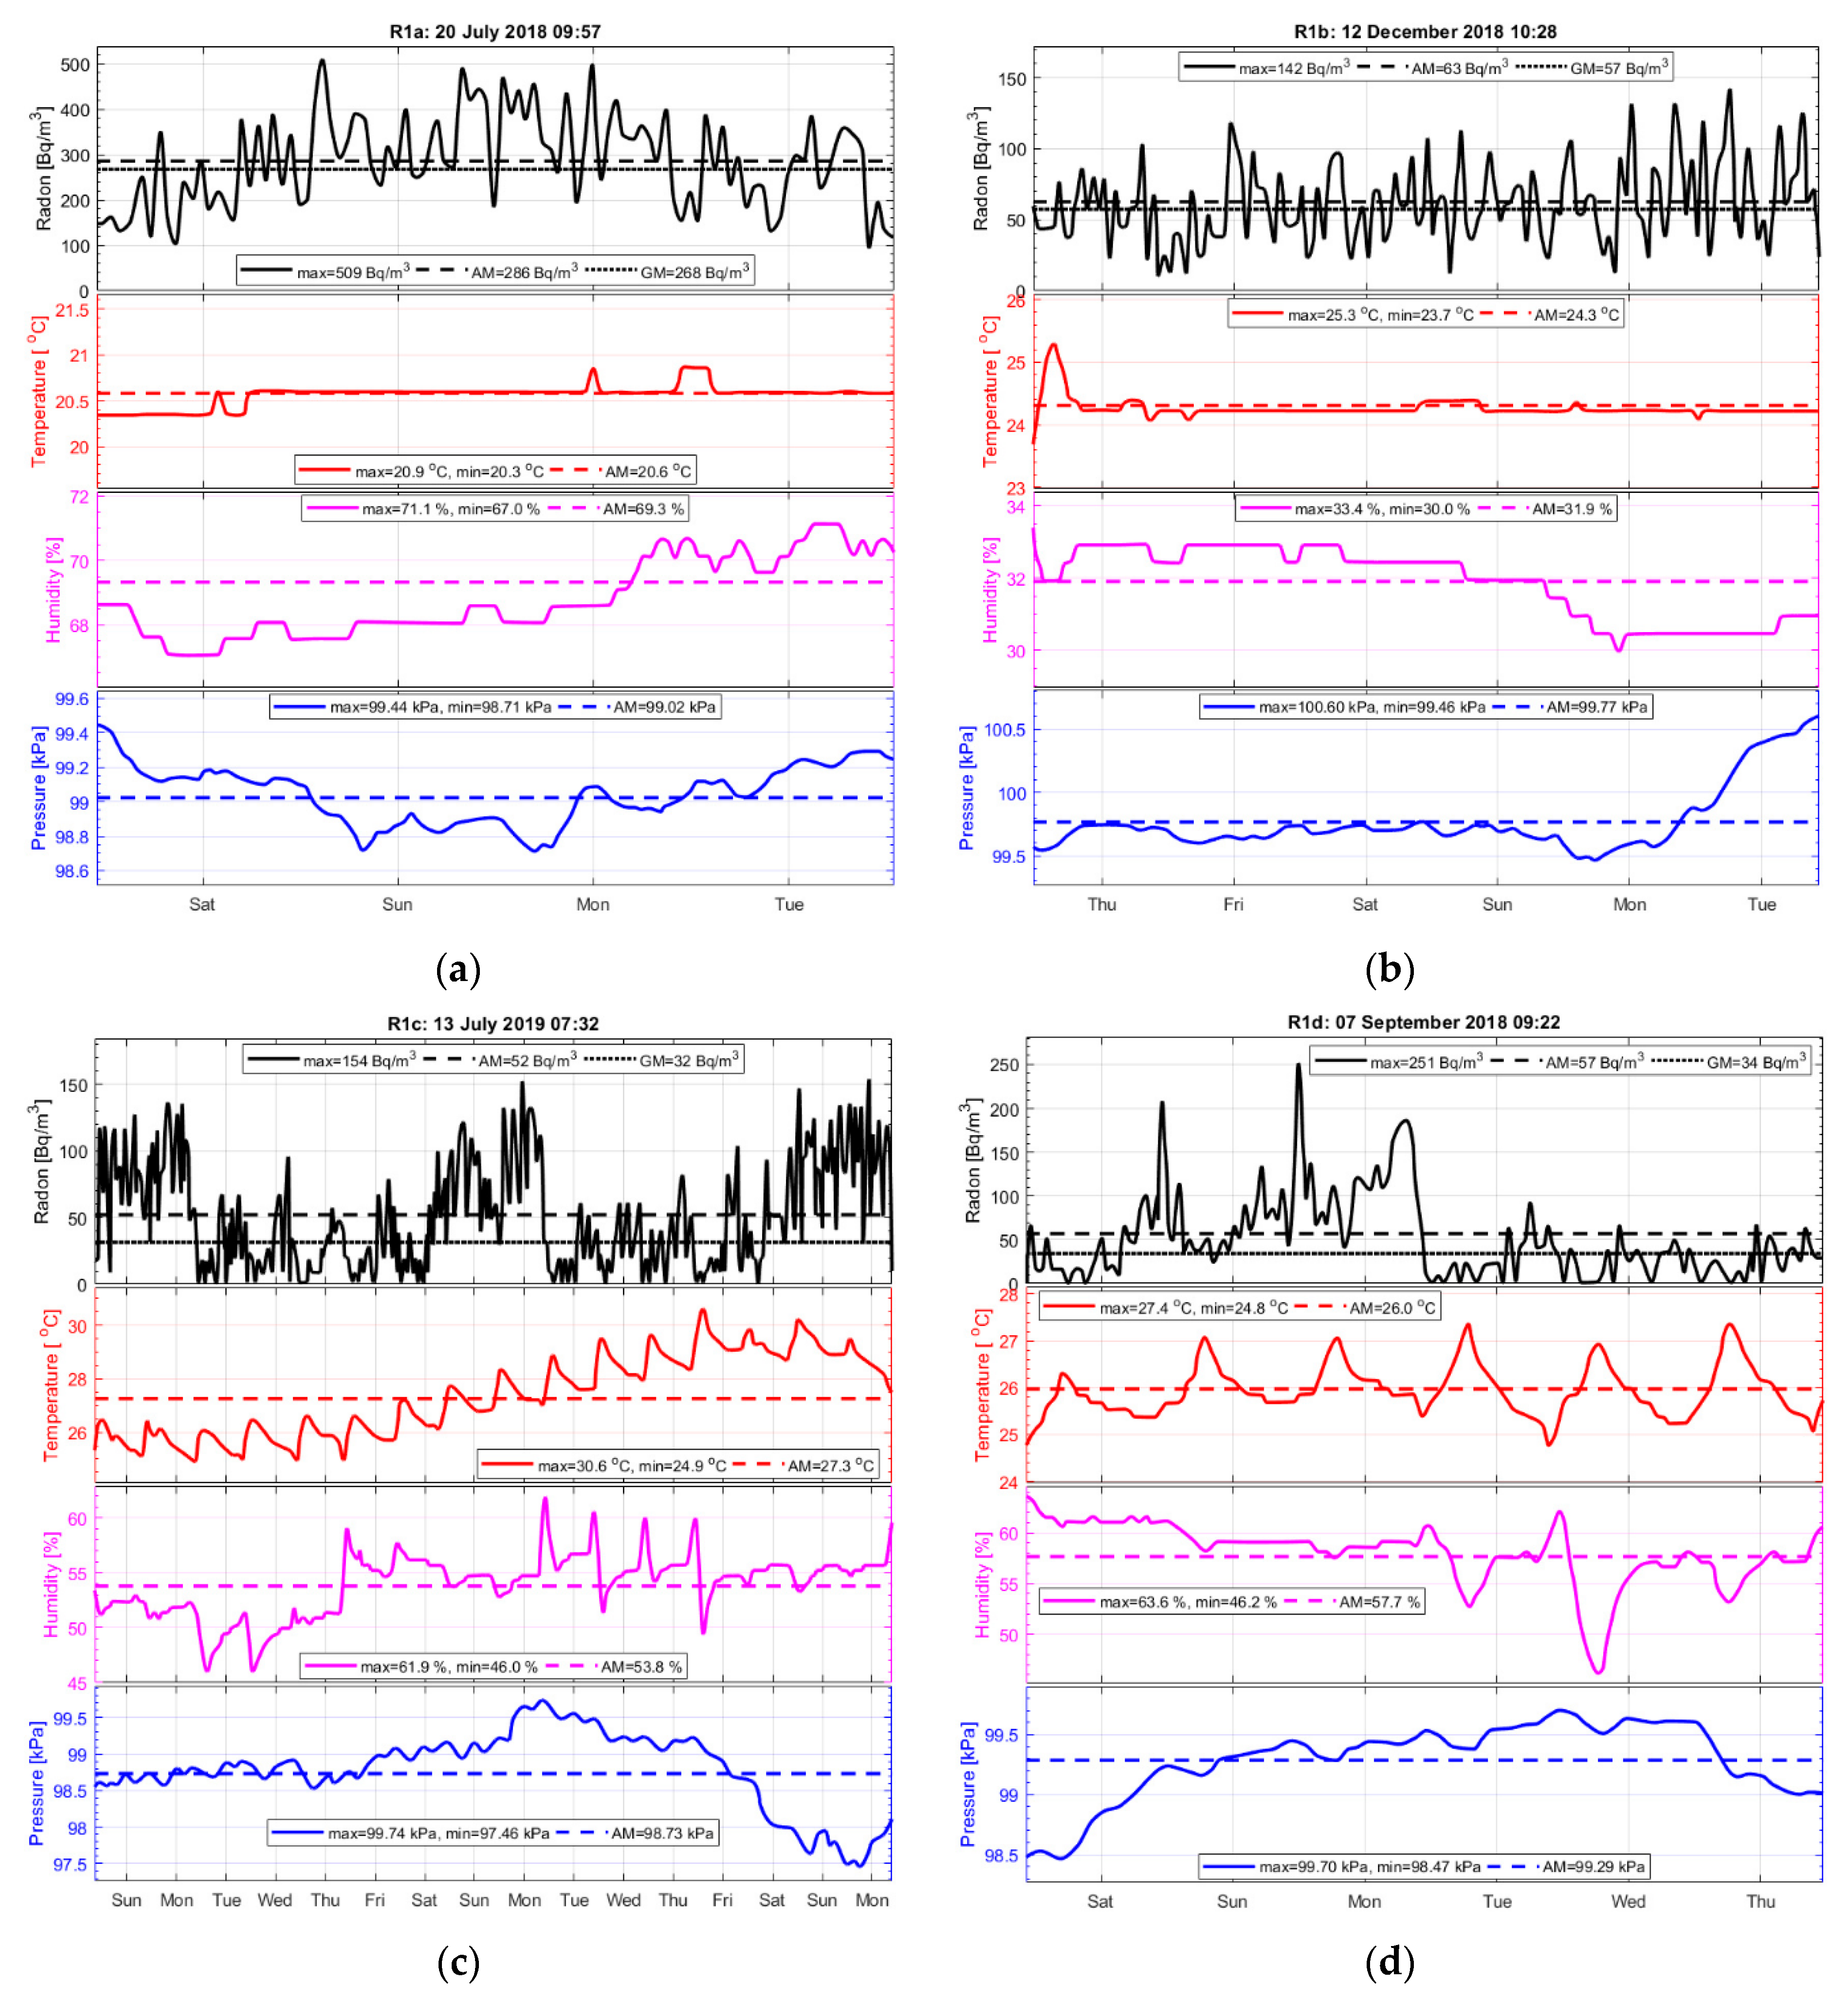
Figure 2 shows radon concentration level in an office building (R1) in three different floors: basement storage (R1a), basement laboratory (R1b), office on 1st (R1c) and 3rd (R1d) floor. In the basement storage there was no ventilation as it is in the center of building with no windows. The laboratory in the basement was occasionally occupied with manual/passive ventilation through small windows. Office rooms (manual ventilation through windows) were mostly occupied during working hours (07:00–16:00). The occupancy of the office rooms during week working hours compared to weekend non-occupied rooms has an effect on radon concentration. In the building basement storage, higher radon concentrations were expected as the main source of radon is the soil since its generation and transportation through foundations in the basement are closely related to geology. The effect of a basement (R1a, R1b) on the radon levels in a building basement is two-fold: firstly, radon concentration on the floors above (R1c, R1d) a basement can be comparatively low as the rooms have no ground contact and, secondly, the ventilation is weaker in the basement compared to other floors. The effect of temperature, which was approximately constant in the basement (R1a, R1b) compared to the floors above (R1c and R1d), showed some comparable trends. This effect was most prominent in office rooms due to heating (natural in summer, heating in winter) compared to low-to-non heated rooms in the basement. A similar effect was observed for humidity and air pressure. A close correlation was observed between the hourly indoor radon variations with environmental parameters, temperature, humidity and air pressure indicating that indoor radon concentrations may be affected by both indoor-to-outdoor temperature, humidity and pressure differences [8,15,16].
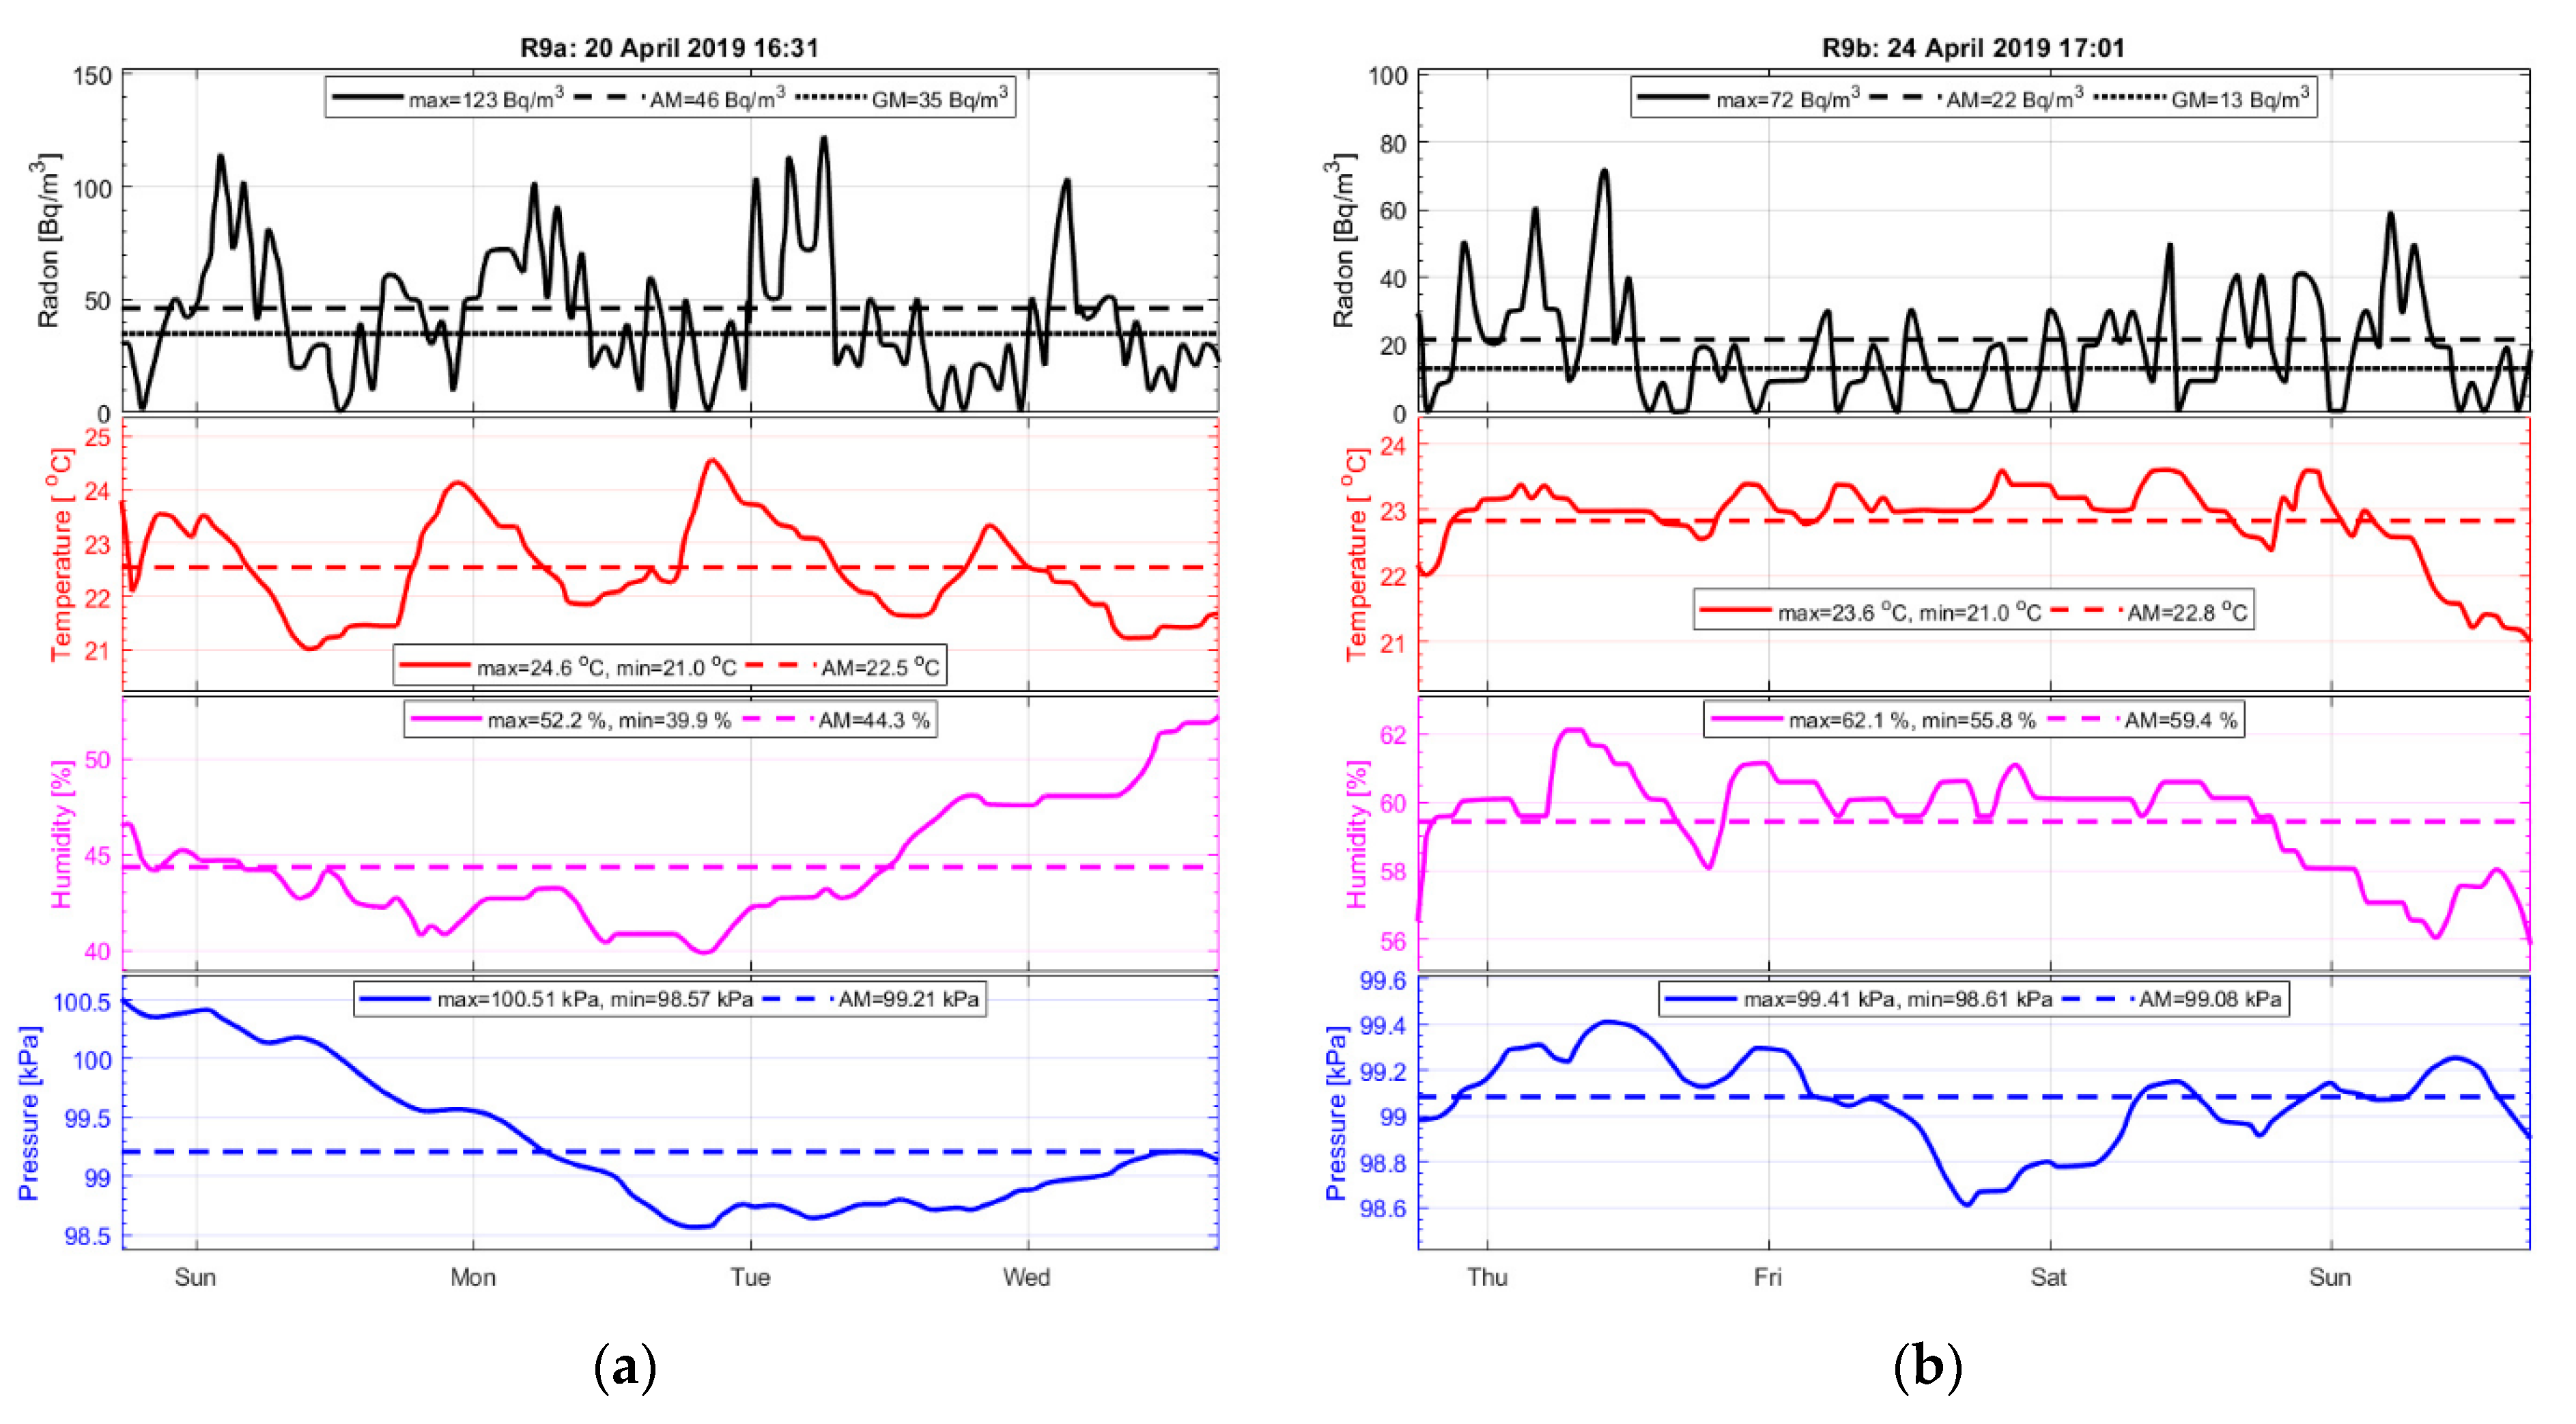
Similar behavior was observed for samples shown in Figure 3 and Figure 4 that presented radon measurement in the family house (R9, basement garage and kitchen storage) and in the wine cellar house (R6, basement storage room and dining storage room). For the family house (R9), day/night radon concentration variations were observed as well as indoor-to-outdoor temperature, humidity and pressure differences. The main radon effect in the family house was caused by the closed windows during the night, heating, occupancy in garage and in rooms. The data from the wine cellar house were interesting since they obtained a high radon accumulation in the basement storage. Usually, this wine cellar house was highly occupied, and at that particular period it was closed. Generally, the high radon concentrations are expected in the basement storage and are confirmed in many studies [17,18,19,20]. The level of its contribution in radon variability is not the same everywhere as shown in Figure 2, Figure 3 and Figure 4. Buildings with more floors reduce radon emanation from the soil and the building foundations into building basement and above floors. The rate of exchange between indoor and outdoor air depends on the construction of the house and window seals, ventilation habits of the occupants, and the air-flow of the building. Buildings and occupants that had a new type of hermetically sealed windows with lower natural ventilation compared to older wooden windows that had some effect on the radon levels [21].
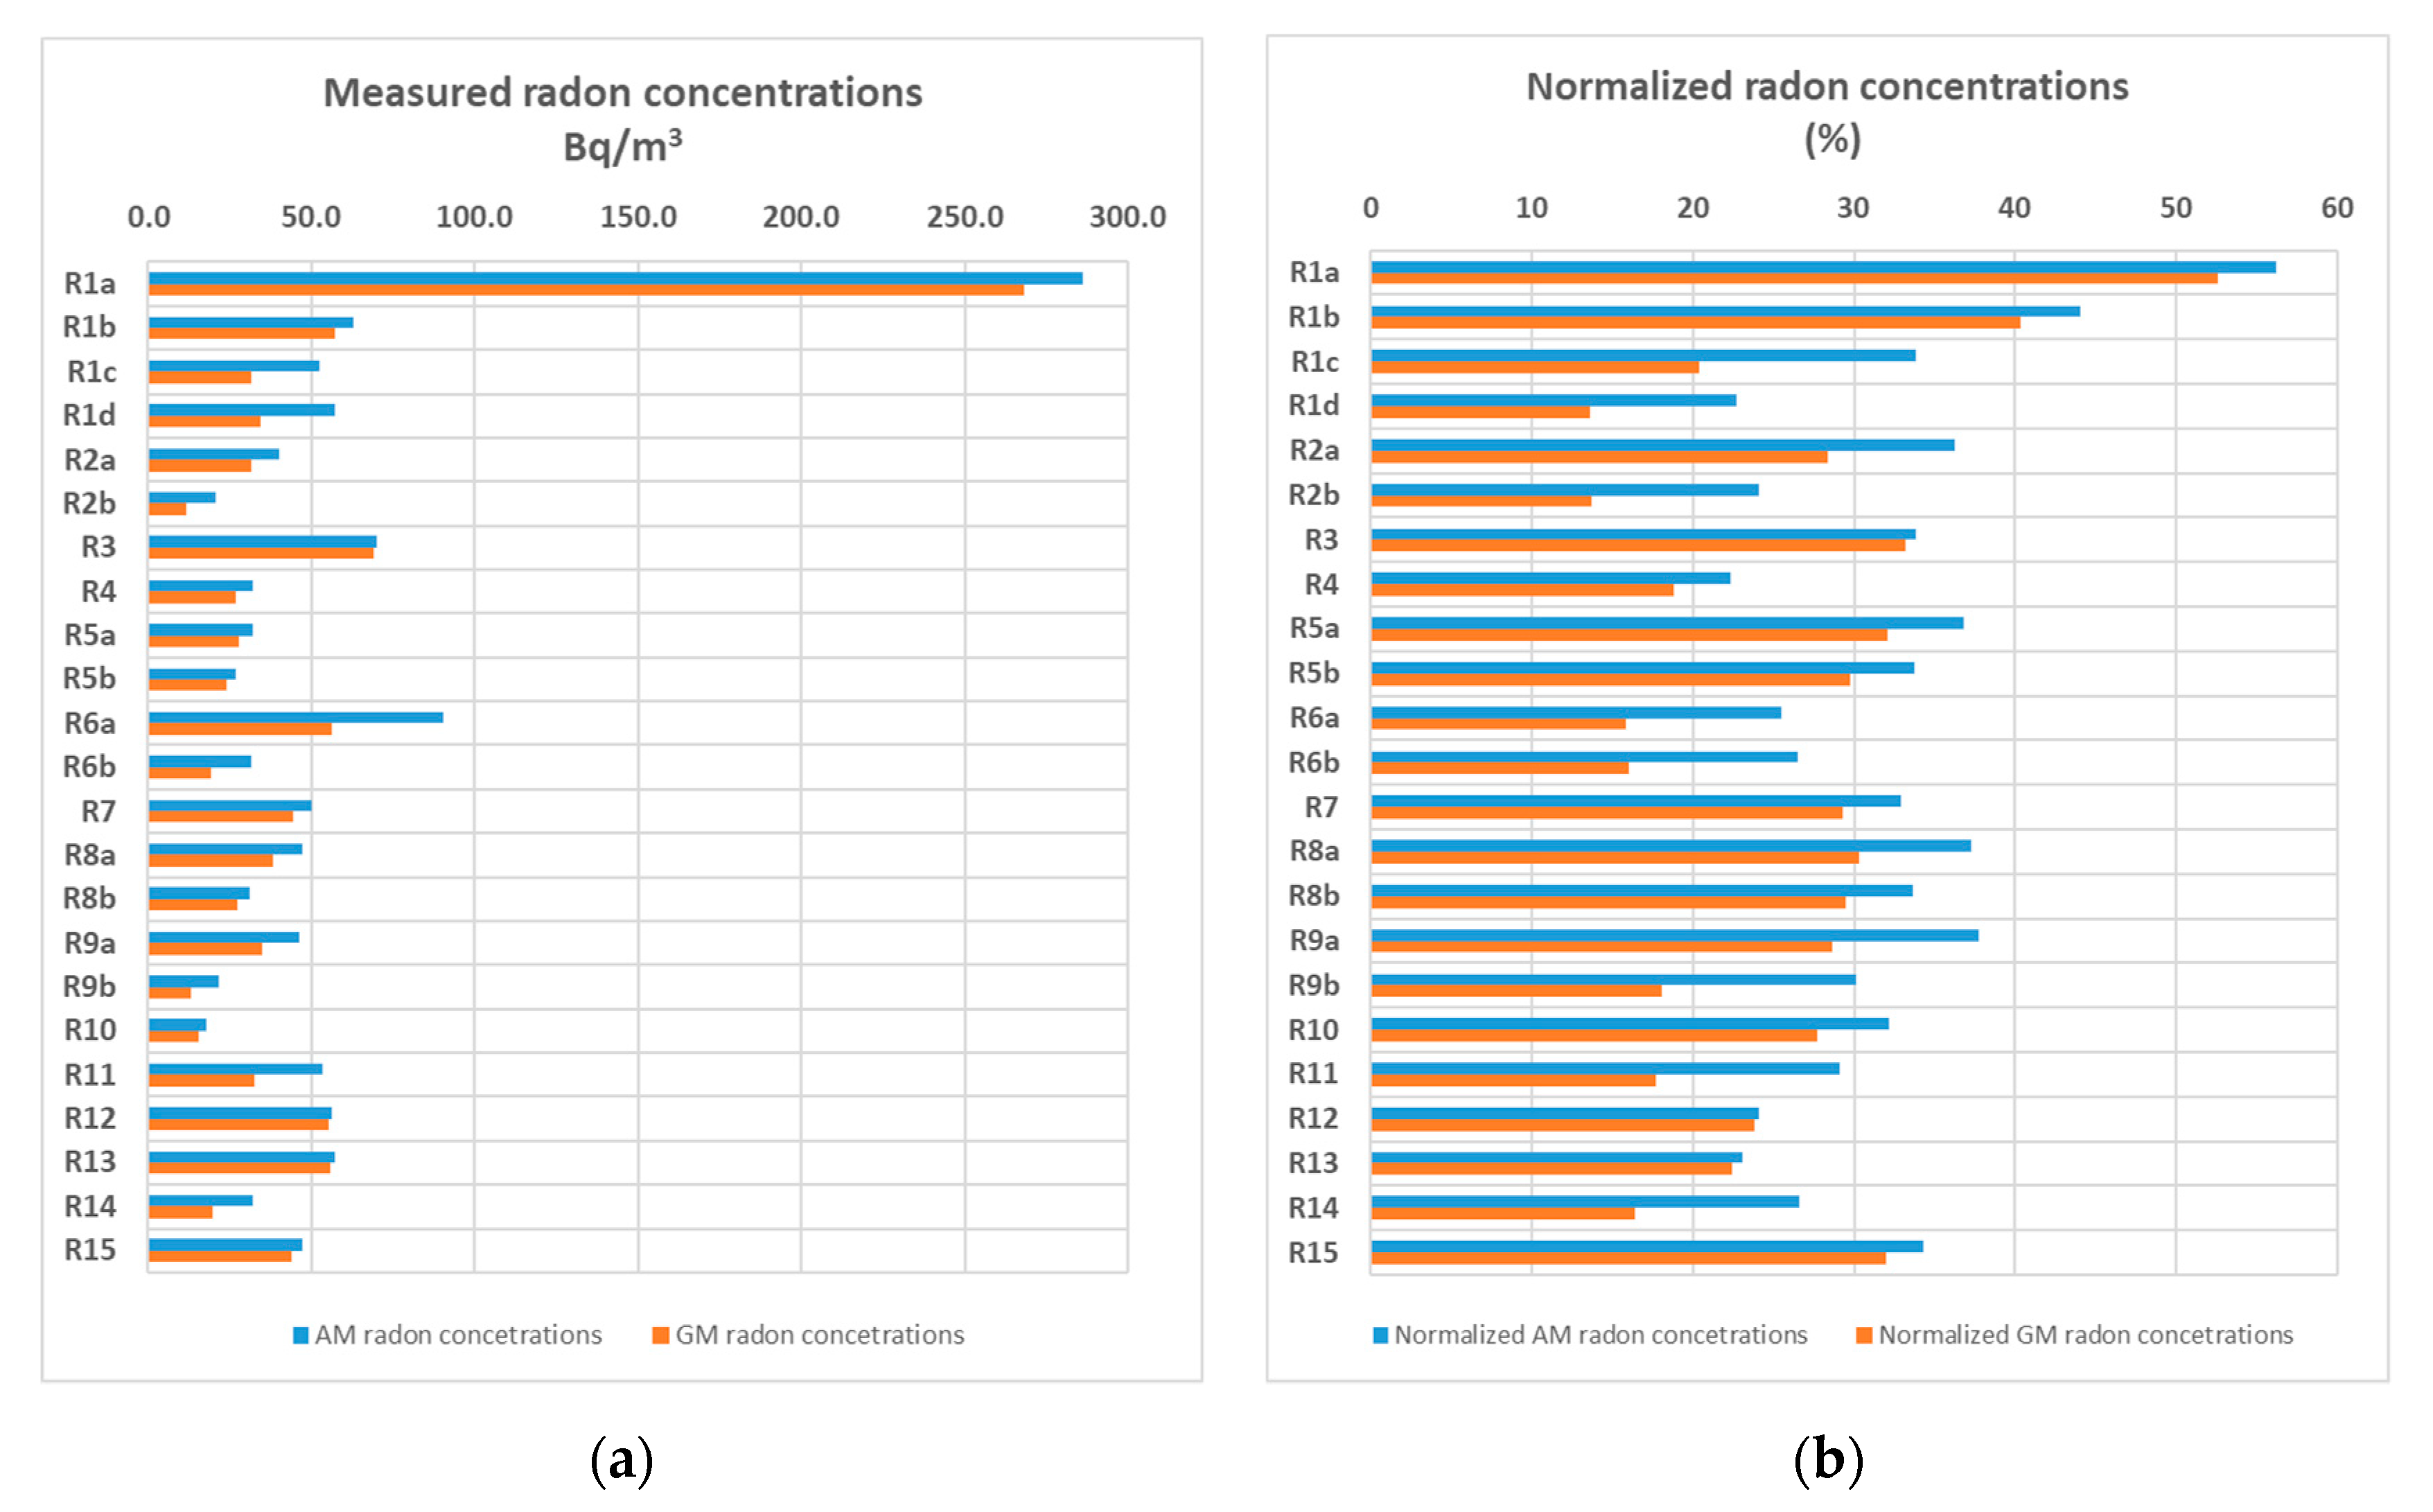
In this study, we have measured indoor radon concentrations at 15 randomly selected locations in the area of northern Croatia. Descriptive statistics (maximum, arithmetic mean, standard deviation, geometric mean, geometric standard deviation) of the radon indoor testing data with temperature, humidity and air pressure conditions (minimum, maximum and arithmetic mean) for randomly selected buildings in Northern Croatia are shown in Table 2 and Figure 5a. From the results presented in Figure 2, Figure 3 and Figure 4 it can be seen that radon level varies between different types of objects and can vary within a house through day/night periods and from hour to hour. Radon enters the house through cracks in the soil-foundation into the basement and through floor-wall junctions, gaps, pores, drains, etc. Indoor radon concentrations obtained from this study (Table 2) varied under the influence of environmental parameters (winter to summer), temperature, humidity and air pressure, occupancy (highly occupied vs no-occupation), ventilation (active and passive), building material (brick, stone, wooden or polyvinyl chloride (PVC) windows) as well as local geology (Holocene deposits, Neogene clastics).
Based on our observations (Figure 5a, Table 3), family houses tended to show smaller radon concentrations compared to residential buildings due to different types of constructions. Radon levels were higher in basements since they are directly in contact with the soil, particularly R1a. Office buildings also showed higher concentrations compared to residential buildings since the doors and windows were closed after working hours and during weekends, and this allowed radon accumulation originating from basements into higher floors. For an evaluation of differences among/within buildings and inter-site comparison, we have normalized AM and GM radon concentrations (Figure 5b). Normalized AM and GM concentrations are generally around 20%–30% for all buildings except R1a and R1b (above 40%) that is a basement floor. Also, it can be observed that in the same building and on different floor, normalized ratio is decreased (R1a,b vs. R1d). With the normalized radon concentrations, it can be observed that there is no statistically significant difference in the distribution of radon measurement among buildings/floors and different geological sites except site R1.
In rocks and soils, radon is usually captured inside the mineral matrix but it is released to the interstitial space between grains when the radium decays. Radon moves more rapidly through permeable soils, such as coarse sand and gravel, than through impermeable soils, such as clays [23]. It is important to note that radon released from the aggregate building materials (sand, gravel, crushed rock, clay) could also enter a house (walls, foundations) through the same migration pathways as radon produced by the surrounding rocks and soils [24]. The amount of radon depends on the amount of uranium present in the bedrock at the site, the type and permeability of soil surrounding the disturbed zone and underneath bedrock, and the soil’s moisture content [25]. In the current phase of the research it is hard to conclude how much radon exhalation from alluvial Holocene deposits (sands, gravels, clays) and coarse-grained Neogene clastic sediments contributes to the total radon concentration in the indoor basement at these locations.
Indoor radon concentrations in this study mainly vary with the occupancy and it is evident that the ventilation has a significant effect on the reduction of concentration (Table 2). Results show that people living in basements may be exposed to higher level of radon than people living in ground/first-floors. Also, we noticed that office buildings’ indoor radon concentrations are higher than residential buildings, mostly due to the ventilation effect. It can be concluded that results of average radon concentrations (Table 3) were mostly comparable with national average radon concentrations conducted in one-year study, presented in Figure 1b [5,6].
In general, average radon concentrations are within maximal allowed values (300 Bq/m3) according to the Euroatom Directive. However, in the worst-case scenario with no ventilation, the maximum radon concentrations exceed 300 Bq/m3, as presented in Figure 2 and Figure 4. Radon concentrations within a home vary among rooms and so the actual radon concentration relevant to a person will also vary, depending on the time spent in different rooms. People who spend much of their time in basement rooms at home or at work have a greater risk of being exposed. Three radon exposure periods are known: acute (14 days or less), intermediate (15–364 days), and chronic (365 days or more) [26]. The World Health Organization (WHO) proposes a reference level of 100 Bq/m3 to minimize health hazards due to indoor radon exposure [1]. Percentage increase in risk of lung cancer per 100 Bq/m3 increase in measured radon concentration by age, sex, smoking and histological type was investigated by [27] and showed that the risk of lung cancer increases by 8%–16% per 100 Bq/m3 increase in long-time average radon concentration. Radon in the home accounts for about 9% of deaths from lung cancer and about 2% of all deaths from cancer in Europe [1].
The primary radon prevention and mitigation strategies focus on sealing radon entry routes and on reversing the air pressure differences between the indoor occupied space and the outdoor soil through different soil depressurization techniques [1,28]. Radon levels in existing buildings can be reduced by: increasing under-floor ventilation (e.g., building R1); installing a radon sump system in the basement or under a solid floor; avoiding the passage of radon from the basement into living rooms; sealing floors and walls; and improving the ventilation of the house. Also, long-term measurements will provide us representative averages in this office building that is interesting for researchers and a potential radon health risk.
Even though this study shows high radon temporal variation in one type of indoor environment within the period of a month, which will be potentially overweighed by seasonality, our short-term radon data have a limitation for calculating long-term radon exposure [29]. Using a short-term measurement (3–16 days), we try to identify radon prone areas by dividing our measurements according to geological criteria and allocating measurements randomly within the selected areas and buildings. Short-term measurements for low-level radon concentrations (less than 100 Bq/m3) generally should be a good predictive threshold of long-term average values being above/below an administrative reference levels, particularly if standard deviation is considered. However, it should not be taken as a basis for long-term radon exposure estimates [29]. Also, it is worth mentioning that a short-term radon tests predict about 80% of a 90+ day long-term radon test, however, they failed to catch seasonal radon variation [29]. AM and GM radon concentrations between seasons can vary about 25% [8,29]. Long-term radon measurement would allow correct discussion of inter-environmental differences for radon concentrations [17,19] and include a seasonal correction factor for estimating population indoor-level radon exposures [8].
4. Conclusions
We have measured the indoor radon concentrations at 15 locations in various objects (basements and ground floor/1st floor rooms) in the area of northern Croatia. Since most radon comes from the ground, the highest concentrations of radon are found in the basement rooms compared to values measured in the ground floor and first-floor rooms. The arithmetic mean (AM) and geometric mean (GM) of basement rooms were 70.9 ± 38.8 Bq/m3 and 61.2 ± 2.2 Bq/m3 compared to ground floor and first-floor rooms of 42.5 ± 30.8 Bq/m3 and 32.8 ± 2.9 Bq/m3.
The distribution of indoor radon has been found to be largely dependent on a building’s occupation and ventilation. Generally, it can be concluded that the ventilation of the rooms has a strong potential to mitigate radon pollution from sources within buildings as well as a considerable reduction of radon concentration when ventilation actions were undertaken by occupants. Furthermore, the values of radon concentration obtained in Varaždin and Međimurje counties are below the maximum allowable concentration of 300 Bq/m3 (proposed by the Euroatom Directive) and do not pose a threat for human health.
We try to locate radon-prone areas by dividing our measurements according to geological criteria and allocating measurements randomly within the selected areas and buildings. A short-term detector was used for the purpose of undertaking initial radon screening. These short-term measurements were taken with the objective of identifying different types of object with increased radon concentrations in a short period (3–16 days). Short-term measurements for low-level radon concentrations (less than 100 Bq/m3) as shown in this study generally should be a good indicator of long-term average values if standard deviation is considered, but it should not be taken as a basis for long-term radon exposure estimates. Future long-term measurements will allow us to assess representative averages in buildings that are interesting for the general population and potential radon health risk as well for seasonal radon variations.
Author Contributions
Conceptualization, A.P.S. and D.S.; methodology, D.S.; software, D.S.; validation, N.S.; formal analysis, A.P.S., D.S. and D.D.; investigation, T.T., A.P.S., D.S., N.S. and D.D.; resources, A.P.S.; data curation, N.S.; writing—original draft preparation, A.P.S.; writing—review and editing, A.P.S., N.S. and D.S.; visualization, D.S.; supervision, A.P.S.; project administration, A.P.S. and N.S.; funding acquisition, A.P.S. All authors have read and agreed to the published version of the manuscript.
Funding
This research received no external funding. APC was funded by D.S.
Acknowledgments
We would like to thank to the Laboratory for Environmental Geochemistry and Department for Hydrotechnics for technical and financial support.
Conflicts of Interest
The authors declare no conflict of interest. The funders had no role in the design of the study; in the collection, analyses, or interpretation of data; in the writing of the manuscript; or in the decision to publish the results.
References
- Zeeb, H.; Shannoun, F. WHO handbook on indoor radon: a public health perspective; WHO Press, World Health Organization: Geneva, Switzerland, 2009; pp. 1–94. [Google Scholar]
- Branco, P.T.B.S.; Nunes, R.A.O.; Alvim-Ferraz, M.C.M.; Martins, F.G.; Sousa, S.I.V. Children’s Exposure to Radon in Nursery and Primary Schools. Int. J. Env. Res. Pub. He. 2016, 13, 386. [Google Scholar] [CrossRef] [PubMed] [Green Version]
- Antão, A.M. Assessment of Radon Concentrations Inside a High School Building in Guarda (Portugal): Legislation Implications and Mitigation Measures Proposed. Procedia. Earth. Planet. Sci. 2014, 8, 7–12. [Google Scholar] [CrossRef] [Green Version]
- Llerena, J.J.; Cortina, D.; Durán, I.; Sorribas, R. 222Rn concentration in public secondary schools in Galicia (Spain). J. Environ. Radioactiv. 2010, 101, 931–936. [Google Scholar] [CrossRef] [PubMed]
- Radolic, V.; Vukovic, B.; Stanic, D.; Katic, M.; Faj, Z.; Lukacevic, I.; Planinic, J.; Suveljak, B.; Faj, D.; Lukic, M. National survey of indoor radon levels in Croatia. J. Radioanal. Nucl. Ch. 2006, 269, 87–90. [Google Scholar] [CrossRef]
- State Institute for Radiological and Nuclear Safety. Available online: http://radon.dzrns.hr/ (accessed on 10 February 2020).
- Moshupya, P.; Abiye, T.; Mouri, H.; Levin, M.; Strauss, M.; Strydom, R. Assessment of Radon Concentration and Impact on Human Health in a Region Dominated by Abandoned Gold Mine Tailings Dams: A Case from the West Rand Region, South Africa. Geosciences 2019, 9, 466. [Google Scholar] [CrossRef] [Green Version]
- Park, J.H.; Lee, C.M.; Lee, H.Y.; Kang, D.R. Estimation of Seasonal Correction Factors for Indoor Radon Concentrations in Korea. Int. J. Environ. Res. Public. Health. 2018, 15, 2251. [Google Scholar] [CrossRef] [PubMed] [Green Version]
- Nazaroff, W.W.; Nero, A.V., Jr. Radon and Its Decay Products in Indoor Air, 1st ed.; Wiley-Interscience: Hoboken, NJ, USA, 1988; pp. 1–518. [Google Scholar]
- Cosma, C.; Cucoş-Dinu, A.; Papp, B.; Begy, R.; Sainz, C. Soil and building material as main sources of indoor radon in Băiţa-Ştei radon prone area (Romania). J. Environ. Radioactiv. 2018, 15, 1–13. [Google Scholar] [CrossRef] [PubMed]
- Amin, R.M. A study of radon emitted from building materials using solid state nuclear track detectors. J. Radiat. Res. Appl. Sc. 2015, 8, 516–522. [Google Scholar] [CrossRef] [Green Version]
- Airthings Corentium Pro, Radon Monitor System. Available online: https://www.airthings.com/en/pro (accessed on 10 February 2020).
- Mostečak, A.; Perković, D.; Kapor, F.; Veinović, Ž. Radon mapping in Croatia and its relation to geology. Min. Geol. Pet. Eng. Bulletin. 2018, 33, 1–11. [Google Scholar] [CrossRef]
- Zhukovsky, M.; Vasilyev, A.; Onishchenko, A.; Yarmoshenko, I. Review of indoor radon concentrations in schools and kindergartens. Radiat. Prot. Dosimetry. 2018, 181, 6–10. [Google Scholar] [CrossRef]
- Steck, D.J. Annual average indoor radon variations over two decades. Health. Phys. 2009, 96, 37–47. [Google Scholar] [CrossRef] [PubMed]
- Rahman, S.U.; Matiullah, A.J. Measurement of indoor radon concentration levels in Islamabad, Pakistan. Radiat. Meas. 2008, 43, S401–S404. [Google Scholar] [CrossRef]
- Hernandez, T.L.; Ring, J.W.; Sachs, H.M. Variation of basement radon concentration with barometric pressure. Health. Phys. 1984, 46, 440–445. [Google Scholar] [PubMed]
- Bouzarjomehri, F.; Ehrampoosh, M.H. Radon level in dwellings basement of Yazd-Iran. Iran. J. Radiat. Res. 2008, 6, 141–144. [Google Scholar]
- Xie, D.; Liao, M.; Kearfott, K.J. Influence of environmental factors on indoor radon concentration levels in the basement and ground floor of a building – A case study. Radiat. Meas. 2015, 82, 52–58. [Google Scholar] [CrossRef] [Green Version]
- Saâdi, Z.; Marie, L. An experimental and numerical study on radon transport from UMT-contaminated sand to a house basement under variable weather conditions. J. Environ. Chem. Eng. 2017, 5, 3667–3683. [Google Scholar] [CrossRef]
- Godish, T.; Spengler, J.D. Relationships Between Ventilation and Indoor Air Quality: A Review. Indoor. Air. 2004, 6, 135–145. [Google Scholar] [CrossRef]
- Croatian Geological Survey. Available online: http://www.hgi-cgs.hr/index2B.html (accessed on 10 December 2019).
- U.S. Geological Survey. The Geology of Radon. Available online: https://certmapper.cr.usgs.gov/data/PubArchives/radon/georadon/3.html (accessed on 12 February 2020).
- Chen, J.; Bergman, L.; Falcomer, R.; Whyte, J. Results of simultaneous radon and thoron measurements in 33 areas of Canada. Radiat. Prot. Dosim. 2015, 163, 210–216. [Google Scholar] [CrossRef] [Green Version]
- Bersimbaev, R.I.; Bulgakova, O. The health effects of radon and uranium on the population of Kazakhstan. Genes. Environ. 2015, 37, 1–10. [Google Scholar] [CrossRef] [Green Version]
- Darby, S.; Hill, D.; Auvinen, A.; Barros-Dios, J.M.; Baysson, H.; Bochicchio, F.; Deo, H.; Falk, R.; Forastiere, F.; Hakama, M.; et al. Radon in homes and risk of lung cancer: collaborative analysis of individual data from 13 European case-control studies. Br. Med. J. 2005, 330, 223–227. [Google Scholar] [CrossRef] [Green Version]
- Keith, S.; Doyle, J.R.; Harper, C.; Mumtaz, M.; Tarrago, O.; Wohlers, D.W.; Diamond, G.L.; Citra, M.; Barber, L.E. Toxicological Profile for Radon; Agency for Toxic Substances and Disease Registry: Atlanta, GA, USA, 2012. [Google Scholar]
- Yarmoshenko, I.V.; Zunic, Z.S.; McLaughlin, J.P.; Paridaens, J.; Kirdin, I.A.; Kelleher, K. Indoor radon long-term variation assessment. Radioactiv. Environm. 2005, 7, 726–730. [Google Scholar]
- Stanley, F.K.T.; Irvine, J.L.; Jacques, W.R.; Salgia, S.R.; Innes, D.G.; Winquist, B.D.; Torr, D.; Brenner, D.R.; Goodarzi, A.A. Radon exposure is rising steadily within the modern North American residential environment, and is increasingly uniform across seasons. Sci. Rep. 2019, 9, 18472. [Google Scholar] [CrossRef] [PubMed] [Green Version]
Figure 1.
(a) Indoor radon measurement locations for randomly selected buildings in Northern Croatia. (b) National map of indoor radon levels in Croatia [5,13].

Figure 2.
Radon measurements in office building (R1). (a) Basement-storage, (b) basement-laboratory, (c) office on 1st floor, (d) office on 3rd floor. For each floor, 4 sublots are shown within time and days of measurements: radon concentrations, indoor temperature, humidity and air pressure with arithmetic mean and geometric mean values shown in legend. Day tick marks 00:00 time.

Figure 3.
Radon measurements in family house (R9). (a) Basement-garage, (b) dining room. For each floor, 4 sublots are shown within time and days of measurements: radon concentrations, indoor temperature, humidity and air pressure with arithmetic mean and geometric mean values shown in legend. Day tick marks 00:00 time.

Figure 4.
Radon measurements in wine cellar house (R6). (a) Basement-storage, (b) dining storage. For each floor, 4 sublots are shown within time and days of measurements: radon concentrations, indoor temperature, humidity and air pressure with arithmetic mean and geometric mean values shown in legend. Day tick marks 00:00 time.

Figure 5.
(a) Radon AM and GM concentrations. (b) Normalized AM and GM radon concentrations.


Table 1.
Description of radon measurement locations for randomly selected buildings in Northern Croatia.
Table 1.
Description of radon measurement locations for randomly selected buildings in Northern Croatia.
| Location | Nr. | Sample | Type of Building | Floor | Type of Room | Ventilation | Occupation | Measurement Date Period | Start Time | Measurement Duration (hours) |
|---|---|---|---|---|---|---|---|---|---|---|
| Varaždin | R1 | a | Faculty building | Basement | Storage | None | Low | 20.07–24.07.18. | 09:57 | 99 |
| b | Basement | Laboratory | Manual | Occasional | 12.12–18.12.18. | 10:28 | 144 | |||
| c | 1st | Office | Manual | High | 13.07–29.07.19. | 07:32 | 386 | |||
| d | 3rd | Office | Manual | High | 07.09–13.09.18. | 09:22 | 146 | |||
| Goričan | R2 | a | Family house | Basement | Basement | Manual | Occasional | 30.07–02.08.18. | 15:37 | 68 |
| b | 1st | Bedroom | Manual | High | 03.08–09.08.18. | 11:18 | 143 | |||
| Beletinec | R3 | Family house | Basement | Basement/Storage | Manual | Low | 13.09–25.09.18. | 11:55 | 286 | |
| Beletinec | R4 | Wine cellar house | Basement | Basement/Storage | Manual/None | Low | 03.12–12.12.18. | 08:20 | 218 | |
| Štrukovec | R5 | a | Family house | Basement | Storage | Manual/None | Occasional | 29.01–12.02.19. | 14:08 | 354 |
| b | Ground floor | Hall | Manual | High | 12.02–19.02.19. | 08:10 | 168 | |||
| Štrigova | R6 | a | Wine cellar house | Basement | Basement/Storage | Manual | Occasional | 19.02–02.03.19. | 19:05 | 288 |
| b | Ground floor | Kitchen storage | Manual | High | 03.03–15.03.19. | 08:00 | 288 | |||
| Ivanec | R7 | Residential building | 1st | Bedroom | Manual | High | 25.03–01.04.19. | 21:34 | 164 | |
| Cargovec | R8 | a | Family house | Basement | Basement | Manual | Occasional | 03.04–07.04.19. | 19:02 | 96 |
| b | 1st | Dining hall | Manual | High | 07.04–11.04.19. | 20:47 | 96 | |||
| Donje Ladanje | R9 | a | Family house | Basement | Basement/Garage | Manual | Low | 20.04–24.04.19. | 16:31 | 96 |
| b | Ground floor | Living room | Manual | High | 24.04–28.04.19. | 17:01 | 96 | |||
| Ivanec | R10 | Wine cellar house | Basement | Storage | Manual | Occasional | 15.05–18.05.19. | 12:57 | 75 | |
| Čakovec | R11 | Residential building | Ground floor | Living room | Manual | High | 22.05–31.05.19. | 16:17 | 212 | |
| Vinica | R12 | Weekend cottage | Ground floor | Storage | Manual/None | Low | 01.06–13.06.19. | 14:17 | 285 | |
| Varaždin | R13 | Residential building | Ground floor | Living room | Manual | High | 05.07–09.07.19. | 12:12 | 96 | |
| Čakovec | R14 | Office building | Ground floor | Office | Mixed | High | 09.07–13.07.19. | 07:32 | 96 | |
| Nedelišće | R15 | Family house | Basement | Garage | Manual/None | Low | 13.07–18.07.19. | 08:18 | 126 |
Table 2.
Descriptive statistics (maximum, arithmetic mean (AM), standard deviation (SD), geometric mean (GM), geometric standard deviation (GSD)) of the radon indoor testing data with temperature, humidity and air pressure conditions (minimum, maximum and arithmetic mean) for randomly selected buildings in Northern Croatia. Simplified geological units of each location are shown in the last column [22].
| Loc. Nr. | Sample | Radon (Bq/m3) | Temperature (° C) | Humidity (%) | Pressure (kPa) | Simplified Geology | ||||||||||
|---|---|---|---|---|---|---|---|---|---|---|---|---|---|---|---|---|
| Max. | AM | SD | GM | GSD | Max | Min | AM | Max | Min | AM | Max | Min | AM | |||
| R1 | a | 509 | 286.1 | 99.0 | 267.8 | 1.46 | 20.9 | 20.3 | 20.6 | 71.1 | 67.0 | 69.3 | 99.44 | 98.71 | 99.02 | Holocene deposits |
| b | 142 | 62.6 | 24.4 | 57.3 | 1.56 | 25.3 | 23.7 | 24.3 | 33.4 | 30.0 | 31.9 | 100.60 | 99.46 | 99.77 | ||
| c | 154 | 52.2 | 39.8 | 31.5 | 3.59 | 30.6 | 24.9 | 27.3 | 61.9 | 46.0 | 53.8 | 99.74 | 97.46 | 98.73 | ||
| d | 251 | 57.1 | 47.8 | 34.3 | 3.56 | 27.4 | 24.8 | 26.0 | 63.6 | 46.2 | 57.7 | 99.70 | 98.47 | 99.29 | ||
| R2 | a | 111 | 40.2 | 22.2 | 31.5 | 2.48 | 27.3 | 25.9 | 26.6 | 73.7 | 58.0 | 69.1 | 99.71 | 99.34 | 99.50 | Holocene deposits |
| b | 86 | 20.8 | 17.0 | 11.8 | 3.82 | 30.2 | 27.9 | 28.9 | 74.5 | 58.1 | 62.9 | 99.69 | 99.34 | 99.51 | ||
| R3 | 207 | 70.0 | 50.1 | 68.8 | 1.99 | 24.4 | 21.4 | 23.6 | 47.0 | 32.0 | 39.0 | 101.06 | 98.44 | 99.69 | Neogene clastics | |
| R4 | 143 | 32.0 | 19.8 | 26.9 | 2.34 | 29.0 | 22.0 | 25.6 | 62.0 | 39.0 | 54.0 | 101.40 | 98.90 | 100.05 | ||
| R5 | a | 87 | 32.0 | 18.9 | 27.9 | 1.89 | 16.6 | 13.2 | 14.2 | 66.0 | 42.0 | 51.0 | 100.80 | 97.77 | 99.86 | Holocene deposits |
| b | 80 | 27.0 | 14.3 | 23.8 | 1.96 | 19.6 | 13.8 | 15.6 | 59.0 | 45.0 | 49.0 | 101.51 | 98.40 | 99.74 | ||
| R6 | a | 355 | 90.4 | 77.0 | 56.1 | 3.08 | 11.9 | 9.5 | 10.3 | 96.3 | 79.4 | 89.5 | 100.15 | 96.98 | 98.53 | Neogene clastics |
| b | 119 | 31.7 | 29.3 | 19.2 | 2.93 | 11.4 | 10.3 | 10.9 | 95.9 | 89.3 | 93.9 | 98.11 | 96.43 | 97.31 | ||
| R7 | 152 | 50.0 | 32.3 | 44.5 | 2.80 | 29.6 | 18.4 | 23.3 | 53.0 | 32.0 | 43.0 | 98.79 | 101.37 | 100.23 | Holocene deposits | |
| R8 | a | 126 | 47.0 | 30.2 | 38.3 | 2.02 | 18.0 | 14.0 | 15.8 | 65.0 | 45.0 | 61.0 | 98.94 | 98.23 | 98.63 | Holocene deposits |
| b | 92 | 31.0 | 20.8 | 27.1 | 2.00 | 21.8 | 16.2 | 18.0 | 66.0 | 57.0 | 62.0 | 99.45 | 98.41 | 98.77 | ||
| R9 | a | 123 | 46.2 | 27.8 | 35.1 | 2.54 | 24.6 | 21.0 | 22.5 | 52.2 | 39.9 | 44.3 | 100.51 | 98.57 | 99.21 | Neogene clastics |
| b | 72 | 21.7 | 15.2 | 13.0 | 4.02 | 23.6 | 21.0 | 22.8 | 62.1 | 55.8 | 59.4 | 99.41 | 98.61 | 99.08 | ||
| R10 | 56 | 18.0 | 10.5 | 15.5 | 1.75 | 15.2 | 13.2 | 14.0 | 81.0 | 72.0 | 75.0 | 98.11 | 98.80 | 98.52 | Neogene clastics | |
| R11 | 184 | 53.5 | 41.8 | 32.6 | 3.60 | 25.6 | 14.8 | 22.6 | 89.0 | 42.3 | 55.6 | 100.46 | 97.62 | 98.84 | Holocene deposits | |
| R12 | 232 | 56.0 | 47.8 | 55.3 | 2.13 | 26.8 | 18.3 | 23.6 | 86.9 | 44.0 | 53.0 | 98.34 | 100.60 | 99.53 | Triassic carbonates | |
| R13 | 247 | 57.0 | 45.3 | 55.5 | 2.32 | 33.0 | 23.8 | 27.4 | 79.0 | 37.0 | 63.0 | 99.43 | 100.52 | 99.67 | Holocene deposits | |
| R14 | 121 | 32.2 | 24.4 | 19.8 | 3.63 | 26.2 | 23.9 | 25.2 | 58.8 | 40.9 | 49.6 | 99.42 | 98.63 | 99.02 | Holocene deposits | |
| R15 | 137 | 47.0 | 32.5 | 43.8 | 2.25 | 26.6 | 24.8 | 25.6 | 59.0 | 46.0 | 51.0 | 99.59 | 99.19 | 99.38 | Holocene deposits | |
Table 3.
Average indoor radon concentration values measured in different building types and floors compared to overall results and national indoor radon levels in Croatia [5]. Radon concentrations for Northern Croatian region shown in Figure 1b [6] are set to be between 51–100 Bq/m3.
| Type of Building | AM (Bq/m3) | GM (Bq/m3) |
| Family house | 38.3 ± 24.9 | 32.1 ± 2.5 |
| Residential building | 53.5 ± 39.8 | 44.2 ± 2.6 |
| Wine cellar house/weekend cottage | 51.7 ± 37.8 | 40.7 ± 2.3 |
| Office building | 101.0 ± 48.7 | 87.0 ± 2.5 |
| Floor | ||
| Basement | 70.9 ± 38.8 | 61.2 ± 2.2 |
| Ground floor/1st floor | 42.5 ± 30.8 | 32.8 ± 2.9 |
| Overall | ||
| This study (Northern Croatia) | 54.9 ± 34.3 | 45.1 ± 2.6 |
| Croatia [5,6] | 68 ± 95 | 50.0 ± 2.3 |
© 2020 by the authors. Licensee MDPI, Basel, Switzerland. This article is an open access article distributed under the terms and conditions of the Creative Commons Attribution (CC BY) license (http://creativecommons.org/licenses/by/4.0/).
Share and Cite
MDPI and ACS Style
Ptiček Siročić, A.; Stanko, D.; Sakač, N.; Dogančić, D.; Trojko, T. Short-Term Measurement of Indoor Radon Concentration in Northern Croatia. Appl. Sci. 2020, 10, 2341. https://0-doi-org.brum.beds.ac.uk/10.3390/app10072341
AMA Style
Ptiček Siročić A, Stanko D, Sakač N, Dogančić D, Trojko T. Short-Term Measurement of Indoor Radon Concentration in Northern Croatia. Applied Sciences. 2020; 10(7):2341. https://0-doi-org.brum.beds.ac.uk/10.3390/app10072341
Chicago/Turabian StylePtiček Siročić, Anita, Davor Stanko, Nikola Sakač, Dragana Dogančić, and Tomislav Trojko. 2020. "Short-Term Measurement of Indoor Radon Concentration in Northern Croatia" Applied Sciences 10, no. 7: 2341. https://0-doi-org.brum.beds.ac.uk/10.3390/app10072341
Note that from the first issue of 2016, this journal uses article numbers instead of page numbers. See further details here.